Article

Land Subsidence Assessment for Wind Turbine Location in the South-Western Part of Madagascar

by
Dariusz Knez
* and
Herimitsinjo Rajaoalison
Faculty of Drilling, Oil and Gas, AGH University of Science and Technology, 30-059 Krakow, Poland
*
Author to whom correspondence should be addressed.
Energies 2022, 15(13), 4878; https://doi.org/10.3390/en15134878
Submission received: 27 April 2022 / Revised: 27 June 2022 / Accepted: 30 June 2022 / Published: 2 July 2022
(This article belongs to the Special Issue Fluid Flow and Heat Transfer Analysis in Industrial Applications)

Abstract

:
Finding a suitable location is a key factor for long-term investment in wind turbine energy. It includes understanding the area of interest, such as the subsidence of the land. Land subsidence is a gradual decrease in the surface of the Earth due to natural and/or induced causes. It can cause damage, such as settlement problems in the ground near infrastructure including buildings and wind turbines, thus not being a suitable place for long-term investment. Here, we show a case study of land subsidence prediction and assessment of the Atsimo Andrefana region, the great south-western part of Madagascar, using theoretical simulation and satellite images from the Sentinel-1 mission using D-InSAR method. The predicted land subsidence related to the depletion of groundwater reservoirs in the Atsimo Andrefana region is around 12 mm. We found ~5 mm of subsidence related to the growing city of Toliary and with an average subsidence of 124 mm and the highest record of 167 mm in the most southern part of the region for a period of 6 months. The spatial distribution of land subsidence allows us to choose the ideal location for wind turbine settlement, where land subsidence is not that severe, i.e., the areas with subsidence relatively low of equal or less than 10 mm within 6 months of observation, based on the processed data. Such results are essential for future environmentally friendly investments in the affected region, as the demand for green energy will always grow.

1. Introduction

The elevation of the ground gradually decreases as the underground fluid is pumped out. On the one hand, human activities, such as depletion of groundwater, underground mining, and oil and gas extraction, can cause this subsidence [1,2,3,4,5,6]. On the other hand, natural causes such as compaction, sinkholes, and thawing permafrost can also induce subsidence of the land [7,8]. The weight of the overburden does not change when the fluid is produced from a reservoir; however, the drop in pore pressure increases the vertical effective stress acting on the solid matrix, leading to compaction. The degree of the resulting compaction depends on the compressibility of the rock and the boundary conditions. It is important to take into account the mechanical properties of the rock in situ [4,9,10,11,12]. There are differences between the subsidence of the land near oil and gas fields and those occurring in the multiaquifer system. Generally, the aquifer system is shallower and has a larger extent than the oil/gas field. In addition, the order of magnitude of compressibility of clay is two more than the magnitude of sand at shallow depth [13,14,15,16]. In addition, the clay and silty fractions within the system are essential for the subsidence of groundwater. Land subsidence can be monitored in different ways, such as using Global Positioning System (GPS), leveling, extensometer, and satellite data images. Some simulations can also be done using input from observational data. These methods are used interchangeably based on the goal and characteristics of the area of interest, such as geology, spatial dispersion, and accessibility. For example, the use of an extensometer combined with satellite images was implemented to study land subsidence in Houston, Texas, where a large-scale subsidence of 2 to 4 cm/year was monitored using time series of satellite radar images and of 3 cm/year using extensometers [17]. In the case of large areas associated with tectonic activities, such as faults or volcanoes, the use of GPS and Interferometric Synthetic Aperture Radar (InSAR) images is very effective, as in the case of Lander earthquakes and ground deformation over Houston-Galveston [18,19]. However, land subsidence can also be predicted using the Geertsma prediction model, especially in relatively calm areas, and can be predicted down to the millimeter scale [1]. The geology of the studied area greatly affects the amount of observed subsidence, and the historical events of worldwide scientific significance show such an impact. The case of the Goose Creek oil field was among the first historical cases studied, in which the Gaillard Peninsula parcel was submerged by water that exceeded a meter for more than 10 km2 [20]. In addition, groundwater extraction near high-density populated areas shows some significant observed subsidence, especially the area characterized by unconsolidated geological features, such as alluvial, lacustrine, and sediments. The Wairakei subsidence in New Zealand related to geothermal water production and the Joaquin Valley in the USA were perfect examples of this type, where 14 m of subsidence and a submerged area of 13,000 km2 were recorded, respectively [21,22,23]. Furthermore, construction loads such as compressible settlement, natural consolidation, and tectonic processes together activate the subsidence process, and the best example is the rapid increase in industry, transportation, and urban development in Jakarta from 1982 to 1997, with a subsidence of 20 to 200 cm [24,25].
The world is moving gradually from conventional sources of energy, such as fossil fuels, to the use of renewable energy sources, primarily due to the negative effects on the environment, such as pollution of the atmosphere. One of them, which has developed very rapidly, is wind energy, that is, the conversion of wind energy into electricity, and is considered a clean and environmentally friendly source of energy [26]. Before installing the wind power plant, extensive studies must be performed to find the suitable location for the Wind Observation Station (WOS) in the area of interest. The criteria for WOS, known as the Analytic Hierarchy Process (AHP), have been developed by Thomas L. Saaty et al., 2000 which includes multicriteria decision making (MCDM) [27], composed of planning [28,29], resource evaluation [30], performance measurement [31], allocated resources [32], best policy after the alternative setting [33], and priority setting [34]. Several studies using the AHP method, such as finding the right location of a restaurant in the city of Taipei, in which Tzeng et al., 2002 established 11 criteria to evaluate four different alternatives [35], the application of AHP to agriculture in developing countries by establishing five criteria in five alternative locations [32], and the use of AHP and programming for decision making to select the optimal nuclear fuel scenario [36]. The AHP method is popular and is often used not only in WOS, but also in other fields, due to its tangible and intangible criteria that are involved with setting it up. One of the most important aspects in WOS site selection is topography evaluation, in which accurate measurement must be performed. Among the topographic criteria, settlement and structure are involved, including studying subsidence on the land of the area of concern [26]. Thus, we conducted the subsidence evaluation in the south-west part of Madagascar to find a stable location of WOS in that area.
Land subsidence is a global disaster and conventional geodesics techniques are inefficient for large-scale and serious monitoring of land subsidence. Comparison of the phase information between two complex SAR images can be used to quantify ground deformation from natural and induced sources, such as earthquakes, land subsidence from groundwater, or hydrocarbon extractions. It can also be used to monitor passive ground deformation related to growing cities. The first image is recorded prior to the occurrence of deformation and the second is recorded afterwards. This is done using differential SAR interferometry (D-InSAR). D-InSAR provides pixel-by-pixel deformation images in a kilometer-wide area. Gabriel and colleagues presented in 1989 the first D-InSAR mapping report for small elevation changes in large areas [37]. Since then, its potential has been widely applied and studied in the field of ground deformation monitoring [38,39,40,41]. For example, in cooperation with the University of Delft and a Dutch company, a D-InSAR demonstration project was carried out in 2001 with 25 ERS-1/2 scene images. The main results show that D-InSAR is sufficient to measure urban subsidence between 1995 and 1996. Compared to leveling and GPS survey, D-InSAR methods are more cost-effective and accurate [42]. However, D-InSAR technology is not widely used compared to the leveling method. The main reason is the noise produced and systemic distortion generated during data collection and processing, but several studies have still shown that land subsidence measured by D-InSAR and the results of the leveling method agree [43,44]. However, noise is generated by the decorrelation of two or more images taken at different times, and the spatial and temporal changes in the atmosphere make it difficult to distinguish between artifacts and ground deformation. Although the errors in differential SAR interference are inevitable, their effect can be reduced. In general, there are two methods for reducing those errors: stacking and calibration. It was proposed that stacking methods be used to correct the tropospheric phase delay by calculating the average of several independent interferograms based on the assumption that the noise of different interferograms is independent [39,45,46]. Another method of avoiding the contribution of the atmosphere phase is the permanent scattering technique (Ferretti et al., 2000). These error correction methods do not use ground data. Calibration removes part of the artefacts by using data from other sources, such as meteorological records and/or GPS estimates of total zenith delay (ZND) during SAR image acquisitions, and/or some additional data, such as leveling data and DEM data, have been introduced into D-InSAR data processing [47,48,49].Without distinguishing the source of land subsidence in the great south-west part of Madagascar, it will be predicted and assessed using the Geertsma model and InSAR data. The radar images from the Sentinel mission have been used for this case. The purpose of this study is then to predict the subsidence of the land on a regional scale using the Geertsma model and map such a deformation using InSAR data to find the suitable location for the wind power plant based on the perspectives of subsidence, as this technology requires a stable area where subsidence rarely occurs and is considered relatively stable.

2. Materials and Methods

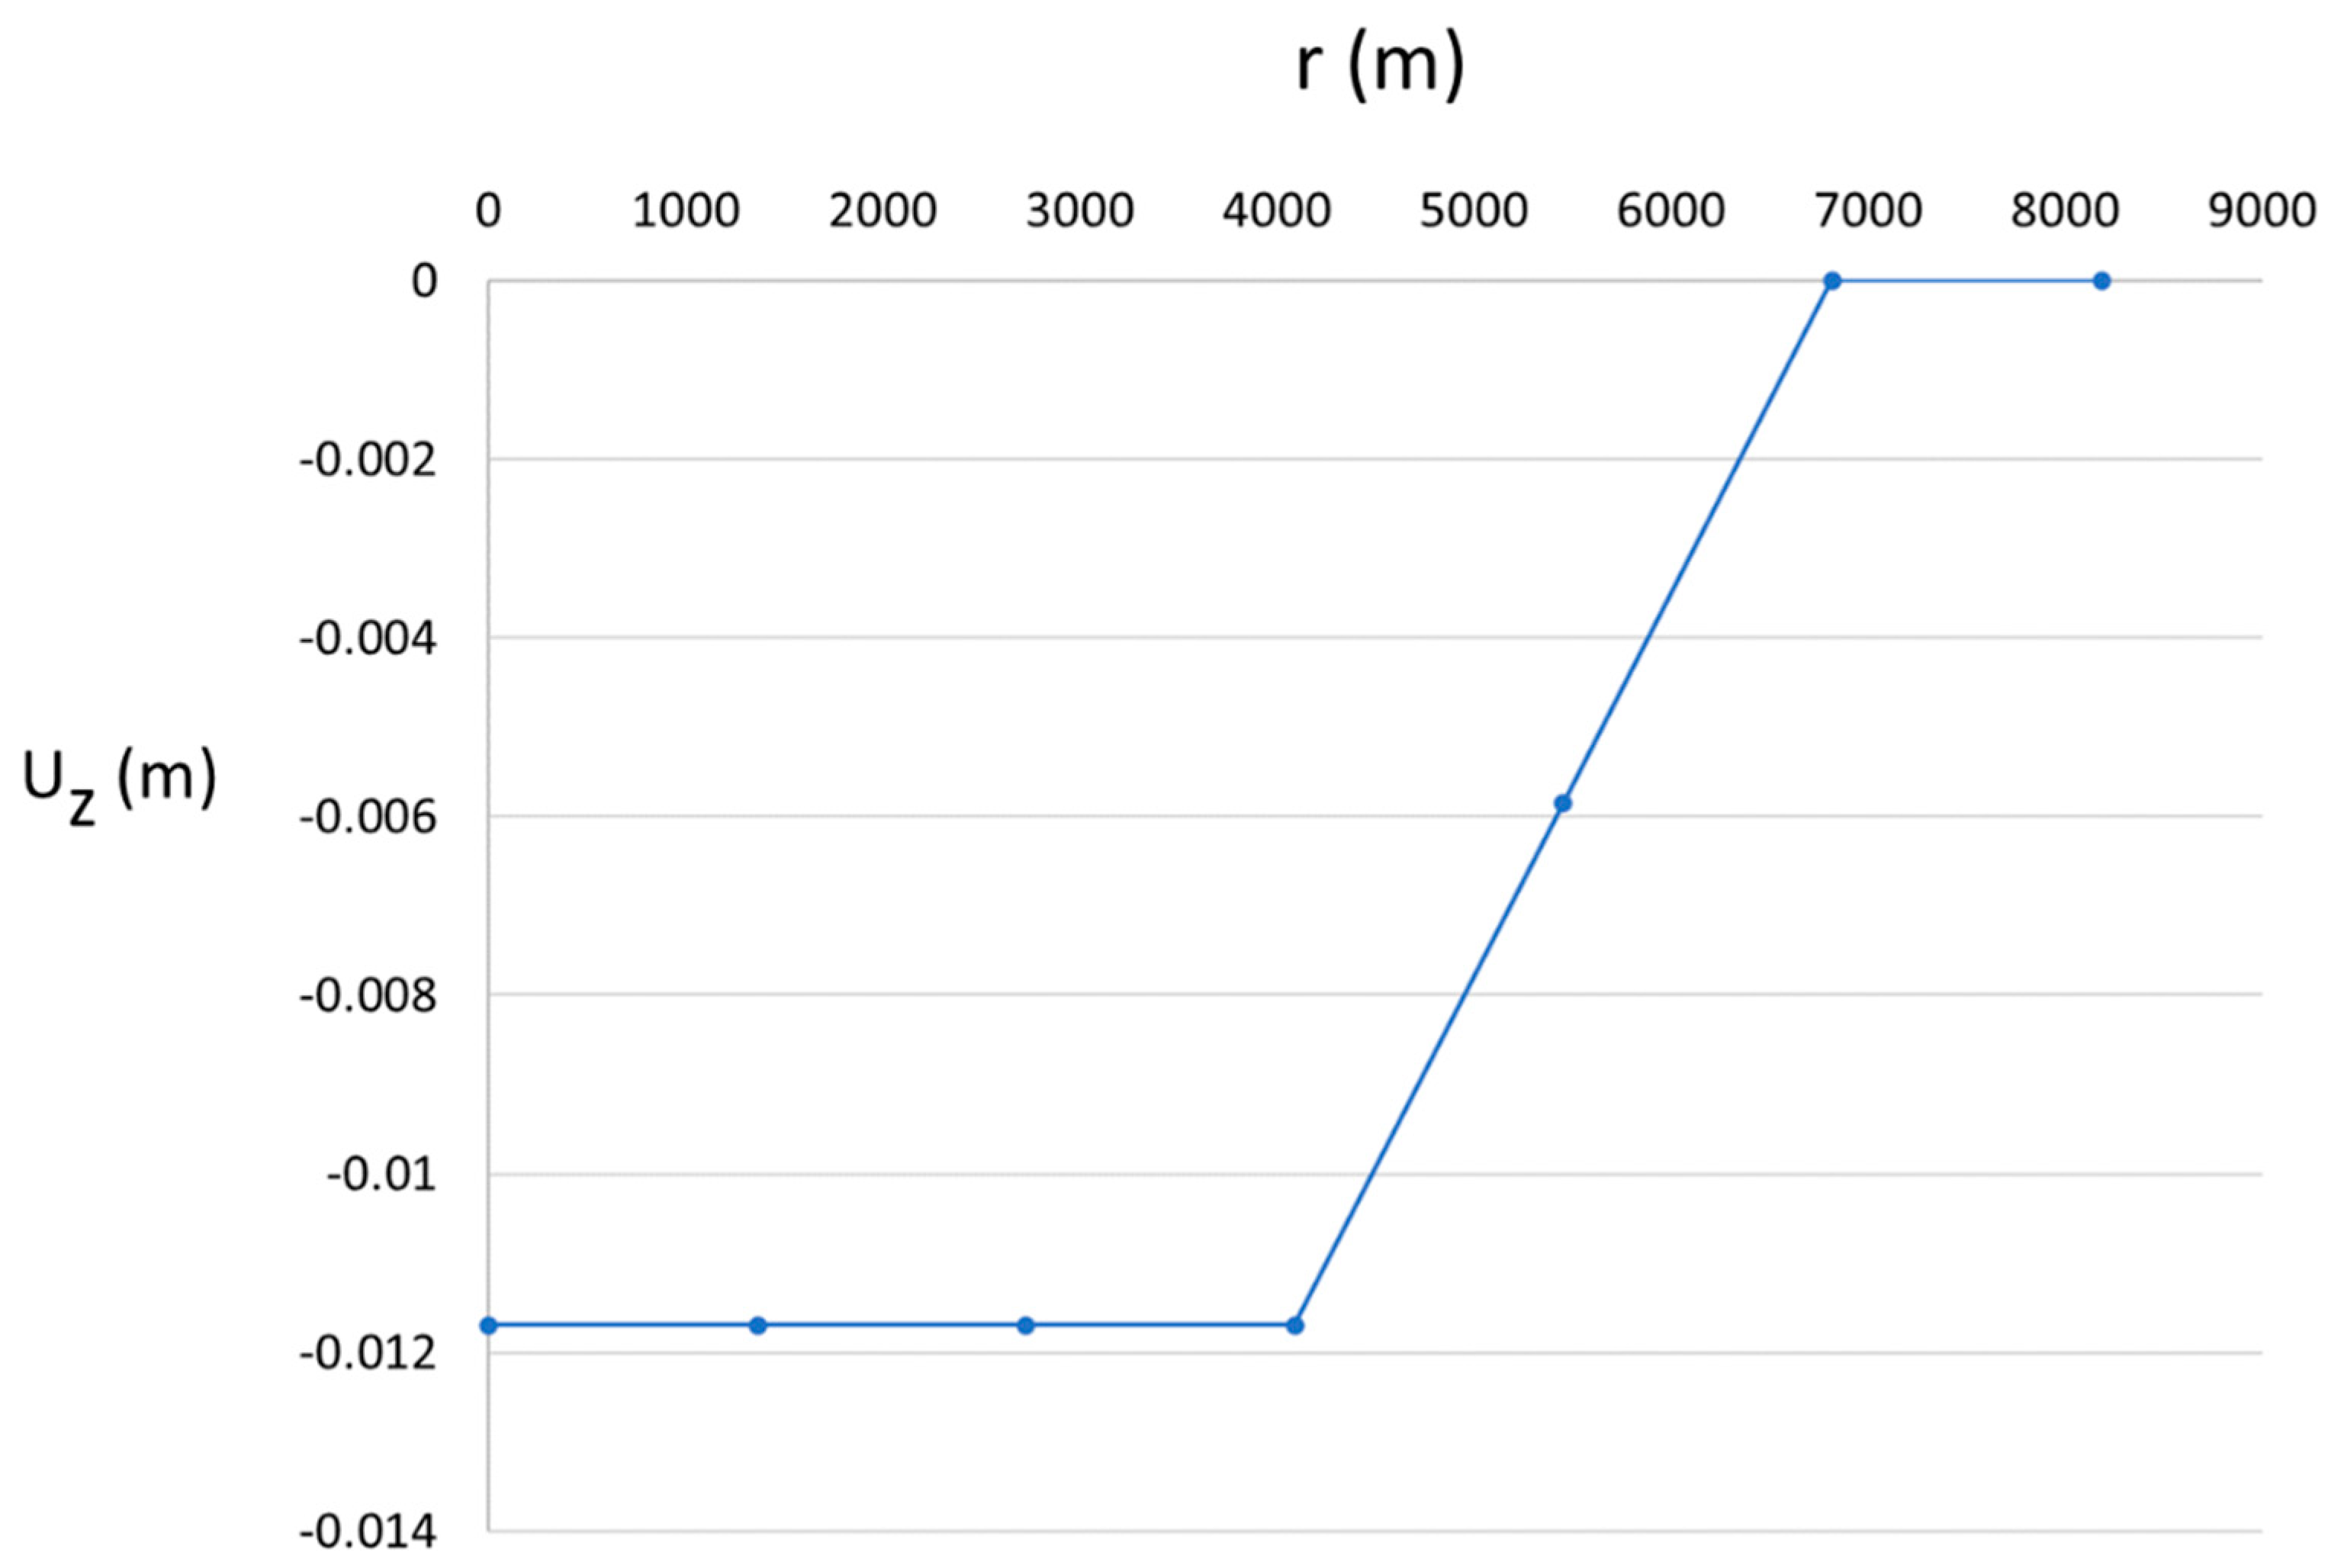
2.1. Mechanism of Land Subsidence

Land subsidence is a process that depends on fluid production, reservoir geometry, geology, boundary conditions, geomechanical parameters of the rock, and fluid properties. The pore pressure, effective vertical and horizontal stresses control the total geostatic load applied to the aquifer [9,10,24]. The grain-to-grain transition generates stress transfer from the fluid to the solid phase as result of fluid withdrawal. Effective stress increases within formation and, therefore, compaction [5,50]. Cumulative compaction of the subsurface layers results in subsidence and exposes on the surface. Karl Terzaghi introduced the principle of effective stress in 1925 (Equation (1)) [51,52]. It was assumed that the effective stress σ′ can be calculated simply by subtracting the pore pressure from the total stress:
σ = σ p
where σ is the total stress and p is the pore pressure. Based on the Geertsma model for a cylindrical reservoir, using the dimensionless ratios ρ = r/R and η = D/R, the vertical displacement uz, due to the uniform pressure drop Δp, is given in Equation (2) [1]:
u z ( r , 0 ) = 2 c m ( 1 ν ) Δ pHA ( ρ ,   η )
c m = 1 E ( 1 + ν ) ( 1 2 ν ) 1 ν
A ( ρ ,   η ) = R 0 J 1 ( α R ) J 0 ( α r ) e D α d α
where cm is the uniaxial compaction coefficient, ∆p is the pressure drop in the reservoir (Pa), D is the depth of burial (m), R is the reservoir radius (m), H is the reservoir height (m), ν is the Poisson’s ratio, E is Young’s modulus (Pa), r is theradial distance from the vertical axis (m), J0 and J1 are the zero and first order of the Bessel function, respectively, ρ is the ratio between the depth of burial and the reservoir radius, and η is the ratio between the distance from the vertical axis and the reservoir radius.

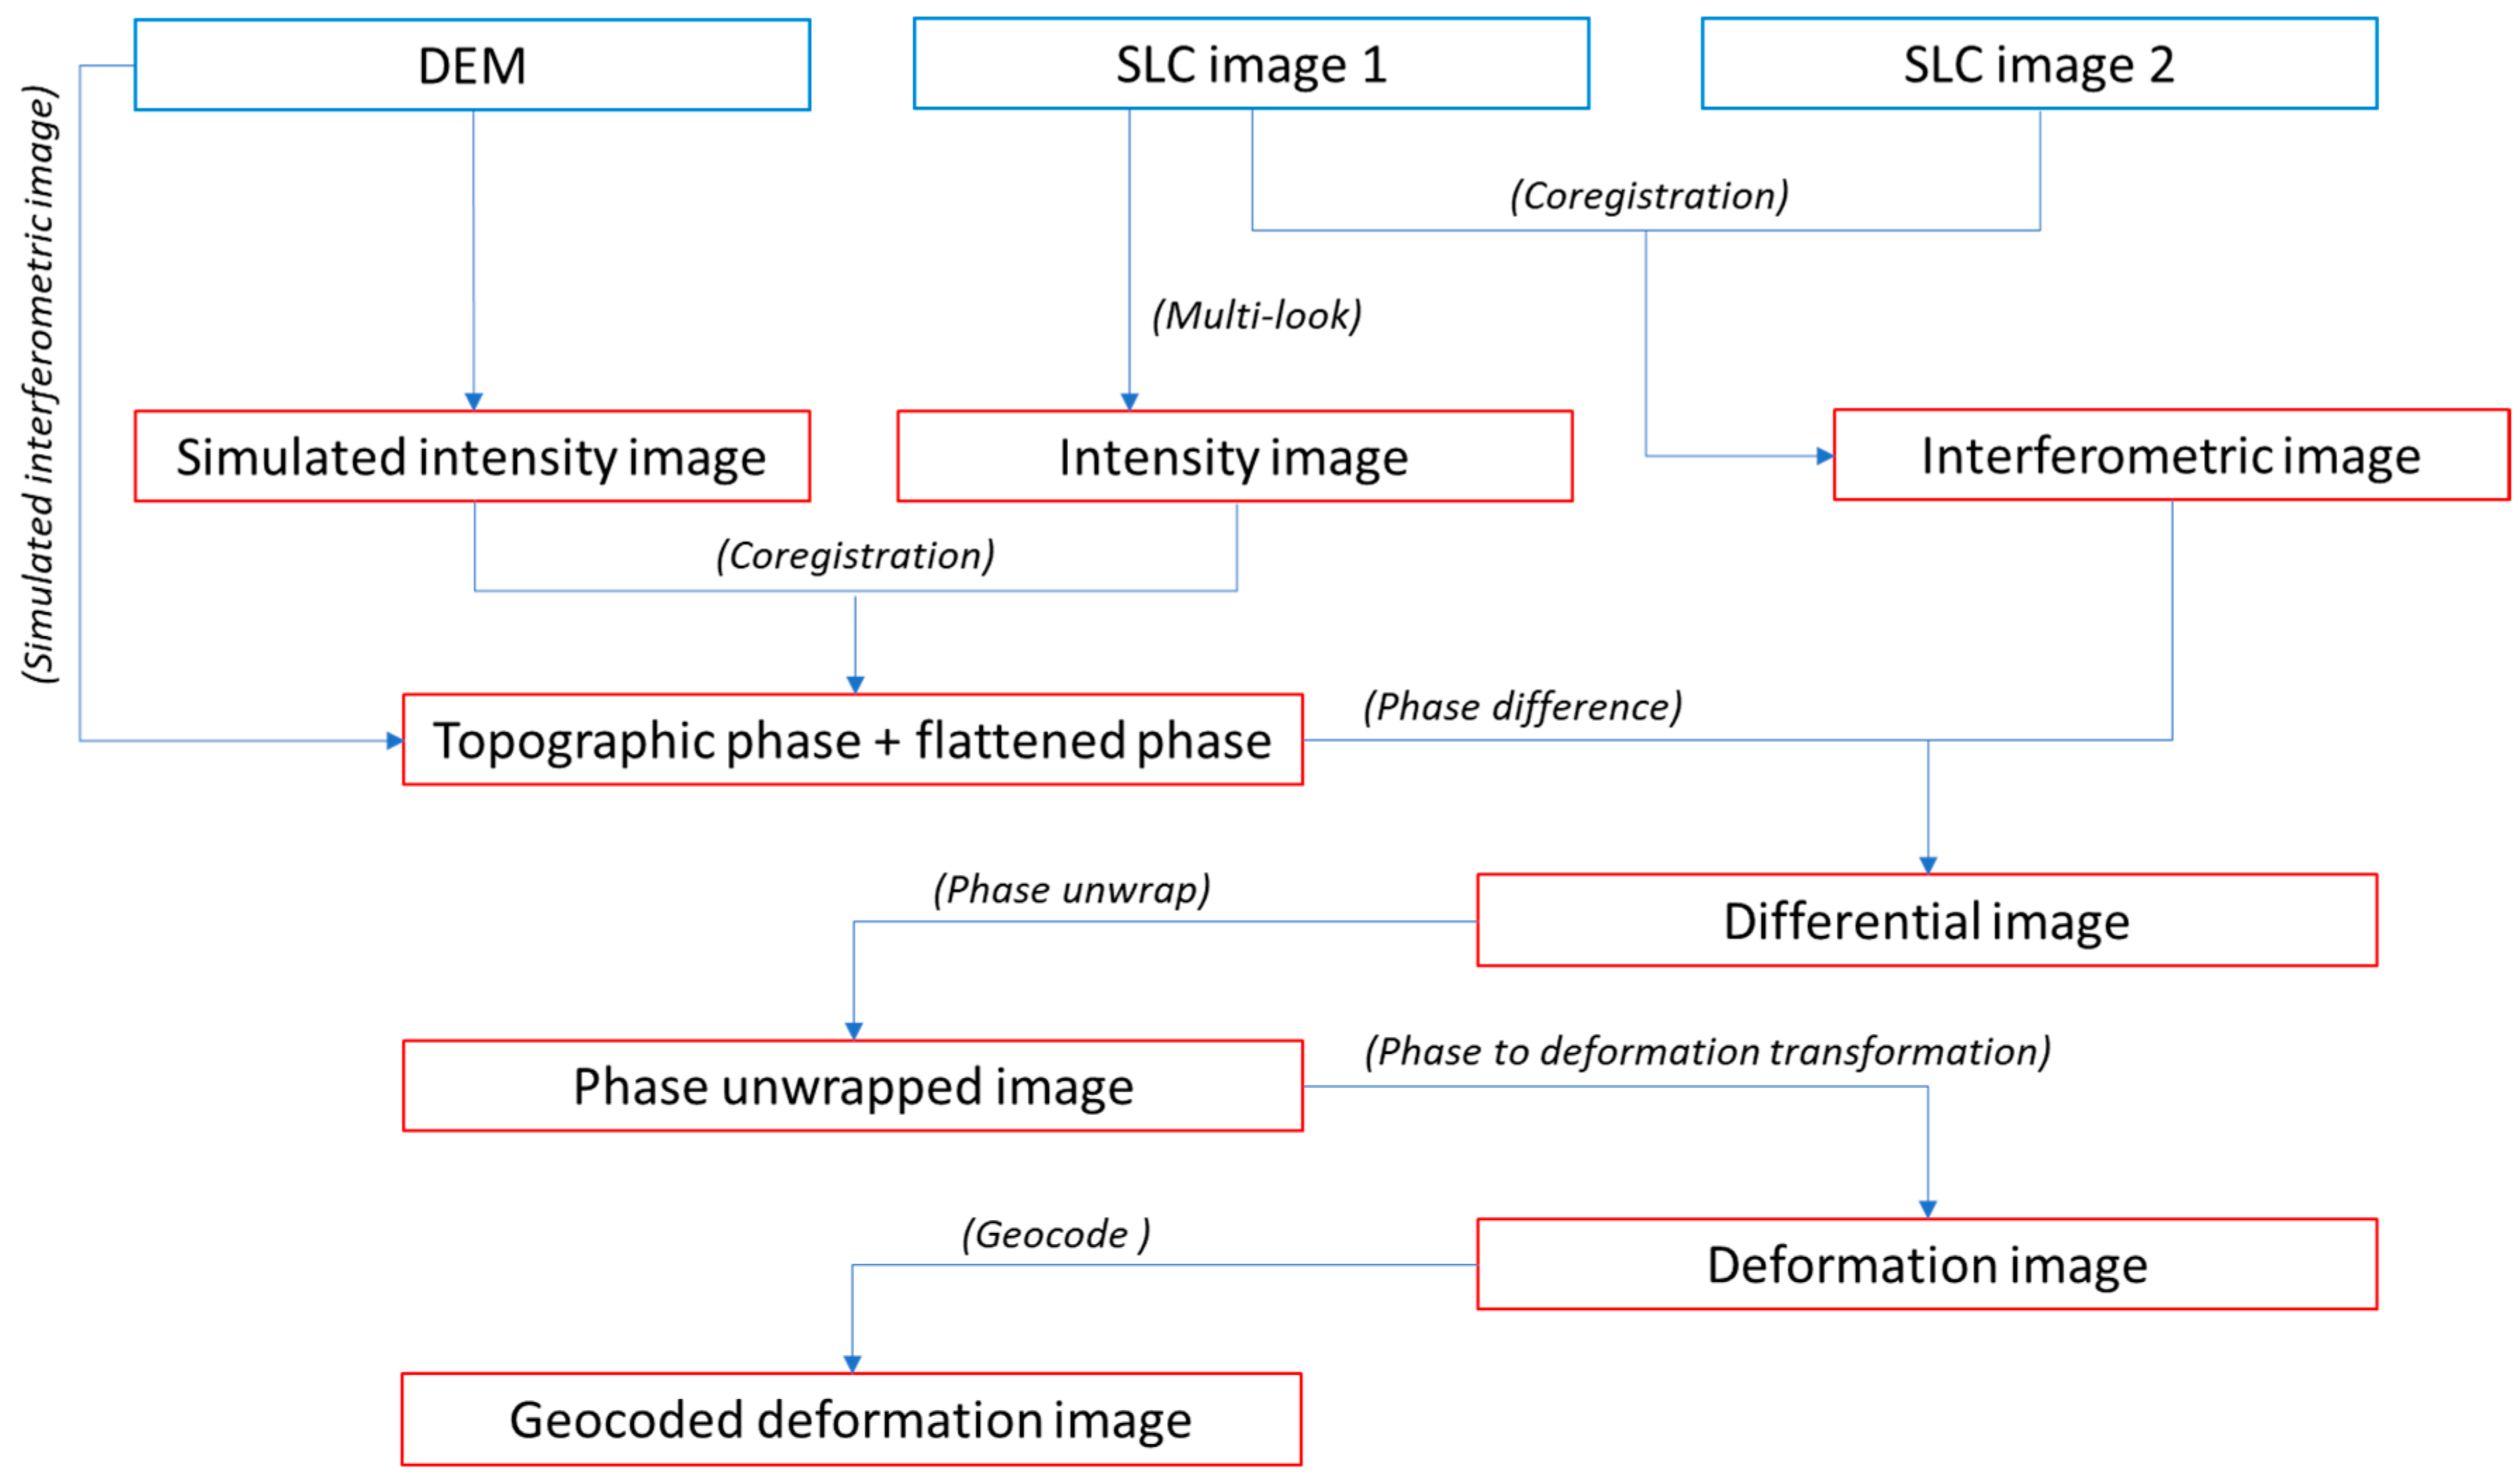
2.2. Land Deformation Monitoring Using SAR Images

Land subsidence has been a global disastrous problem and the conventional geodetic technique is highly inefficient for monitoring large-scale land deformation. However, the new and developed radar interferometry technique provides an effective method that can be applied to large coverage areas, with high spatial and temporal resolution for monitoring. The application of satellite images for land subsidence monitoring is increasingly being used lately due to freely available data from the Sentinel mission. The deformation of the affected area is assessed using the differential InSAR method using two SAR images at two different acquisition times in the same area [44,53,54].
D-InSAR is one of the most effective methods for studying land deformation. Conventional D-InSAR methods, including two-pass (Figure 1), three-pass, and four-pass methods, have a good effect on land deformation monitoring, especially deformation caused by earthquake or large tectonic movement with centimeter accuracy in the direction of the radar line of sight, and accuracy can even scale to millimeters in the case of settlement measurement [41]. A radar interferogram is being constructed after the precise registration and interferometry processing of two SLC images. The parameter estimation problem can be solved by calculating the interferogram phase, in which the D-InSAR method is based on the relationship between the observed phase and the impacted parameters, so a model will be constructed and the unknown parameters will be estimated using the known observation values [41,54].
The process of lining two images up is called co-registration. The two images are called master and slave images, which represent and fit the same images of the same target. Resampling, which consists of scaling and rotating, is the process of shifting and scaling the slave image to fit as closely as possible to the master image during data processing, and in SNAP, it is often done based on orbits and DEM. This process is done by calculating the offset between the two images. Generally, there are three different ways to calculate this offset, including visual inspection (identification of features), fast Fourier transformation (FFT) in the frequency domain, or coherence-based statistical estimation from a co-registration of 400 points. For SAR images, this resampling can be done by linear fit between two estimated offsets, matrix resampling, or wrapping horizontal and vertical through the grid [55].
Here, we use the Sentinel-1A, wide swarth (IW) and Level-1 Single Look Complex (SLC) products, with a spatial resolution of 5 m × 20 m area on the ground, from the Sentinel-1 mission. Sentinel-1 is one of five missions developed by the European Space Agency (ESA) for the Copernicus initiative. Sentinel-1A was launched on 3 April 2014, and Sentinel-1B was launched on 25 April 2016. These two identical radar imaging satellites provide images of the Earth’s surface at all times, day and night. The datasets were acquired based on availability on the website. Multiple processing steps were carried out using Sentinel-1 Toolbox in Sentinel Application Platform (SNAP) programming [56,57].
The interferogram phases subtracted by a Digital Elevation Model (DEM) from the Shuttle Radar Topography Mission (SRTM 1Sec HGT), with a spatial resolution of 10 × 10 m, were used to estimate the phase from the topography, while the phase from the decorrelation and atmospheric effect is neglected and ignored, as there is no better way to resolve it. The radar signal emitted by the shuttle has a wavelength of 5.6 cm, called the C-band [58]. However, the coherence is high when the time interval between two acquired images is short. In addition, it is highly dependent on land cover, and therefore, can be used for land cover classification, for example, the case of Okara in Pakistan, with an accuracy of 80% [59]. In our case, the time interval is a 6-month difference, which is suitable for such an application. The two SAR images were acquired on 9 September 2021 and 21 March 2022 (Table 1).
The D-InSAR technique is a method that uses the phase information of a radar carrier between two observation times. In the repeat pass mode, if the land deformation occurred during the capture of the two images, the interferometric fringes generated by these two images mainly include some phase information as follows [44,54,60]:
Φ = Φ topo + Φ disp + Φ atmo + Φ flat + Φ noise
where Φtopo is the topographic phase, Φdisp is the phase change due to movement of the pixel in the satellite line of sight direction, Φatmo is the phase equivalent of the difference in delay between passes, Φflat is the phase corresponding to the reference plane, and Φnoise is the noise term due to variability in scattering of the pixel, thermal noise, and coregistration errors. Thus, the D-InSAR technique obtains Φdisp, neglects noise and atmo, and removes Φtopo and Φflat.

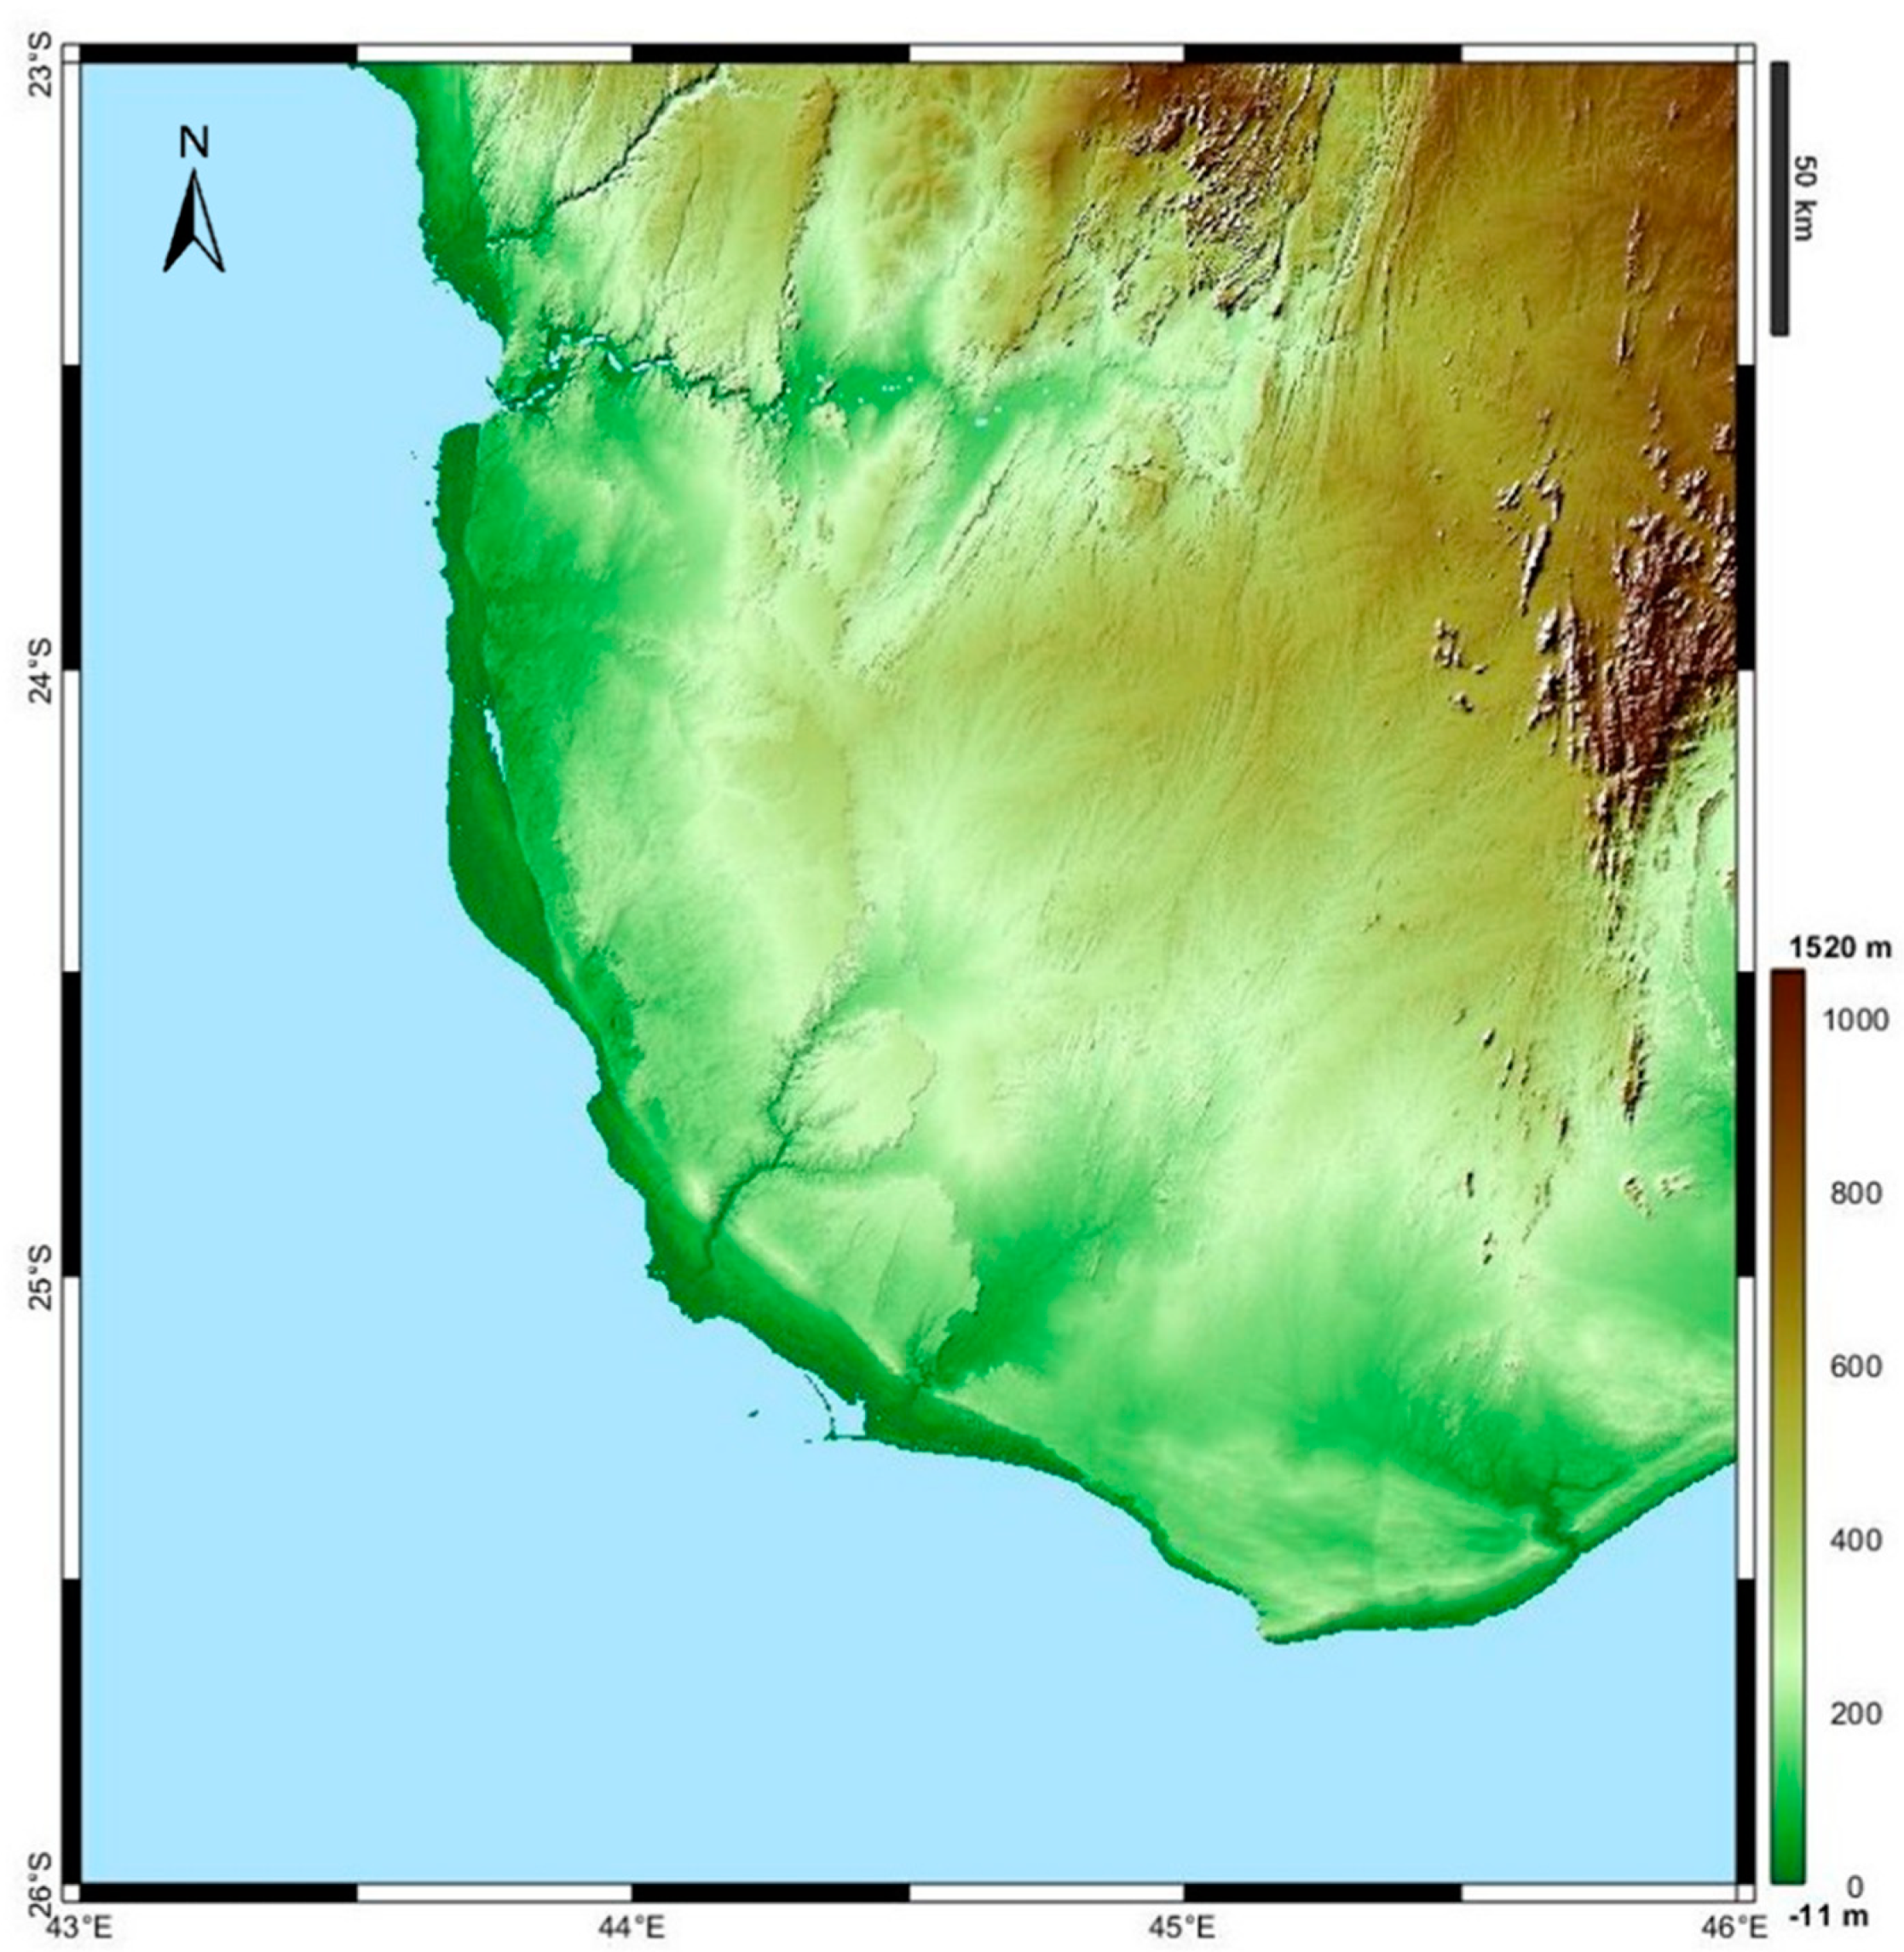
3. Geological Setting
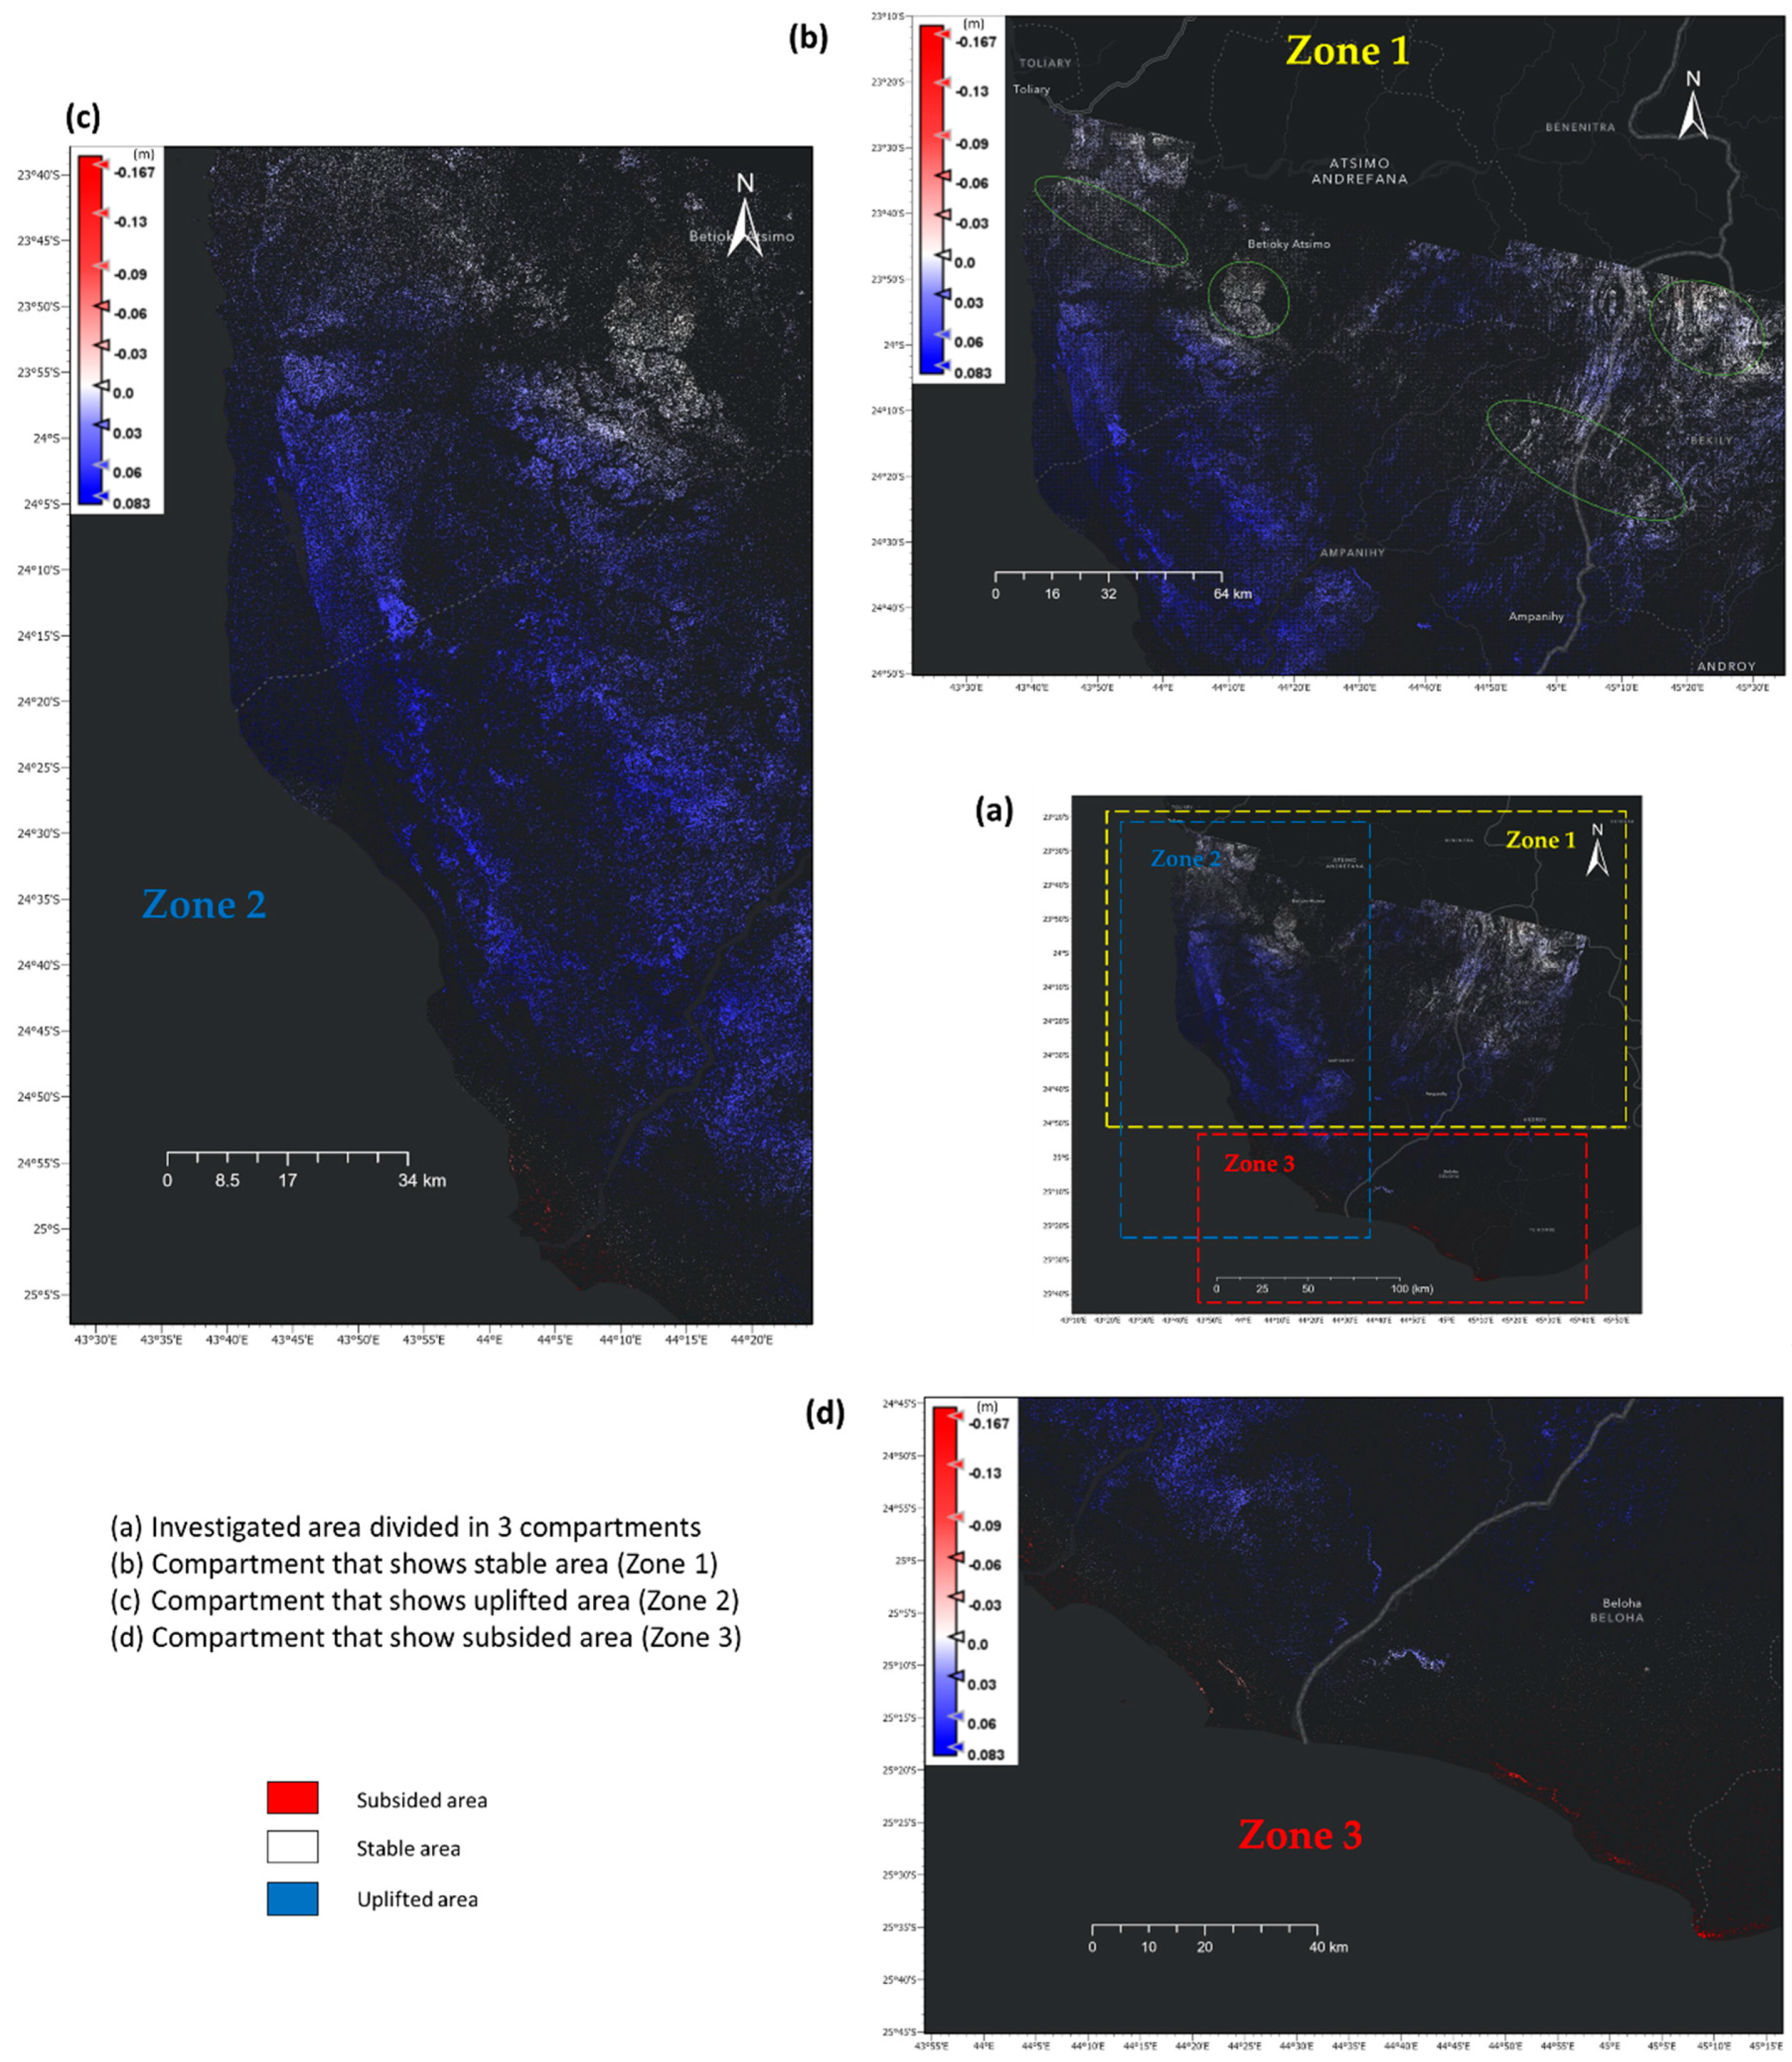
The area of interest is located in the great south-west of Madagascar, known as the Atsimo Andrefana Region, including the Betioky and Ampanihy districts. It is located 55 km south of Toliary city and south of the Onilahy River (Figure 2). Two distinct climatic seasons characterize this area: cool and dry from May to October with trade winds from the southeast and a rainy season from November to April with monsoons from the northwest. The annual rainfall of the region is 400 mm/year, reaching 600 mm/year for the eastern part. The geology and hydrogeology of this region is dominated by sedimentary formation, in which aquifer systems are composed of basement aquifers, sedimentary aquifers, or karstic aquifers [61,62]. Two-thirds of the area of interest, the western part, is characterized by an unconsolidated to semi-consolidated sedimentary sandstone formation, formed during the Tertiary to Quaternary period, including clay, clay loam, mud, silt, mar, dolomite, and limestone. The eastern part is dominated by the precambrian basement, composed of metamorphic formations, mainly migmatites, gneisses, liptinite, amphibolite, micaschist, cipolin, quartzites, and intercalated with igneous formations, such as granite, syenite, gabbro, and in the middle, it is characterized by sedimentary carboniferous Jurassic [63,64].
The digital elevation model of the area of interest is presented in Figure 3. The topography of the Atsimo Andrefana region is mainly divided into three categories: the low area, which is composed of mainly sandstone formations in the western part, ranging from 0 to 300 m above sea level, the middle range from 300 to 600 m, which is the Carboniferous Jurassic sedimentary in the middle, and the high land in the eastern part, ranging from 600 to 1500 m, which represents the Precambrian basement.

4. Results

For the prediction-based calculation of land subsidence, the deep aquifer of the region is characterized by a mixture of limestone with nummilites and calcareous sandstones. Their dynamic elastic modulus and Poisson’s ratio value range from 3 × 10¹⁰ to 20 × 1010 Pa and 0.20 to 0.30, respectively [65]. These two mechanical parameters influence the deformation of the rock [54]. The reservoir has a radius of 15 km and a thickness of 300 m. The average values of the Poisson ratio and the Young modulus of formation are υ = 0.25 and E = 11 × 1010 Pa, respectively. These values are summarized in Table 2 and are used as input in (Equation (2)).
The maximum pressure drop was assumed to be 3.43 × 10⁶ Pa. Therefore, the vertical displacement uz versus the radial distance from the axis is shown in Figure 4, where the maximum subsidence is nearly equal to 12 mm.
After using the Copernicus Sentinel-1 radar data acquired in September 2021 and March 2022, we were able to measure the displacement of the great south-western part of Madagascar (Figure 5). The result shows three categories of land deformation that occurred in the area. The relatively low-subsided area that is closest to the city of Toliary, one of the six cities in Madagascar, which is the capital of the Atsimo-Andrefana region and Bekily. The three places that have relatively low subsidence include the area surrounding of Toliary, the west of Betioky Atsimo, and the north of Ampanihy. A relatively low subsidence is concentrated in the city, so we assume that this subsidence could be related to the growth of the city and the population and could be related to the demand for groundwater resources. The area that shows relatively low subsidence can be considered stable on the basis of the recorded subsidence and is shown by the green line in Figure 5b. The second category consists of the uplifted area that occupies most of the places in the region. This uplifted area is located to the south of Betioky Atsimo and to the west of Ampanihy city and is shown in Zone 2 in Figure 5c. The third type is characterized by the area with the most subsided area of the region, located in the southern part of the region, while the southern part of Beloha and is represented in Zone 3 in Figure 5d.

5. Discussion

Figure 4 shows the possible vertical displacement on the surface above the aquifer system located in the Atsimo Andrefana region. The predicted vertical displacement from groundwater reservoir depletion varies from center to edge, where the maximum possible subsidence is located just above the reservoir, and decreases to 0 at the distance from the center. The possible subsidence of the area can extend to 7000 m away from the center, in which a constant rate of 12 mm is observed between 0 and 4000 m, inversely proportional between the subsidence and the distance from the center from 4000 to 7000 m, and no observed subsidence after 7000 m. The resulting subsidence range in the present work is smaller compared to the danger cases discussed previously [20,66]. In the present work, the Geertsma method is used as a reference to the expected subsidence related to groundwater reservoir depletion, and here, we combined this prediction with the use of satellite images [46]. Due to the complex geologic conditions of the area of interest, we can expect uniformly widespread subsidence, and the model from the Geertsma method does not show any particular site and is very limited. However, the result from the SAR images shows a higher accuracy of subsidence and can be used to locate the stable location according to the objective of the study.
Figure 5 presents the spatial distribution of the subsidence of the land in the Atsimo Andrefana region from SAR images. The deformation of the land that occurred within these record dates, whether due to natural or induced causes, was recorded and monitored. Therefore, the cause of the subsidence of the land in Figure 5 cannot be specified; however, it shows the actual deformation of the area concerned. However, the subsidence of ground that occurred around a populated area is generally related to the growth of the city. The subsidence of the land in the area is low to moderate, with an average subsidence of 124 mm per six months and the highest record of 167 mm per six months in the most southern part of the region, precisely in the south of Beloha. The most subsided area in the region, close to the southernmost coast, belongs to the area region where the drought season is very severe and the area itself is characterized by sedimentary rocks and sands that is favorable to compaction, and therefore, is vulnerable to subsidence (Figure 5d). Furthermore, this area with the highest subsidence is close to the shore, so the tides could affect the observed subsidence of the area. It is important to emphasize that the subsidence-based prediction is for a small area, while the InSAR-based method can cover a large area. Furthermore, the geology of the south-west part is complex, and hence, the difference between results from the prediction and the InSAR method. Based on the result of the InSAR method, the most relatively stable area in the region that could be a potential wind turbine location is the area surrounded by the green lines in Zone 1 in Figure 5b. These areas have a subsidence less than 10 mm within 6 months, which can be considered as relatively low compared to the known subsidence cases worldwide, previously mentioned in the introduction. In addition, these stables areas are close to cities, which is fortuitous, especially when choosing the appropriate location. Some area in the region shows no record of subsidence nor uplift, due to temporal decorrelation, and is already removed during the data processing. It happens when the coherence between the two images is very low and cannot be considered as a deformation. The uplifted area can be explained as a result of the development of the NE–SW impact sliding basins, which are dominated by the E–W expansion in Gondwana and were subsequently filled with Karoo deposits [67]. This particular area is characterized by a strike-slip fault that could greatly affect the observed ground deformation in the area (Zone 3 in Figure 5). The recorded uplift ranges from 42 to 83 mm for a period of 6 months, as shown in Figure 5c.
As mentioned in the Introduction, this study is part of the observation of the multiple criteria for the best selection of the wind observation station location, and the conclusion is based only on the subsidence. Therefore, this study alone cannot be used to define the suitable place, but the ideal based on the deformation of the topographic surface of the area.

6. Conclusions

One of the criteria for choosing ground settlement for the wind turbine location includes a stable place where the equipment can be settled for years. Assessing land subsidence is one way to assess surface deformation. This article discussed the prediction of subsidence related to groundwater reservoir depletion of the Atsimo Andrefana region in Madagascar using the Geertsma model and SAR images using D-InSAR method. The prediction-based model is used for a specific area, whereas the remote sensing-based model deals with a large area. The reservoir can be compacted when the amount of groundwater withdrawal exceeds the natural recharge, and this could be one of the reasons for this subsidence. Alternative reasons might be related to the development of the city, as the observed subsidence occurred around the city of Toliary, which is one of the largest cities in the southern part of Madagascar. The surface deformation for a period of 6 months in the Atsimo Andrefana region varies from a maximum subsidence of 167 mm to a maximum uplift of up to 83 mm. The white area surrounded by green lines in Zone 1 presents the stable area of the concerned region, which is so considered because of low subsidence. The present outcome is essential, especially for future investments that may occur in the surrounding area, such as city expansion and consequently increased demand, withdrawal of groundwater resources, and the possibility of potential wind observation station locations. The current work is restricted only to land subsidence to find a stable location. However, extensive studies based on other multicriteria for the location of wind observation stations, which are not covered in the present work, should be addressed in the future to find the best location for wind turbines in the region in question.

Author Contributions

Conceptualization, D.K. and H.R.; methodology, D.K. and H.R.; software, H.R. and D.K.; validation, D.K. and H.R.; formal analysis, H.R. and D.K.; investigation, H.R. and D.K.; resources, H.R. and D.K.; data curation, D.K. and H.R.; writing—original draft preparation, D.K. and H.R.; writing—review and editing, D.K. and H.R.; visualization, H.R.; supervision, D.K.; project administration, D.K.; funding acquisition, D.K. All authors have read and agreed to the published version of the manuscript.

Funding

This research was funded by the AGH University of Science and Technology, subsidy 16.16.190.779.

Institutional Review Board Statement

Not applicable.

Informed Consent Statement

Not applicable.

Data Availability Statement

The data used are within the manuscript.

Acknowledgments

The authors acknowledge the AGH University of Science and Technology, Krakow, Poland for its support. We are very thankful for the three anonymous reviewers of this work.

Conflicts of Interest

The authors declare no conflict of interest.

References

  1. Geertsma, J. Land Subsidence above Compacting Oil and Gas Reservoirs. J. Pet. Technol. 1973, 25, 6. [Google Scholar] [CrossRef]
  2. Holzer, T.L.; Bluntzer, R.L. Land Subsidence Near Oil and Gas Fields, Houston, Texas a. Groundwater 1984, 22, 450–459. [Google Scholar] [CrossRef]
  3. Calderhead, A.I.; Martel, A.; Alasset, P.-J.; Rivera, A.; Garfias, J. Land Subsidence Induced by Groundwater Pumping, Monitored by D-InSAR and Field Data in the Toluca Valley, Mexico. Can. J. Remote Sens. 2010, 36, 9–23. [Google Scholar] [CrossRef]
  4. Knez, D.; Zamani, M.A.M. Empirical Formula for Dynamic Biot Coefficient of Sandstone Samples from South-West of Poland. Energies 2021, 14, 5514. [Google Scholar] [CrossRef]
  5. Knez, D.; Khalilidermani, M. A Review of Different Aspects of Off-Earth Drilling. Energies 2021, 14, 7351. [Google Scholar] [CrossRef]
  6. Khalilidermani, M.; Knez, D. A Survey of Application of Mechanical Specific Energy in Petroleum and Space Drilling. Energies 2022, 15, 3162. [Google Scholar] [CrossRef]
  7. Galloway, D.L.; Hudnut, K.W.; Ingebritsen, S.E.; Phillips, S.P.; Peltzer, G.; Rogez, F.; Rosen, P.A. Detection of Aquifer System Compaction and Land Subsidence Using Interferometric Synthetic Aperture Radar, Antelope Valley, Mojave Desert, California. Water Resour. Res. 1998, 34, 2573–2585. [Google Scholar] [CrossRef]
  8. Whittaker, B.N.; Reddish, D.J. Subsidence: Occurrence, Prediction, and Control; Developments in Geotechnical Engineering; Distributors for the U.S. and Canada; Elsevier Science Pub. Co.: Amsterdam, The Netherlands; New York, NY, USA, 1989; ISBN 978-0-444-87274-6. [Google Scholar]
  9. Rajaoalison, H.; Knez, D.; Zlotkowski, A. Changes of dynamic mechanical properties of brine-saturated Istebna sandstone under action of temperature and stress. Przem. Chem. 2019, 98, 801–804. [Google Scholar] [CrossRef]
  10. Knez, D.; Rajaoalison, H. Discrepancy between Measured Dynamic Poroelastic Parameters and Predicted Values from Wyllie’s Equation for Water-Saturated Istebna Sandstone. Acta Geophys. 2021, 69, 673–680. [Google Scholar] [CrossRef]
  11. Knez, D.; Mazur, S. Simulation of Fracture Conductivity Changes Due to Proppant Composition and Stress Cycles. Inżynieria Miner. 2019, 21, 231–234. [Google Scholar] [CrossRef]
  12. Quosay, A.A.; Knez, D. Sensitivity Analysis on Fracturing Pressure Using Monte Carlo Simulation. Oil Gas Eur. Mag. 2016, 42, 140–144. [Google Scholar]
  13. Chilingar, G.V.; Knight, L. Relationship between Pressure and Moisture Content of Kaolinite, Illite, and Montmorillonite Clays. AAPG Bull. 1960, 44, 101–106. [Google Scholar] [CrossRef]
  14. Knez, D.; Calicki, A. Looking for a New Source of Natural Proppants in Poland. Bull. Pol. Acad. Sci. Tech. Sci. 2018, 66, 3–8. [Google Scholar] [CrossRef]
  15. Knez, D.; Wiśniowski, R.; Owusu, W.A. Turning Filling Material into Proppant for Coalbed Methane in Poland—Crush Test Results. Energies 2019, 12, 1820. [Google Scholar] [CrossRef] [Green Version]
  16. Zamani, M.A.M.; Knez, D. A New Mechanical-Hydrodynamic Safety Factor Index for Sand Production Prediction. Energies 2021, 14, 3130. [Google Scholar] [CrossRef]
  17. Buckley, S.M.; Rosen, P.A.; Hensley, S.; Tapley, B.D. Land Subsidence in Houston, Texas, Measured by Radar Interferometry and Constrained by Extensometers. J. Geophys. Res. Solid Earth 2003, 108, 11. [Google Scholar] [CrossRef]
  18. Michel, R.; Avouac, J.-P.; Taboury, J. Measuring Ground Displacements from SAR Amplitude Images: Application to the Landers Earthquake. Geophys. Res. Lett. 1999, 26, 875–878. [Google Scholar] [CrossRef] [Green Version]
  19. Qu, F.; Zhang, Q.; Lu, Z.; Zhao, C.; Yang, C.; Zhang, J. Land Subsidence and Ground Fissures in Xi’an, China 2005–2012 Revealed by Multi-Band InSAR Time-Series Analysis. Remote Sens. Environ. 2014, 155, 366–376. [Google Scholar] [CrossRef]
  20. Narasimhan, T.N.; Goyal, K.P. Subsidence Due to Geothermal Fluid Withdrawal, Man-Induced Land Subsidence. Rev. Eng. Geol. 1984, 6, 35–36. [Google Scholar]
  21. Galloway, D.L.; Jones, D.R.; Ingebritsen, S.E. Land Subsidence in the United States; US Geological Survey: Reston, VA, USA, 1999; Volume 1182.
  22. Allis, R.; Bromley, C.; Currie, S. Update on Subsidence at the Wairakei–Tauhara Geothermal System, New Zealand. Geothermics 2009, 38, 169–180. [Google Scholar] [CrossRef]
  23. Riley, F.S. Analysis of Borehole Extensometer Data from Central California. Land Subsid. 1969, 2, 423–431. [Google Scholar]
  24. Knez, D. Stress State Analysis in Aspect of Wellbore Drilling Direction. Arch. Min. Sci. 2014, 59, 71–76. [Google Scholar] [CrossRef] [Green Version]
  25. Young, G.M. Are Neoproterozoic Glacial Deposits Preserved on the Margins of Laurentia Related to the Fragmentation of Two Supercontinents? Geology 1995, 23, 153–156. [Google Scholar] [CrossRef] [Green Version]
  26. Aras, H.; Erdoğmuş, Ş.; Koç, E. Multi-Criteria Selection for a Wind Observation Station Location Using Analytic Hierarchy Process. Renew. Energy 2004, 29, 1383–1392. [Google Scholar] [CrossRef]
  27. Saaty, T.L. Fundamentals of Decision Making and Priority Theory with the Analytic Hierarchy Process; RWS Publications: Pittsburgh, PA, USA, 2000; Volume 6. [Google Scholar]
  28. Kwak, N.K.; Lee, C.W. Business Process Reengineering for Health-Care System Using Multicriteria Mathematical Programming. Eur. J. Oper. Res. 2002, 140, 447–458. [Google Scholar] [CrossRef]
  29. Radasch, D.K.; Kwak, N.K. An Integrated Mathematical Programming Model for Offset Planning. Comput. Oper. Res. 1998, 25, 1069–1083. [Google Scholar] [CrossRef]
  30. Jaber, J.O.; Mohsen, M.S. Evaluation of Non-Conventional Water Resources Supply in Jordan. Desalination 2001, 136, 83–92. [Google Scholar] [CrossRef]
  31. Frei, F.X.; Harker, P.T. Measuring Aggregate Process Performance Using AHP. Eur. J. Oper. Res. 1999, 116, 436–442. [Google Scholar] [CrossRef]
  32. Alphonce, C.B. Application of the Analytic Hierarchy Process in Agriculture in Developing Countries. Agric. Syst. 1997, 53, 97–112. [Google Scholar] [CrossRef]
  33. Poh, K.L.; Ang, B.W. Transportation Fuels and Policy for Singapore: An AHP Planning Approach. Comput. Ind. Eng. 1999, 37, 507–525. [Google Scholar] [CrossRef]
  34. Schniederjans, M.J.; Wilson, R.L. Using the Analytic Hierarchy Process and Goal Programming for Information System Project Selection. Inf. Manag. 1991, 20, 333–342. [Google Scholar] [CrossRef]
  35. Tzeng, G.-H.; Teng, M.-H.; Chen, J.-J.; Opricovic, S. Multicriteria Selection for a Restaurant Location in Taipei. Int. J. Hosp. Manag. 2002, 21, 171–187. [Google Scholar] [CrossRef]
  36. Kim, P.O.; Lee, K.J.; Lee, B.W. Selection of an Optimal Nuclear Fuel Cycle Scenario by Goal Programming and the Analytic Hierarchy Process. Ann. Nucl. Energy 1999, 26, 449–460. [Google Scholar] [CrossRef]
  37. Gabriel, A.K.; Goldstein, R.M.; Zebker, H.A. Mapping Small Elevation Changes over Large Areas: Differential Radar Interferometry. J. Geophys. Res. Solid Earth 1989, 94, 9183–9191. [Google Scholar] [CrossRef]
  38. Massonnet, D.; Rossi, M.; Carmona, C.; Adragna, F.; Peltzer, G.; Feigl, K.; Rabaute, T. The Displacement Field of the Landers Earthquake Mapped by Radar Interferometry. Nature 1993, 364, 138–142. [Google Scholar] [CrossRef]
  39. Zebker, H.A.; Rosen, P. On the Derivation of Coseismic Displacement Fields Using Differential Radar Interferometry: The Landers Earthquake. In Proceedings of the IGARSS ’94—1994 IEEE International Geoscience and Remote Sensing Symposium, Pasadena, CA, USA, 8–12 August 1994; Volume 1, pp. 286–288. [Google Scholar]
  40. Van der Kooij, M.W.A.; van Halsema, D.; Groenewoud, W.; Mets, G.J.; Overgaauw, B.; Visser, P.N.a.M. SAR Land Subsidence Monitoring; Beleidscommissie Remote Sensing (BCRS): Delft, The Netherlands, 1995. [Google Scholar]
  41. Guoqing, Y.; Jingqin, M. D-InSAR Technique for Land Subsidence Monitoring. Earth Sci. Front. 2008, 15, 239–243. [Google Scholar] [CrossRef]
  42. Katen, A.; Kampes, B.M.; van Bree, R.; Hanssen, R.F.; Swart, L.M.T.; Xu, L. Tianjin InSAR Land Subsidence Observation&Quot; Demonstration Project; Beleidscommissie Remote Sensing (BCRS): Delft, The Netherlands, 2001. [Google Scholar]
  43. Carnec, C.; Fabriol, H. Monitoring and Modeling Land Subsidence at the Cerro Prieto Geothermal Field, Baja California, Mexico, Using SAR Interferometry. Geophys. Res. Lett. 1999, 26, 1211–1214. [Google Scholar] [CrossRef]
  44. Fan, H.; Deng, K.; Ju, C.; Zhu, C.; Xue, J. Land Subsidence Monitoring by D-InSAR Technique. Min. Sci. Technol. 2011, 21, 869–872. [Google Scholar] [CrossRef]
  45. Fujiwara, M.; Kita, K.; Ogawa, T. Stratosphere-Troposphere Exchange of Ozone Associated with the Equatorial Kelvin Wave as Observed with Ozonesondes and Rawinsondes. J. Geophys. Res. Atmos. 1998, 103, 19173–19182. [Google Scholar] [CrossRef]
  46. Sandwell, D.T.; Sichoix, L. Topographic Phase Recovery from Stacked ERS Interferometry and a Low-Resolution Digital Elevation Model. J. Geophys. Res. Solid Earth 2000, 105, 28211–28222. [Google Scholar] [CrossRef]
  47. Williams, S.; Bock, Y.; Fang, P. Integrated Satellite Interferometry: Tropospheric Noise, GPS Estimates and Implications for Interferometric Synthetic Aperture Radar Products. J. Geophys. Res. Solid Earth 1998, 103, 27051–27067. [Google Scholar] [CrossRef]
  48. Li, T.; Liu, J.; Liao, M.; Kuang, S.; Lu, X. Monitoring City Subsidence by D-InSAR in Tianjin Area. In Proceedings of the IGARSS 2004—2004 IEEE International Geoscience and Remote Sensing Symposium, Anchorage, AK, USA, 20–24 September 2004; Volume 5, pp. 3333–3336. [Google Scholar]
  49. Hanssen, R.; Feijt, A. A First Quantitative Evaluation of Atmospheric Effects on SAR Interferometry. In Proceedings of the Fringe 96 Workshop, Zurich, Switzerland, 30 September–2 October 1996. [Google Scholar]
  50. Knez, D.; Zamani, M.A.M. A Review of the Geomechanics Aspects in Space Exploration. Energies 2021, 14, 7522. [Google Scholar] [CrossRef]
  51. Terzaghi, K. Principles of Soil Mechanics. Eng. News Rec. 1925, 95, 19–32. [Google Scholar]
  52. Khalilidermani, M.; Knez, D.; Zamani, M.A.M. Empirical Correlations between the Hydraulic Properties Obtained from the Geoelectrical Methods and Water Well Data of Arak Aquifer. Energies 2021, 14, 5415. [Google Scholar] [CrossRef]
  53. Crosetto, M.; Monserrat, O.; Cuevas-González, M.; Devanthéry, N.; Crippa, B. Persistent Scatterer Interferometry: A Review. ISPRS J. Photogramm. Remote Sens. 2016, 115, 78–89. [Google Scholar] [CrossRef] [Green Version]
  54. Rajaoalison, H.; Knez, D. Current Trends in Land Subsidence of the North-Central Part of Poland Using DInSAR Technique. E3S Web Conf. 2021, 266, 03006. [Google Scholar] [CrossRef]
  55. Zhou, W.; Chen, G.; Li, S.; Ke, J. InSAR Application in Detection of Oilfield Subsidence on Alaska North Slope. In Proceedings of the Golden Rocks 2006, The 41st US Symposium on Rock Mechanics (USRMS), Golden, CO, USA, 17–21 June 2006; American Rock Mechanics Association: San Francisco, CA, USA, 2006. [Google Scholar]
  56. Topouzelis, K.; Singha, S. Chapter 6—Oil Spill Detection Using Space-Borne Sentinel-1 SAR Imagery. In Oil Spill Science and Technology, 2nd ed.; Fingas, M., Ed.; Gulf Professional Publishing: Boston, MA, USA, 2017; pp. 387–402. ISBN 978-0-12-809413-6. [Google Scholar]
  57. Serco Italia SPA Land Subsidence with Sentinel-1 Using SNAP. (Version 1.2) 2018. Retrieved from RUS Lectures. Available online: https://rus-copernicus.eu/portal/the-rus-library/learn-by-yourself/ (accessed on 23 February 2022).
  58. Zebker, H.A.; Rosen, P.A.; Hensley, S. Atmospheric Effects in Interferometric Synthetic Aperture Radar Surface Deformation and Topographic Maps. J. Geophys. Res. Solid Earth 1997, 102, 7547–7563. [Google Scholar] [CrossRef]
  59. Khalil, R.Z.; Saad-ul-Haque. InSAR Coherence-Based Land Cover Classification of Okara, Pakistan. Egypt. J. Remote Sens. Space Sci. 2018, 21, S23–S28. [Google Scholar] [CrossRef]
  60. Fan, H.D.; Cheng, D.; Deng, K.Z.; Chen, B.Q.; Zhu, C.G. Subsidence Monitoring Using D-InSAR and Probability Integral Prediction Modelling in Deep Mining Areas. Surv. Rev. 2015, 47, 438–445. [Google Scholar] [CrossRef]
  61. Serele, C.; Pérez-Hoyos, A.; Kayitakire, F. Mapping of Groundwater Potential Zones in the Drought-Prone Areas of South Madagascar Using Geospatial Techniques. Geosci. Front. 2019, 11, 1403–1413. [Google Scholar] [CrossRef]
  62. Randriambololona, T.; Rajaomahefasoa, R.E.; Rakotomandrindra, P.F.; Rajaoalison, H.; Andriamanaosoa, N.V.; Ratsimbazafy, J.B. Hydrogeophysical Study of the Mahafaly Plateau (Case of Masiaboay and Beantake Rural Municipalities). IJIRSET 2018, 7, 8. [Google Scholar] [CrossRef]
  63. Rakotondrainibe, J.H. Synthèse de La Géologie et de L’hydrogéologie de Madagascar. Africa Groundwater Littérature Archive 2006. Available online: https://www2.bgs.ac.uk/africaGroundwaterAtlas/atlas.cfc?method=listResults&author_search=&category_search=&country_search=MG,MG&title_search=&authorBoolean=AND&titleboolean=AND&pageSize=223&start=0& (accessed on 15 January 2022).
  64. Smedley, P. Groundwater Quality: Madagascar. 2002. Available online: https://www.readkong.com/page/groundwater-quality-madagascar-2460230 (accessed on 15 January 2022).
  65. Keppert, R.M.; Cáchová, M.; Durana, K.; Fořt, J.; Koňáková, D.; Pavlík, Z.; Trník, A.; Cerný, R. Relationship between Pore Size Distribution and Mechanical Properties of Porous Sedimentary Rocks. Adv. Mater. Res. 2014, 905, 207–211. [Google Scholar] [CrossRef]
  66. Martin, J.C.; Serdengecti, S. Subsidence over Oil and Gas Fields. Man-Induc. Land Subsid. 1984, 6, 23. [Google Scholar]
  67. Papini, M.; Benvenuti, M. The Toarcian–Bathonian Succession of the Antsiranana Basin (NW Madagascar): Facies Analysis and Tectono-Sedimentary History in the Development of the East Africa-Madagascar Conjugate Margins. J. Afr. Earth Sci. 2008, 51, 21–38. [Google Scholar] [CrossRef] [Green Version]
Figure 1. Two-pass differential method processing steps, including the digital elevation model (DEM) and single look complex (SLC).
Energies 15 04878 g001
Figure 2. (a) Location of Madagascar within the African continent; (b) Location of the study area in Madagascar; and (c) simplified geology of the great south-west part of Madagascar (source: Bureau de Recherches Géologiques et Minières (BRGM)).
Energies 15 04878 g002
Figure 3. Digital elevation model of the great south western part of Madagascar (source: Shuttle Radar Topography Mission (SRTM).
Energies 15 04878 g003
Figure 4. The allure of the predicted vertical displacement of the surface (uz) in meter versus the distance (r) in meter from the vertical axis of the reservoir in the Atsimo Andrefana region.
Energies 15 04878 g004
Figure 5. The 6-month land subsidence of the great south-western part of Madagascar from the Sentinel data, in which (a) represents the investigated area divided into three compartments; (b) shows the stable area, characterized by white color (in Zone 1); (c) shows the uplifted area, characterized by blue color (in Zone 2); and (d) shows where subsidence occurred, characterized by red color (in Zone 3).
Energies 15 04878 g005
Table 1. Description of the two SAR images used.
ParameterImage n°1Image n°2
Sensing date9 September 202121 March 2022
InstrumentSAR-CSAR-C
Instrument modeIWIW
SatelliteSentinel-1Sentinel-1
Orbit number39,78842,413
Pass directionDescendingDescending
PolarizationVV + VHVV + VH
Product classSAR standard L1SAR standard L1
Product levelL1L1
Product typeSLCSLC
Track166166
Mission typeEarth observationEarth observation
Table 2. Characteristics of the aquifer as input to the Geertsma model.
ParameterValue
depthfrom 150 to 450 m
thickness300 m
radius15,000 m
Poisson’s ratio0.25
Young’s modulus 11 × 1010 Pa
Publisher’s Note: MDPI stays neutral with regard to jurisdictional claims in published maps and institutional affiliations.

