Article

Factors Determining the Development of Prosumer Photovoltaic Installations in Poland

1
Institute of Economics and Finance, Warsaw University of Life Sciences–SGGW, 166 Nowoursynowska Str., 02-787 Warsaw, Poland
2
Department of Computer Science in Management, Faculty of Management, Rzeszow University of Technology, Al. Powstańców Warszawy 12, 35-959 Rzeszow, Poland
*
Author to whom correspondence should be addressed.
Energies 2022, 15(16), 5897; https://doi.org/10.3390/en15165897
Submission received: 21 July 2022 / Revised: 9 August 2022 / Accepted: 12 August 2022 / Published: 14 August 2022
(This article belongs to the Special Issue Energy Consumption in EU Countries)

Abstract

:
The development of energy production from renewable sources includes the production of energy from photovoltaic installations by prosumers. In Europe, RES development is driven by political goals and requires subsidies during the deployment period, at least as long as the cost of renewable electricity does not reaches grid parity. The study attempts to determine the importance of factors in the development of energy production by prosumers from PV installations in Polish regions. In 2019, the ‘Moj Prad’ program was introduced, applying subsidies to investment costs and the settlement of energy production in the net-metering system. Almost 900 thousand prosumer PV installations were built by the end of 2021, with a total capacity of 5.9 GW. Solar energy share grew from 0.1 to 2.1%. Spatial econometrics models were use in research to determine factors of prosumer PV systems development in Poland (at NUTS-2). Spatial regimes were found in the studied regions, as indicated by a positive autocorrelation (0.75). Considering the pseudo-R-square co-efficient, we can conclude that the spatial error, i.e., factors not included in the GNS model, constitutes approximately 10%. The economic variables included in the Mansky model, i.e., level of salaries and GDP, explain 90% of the variability of installed PV capacity (Nagelkerke pseudo-R-squared value is 0.906). The level of development of prosumer photovoltaic installations (in W per capita) in regions depends primarily on economic factors represented by the level of salaries in a given region. With the increase in salaries by one unit, we also have an increase in installed power capacity in watts per person by 3.52. Surprisingly, the region’s overall wealth did not matter, as the relative number of installations in regions with lower GDP was higher than in others. One can explain that the individual income of households is more important for increasing the number of prosumer installations than the income of the regional economy. The increase in the number of installations in one region contributed to the subsequent increase in their number in neighboring regions.

1. Introduction

The energy transformation of economies and the search for opportunities to increase the importance of renewable energy sources are also factors in the growing importance of electricity production from photovoltaic (PV) installations. PV systems are currently one of the most used renewable energy sources (RES) [1,2], although the cost of reducing greenhouse gases emissions in supporting the development of PV systems is higher than in wind systems [3]. Worldwide, in 2020 139 GW of solar PV capacity was added, constituting as much as 58% of new RES power capacity. The total capacity of PV installations in 2020 has already reached 760 GW [4]. The European Commission set out in the Renewable Energy Directive rules for the EU to achieve a 32% renewables target by 2030 [5], and each of the EU countries has introduced internal solutions to accomplish this goal. The most important aspects of the European Green Deal are reducing greenhouse gas emissions, reducing the dependence on external energy sources, and improving the quality of life. Photovoltaics is supported as it helps avoid excessive use of biomass from crops as raw materials for fuel production. Such a production competes with food production [6,7].
Photovoltaics is one of the key technology options for implementing the shift to a decarbonized energy supply and can be deployed almost everywhere. Solar resources across the world are abundant and cannot be monopolized by one country [2]. In the EU countries, the development of PV installations was uneven. Until 2010, investments were mainly carried out in Germany and Italy, followed by other countries such as the UK and Spain [8]. This was due to the introduction of state PV development support programs [9], but a significant impact was also exerted by lowering the installation costs of such a system and an increase in energy prices for end-users [10]. Between 2009 and 2020, the cost of crystalline solar PV modules declined by 93%, and the weighted-average levelized cost of electricity (LCOE) from utility-scale photovoltaic plants decreased by 85% [11]. The residential photovoltaic systems market boom resulted jointly from the introduction of incentives in the form of investment subsidies, the use of feed-in tariffs, the use of net metering, and a significant drop in the prices of PV systems. When the energy costs of such subsidized systems reached grid parity, it encouraged many investors, including consumers, to invest. Consumers, apart from lower energy costs, are interested in securing themselves in the future against rising energy prices, protecting against shortage of supplies, and believe that in this way, they support the policy of ensuring EU energy security and environmental protection [12]. Typically, consumers consider supply-side incentives (e.g., feed-in tariffs when investing in RES) to be more advantageous than incurring higher costs of purchasing certified green energy, although the effect of the increase in the RES share is similar [13]. It is worth adding that the development of electric energy sources not based on fossil fuels reduces the strength of the relationship between electricity prices and the prices of fossil fuels [14,15]. When fossil fuel prices are growing significantly, like during the war in Ukraine, it becomes particularly important. In Poland, the support program for prosumer PV micro-installations began in 2019. It was a strong impulse for the development of this type of installation like it was experienced in other EU countries [3,16]. Since the program is aimed at supporting micro-installations with a capacity of up to 50 kW in households, it has no impact on developing large, utility-scale PV systems and large PV installations in enterprises. PV power plants development is supported based on feed-in tariffs within the auction system for supplying energy from renewable sources [17]. It is worth noting that in the auctions for energy supply from RES in 2020 and 2021, the largest amount of energy was contracted from PV power plants.
The factors influencing investment decisions on residential photovoltaic systems can be different depending on time and country. However, the experience of implementing PV development programs in various countries suggests that the essential factor is investments’ generally recognized economic rationality. Apart from that, other factors should be considered, including the level of wealth in a given country or the level of the population’s income. An important factor is also the “neighborhood” effect, which results from the desire to have what the neighbor has and to use his experiences [18] (also understood here as greater interest in a given region). Therefore, the study aimed to determine the importance of selected economic factors in the development of residential PV installations in Poland by region. It was also determined whether there are spatial relationships between the regions, i.e., whether the increase in the number of PV systems installed in one region affects the growth in the neighboring regions.
Data on the size of GDP by region, the level of wages and salaries, the number of households, the number of people, and the number and capacity of installed resident PV systems were used. Information on PV installations came from NFOSIGW on implementing the ‘Moj Prad’ (MP) program [19]. Data on the economic and social situation in the regions came from Statistics Poland [20]. The methodology of research is widely described in Section 4.
A new aspect of the work is the use of spatial models. It should be noted that most of the literature concerns programs for supporting PV in other European countries. It is worth also noting that Italy, Germany and Spain’s PV development cases were separately described in the literature for these countries as they were subject to different natural and economic conditions. The work fills the gap for EU countries, such as Poland, which has recently introduced an active policy of RES support, including support for prosumer PV systems. For Poland, mainly the potential of PV development in regions and forecasted investment profitability was widely analyzed in the literature. The assessment of the reasons for the development of prosumer PV systems, including the regional perspective, was not undertaken. The study fills this gap.
The article is structured as follows: Section 2 deals with the factors determining the dissemination of solar energy production systems and further development prospects; in subchapters, the conditions for the development of residential PV systems and related limitations are presented. Section 3 presents the results of the implementation of the ‘Moj Prad’ program in Poland in the period 2019–2021. Section 5 discussed the results. Finally, the conclusions are drawn in Section 6.

2. Factors in the Development of PV Systems

The development of energy production from photovoltaic (PV) systems, observed on an unprecedented scale in recent years around the world, results from several important development trends. The first is, of course, the desire to reduce the use of fossil fuels to reduce CO2 emissions and human impact on climate change through developing a low-carbon economy [21,22]. Important benefits are obtained through developing utility-scale and prosumer PV systems, which induce governments to finance them [23]. The main arguments are environmental protection resulting from lower GHG emissions from electricity production, what results from the substitution of fossil fuels [24], and lower and lower LCOE from PV systems [16,24,25].

2.1. System Costs and Government Support Programs for the Development of Energy Production from PV Systems

There is constant technological progress in the production of components for PV systems. As a result, producers offer more efficient PV panels [26], better inverters, and cheaper panel installation systems. At the same time, from 1990 to 2020, the price of these components decreased by more than 80% [11,27]. The cost of 1 kW installed in PV in 2020 was USD 883, and in 2015 it was USD 1657 [11]. As a result, LCOE fell to USD 57/MWh in utility-scale PV systems and around USD 126/MWh in residential PV systems. Median LCOE from coal-fired power plants is calculated at 88 USD/MWh [28]. Investment costs vary from country to country, as do electricity costs, but the trend of lowering costs for each component of the investment is observed everywhere [15,29,30].
The most cost-effective solution for residential rooftop PV systems is a direct connection to the power grid. The use of batteries for energy storage is expensive due to the still high cost of the batteries themselves [25,31,32,33]. The payback period of systems with batteries is even twice as high as those connected to the grid. The use of batteries as energy storage is more efficient at high energy prices with low surplus purchase tariffs [34,35,36], when the aim is to match production and consumption [37]. Similarly, when distributors offer a net-metering system for energy prosumers, off-grid systems with power generators or batteries are not cost effective [25].
Investors, both businesses and consumers, consider investment costs and the payback period. Hence, the high profitability of investments in PV systems is the main factor in their development. Currently, this profitability still depends on the policies pursued by the states. The most common are subsidies to investment costs, simplifying investment procedures, feed-in-tariff, net metering or net billing. Well-known examples of such programs are the Conto Energia program in Italy and programs based on feed-in-tariffs (FIT) in Germany, the UK, Greece, and Spain. Without subsidizing such tariffs, there would be no development of the PV market [9,23,38,39,40,41,42,43,44,45,46].
The countries reached saturation of the prosumer photovoltaic market 3–5 years after implementing FIT programs. To be profitable, FIT contracts must be concluded for a relatively long period—at least 10–15 years [47]. Some authors argue that tariffs based on net metering are more advantageous for residential roof-top PV systems, as they make it possible to avoid significant overproduction of energy from such local sources because it becomes unprofitable for prosumers [48,49]
Preferential tariffs applied in individual countries were adjusted to the situation in their energy market and were to ensure grid parity for PV energy production at given investment costs [50]. Thus, the tariffs for the utility-scale were different from those for the residential rooftop PV, and they were changed over time, as in the five subsequent editions of Conto Energia in Italy [45]. FIT, net-metering or net-billing programs are very competitive [15,25,46,51]. However, without support in the form of feed-in tariffs or other preferential tariffs, PV systems, among them residential ones, would not develop [10,33,38,42,45,46,50,52,53]. Electricity generation costs from PV still do not reach grid parity in many countries, even with lower investment costs [40]. Return on investment in PV is currently acceptable for investors even without FIT only in some countries with better natural conditions for the operation of photovoltaic systems because of reaching higher capacity factors [9,31,54,55]. As a result, the LCOE in utility-scale photovoltaic systems may be lower than average market electricity prices [51]. Therefore, support programs lead to the development of RES to the desired level, and then they can be reduced [15,30,56].
Factors increasing the profitability of investing in a PV installation for prosumers include a higher level of energy self-consumption [10,24,30,41,57,58,59], or adjusting the installation size to the level of consumption [39,49,60,61]. It means that residential PV should mainly provide enough energy for a given household, unless there is an energy shortage in a given region or the household participates in energy community.
Subsequent actions to support the development of RES, including PV, should concern the development of demand-side management systems, which will enable better energy management [57], but also the creation of energy communities in which the production and consumption of energy will be jointly planned [62,63,64]. Additionally, the development of smart grids is necessary as they allow better management of surplus energy, including in isolated systems (e.g., in islands, separated rural areas, and countries without a well-developed energy network) [48,65,66,67,68,69]. In such grids, battery energy storage systems (BESS) coupled with PV are also more effective [33,36].

2.2. Factors Influencing the Interest of Households in Investing in PV Installations

Households may be interested in PV installations for reasons other than institutional investors who expect high rates of return or governments that seek to increase RES in the energy mix and reduce emissions from energy production. The research shows that essential characteristics of a household that favors the decision to install PV include income, education, owning a house and the planned time of using the house, and only then the profitability of the investment [70,71,72]. On the other hand, research from different countries shows that investments in PV installations in households result primarily from the possibility of financing such a system by the investor (which results from the amount of income). The next factors are awareness of various subjective benefits, the calculation of investment profitability, environmental protection issues, consulting, imitation and the type of buildings [33,56,60,61,71,73,74]. Individual authors often focus only on the assessment of the profitability of an investment or the period of return on investment.
An important aspect is also how certain behaviors depend on the observed patterns. For example, according to the diffusion of innovation principle, other people’s positive experiences may be an incentive to take specific actions. The same was found for disseminating residential PV systems in Italy, UK and Germany [36,41,45,71]. As confirmed by Dharsing [71], such impacts were visible at the international, regional and county level.

2.3. Barriers on the Development of Energy Production from PV Systems

The electricity production from PV systems may face numerous limitations as they develop. From the point of view of energy distributors, excess production in the summer and on sunny days may disrupt the operation of transmission systems, e.g., overloading of existing transmission lines and demand and supply mismatch [10,48,57], but it may also destabilize the entire energy production system in which stable energy sources must still operate [42,57,65]. The development of smart grids, and forecasting of PV energy production based on the weather forecast, can be a partial solution to such problems [48,64,75]. Another issue is the structural diversity of PV energy production. Production often takes place in rural areas, and energy demand is in urbanized and industrialized areas.
In the conditions of switching to net billing systems, prosumers may be exposed to the risk of low prices in the period of high energy production [51,55]; in addition, many projects are still not profitable assuming the use of market prices [40,48,55]. Reducing or giving no support for PV micro-installation and no guarantee of purchasing PV electricity will also mean that consumer budget constraints are becoming more critical in such projects, and investment risks are increasing [74]. From the point of view of GHG emissions reduction, the development of energy storage systems in batteries may involve an unacceptable level of emissions from the production and disposal of batteries [76].
Therefore, the development of PV and other RES requires support for investments and energy purchase prices and ensuring the stable operation of the entire energy system under new conditions, with a more significant share of variable energy sources.

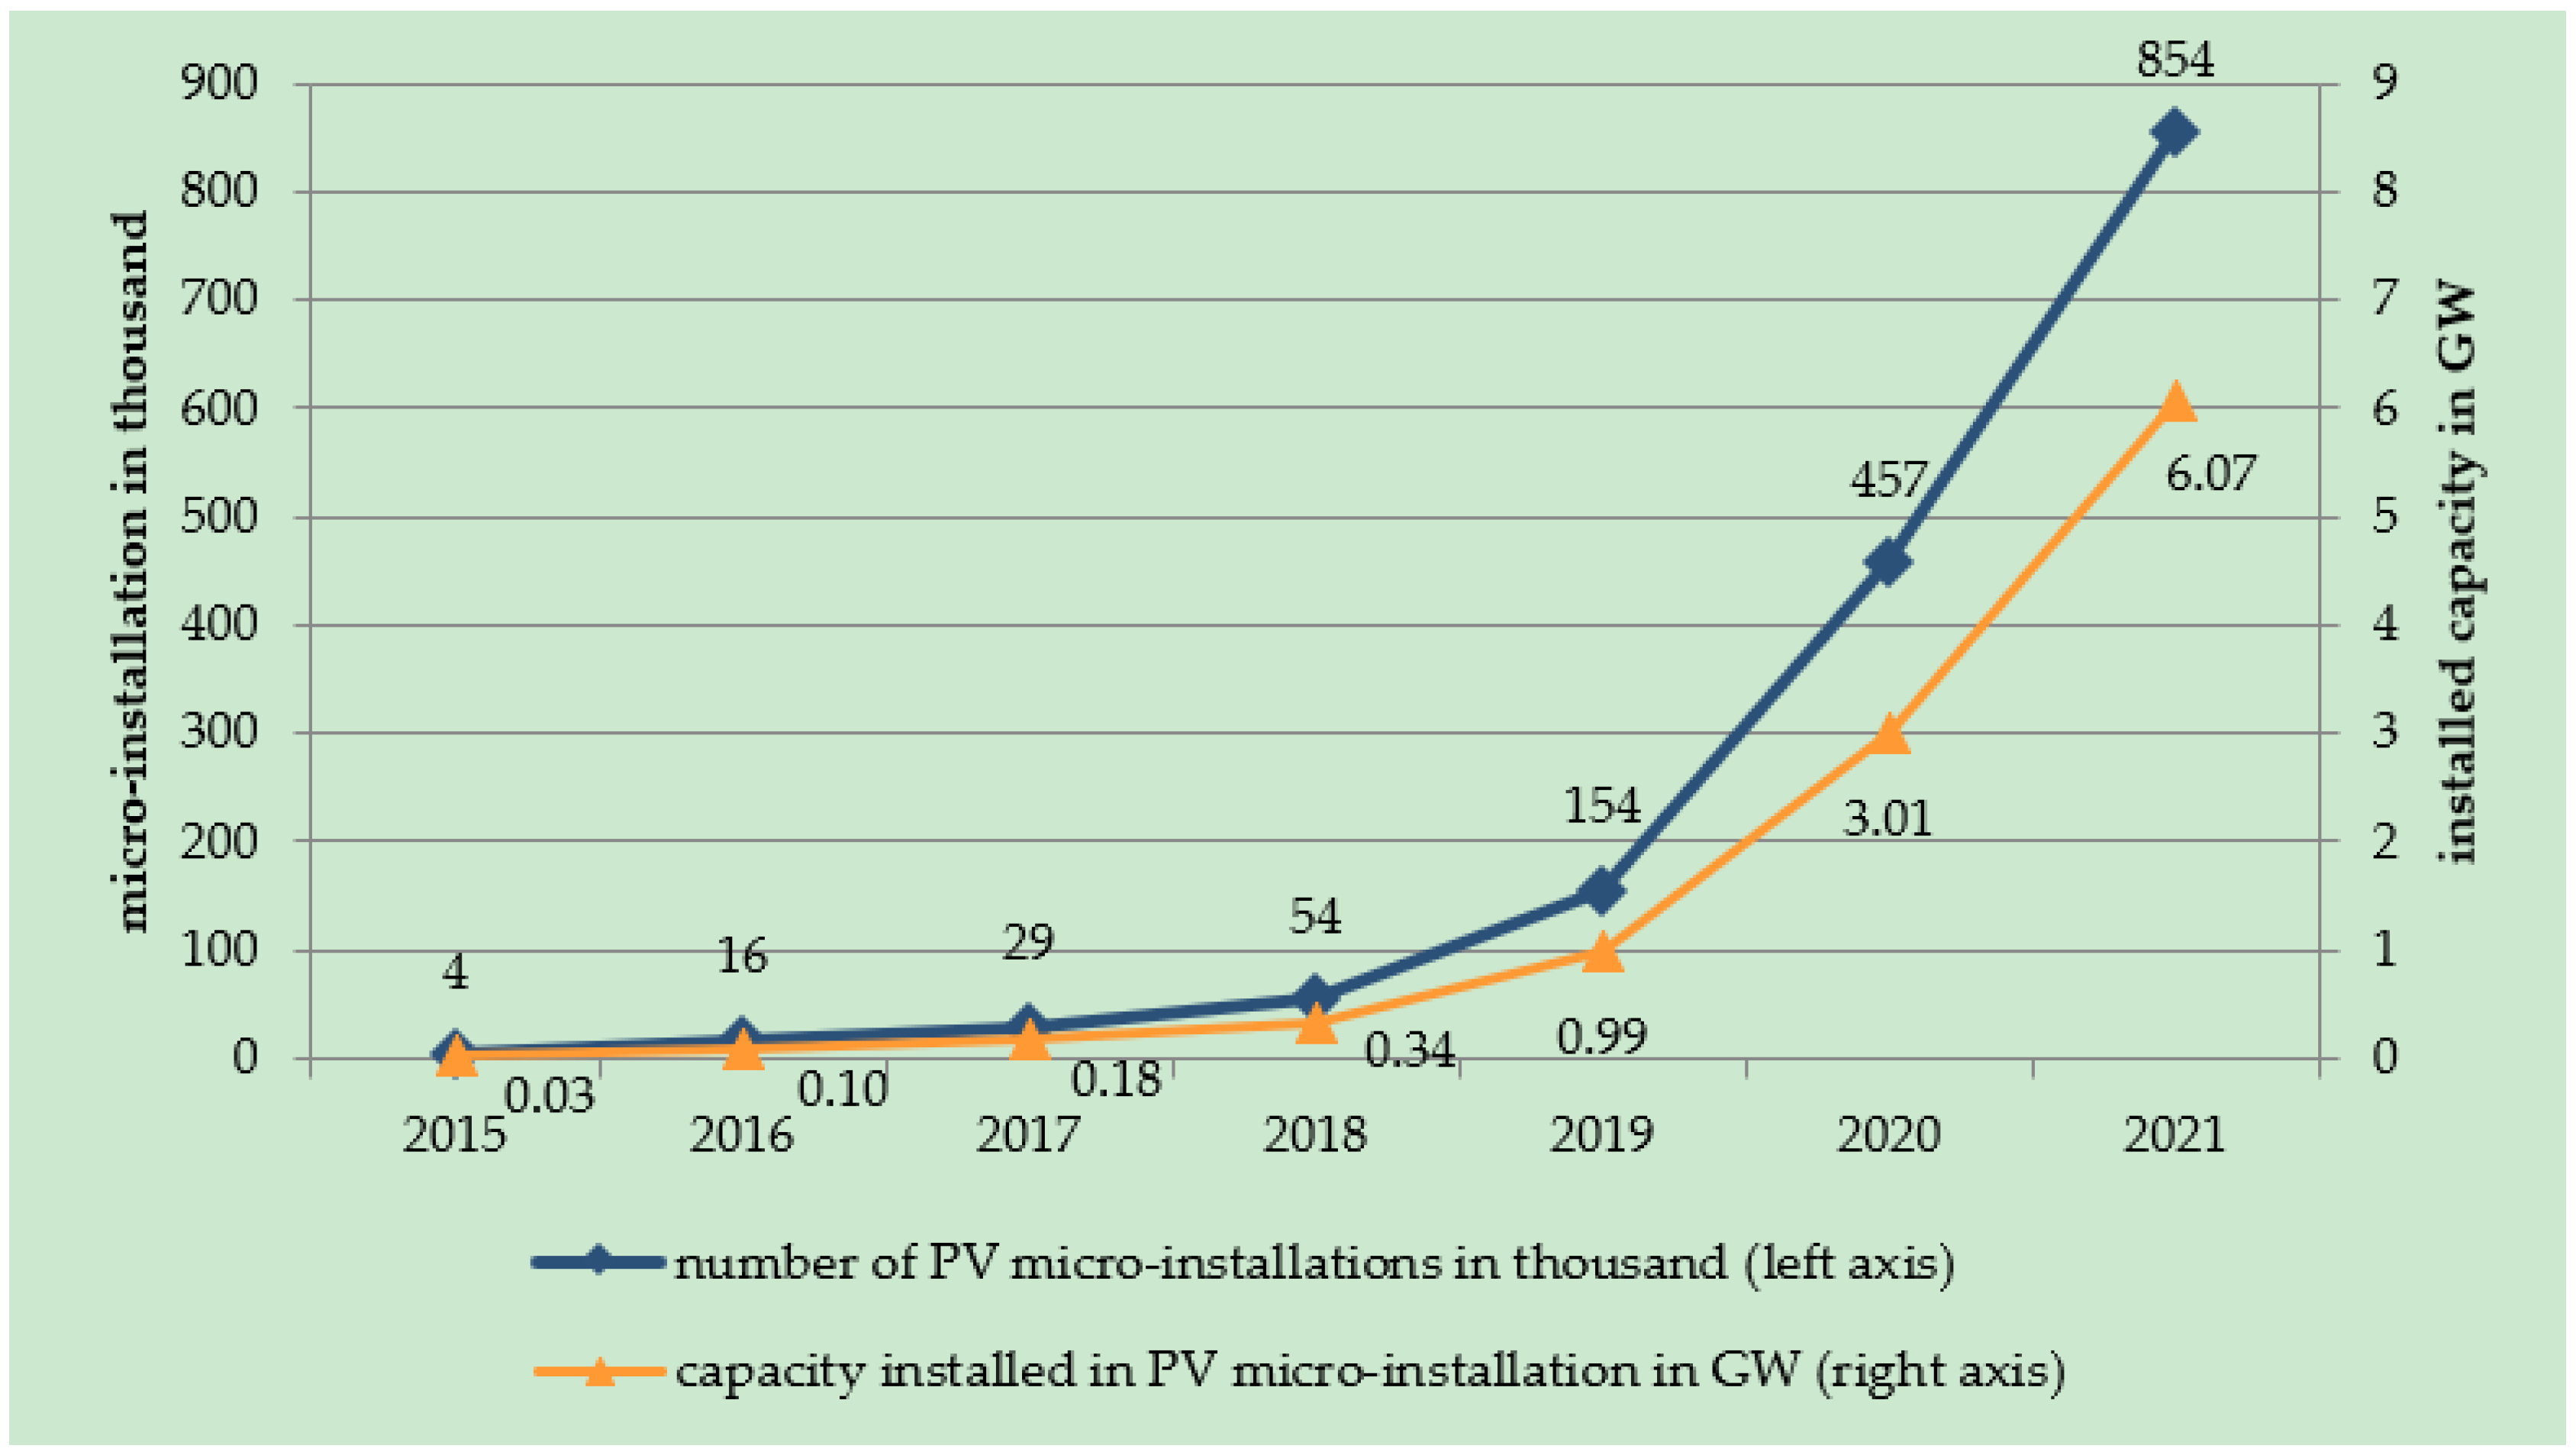
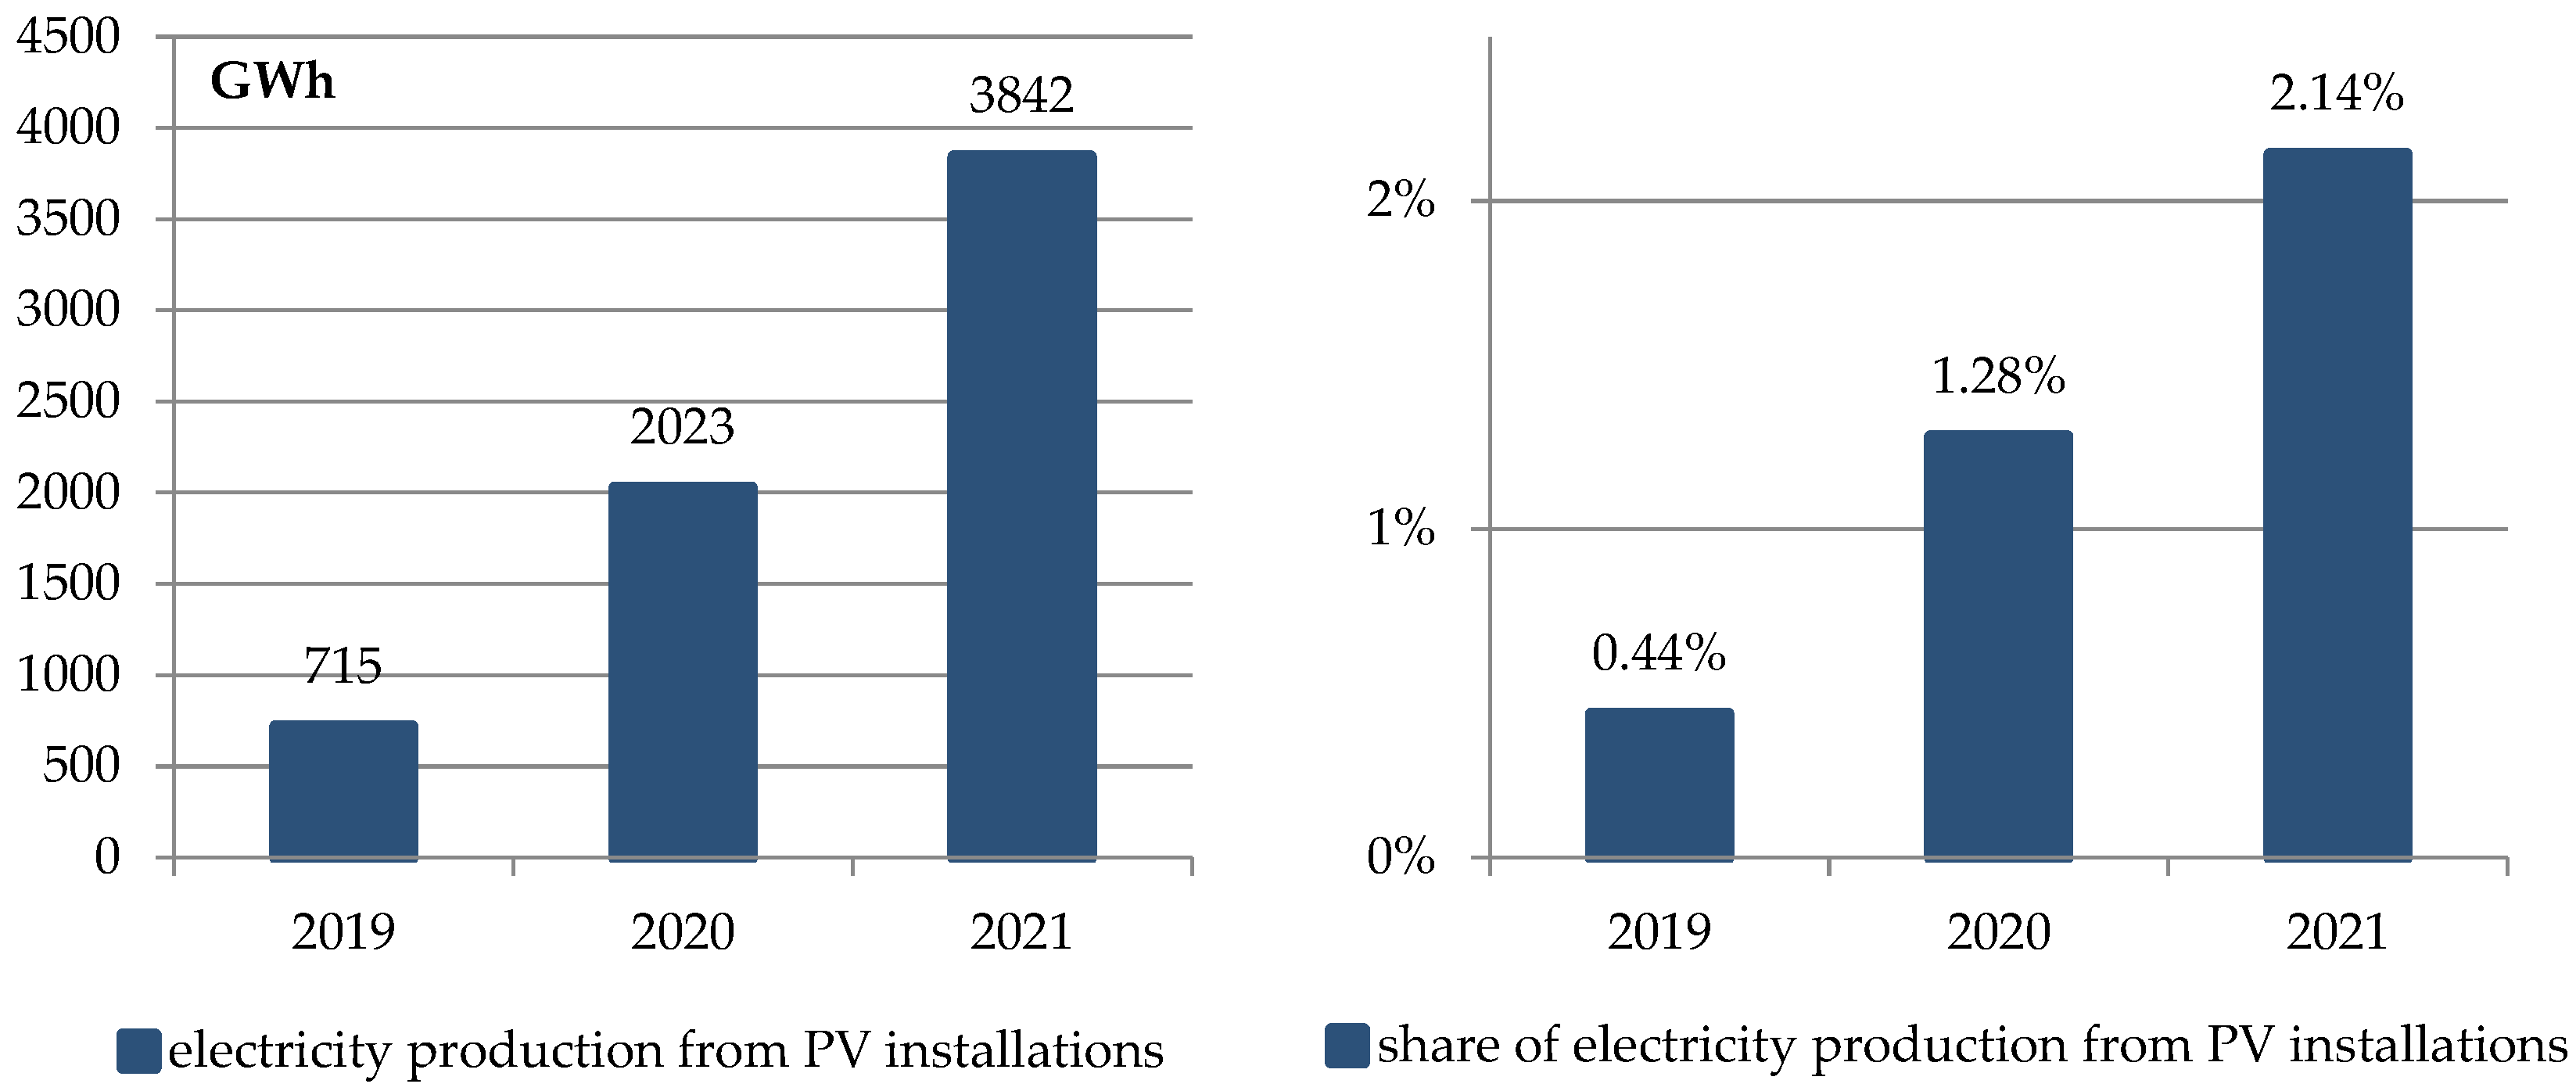
3. ‘Moj Prad’ Program and PV Energy Production in Poland

In the EU, the development of electricity production from PV has been taking place since 2000, but a noticeable share of solar energy in total electricity supply has been observed since 2010 when it exceeded 1.5%. It is worth recalling that since 2005, Conto Energia programs have been implemented in Italy. In subsequent years, similar programs supporting PV development appeared in other countries, such as the UK, Spain, and Greece. The leader in the development of PV systems was and still is Germany. Since 2015, the share of PV energy in the EU has exceeded 3.5% (Figure 1), and from 2019, another stage of growth has been observed, resulting from the launch of PV support programs, e.g., in Bulgaria, Romania, Hungary, and Poland. In 2020, the share of PV energy exceeded 5%. It is worth adding that the percentage of wind energy was around 15%.
In Poland, PV micro installation were rarely installed before 2019. Utility-scale PV systems were supported within an auction system with feed-in tariffs for a contracted amount of energy. Micro PV installations did not obtain support, except for small local programs for underdeveloped areas. In 2015, there was only 30 MW of installed PV capacity. The stagnation lasted until 2019. In 2019, the ‘Moj Prad’ (MP) program was implemented, and it was continued in the following years. As part of this regulation, a net-metering tariff for 15 years was introduced for PV micro-installations (<50 kW), as well as a subsidy to investment costs within the available budget. The program aimed to increase the number of energy prosumers supporting PV micro-installations among households in Poland. The budget for the first and second MP editions was PLN 1 billion at the end of 2020, and finally, the funding was extended to PLN 1.16 billion. The third edition (MP3) started in 2021. Till the end of May 2022, subsidies of PLN 1.51 billion were paid for 337 thousand PV micro-installations [19]. Another 500,000 micro-installations were connected to the network without subsidies for the installation costs. In this case, investors used only a preferential net-metering tariff, guaranteed for 15 years. In addition, all prosumers could take advantage of the tax relief, deducting 17% of the investment costs from the tax, up to the amount of PLN 9000 (approx. EUR 2000).
In the two first editions of MP, beneficiaries received a subsidy of 5000 PLN (ca. EUR 1100) per installation of 2–10 kWp, and in the third edition, it was 3000 PLN (ca. 670 EUR). In MP1, there were 29 thousand micro installations subsidized, and in MP2, 200 thousand. In addition, all those who have built PV micro-installations are entitled to use the energy sent to the grid on a net metering basis. Therefore, 80% of the energy transmitted to the grid can be used free of charge within one year.
At the end of 2021, there were 854,000 PV micro-installations (<50 kW) in Poland, and the total installed capacity exceeded 6 GW (Figure 2).
The production of electricity from PV systems grew dynamically in the following years. In 2019, it was 715 GWh, and in 2021, 3842 GWh, i.e., over five times more (Figure 3). The number of PV micro-installations in 2021 was still growing, so in the coming years, the electricity production from PV systems may exceed over 7000 GWh. However, the share of solar energy in the energy mix in Poland is still small. In 2021, it was 2.14%. Wind energy has a higher share amounting to 9.2% in 2021, with energy generation of 16,473 GWh. In the coming years, the percentage of solar energy in the energy mix in Poland should increase to 5%. For comparison, in Italy and Germany in 2020, the share of PV energy was around 8.5%, and in Hungary, it was 7%.
The voivodships with the most significant number of PV installations are those with the largest population, i.e., Mazowieckie, Wielkopolskie and Śląskie (in Poland, regional administrative units are historically called voivodships, so the region and the voivodship mean the same in this work). Table 1 lists essential variables characterizing each region at the end of 2020. These variables have proven to be potentially significant in explaining the increase in the number of PV installations and the interregional impact.

4. Methodology

In this study, spatial econometrics models were used due to the spatial nature of the research. According to the current paradigm of spatial econometrics [81], we can observe autocorrelation as the lag of the dependent variable, the lag of the independent variables, or the spatial lag of the error. The currently valid classification of spatial econometric models was developed by Elhorst [82] and was adopted by the scientific community as an estimation standard. Figure 4 shows the type of spatial econometric models.
The diagram (Figure 4) shows the successive stages of taking into account the lags in individual models, starting with the linear model, in which spatial effects are not considered. The matrix form of the classical linear model regression was written by the Formula (1):
Y = X β   +   ε ,
where Y is the vector of the dependent variable observation, X is the matrix of the observed values of the independent variables (factors), β is the vector of the structure parameters, and ε is the vector of random components.
Until 2010, the most frequently used spatial models were models with one spatial component. These include the SAR models (spatial autoregressive model, Formula (2)), the SEM (Spatial Error Model, Formula (3)), and the relatively rarely used SLX model (Formula (4)):
Y   =   β 0 +   ρ W Y   + X β   +   ε ,  
Y   =   β 0 + X β   +   u ,   where :   u   =   λ W u   +   ε
Y   =   β 0 + X β   + W X θ   +   ε
where most of the terms are as in Formula (1): W is the matrix of spatial weights, ρWY is the spatial lag of the dependent variable, WXθ is the spatial lag of the independent variables (Durbin component), and λWu–the spatial lag of the error.
The SLX model examines the direct influence of causes of the effect in the observed region of the so-called spatial spillovers. In the SEM model, spatial autoregression does not concern the explanatory variable but the random component. In the SAR model, spatial autoregression discusses the explanatory variable. In this model, we no longer assume spatial clusters of causes but rather spatial interactions.
Two-component models that take into account two spatial components are the SAC model (Kelejian–Prucha model, Formula (5)), SDM (spatial Durbin model, Formula (6)) and SDEM (spatial Durbin error model, Formula (7)). Both the Durbin models (Formulas (6) and (7)) are the most popular, although in some cases, the SAC model gives better fits.
Y   =   β 0 +   ρ W Y   + X β   +   u ,   where :   u   =   λ W u   +   ε
Y   =   β 0 +   ρ W Y   + X β   + W X θ   +   ε
Y   =   β 0 + X β   + W X θ   +   u ,   where :   u   =   λ W u   +   ε
The model that takes into account all three elements of spatial autocorrelations is called the Manski model (GNS), which we write as the formula:
Y   =   β 0 +   ρ W Y   + X β   + W X θ   +   u , where :   u   =   λ W u   +   ε ,   ε ~ N ( 0 ,   δ ε 2 I N )
The model given by Formula (8) is seldom used due to over-specification. However, the possibility or necessity of using other models (Formulas (2)–(7)) should be considered. An additional problem in spatial research is determining the matrix of spatial weights W [83]. The weights matrix defines the interrelationships and spatial regimes of the studied variables [83]. The specificity of data and the complexity of spatial structures determine the weight matrix method.
On the other hand, the method of data representation and the research problem to be solved compile the form and structure of the weight matrix. Therefore, the issue related to the construction of the weight matrix is the approach to the complicated system of objects and choosing the method of representation of alternative relationships. All activities lead to the best reproduction of reality in spatial research. How significant the problem is to determining the weights matrix can be proved by many works [83,84,85,86,87] and others. Figure 5 presents a list of different types of weight matrices [88]. Pietrzykowski conducted extensive research on this problem, which resulted in a proposal to modify the spatial weight matrix, thanks to which the data can be described in a more detailed way [89] as well as increasing the possibilities of spatial analyses by using functional analysis [87].

Research Design and Data Sources

The analysis was carried out at the NUTS-2 level, which comes down to the research at the regional level for Poland. Data from 2020 were used in work. The study considered the following variables: number of installations in the region, number of installations per million inhabitants, number of installations per million households, salary per person in the region, number of PV installations per 100 million GDP in the region, total power in the region, total subsidies in the region, power per capita in the region, power per installation in the region. In the analysis conducted on the factors influencing the development of photovoltaics in Poland, the Manski model (GNS) was used. The exact structure of the weight matrix was applied to the recommendations for such models [81].
Figure 6 and Figure 7 show the spatial distributions of individual variables included in the analysis. The variables are presented on the administrative map of Poland at the NUTS-2 level (i.e., at the regional level). Figure 6 contains the variables that describe photovoltaic installations in terms of power and the number of installations in individual regions. In Poland, the development of photovoltaic installations occurs in its southern part due to the power and number.
According to the authors, Figure 7 summarizes the features that may influence the decision regarding a photovoltaic installation. It can be noticed that the spatial distribution presented for the power and number of installations corresponds to that shown in Figure 7. It means that high values of GDP, remuneration and subsidies are found in those provinces with high values of power and number of photovoltaic installations.

5. Results

Preliminary data analysis allowed for selecting the following variables: the installed ‘power capacity in watts per person’ (y) was adopted as a dependent variable. The ‘number of PV installations per100 million GDP’ in the region (x1) and ‘salary in thousand PLN’ (x2) were adopted as independent variables. Figure 8 summarizes the Pearson correlation coefficients and histograms for the variables used in the model. One can see that the variables are correlated with the dependent variable and are independent of each other (correlation coefficient 0.16). This arrangement allows for the correct performance of the regression analysis.
In the next step, multiple regression analysis without spatial effects was conducted based on the model:
Y i =   β 0 +   β 1 x 1 +   β 2 x 2 + ϵ i
Table 2 summarizes the results of the conducted analysis.
The model has successfully passed the residual analysis. The following tests were used: Shapiro–Wilk (residual normality), Goldfeld–Quandt (residual variance stability), Durbin–Watson (residual autocorrelation), and RESET (model correctness). Then, the autocorrelation coefficient was calculated for the linear model without spatial effects. Moran’s autocorrelation model was 0.3175 and was significant (p-value: 0.003345), which confirms that econometric spatial models should be used in further analysis. In the other part of the analysis, the Manski model (GNS) contains three spatial coefficients, i.e., spatial delay Y (rho), spatial delay X (theta), and spatial error autocorrelation (lambda), was selected. The Manski model was compared with other models, and it was found that it has the highest Nagelkerke pseudo-R-squared value (0.90583) among the tested models. Model form:
Y   =   β 0 + ρ W Y   + X β   + W X θ   +   u ,   where :   u   =   λ W u   + ϵ
The results for the Manski model are summarized in Table 3.
All parameters of the GNS model are significant at the α = 0.1. Assuming a significance level of 0.05, we reject the statistical significance of the lag   β 2 . When analyzing the resulting GNS model, we find the presence of spatial interactions between regions (0.7501). The parameter that, on average, 75% of PV installations measured by watts per person “spread” to neighboring regions. Thus, we have an effect that determines the occurrence in a given part of the impacts associated with the impact in the related areas. The installation of photovoltaic installations in neighboring regions affects the decisions in a given region.
The causes of changes in the neighboring regions for ‘number of PV installations per 100 million GDP’ in the region (x1) and ‘salary in thousand PLN’ (x2) also became important. Based on the parameters obtained in the GNS model and adopting the ceteris paribus principle, one can conclude that an increase in ‘number of PV installations per 100 million GDP’ in the region (x1) will result in an increase in the power of the assumed installations by 1.0541 ‘watt per person’. In the case of an increase in salaries by one unit, we also have an increase in watts per person in installations by 3.52105. I would formulate the conclusion related to this since both regression coefficients are positive, which means that increasing ‘number of PV installations per 100 million GDP’ in the region (x1) and ‘salary in thousand PLN’ (x2) will increase the willingness to expand the photovoltaic installation. The autocorrelations related to the causes, i.e., the explanatory variables, are significant and can be interpreted as follows. Changes in ‘number of PV installations per 100 million GDP’ (x1) in neighboring regions affect ‘watt per person’ changes, i.e., if GDP increases in one region, then in the neighboring region, we will observe a decrease in intensity of development of PV systems measured in ‘watt per person’ (−1.96144). Thus, the richer regions will be adjacent to the poorer regions. We have a situation where PV is located in one or two voivodships and it does not spread evenly to the others. It would be a reduction in the possibilities in photovoltaic installations or slower increase then in neighboring regions. In the case of salaries, the increase in salaries in a given region has a positive effect on changes in installations in neighboring regions (2.59639). It may be related to the general situation in the country, i.e., if wages increase, they increase evenly in all regions. The significance of the parameter λ indicates the presence of spatial dependencies of random factors, which can be defined as the mean error in neighboring locations. This error includes unaccounted-for variables or supra-regional characteristics occurring wider than the borders of regions. In this respect, we can see variables that describe recipients’ concerns, cultural variables or weather indicators. According to [90], in the situation of spatial error (λ) modelling, an exogenous shock in a given region will affect not only the case in that region (e.g., economic growth) but also the situation in the neighboring areas due to the presence of spatial dependence error. Considering the pseudo-R-square coefficient, we can conclude that the spatial error, i.e., indicators not included in the GNS model, constitutes approximately 10%.
Figure 9 presents the spatial distribution of residuals in the GNS model. The distribution of residuals in the administrative spatial of Poland is within the mean plus or minus standard deviation range, which may indicate the correctness of the model used and its good prognosis.

6. Discussion

A significant increase in the number of PV installations in individual countries took place in the last ten years due to programs supporting the development of renewable energy sources. Offering prosumers feed-in or similar favorable tariffs for the sale of electricity from PV installations was the main factor in the development of the market [39]. In countries such as Germany, Italy, the UK, and Spain, it led to market saturation within a few years [24,43,44,52,71]. In each of these countries, the feed-in tariff system provided a selling price for electricity at or even higher than the market price [46]. Another critical factor was the decline in the cost of energy production from PV installations. The levelized cost of electricity decreased by 85% from 2010 to 2020, making the electricity production from PV installations profitable even in countries with lower energy prices. As a result, a significant feed-in-tariff reduction was also possible.
In Poland, the support system for PV micro-installations (<50 kW) was launched in 2019. The scheme was based on net-metering rules combined with a fixed subsidies amount for investment costs for systems smaller than 10 kWp. Additionally, households were allowed to take advantage of the tax relief. The ‘Moj Prad’ program turned out to be a great success, as the solutions offered led to a return on investment in 7–8 years for financing from own resources and 10 years for financing investments. This is a similar payback period as that established for household PV installations with net-metering billing in other countries [91], but much shorter than, for example, in Croatia or Spain with net-billing systems [61,92] or for commercial utility-scale PV [93]. A total of 900,000 PV micro-installations were built in a two-and-half-year period, and the total installed capacity increased from 0.2 to 6 GW. Within these years, 7% of households in Poland installed PV systems. Thus, the obtained effect was similar to that observed in other countries introducing support programs, with a similar economic effect for investors.
The interest in investments in PV micro-installations in Poland resulted mainly from end-users achieving grid parity, which was possible due to a significant decrease in the costs of PV systems. The main reason was that net metering was allowed for prosumers, reinforced with subsidies sufficient for 10–20% of investments. Prosumers’ decision to install household PV systems was mainly driven by overall economic factors, such as short payback period and additional subsidies available. Based on the regional analysis, it was found that in Poland, the most crucial factor was the average level of salaries in a given region. Similar results were obtained in the evaluation of PV development in Germany, where it was shown that in the grid parity conditions, the decision to invest in a PV system depends mainly on economic factors connected with household wealth [71]. Surprisingly, it was also observed that the level of GDP in individual regions did not affect the intensity of investments in prosumer PV installations. The level of installation saturation was, on average, higher in regions with lower GDP. This could be because an average of 7% of households installed PV, and this concerned the wealthiest households in each region. Additional reasons are the greater levels of urbanization in more affluent regions and the high availability of ever-cheaper PV installations even for middle-income households.
It has also been established that there is an imitation effect in the dissemination of residential PV installations, given the intensity of investment in the regions. The neighboring regions with a higher prevalence of PV micro-installations positively stimulated investments in such installations in other regions. This confirms the findings of Dastrup et al. [19], showing that the visibility of PV systems leads to significant social multiplication effects. Confirmation of the positive effects of PV use by other members of society may be the basis for the decision to introduce such innovation in subsequent households [94], which seems to be confirmed in our research.
Finally, it is worth noting that the further expansion of PV systems must consider the possibility of using the energy generated in a given region due to the problems of energy transmission in extensive distribution networks and the related losses. For this reason, investments in micro-energy sources should consider the possibility of supplying urbanized and industrialized areas. It is also worth supporting energy balancing within energy communities and smart grids.

7. Limitations

The presented study and the results obtained are subject to certain limitations. For example, in our research, it was impossible to collect data for variables indicated in the literature as potentially necessary, e.g., the number of single-family houses and the number and share of people living in multi-family blocks of flats. Additionally, due to the correlation between variables, such variables as the unemployment rate or the share of the economically active population were not included in the model. Instead, the salary per person variable was entered into the model as the most correlated with the amount of installed capacity by region. Another limitation is the lack of detailed information on households, e.g., their economic status, reasons for being interested in installing a PV system, and reasons for deciding to invest in a PV system. Therefore, the results are less detailed and relate to the assessment based on regional averages. Because the data on prosumer photovoltaic micro-installations are only available in total for the country and at the level of provinces (NUTS-2), it is impossible to define in detail the spatial regimes for lower aggregation levels, which could better explain the nature of the interdependence. Since some large regions are strongly internally differentiated, this may interfere with the precision of the results. Certain important factors may have been considered insignificant under such conditions. Additionally, the Manski model is rarely used due to its exaggerated specification. The presented results concern the primary factors of the development of prosumer energy in Poland.
In-depth analyses require collecting data at a lower level of aggregation and directly from prosumers to more accurately determine the reasons for investing in prosumer solar PV systems.

Author Contributions

Conceptualization and methodology, L.W. and R.P.; data collection, L.W.; validation, R.P., investigation, L.W. and D.K., data curation, R.P.; writing—original draft preparation, L.W., R.P. and D.K.; writing—review and editing, L.W.; funding acquisition, R.P. and D.K. All authors have read and agreed to the published version of the manuscript.

Funding

This research received no external funding.

Institutional Review Board Statement

Not applicable.

Informed Consent Statement

Not applicable.

Data Availability Statement

The data used in the model is available upon request from the authors.

Acknowledgments

We want to thank the anonymous reviewers for their valuable comments that contributed to the improvement of our study.

Conflicts of Interest

The authors declare no conflict of interest.

Abbreviations

BESSbattery energy storage system
FITfeed-in-tariff
GDPGross Domestic Product
GNSgeneral nesting spatial model
GWgigawatt
GWhgigawatt hour
kWkilowatt
kWpkilowatt ‘peak’ power output of a system
LCOElevelized cost of energy
MP‘Moj Prad’ program in Poland
MP1first edition of ‘Moj Prad’ program in Poland
MP2second edition of ‘Moj Prad’ program in Poland
MWhmegawatt hour
NUTS-2the second level of administrative divisions, a region in lower administrative level than the country—according to nomenclature of territorial units for statistics
PVphotovoltaic
RESrenewable energy sources
SACKelejian-Prucha model
SARspatial autoregressive model
SDEMspatial Durbin error model
SDMspatial Durbin model
SEMspatial error model
SLXspatial lag of X model

References

  1. IEA. World Energy Outlook 2021; International Energy Agency: Paris, France, 2021. [Google Scholar]
  2. Jäger-Waldau, A. Snapshot of Photovoltaics—February 2018. EPJ Photovolt. 2018, 9, 6. [Google Scholar] [CrossRef]
  3. Abrell, J.; Kosch, M.; Rausch, S. Carbon Abatement with Renewables: Evaluating Wind and Solar Subsidies in Germany and Spain. J. Public Econ. 2019, 169, 172–202. [Google Scholar] [CrossRef]
  4. REN21. Renewables 2021 Global Status Report; Renewable Energy Policy Network for the 21st Century: Paris, France, 2021; ISBN 978-3-948393-03-8. [Google Scholar]
  5. European Parliament. The European Parliament and of the Council Directive (EU) 2018/2001 of the European Parliament and of the Council of 11 December 2018 on the Promotion of the Use of Energy from Renewable Sources; European Parliament: Strasbourg, France, 2018. [Google Scholar]
  6. Wicki, L. Development of Biofuels Production from Agricultural Raw Materials. In Proceedings of the 8th International Scientific Conference Rural Development, Kaunas, Lithuania, 23–24 November 2017; pp. 502–508. [Google Scholar] [CrossRef]
  7. Wicki, L. Food and Bioenergy—Evidence from Poland. In Proceedings of the 2017 International Conference “Economic Science for Rural Development”, Jelgava, Latvia, 27–28 April 2017; pp. 299–305. [Google Scholar]
  8. Kougias, I.; Taylor, N.; Kakoulaki, G.; Jäger-Waldau, A. The Role of Photovoltaics for the European Green Deal and the Recovery Plan. Renew. Sustain. Energy Rev. 2021, 144, 111017. [Google Scholar] [CrossRef]
  9. Karneyeva, Y.; Wüstenhagen, R. Solar Feed-in Tariffs in a Post-Grid Parity World: The Role of Risk, Investor Diversity and Business Models. Energy Policy 2017, 106, 445–456. [Google Scholar] [CrossRef]
  10. Spertino, F.; Di Leo, P.; Cocina, V. Which Are the Constraints to the Photovoltaic Grid-Parity in the Main European Markets? Sol. Energy 2014, 105, 390–400. [Google Scholar] [CrossRef]
  11. IRENA. Renewable Power Generation Costs in 2020; International Renewable Energy Agency: Abu Dhabi, United Arab Emirates, 2021; ISBN 978-92-9260-348-9. [Google Scholar]
  12. Giaccaria, S.; Longo, A.; Bouman, T.; Efthimiadis, T. Valuing (In) Security of Electricity Supply: A Discrete Choice Experiment for Estonia, the Netherlands and Portugal. In Proceedings of the 3rd AIEE Energy Symposium. Current and Future Challenges to Energy Security, Rome, Italy, 10–12 December 2018; pp. 44–46. [Google Scholar]
  13. Diaz-Rainey, I.; Tzavara, D. Financing the Decarbonized Energy System through Green Electricity Tariffs: A Diffusion Model of an Induced Consumer Environmental Market. Technol. Forecast. Soc. Chang. 2012, 79, 1693–1704. [Google Scholar] [CrossRef]
  14. Pelagatti, M.; Gianfreda, A.; Parisio, L. Trends and Long-Run Relations in Electricity Prices: Why Prefiltering Is Inevitable. In Proceedings of the 3rd AIEE Energy Symposium. Current and Future Challenges to Energy Security, Rome, Italy, 10–12 December 2018; pp. 39–40. [Google Scholar]
  15. Zhang, L.; Du, Q.; Zhou, D. Grid Parity Analysis of China’s Centralized Photovoltaic Generation under Multiple Uncertainties. Energies 2021, 14, 1814. [Google Scholar] [CrossRef]
  16. Olczak, P.; Żelazna, A.; Matuszewska, D.; Olek, M. The “My Electricity” Program as One of the Ways to Reduce CO2 Emissions in Poland. Energies 2021, 14, 7679. [Google Scholar] [CrossRef]
  17. Instytut Energetyki Odnawialnej Podsumowanie Aukcji OZE w 2021 Roku. Available online: https://www.ieo.pl/pl/aktualnosci/1547-podsumowanie-aukcji-oze-w-2021-roku (accessed on 27 July 2022).
  18. Dastrup, S.R.; Graff Zivin, J.; Costa, D.L.; Kahn, M.E. Understanding the Solar Home Price Premium: Electricity Generation and “Green” Social Status. Eur. Econ. Rev. 2012, 56, 961–973. [Google Scholar] [CrossRef]
  19. NFOSIGW Program Dofinansowania Mikroinstalacji Fotowoltaicznych. Available online: https://mojprad.gov.pl/ (accessed on 10 June 2022).
  20. Statistics Poland Platforma Analityczna SWAiD-Dziedzinowe Bazy Wiedzy. Available online: http://swaid.stat.gov.pl/SitePages/StronaGlownaDBW.aspx (accessed on 10 September 2021).
  21. UN FCCC. Adoption of the Paris Agreement. Proposal by the President; United Nations: Geneva, Switzerland, 2015. [Google Scholar]
  22. Wicki, L. Changes in Land Use for Production of Energy Crops in Poland. Ann. Agric. Econ. Rural Dev. 2017, 104, 37–47. [Google Scholar] [CrossRef]
  23. Iskandarova, M.; Dembek, A.; Fraaije, M.; Matthews, W.; Stasik, A.; Wittmayer, J.M.; Sovacool, B.K. Who Finances Renewable Energy in Europe? Examining Temporality, Authority and Contestation in Solar and Wind Subsidies in Poland, the Netherlands and the United Kingdom. Energy Strategy Rev. 2021, 38, 100730. [Google Scholar] [CrossRef]
  24. Cucchiella, F.; D’Adamo, I.; Gastaldi, M. Economic Analysis of a Photovoltaic System: A Resource for Residential Households. Energies 2017, 10, 814. [Google Scholar] [CrossRef]
  25. Sarasa-Maestro, C.J.; Dufo-López, R.; Bernal-Agustín, J.L. Analysis of Photovoltaic Self-Consumption Systems. Energies 2016, 9, 681. [Google Scholar] [CrossRef]
  26. Ziemińska-Stolarska, A.; Pietrzak, M.; Zbiciński, I. Application of LCA to Determine Environmental Impact of Concentrated Photovoltaic Solar Panels—State-of-the-Art. Energies 2021, 14, 3143. [Google Scholar] [CrossRef]
  27. Kopecek, R.; Libal, J. Bifacial Photovoltaics 2021: Status, Opportunities and Challenges. Energies 2021, 14, 2076. [Google Scholar] [CrossRef]
  28. IEA; NEA. Projected Costs of Generating Electricity; International Energy Agency, OECD Nuclear Energy Agency: Paris, France, 2020. [Google Scholar]
  29. Viola, F.; Romano, P.; Sanseverino, E.R.; Miceli, R.; Cardinale, M.; Schettino, G. An Economic Study about the Installation of PV Plants Reconfiguration Systems in Italy. In Proceedings of the 2014 International Conference on Renewable Energy Research and Application (ICRERA), Milwaukee, WI, USA, 19–22 October 2014; pp. 989–994. [Google Scholar]
  30. Khuong, P.M.; McKenna, R.; Fichtner, W. A Cost-Effective and Transferable Methodology for Rooftop PV Potential Assessment in Developing Countries. Energies 2020, 13, 2501. [Google Scholar] [CrossRef]
  31. Dávi, G.A.; De Asiain, J.L.; Solano, J.; Caamaño-Martín, E.; Bedoya, C. Energy Refurbishment of an Office Building with Hybrid Photovoltaic System and Demand-Side Management. Energies 2017, 10, 1117. [Google Scholar] [CrossRef]
  32. Niedermeyer, F.; Braun, M. Comparison of Performance-Assessment Methods for Residential PV Battery Systems. Energies 2020, 13, 5529. [Google Scholar] [CrossRef]
  33. Olivella, J.; Domenech, B.; Calleja, G. Potential of Implementation of Residential Photovoltaics at City Level: The Case of London. Renew. Energy 2021, 180, 577–585. [Google Scholar] [CrossRef]
  34. Zsiborács, H.; Hegedűsné Baranyai, N.; Vincze, A.; Háber, I.; Pintér, G. Economic and Technical Aspects of Flexible Storage Photovoltaic Systems in Europe. Energies 2018, 11, 1445. [Google Scholar] [CrossRef]
  35. Castaneda, M.; Zapata, S.; Cherni, J.; Aristizabal, A.J.; Dyner, I. The Long-Term Effects of Cautious Feed-in Tariff Reductions on Photovoltaic Generation in the UK Residential Sector. Renew. Energy 2020, 155, 1432–1443. [Google Scholar] [CrossRef]
  36. Alipour, M.; Stewart, R.A.; Sahin, O. Beyond the Diffusion of Residential Solar Photovoltaic Systems at Scale: Allegorising the Battery Energy Storage Adoption Behaviour. Energies 2021, 14, 5015. [Google Scholar] [CrossRef]
  37. Javeed, I.; Khezri, R.; Mahmoudi, A.; Yazdani, A.; Shafiullah, G.M. Optimal Sizing of Rooftop Pv and Battery Storage for Grid-Connected Houses Considering Flat and Time-of-Use Electricity Rates. Energies 2021, 14, 3520. [Google Scholar] [CrossRef]
  38. Yang, C.J. Reconsidering Solar Grid Parity. Energy Policy 2010, 38, 3270–3273. [Google Scholar] [CrossRef]
  39. Budin, L.; Grdenić, G.; Delimar, M. A Quadratically Constrained Optimization Problem for Determining the Optimal Nominal Power of a Pv System in Net-Metering Model: A Case Study for Croatia. Energies 2021, 14, 1746. [Google Scholar] [CrossRef]
  40. Martín, H.; Coronas, S.; Alonso, À.; De La Hoz, J.; Matas, J. Renewable Energy Auction Prices: Near Subsidy-Free? Energies 2020, 13, 3383. [Google Scholar] [CrossRef]
  41. Panos, E.; Margelou, S. Long-Term Solar Photovoltaics Penetration in Single- and Two-Family Houses in Switzerland. Energies 2019, 12, 2460. [Google Scholar] [CrossRef]
  42. Sgroi, F.; Tudisca, S.; Di Trapani, A.M.; Testa, R.; Squatrito, R. Efficacy and Efficiency of Italian Energy Policy: The Case of PV Systems in Greenhouse Farms. Energies 2014, 7, 3985–4001. [Google Scholar] [CrossRef]
  43. Bhandari, R.; Stadler, I. Grid Parity Analysis of Solar Photovoltaic Systems in Germany Using Experience Curves. Sol. Energy 2009, 83, 1634–1644. [Google Scholar] [CrossRef]
  44. Nolden, C. Performance and Impact of the Feed-in Tariff Scheme: Review of Evidence Final Report; Department of Energy & Climate Changes: London, UK, 2015. [Google Scholar]
  45. Di Dio, V.; Favuzza, S.; La Cascia, D.; Massaro, F.; Zizzo, G. Critical Assessment of Support for the Evolution of Photovoltaics and Feed-in Tariff(s) in Italy. Sustain. Energy Technol. Assess. 2015, 9, 95–104. [Google Scholar] [CrossRef]
  46. Christoforidis, G.C.; Panapakidis, I.P.; Papadopoulos, T.A.; Papagiannis, G.K.; Koumparou, I.; Hadjipanayi, M.; Georghiou, G.E. A Model for the Assessment of Different Net-Metering Policies. Energies 2016, 9, 262. [Google Scholar] [CrossRef]
  47. Assereto, M.; Byrne, J. The Implications of Policy Uncertainty on Solar Photovoltaic Investment. Energies 2020, 13, 6233. [Google Scholar] [CrossRef]
  48. Pierro, M.; Moser, D.; Perez, R.; Cornaro, C. The Value of PV Power Forecast and the Paradox of the “Single Pricing” Scheme: The Italian Case Study. Energies 2020, 13, 3945. [Google Scholar] [CrossRef]
  49. Iwaszczuk, N.; Trela, M. Analysis of the Impact of the Assumed Moment of Meeting Total Energy Demand on the Profitability of Photovoltaic Installations for Households in Poland. Energies 2021, 14, 1637. [Google Scholar] [CrossRef]
  50. Kamran, M.; Fazal, R.M.; Mudassar, M.; Shah, R.A.; Adnan, M.; Abid, I.; Randhawa, F.J.S.; Shams, H. Solar Photovoltaic Grid Parity: A Review of Issues, Challenges and Status of Different PV Markets. Int. J. Renew. Energy Res. 2019, 9, 244–260. [Google Scholar] [CrossRef]
  51. Panapakidis, I.P.; Koltsaklis, N.; Christoforidis, G.C. A Novel Integrated Profit Maximization Model for Retailers under Varied Penetration Levels of Photovoltaic Systems. Energies 2021, 14, 92. [Google Scholar] [CrossRef]
  52. Squatrito, R.; Sgroi, F.; Tudisca, S.; di Trapani, A.M.; Testa, R. Post Feed-in Scheme Photovoltaic System Feasibility Evaluation in Italy: Sicilian Case Studies. Energies 2014, 7, 7147–7165. [Google Scholar] [CrossRef]
  53. Chen, C.N.; Yang, C.T. The Investability of PV Systems under Descending Feed-in Tariffs: Taiwan Case. Energies 2021, 14, 2728. [Google Scholar] [CrossRef]
  54. Gholami, H.; Røstvik, H.N. Levelised Cost of Electricity (Lcoe) of Building Integrated Photovoltaics (Bipv) in Europe, Rational Feed-in Tariffs and Subsidies. Energies 2021, 14, 2531. [Google Scholar] [CrossRef]
  55. Vartiainen, E.; Masson, G.; Breyer, C.; Moser, D.; Román Medina, E. Impact of Weighted Average Cost of Capital, Capital Expenditure, and Other Parameters on Future Utility-Scale PV Levelised Cost of Electricity. Prog. Photovolt. Res. Appl. 2020, 28, 439–453. [Google Scholar] [CrossRef]
  56. Palmer, J.; Sorda, G.; Madlener, R. Modeling the Diffusion of Residential Photovoltaic Systems in Italy: An Agent-Based Simulation. Technol. Forecast. Soc. Chang. 2015, 99, 106–131. [Google Scholar] [CrossRef]
  57. Nakano, S.; Washizu, A. On the Acceptability of Electricity Demand Side Management by Time of Day. Energies 2020, 13, 3665. [Google Scholar] [CrossRef]
  58. McKenna, E.; Pless, J.; Darby, S.J. Solar Photovoltaic Self-Consumption in the UK Residential Sector: New Estimates from a Smart Grid Demonstration Project. Energy Policy 2018, 118, 482–491. [Google Scholar] [CrossRef]
  59. Chiaroni, D.; Chiesa, V.; Colasanti, L.; Cucchiella, F.; D’Adamo, I.; Frattini, F. Evaluating Solar Energy Profitability: A Focus on the Role of Self-Consumption. Energy Convers. Manag. 2014, 88, 317–331. [Google Scholar] [CrossRef]
  60. Szeląg-Sikora, A.; Sikora, J.; Niemiec, M.; Gródek-Szostak, Z.; Suder, M.; Kuboń, M.; Borkowski, T.; Malik, G. Solar Power: Stellar Profit or Astronomic Cost? A Case Study of Photovoltaic Installations under Poland’s National Prosumer Policy in 2016–2020. Energies 2021, 14, 4233. [Google Scholar] [CrossRef]
  61. Šimić, Z.; Topić, D.; Crnogorac, I.; Knežević, G. Method for Sizing of a PV System for Family Home Using Economic Indicators. Energies 2021, 14, 4529. [Google Scholar] [CrossRef]
  62. Wierling, A.; Zeiss, J.P.; Lupi, V.; Candelise, C.; Sciullo, A.; Schwanitz, V.J. The Contribution of Energy Communities to the Upscaling of Photovoltaics in Germany and Italy. Energies 2021, 14, 2258. [Google Scholar] [CrossRef]
  63. Błażejowska, M.; Gostomczyk, W. Warunki Tworzenia i Stan Rozwoju Spółdzielni i Klastrów Energetycznych w Polsce Na Tle Doświadczeń Niemieckich. Zesz. Nauk. SGGW W Warszawie-Probl. Rol. Światowego 2018, 18, 20–32. [Google Scholar] [CrossRef]
  64. Sudhoff, R.; Schreck, S.; Thiem, S.; Niessen, S. Operating Renewable Energy Communities to Reduce Power Peaks in the Distribution Grid: An Analysis on Grid-Friendliness, Different Shares of Participants, and Economic Benefits. Energies 2022, 15, 5468. [Google Scholar] [CrossRef]
  65. Kaldellis, J.K. Supporting the Clean Electrification for Remote Islands: The Case of the Greek Tilos Island. Energies 2021, 14, 1336. [Google Scholar] [CrossRef]
  66. Sospiro, P.; Amarnath, L.; di Nardo, V.; Talluri, G.; Gandoman, F.H. Smart Grid in China, EU, and the US: State of Implementation. Energies 2021, 14, 5637. [Google Scholar] [CrossRef]
  67. Antonanzas-Torres, F.; Antonanzas, J.; Blanco-Fernandez, J. State-of-the-Art of Mini Grids for Rural Electrification in West Africa. Energies 2021, 14, 990. [Google Scholar] [CrossRef]
  68. Alkholidi, A.; Hamam, H. Solar Energy Potentials in Southeastern European Countries: A Case Study. Int. J. Smart Grid 2019, 3, 108–119. [Google Scholar]
  69. Al-Ghussain, L.; Abujubbeh, M.; Darwish Ahmad, A.; Abubaker, A.M.; Taylan, O.; Fahrioglu, M.; Akafuah, N.K. 100% Renewable Energy Grid for Rural Electrification of Remote Areas: A Case Study in Jordan. Energies 2020, 13, 4908. [Google Scholar] [CrossRef]
  70. Sigrin, B.; Pless, J.; Drury, E. Diffusion into New Markets: Evolving Customer Segments in the Solar Photovoltaics Market. Environ. Res. Lett. 2015, 10, 84001. [Google Scholar] [CrossRef]
  71. Dharshing, S. Household Dynamics of Technology Adoption: A Spatial Econometric Analysis of Residential Solar Photovoltaic (PV) Systems in Germany. Energy Res. Soc. Sci. 2017, 23, 113–124. [Google Scholar] [CrossRef]
  72. Tomasi, S. The (Non) Impact of the Spanish “Tax on the Sun” on Photovoltaics Prosumers Uptake. Energy Policy 2022, 168, 113041. [Google Scholar] [CrossRef]
  73. Kowalska-Pyzalska, A. An Empirical Analysis of Green Electricity Adoption Among Residential Consumers in Poland. Sustainability 2018, 10, 2281. [Google Scholar] [CrossRef]
  74. Petrovich, B.; Hille, S.; Carattini, S.; Wustenhagen, R. Residential Solar Pv Investment: The Role of Beauty, Budget and Risk. In Proceedings of the 3rd AIEE Energy Symposium Current and Future Challenges to Energy Security, Rome, Italy, 10–12 December 2018; pp. 11–12. [Google Scholar]
  75. Balakumar, P.; Vinopraba, T.; Sankar, S.; Santhoshkumar, S.; Chandrasekaran, K. Smart Hybrid Microgrid for Effective Distributed Renewable Energy Sharing of PV Prosumers. J. Energy Storage 2022, 49, 104033. [Google Scholar] [CrossRef]
  76. Celik, I.; Ahangharnejhad, R.H.; Song, Z.; Heben, M.; Apul, D. Emerging Photovoltaic (PV) Materials for a Low Carbon Economy. Energies 2020, 13, 4131. [Google Scholar] [CrossRef]
  77. EUROSTAT Gross and Net Production of Electricity and Derived Heat by Type of Plant and Operator. Available online: https://ec.europa.eu/eurostat/databrowser/product/page/NRG_IND_PEH__custom_2430601 (accessed on 13 April 2022).
  78. PTPiREE Mikroinstalacje w Polsce. Available online: http://www.ptpiree.pl/energetyka-w-polsce/energetyka-w-liczbach/mikroinstalacje-w-polsce (accessed on 30 April 2022).
  79. ARE S.A. Informacja Statystyczna o Energii Elektrycznej Nr 12 (324); Agencja Rynku Energii S.A.: Warsaw, Poland, 2021. [Google Scholar]
  80. MKiS; ARE S.A. Informacja Statystyczna o Energii Elektrycznej Nr 12 (336); Ministerstwo Klimatu i Środowiska, Agencja Rynku Energii S.A.: Warsaw, Poland, 2022. [Google Scholar]
  81. LeSage, J.P. What Regional Scientists Need to Know about Spatial Econometrics. Rev. Region. Stud. 2014, 13–32. [Google Scholar] [CrossRef]
  82. Elhorst, J.P. Applied Spatial Econometrics: Raising the Bar. Spat. Econ. Anal. 2010, 5, 9–28. [Google Scholar] [CrossRef]
  83. Getis, A.; Aldstadt, J. Constructing the Spatial Weights Matrix Using a Local Statistic. Geogr. Anal. 2004, 36, 90–104. [Google Scholar] [CrossRef]
  84. Antczak, E. Building W Matrices Using Selected Geostatistical Tools: Empirical Examination and Application. Stats 2018, 1, 112–133. [Google Scholar] [CrossRef]
  85. Cliff, A.D.; Ord, J.K. Spatial Autocorrelation; Pion: London, UK, 1973. [Google Scholar]
  86. Anselin, L. Lagrange Multiplier Test Diagnostics for Spatial Dependence and Spatial Heterogeneity. Geogr. Anal. 1988, 20, 1–17. [Google Scholar] [CrossRef]
  87. Pietrzykowski, R. Klasyfikacja Obiektów w Ujęciu Czasowo-Przestrzennym z Zastosowaniem Analizy Funkcjonalnej. Pr. Nauk. Uniw. Ekon. We Wrocławiu 2018, 508, 170–179. [Google Scholar] [CrossRef]
  88. Pietrzykowski, R. Application of Spatial Techniques for Panel Data Analysis of Agricultural Real Estate Market in the Years 2004–2012. Metod. Ilościowe W Bad. Ekon. 2014, 15, 188–197. [Google Scholar]
  89. Pietrzykowski, R. Concept and Application Matrix Weight Modifications in Spatial Economic Research. Quant. Methods Econ. 2011, 12, 270–278. [Google Scholar]
  90. Rey, S.J.; Montouri, B.D. US Regional Income Convergence: A Spatial Econometric Perspective. Reg. Stud. 1999, 33, 143–156. [Google Scholar] [CrossRef]
  91. Rauf, A.; Al-Awami, A.T.; Kassas, M.; Khalid, M. Optimal Sizing and Cost Minimization of Solar Photovoltaic Power System Considering Economical Perspectives and Net Metering Schemes. Electronics 2021, 10, 2713. [Google Scholar] [CrossRef]
  92. Talavera, D.L.; Muñoz-Cerón, E.; De La Casa, J.; Lozano-Arjona, D.; Theristis, M.; Pérez-Higueras, P.J. Complete Procedure for the Economic, Financial and Cost-Competitiveness of Photovoltaic Systems with Self-Consumption. Energies 2019, 12, 345. [Google Scholar] [CrossRef]
  93. Brodziński, Z.; Brodzińska, K.; Szadziun, M. Photovoltaic Farms—Economic Efficiency of Investments in North-East Poland. Energies 2021, 14, 2087. [Google Scholar] [CrossRef]
  94. Wilson, C.; Dowlatabadi, H. Models of Decision Making and Residential Energy Use. Annu. Rev. Environ. Resour. 2007, 32, 169–203. [Google Scholar] [CrossRef]
Figure 1. Share of solar energy in structure of electricity production in EU in the period 2005–2020. Based on data from [77].
Energies 15 05897 g001
Figure 2. Installed capacity and the number of PV micro-installations (<50 kWp) in Poland in 2015–2022. Based on data from [78].
Energies 15 05897 g002
Figure 3. Production of electricity from PV installation and share of PV sources in electricity production in Poland in 2019–2021. Based on data from [79,80].
Energies 15 05897 g003
Figure 4. The relationships between different spatial dependence models for cross-section data.
Energies 15 05897 g004
Figure 5. Classification of types of spatial weight matrices according to the way they are constructed.
Energies 15 05897 g005
Figure 6. Spatial distribution of variables describing photovoltaic installations. (a) Total installed capacity by regions in kW. (b) Power capacity in watts per capita by regions. (c) Power per one installation in regions in kW. (d) Number of PV installations in regions. (e) Number of PV installations per million inhabitants. (f) Number of PV installations per million households.
Energies 15 05897 g006aEnergies 15 05897 g006b
Figure 7. Spatial distribution of economic variables. (a) Salary in thousand PLN. (b) Total subsidies to micro PV systems in PLN. (c) Number of PV installations per 100 million GDP in the region.
Energies 15 05897 g007
Figure 8. Pearson’s correlation coefficients and histograms for the research variables. y: ‘power capacity in watts per person’; x1: ‘number of PV installations per 100 million GDP’; x2: ‘salary in thousand PLN’; correlation coefficients are at the intersection of columns and rows; *, ** denote the 5% and 1% significance levels, respectively.
Energies 15 05897 g008
Figure 9. Spatial distribution of residuals with the value of deviations from the mean in the GNS model.
Energies 15 05897 g009
Table 1. The number of micro photovoltaic installations, photovoltaic capacity and the main features of the regions of Poland.
RegionPV micro-Systems 1PV Capacity 1PopulationHouseholdAverage SalaryGDP
numberMWmillionthousandthousand PLNbillion PLN
Dolnoslaskie13,90684.32.9011005.32175.7
Kujawsko-pomorskie961957.02.077294.4993.3
Lubelskie10,08053.02.117424.5679.5
Lubuskie493230.11.013654.5646.1
Lodzkie12,60574.42.459444.79127.0
Malopolskie23,212130.33.4110805.10172.7
Mazowieckie23,189129.45.4219436.25477.9
Opolskie617538.50.983544.7143.4
Podkarpackie18,15687.52.136494.3983.1
Podlaskie436523.61.184174.5846.9
Pomorskie12,00767.32.348065.14125.0
Slaskie25,384144.54.5217285.18260.5
Swietokrzyskie775440.01.234294.4949.7
Warminsko-mazurskie609835.01.425164.3254.5
Wielkopolskie24,529136.93.5011294.69208.2
Zachodniopomorskie586533.81.706394.7778.3
1 As of the end of May 2021.
Table 2. Analysis results for the standard regression model (Formula (9)).
ParametersEstimation of ParametersStandard Errorp-Value 1
β 0 11.95623.35460.00346 ***
β 1 1.11690.26670.00106 ***
β 2 2.22310.71930.0860 *
1 significance level α = * 0.1, *** 0.01.
Table 3. Estimation results of the Manski spatial model (GNS—Formula (10)).
ParameterEstimation of ParameterStandard Errorp-Value 1
β 0 0.936582.887760.74569
β 1 1.054120.161687.039 × 10−11 ***
β 2 3.521050.515218.244 × 10−12 ***
lag   β 1 −1.961440.310112.531 × 10−10 ***
lag   β 2 2.596391.413900.06631 *
ρ 0.75010.16414.8257 × 10−6 ***
λ −0.91510.39380.0201 **
1 significance level α = * 0.1, ** 0.05, *** 0.01.
Publisher’s Note: MDPI stays neutral with regard to jurisdictional claims in published maps and institutional affiliations.

