
The Use of Geomaterials to Restore the Utility Value of Post-Mining Areas


Abstract
:1. Introduction
- –
- Construction of reinforced embankments and retaining structures.
- –
- Strengthening the upper subsoil layer of road surfaces.
- –
- Strengthening the weak subsoil of road embankments and protective dikes.
- –
- Reinforcement of the bottom layers of the foundation.
- –
- Improve the load-bearing capacity of the subsoil and foundation and its reinforcement (filling, compaction, and consolidation).
- –
- Provide structural support (filling voids).
2. Area Protection and Improvement of Soil Bearing Capacity
2.1. Geosynthetics
2.1.1. Origin of the Use of Geosynthetics
2.1.2. Tensile Strength of Geosynthetics as a Basic Parameter
2.1.3. Polymers Used in the Production of Geosynthetics
2.1.4. Guidelines and Standards
2.1.5. Limit State Method: First Ultimate Limit State
2.1.6. Second Ultimate Limit State
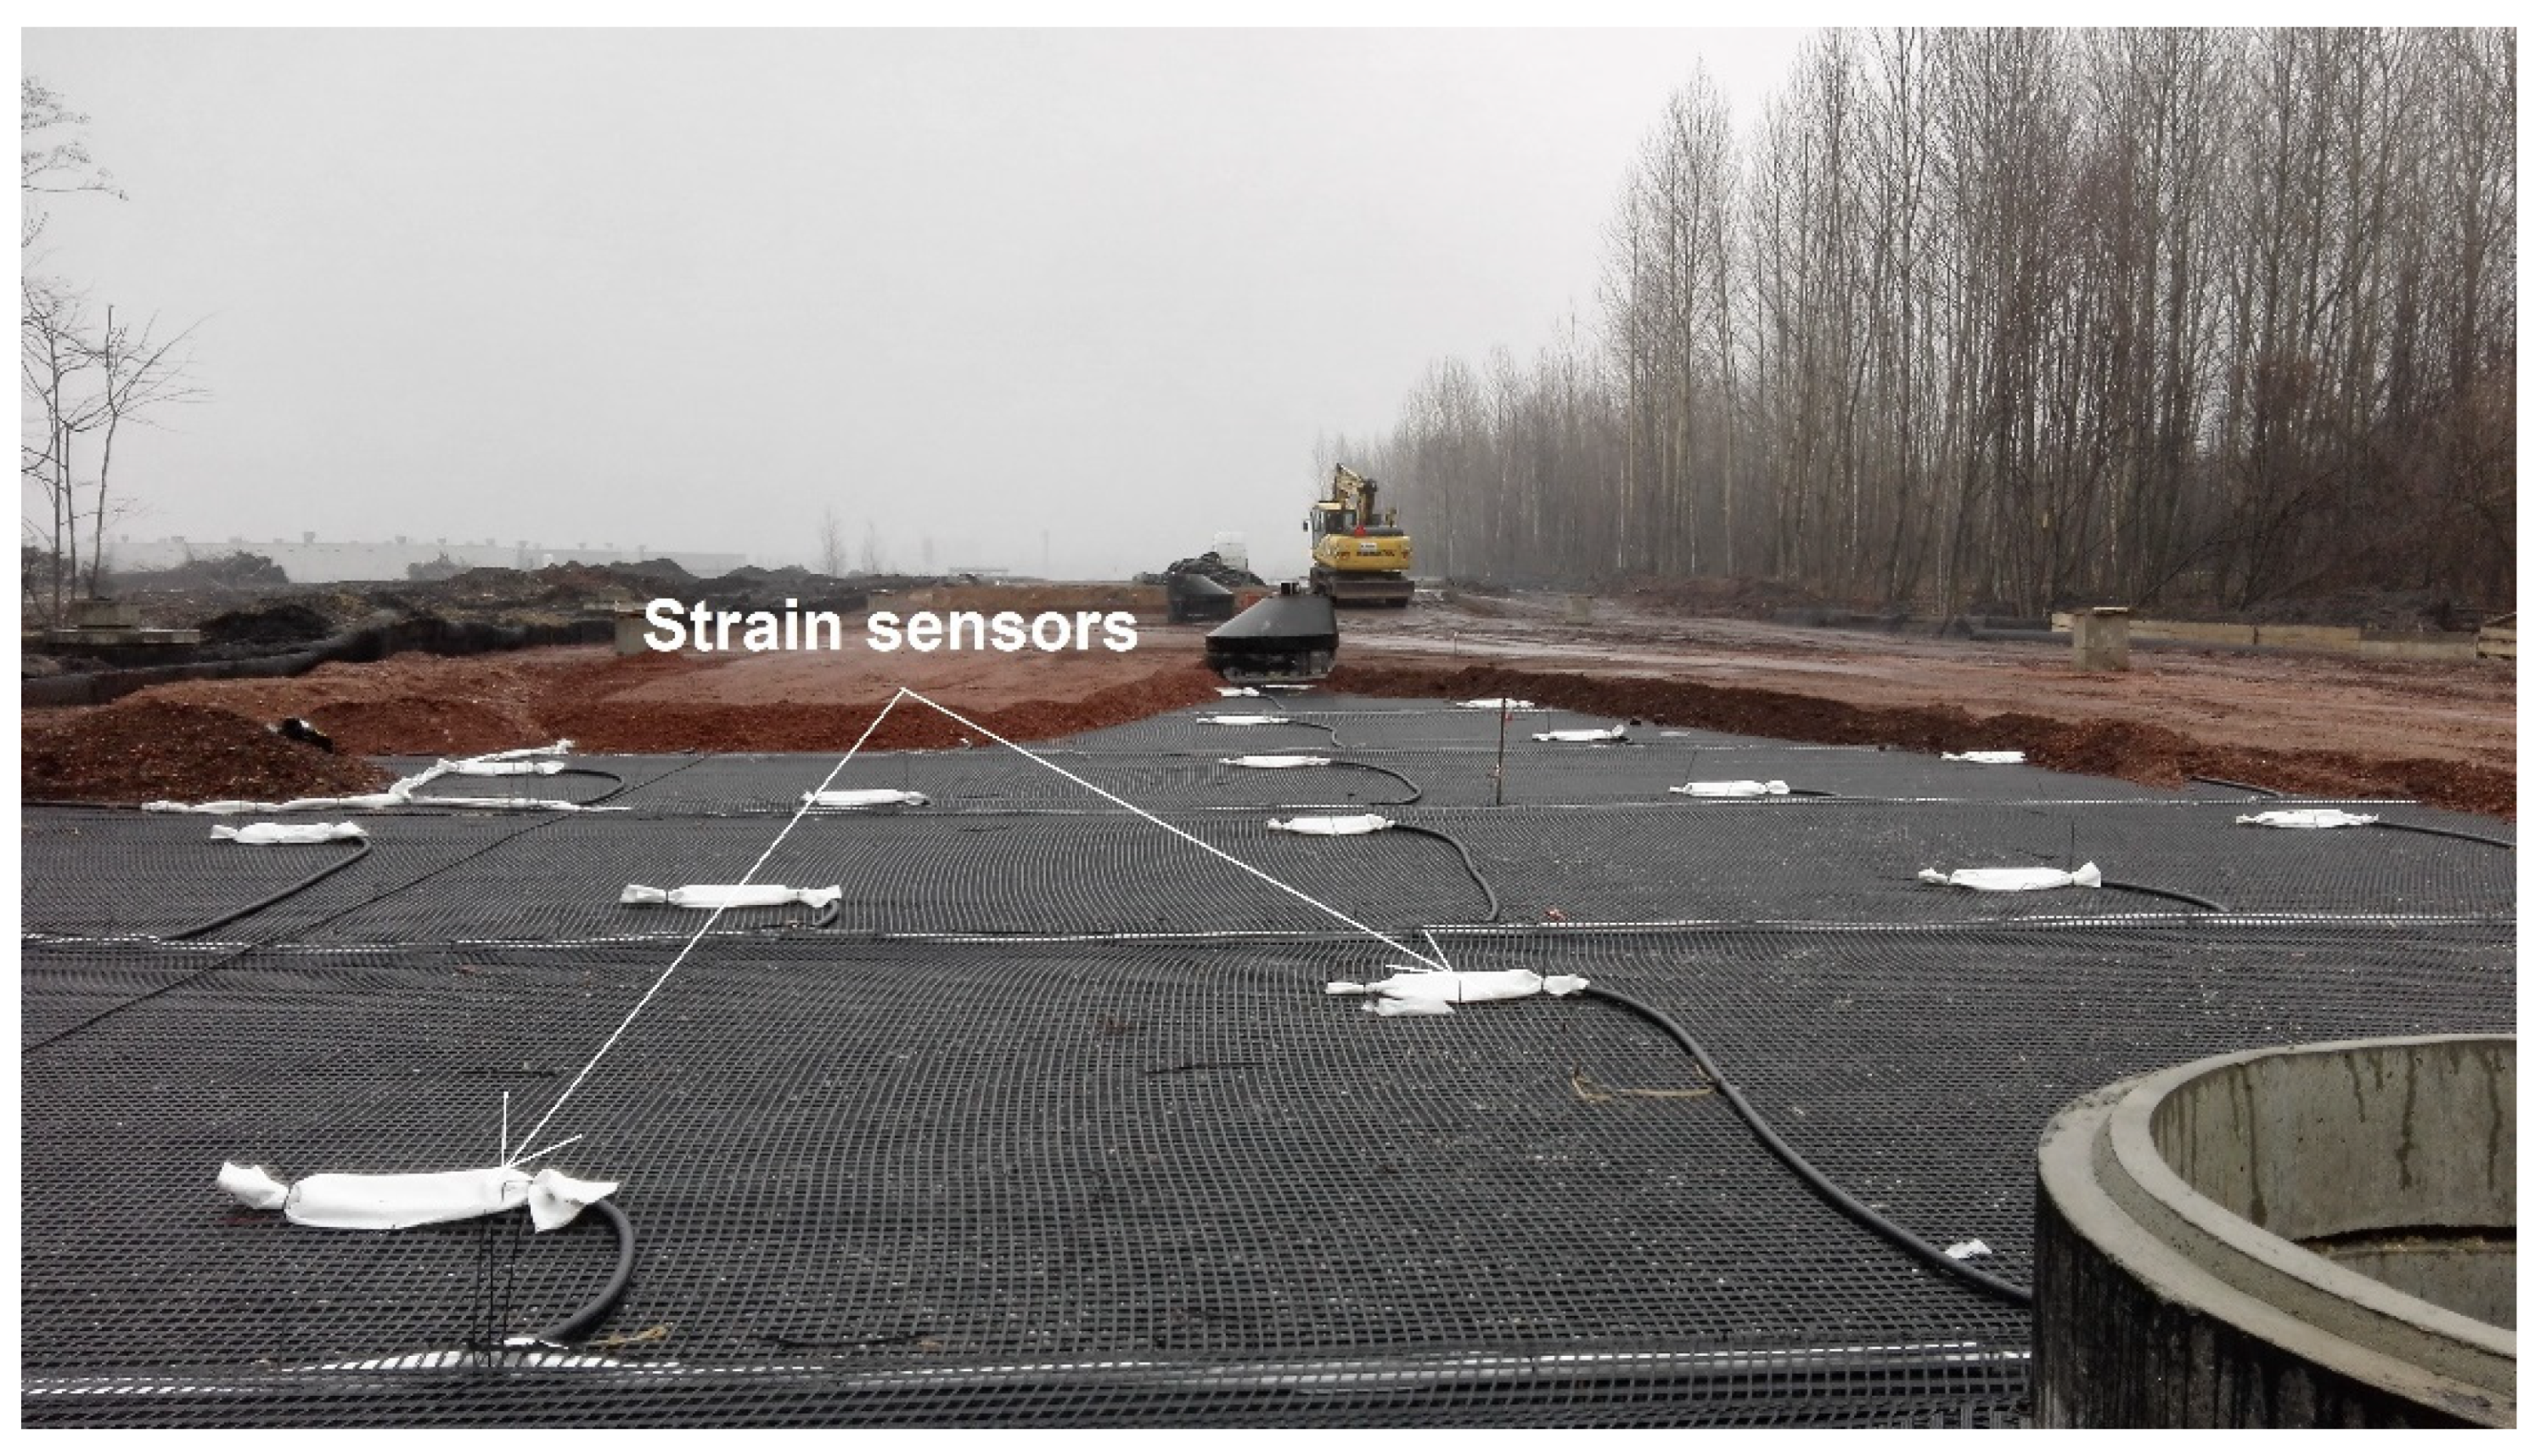
2.1.7. Example of Application of Geosynthetics as Horizontal Reinforcement
2.1.8. Monitoring
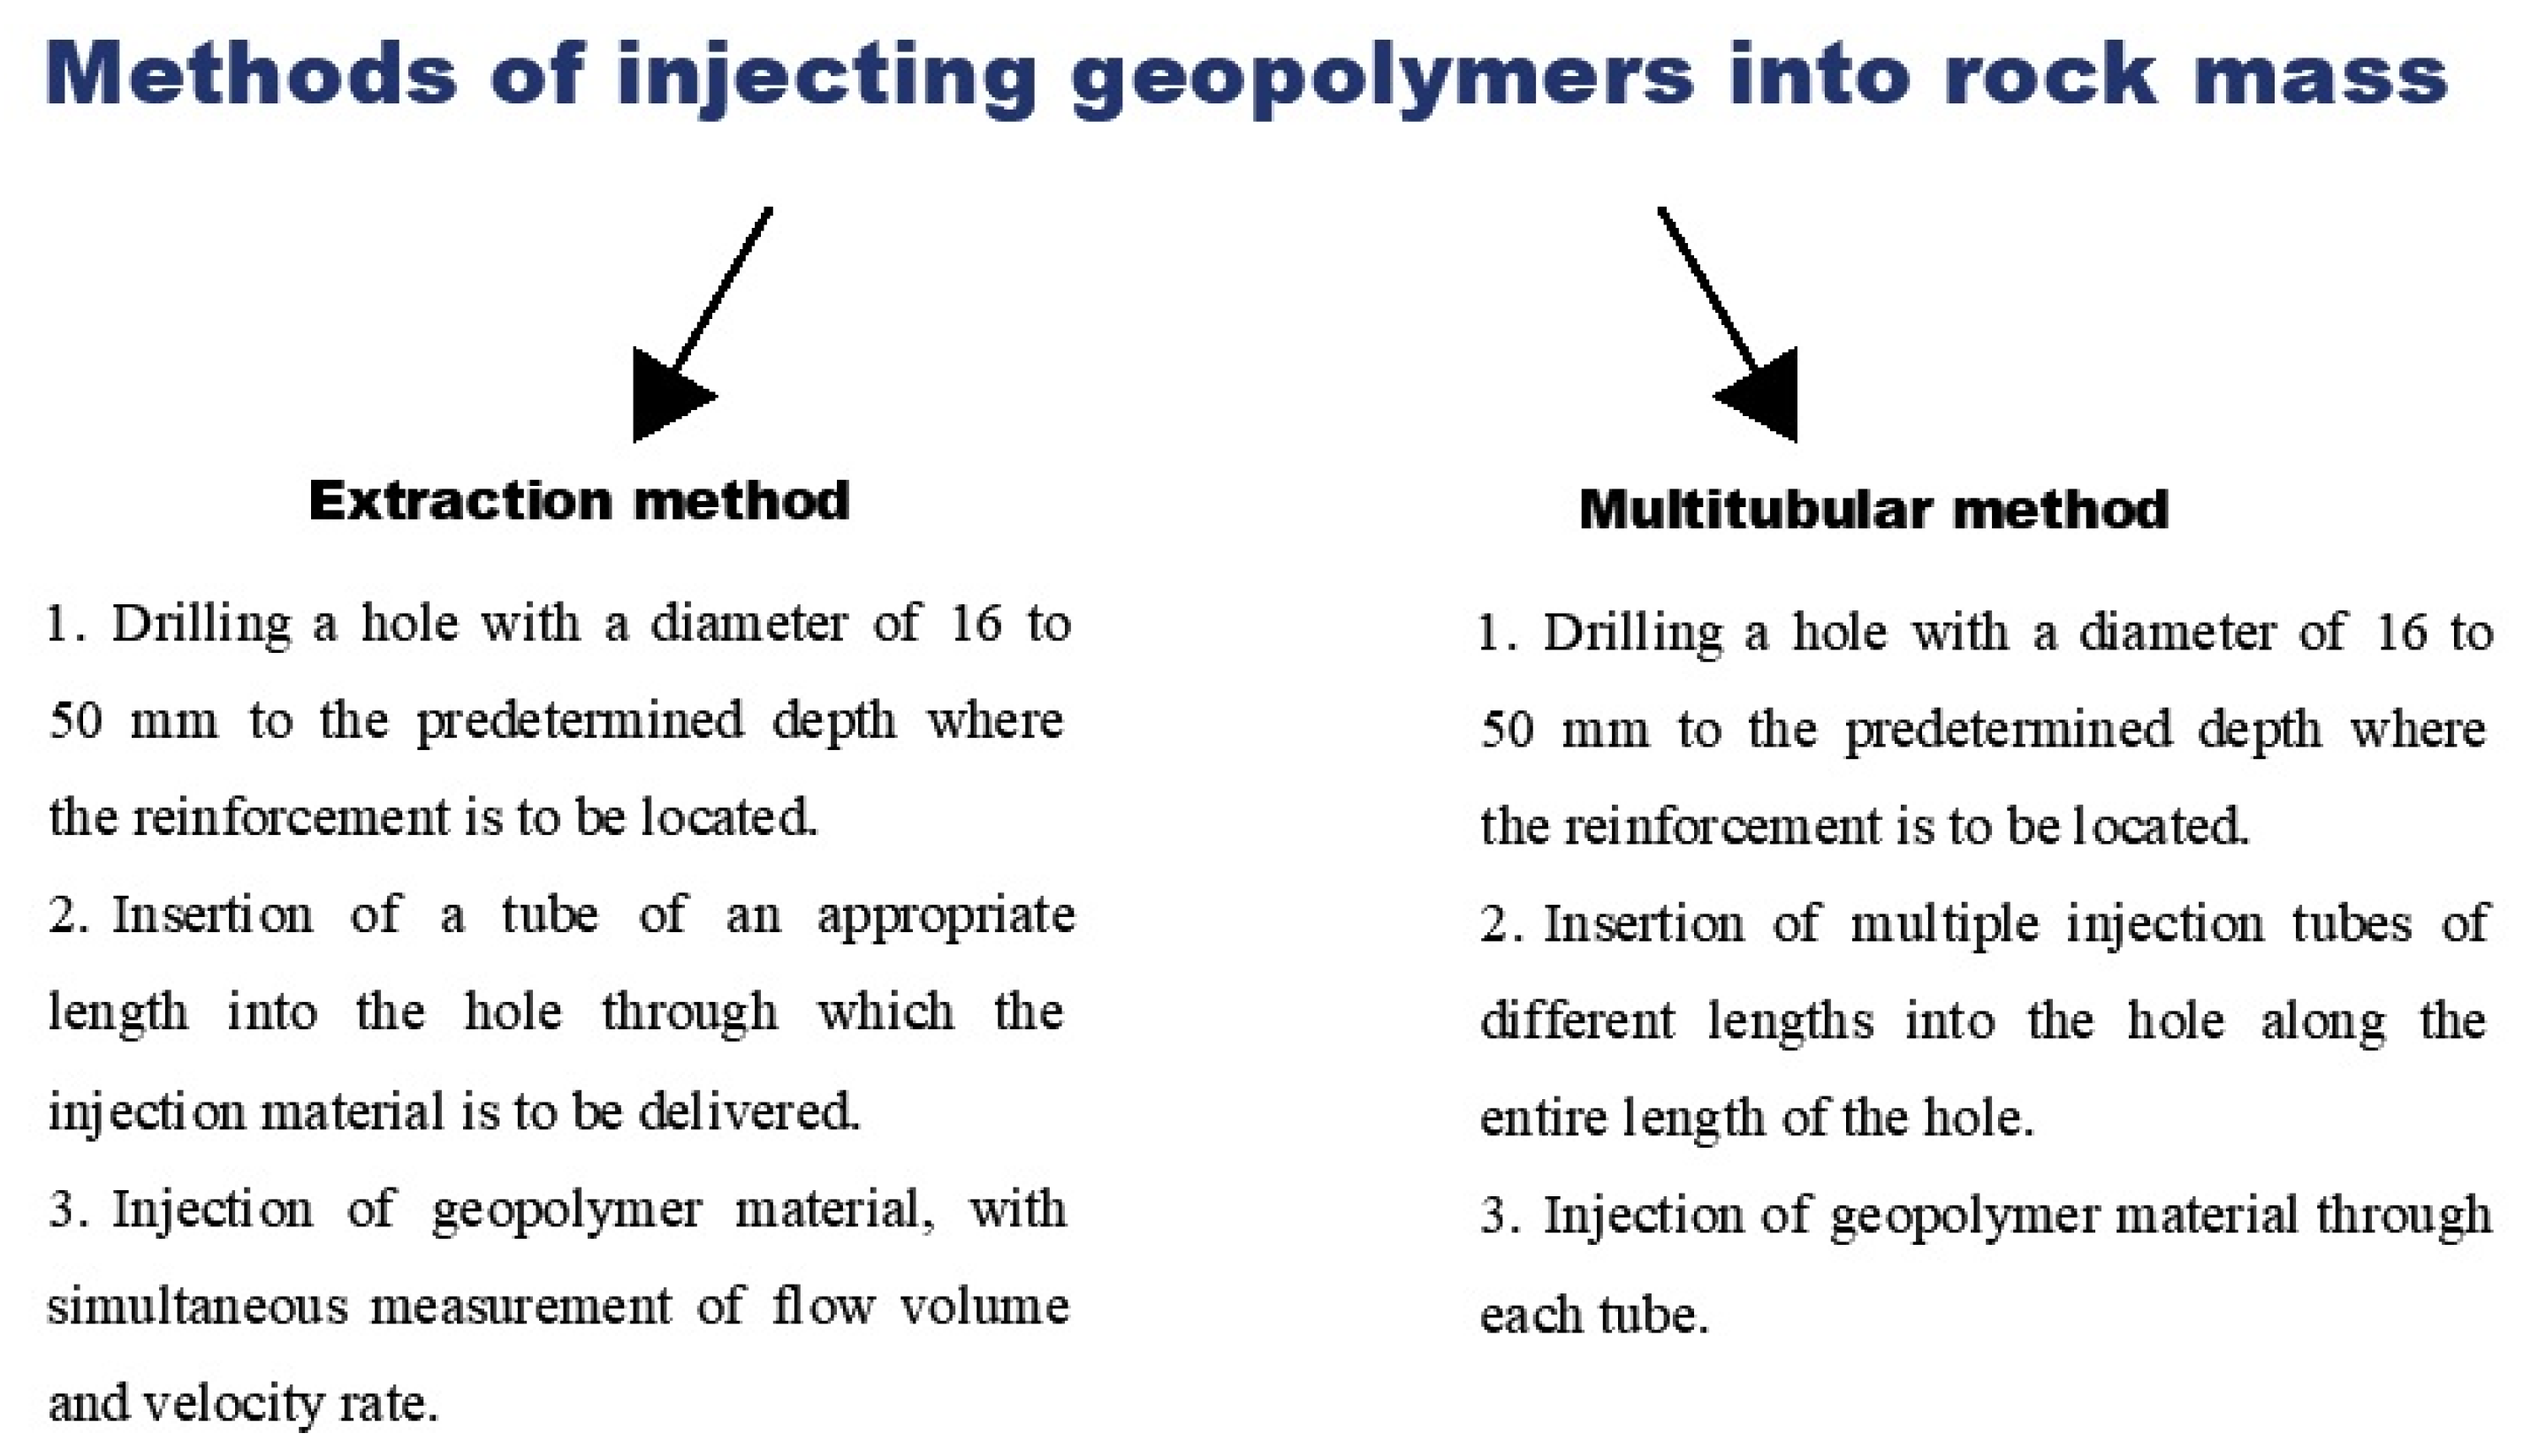
2.2. Geopolymers
2.2.1. Geopolymers—Properties and Application
- High compressive and bending strengths;
- High acid resistance;
- High frost resistance;
- High thermal resistance (geopolymers do not lose their properties at temperatures up to 800 °C);
- Low porosity;
- Fast onset of setting times (compared to that of concrete);
- High degree of adhesion of geopolymers with steel;
- Synthesis of geopolymers consume less energy than, e.g., Portland cement, and release less CO2 into the atmosphere;
- Water-resistant material; service life of the material reaches up to approximately 100 years;
- Minimal environmental impacts;
- Material reaches 90% of its strength in just 30–90 s;
- 5–30 times expansion of the material;
- Expansion pressure reaches up to 10,000 kPa;
- Material application temperature ranges from −15 °C to 60 °C;
- Geopolymer material is about 10% of the mass of concrete.
2.2.2. Application of Geopolymers for Soil Reinforcement and Rectification of Buildings
3. Research
3.1. Methodology
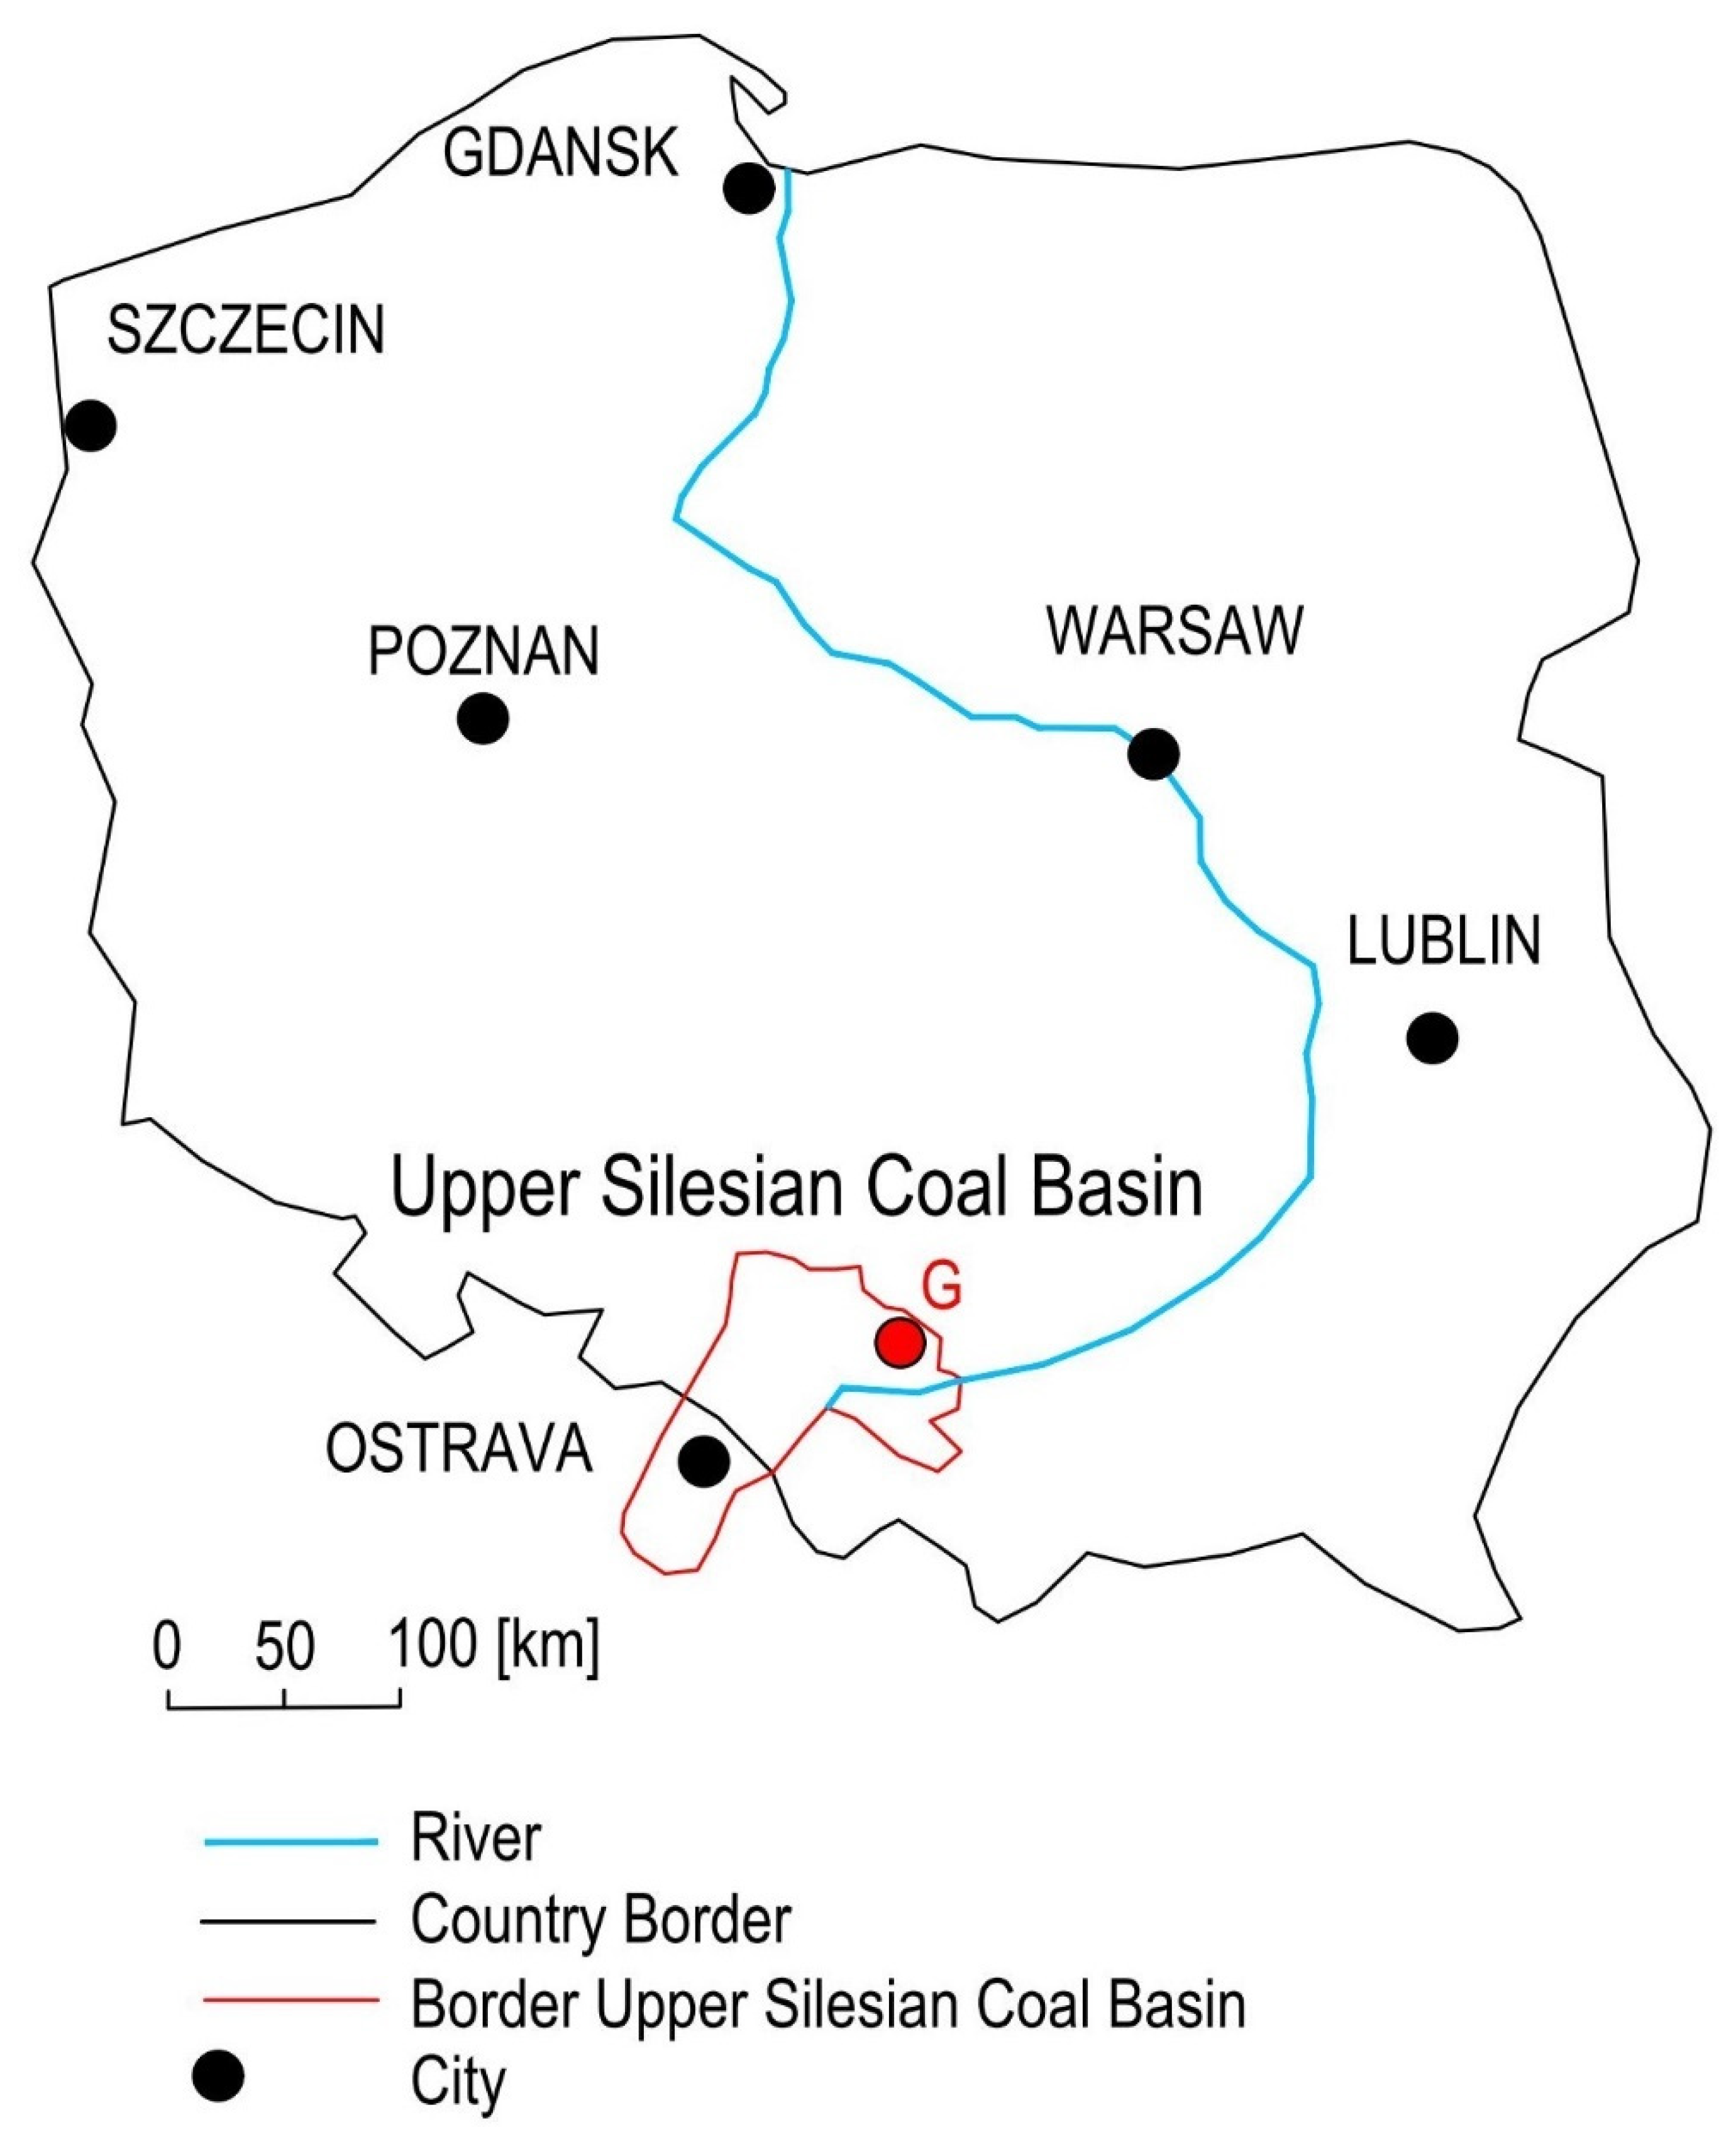
3.2. Description of the Research Area
3.3. Geological Structure of the Rock Mass, Tectonics, Mining Exploitation
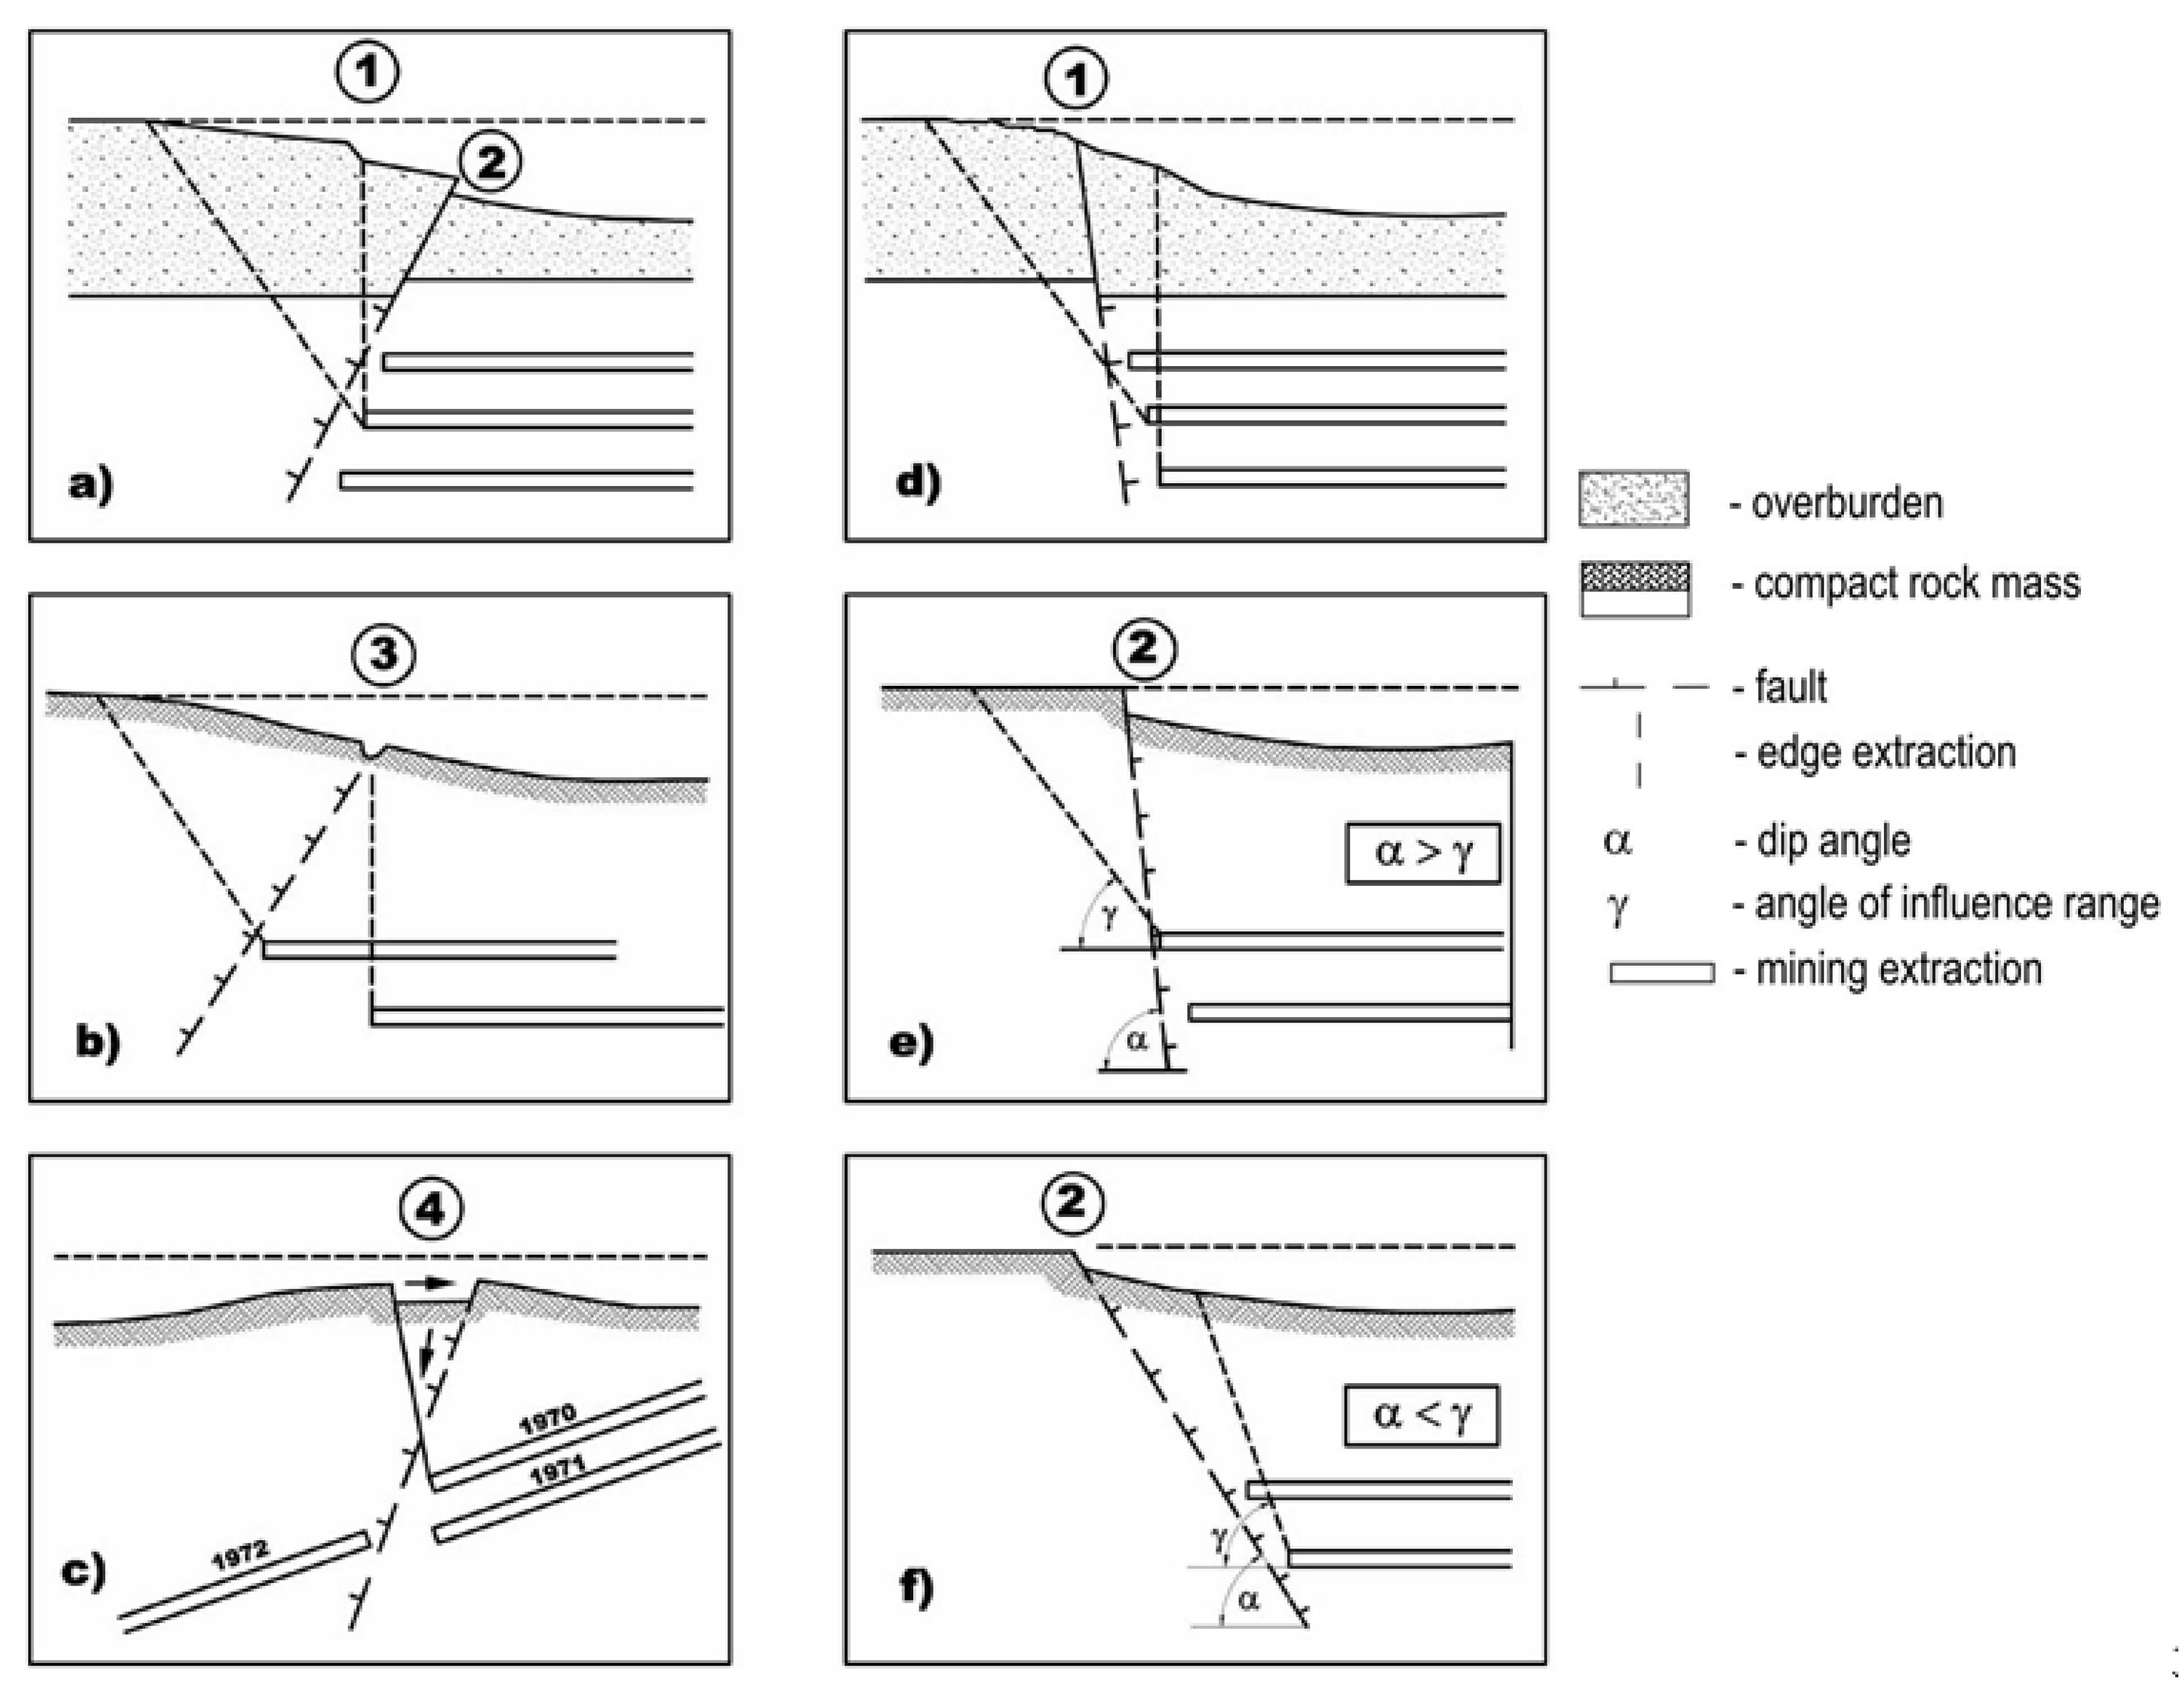
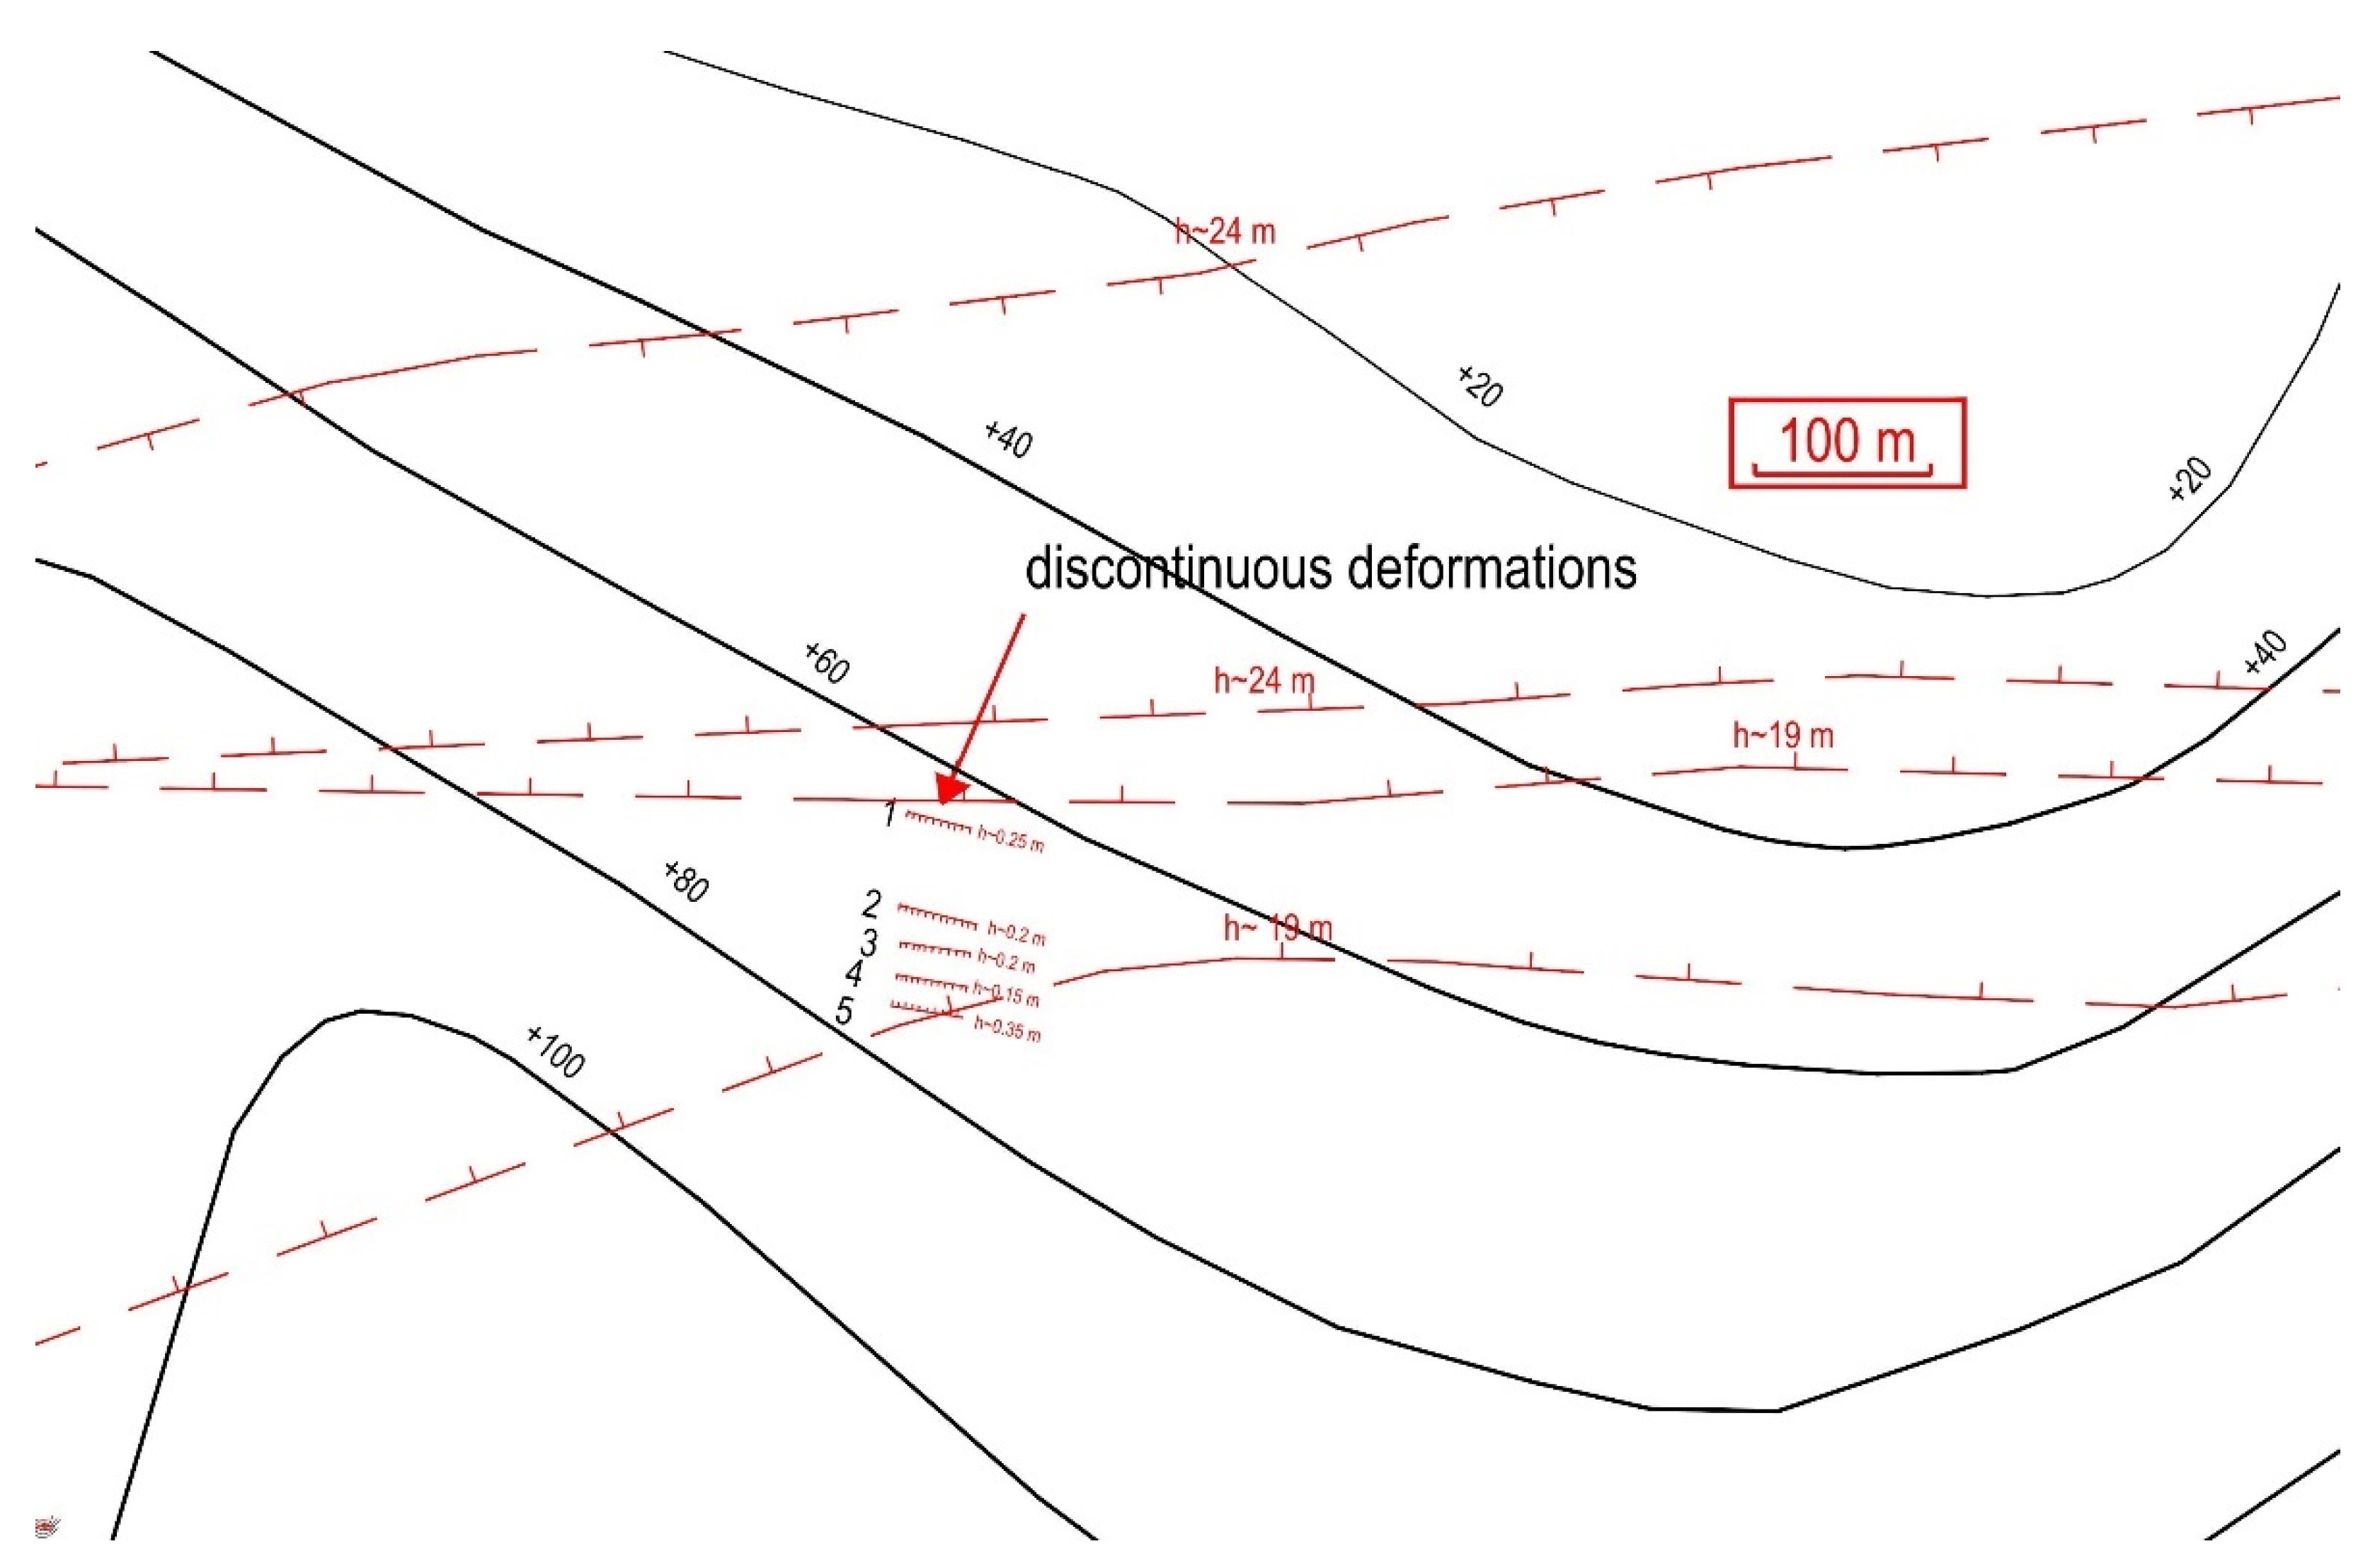
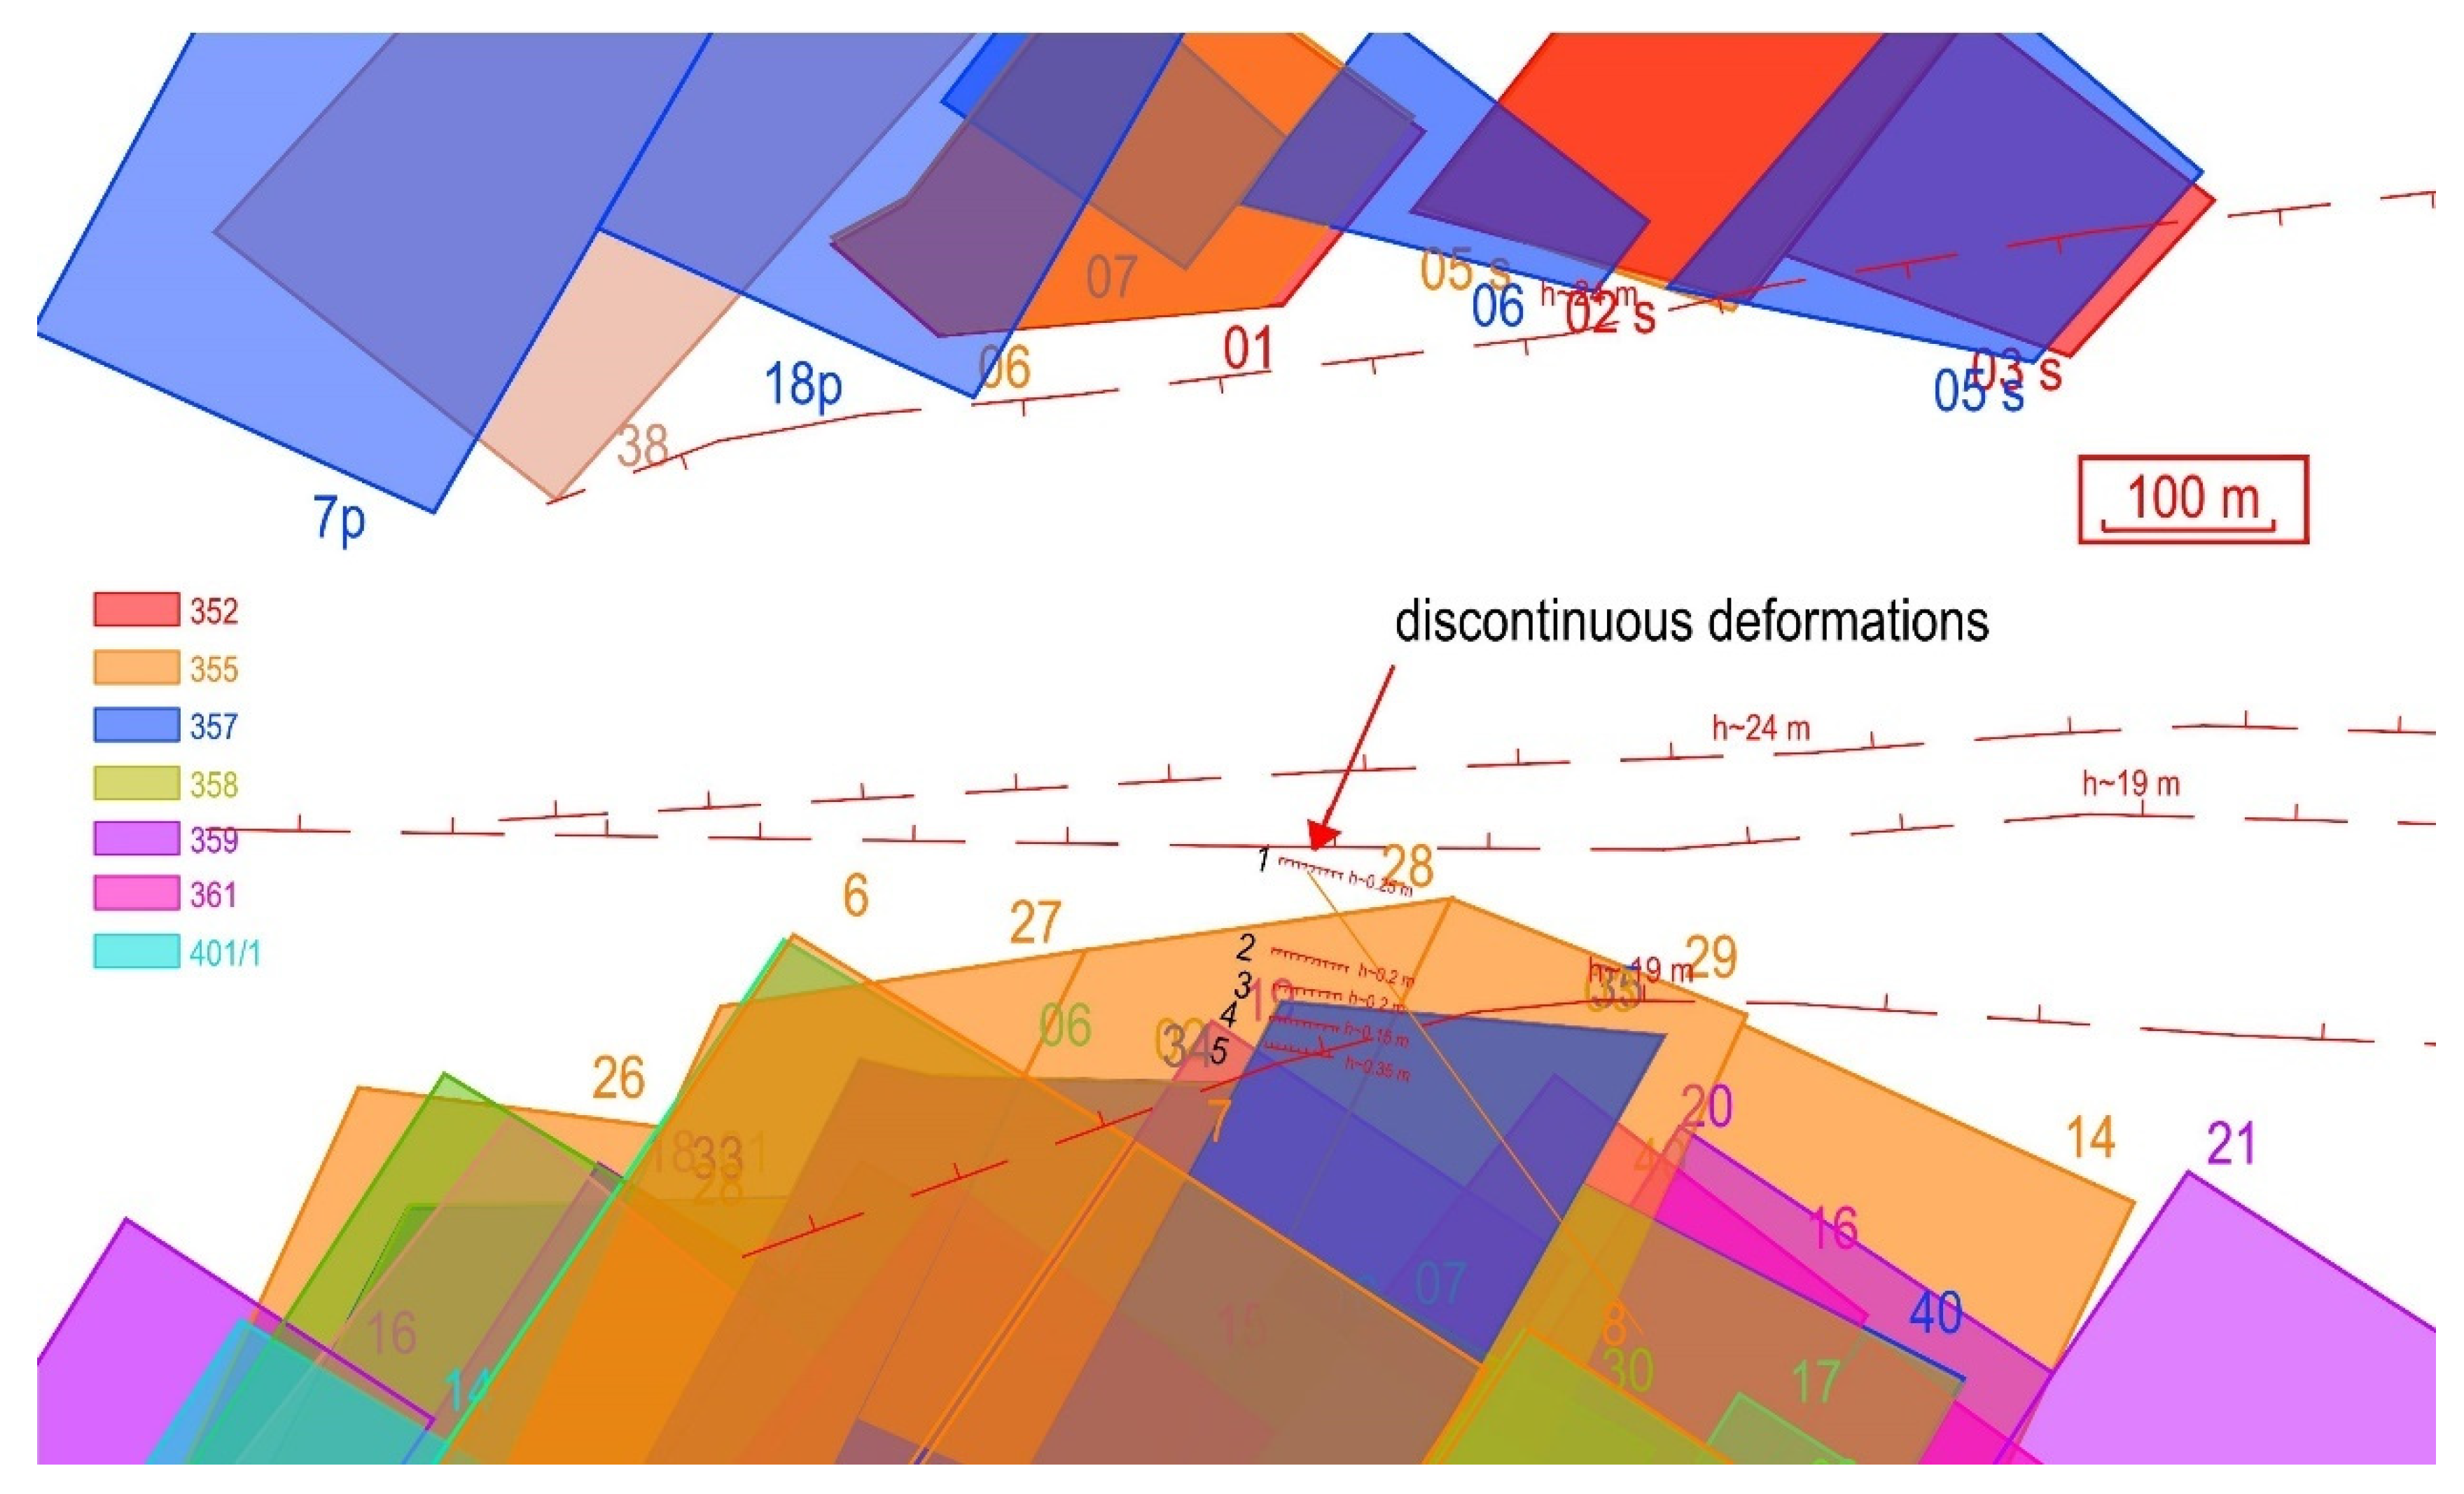
3.4. Causes of the Formation of Discontinuities
- (1)
- Outcrops of tectonic faults on the roof of the Carboniferous layers.
- (2)
- Tensile strain zones as a result of mining exploitation.
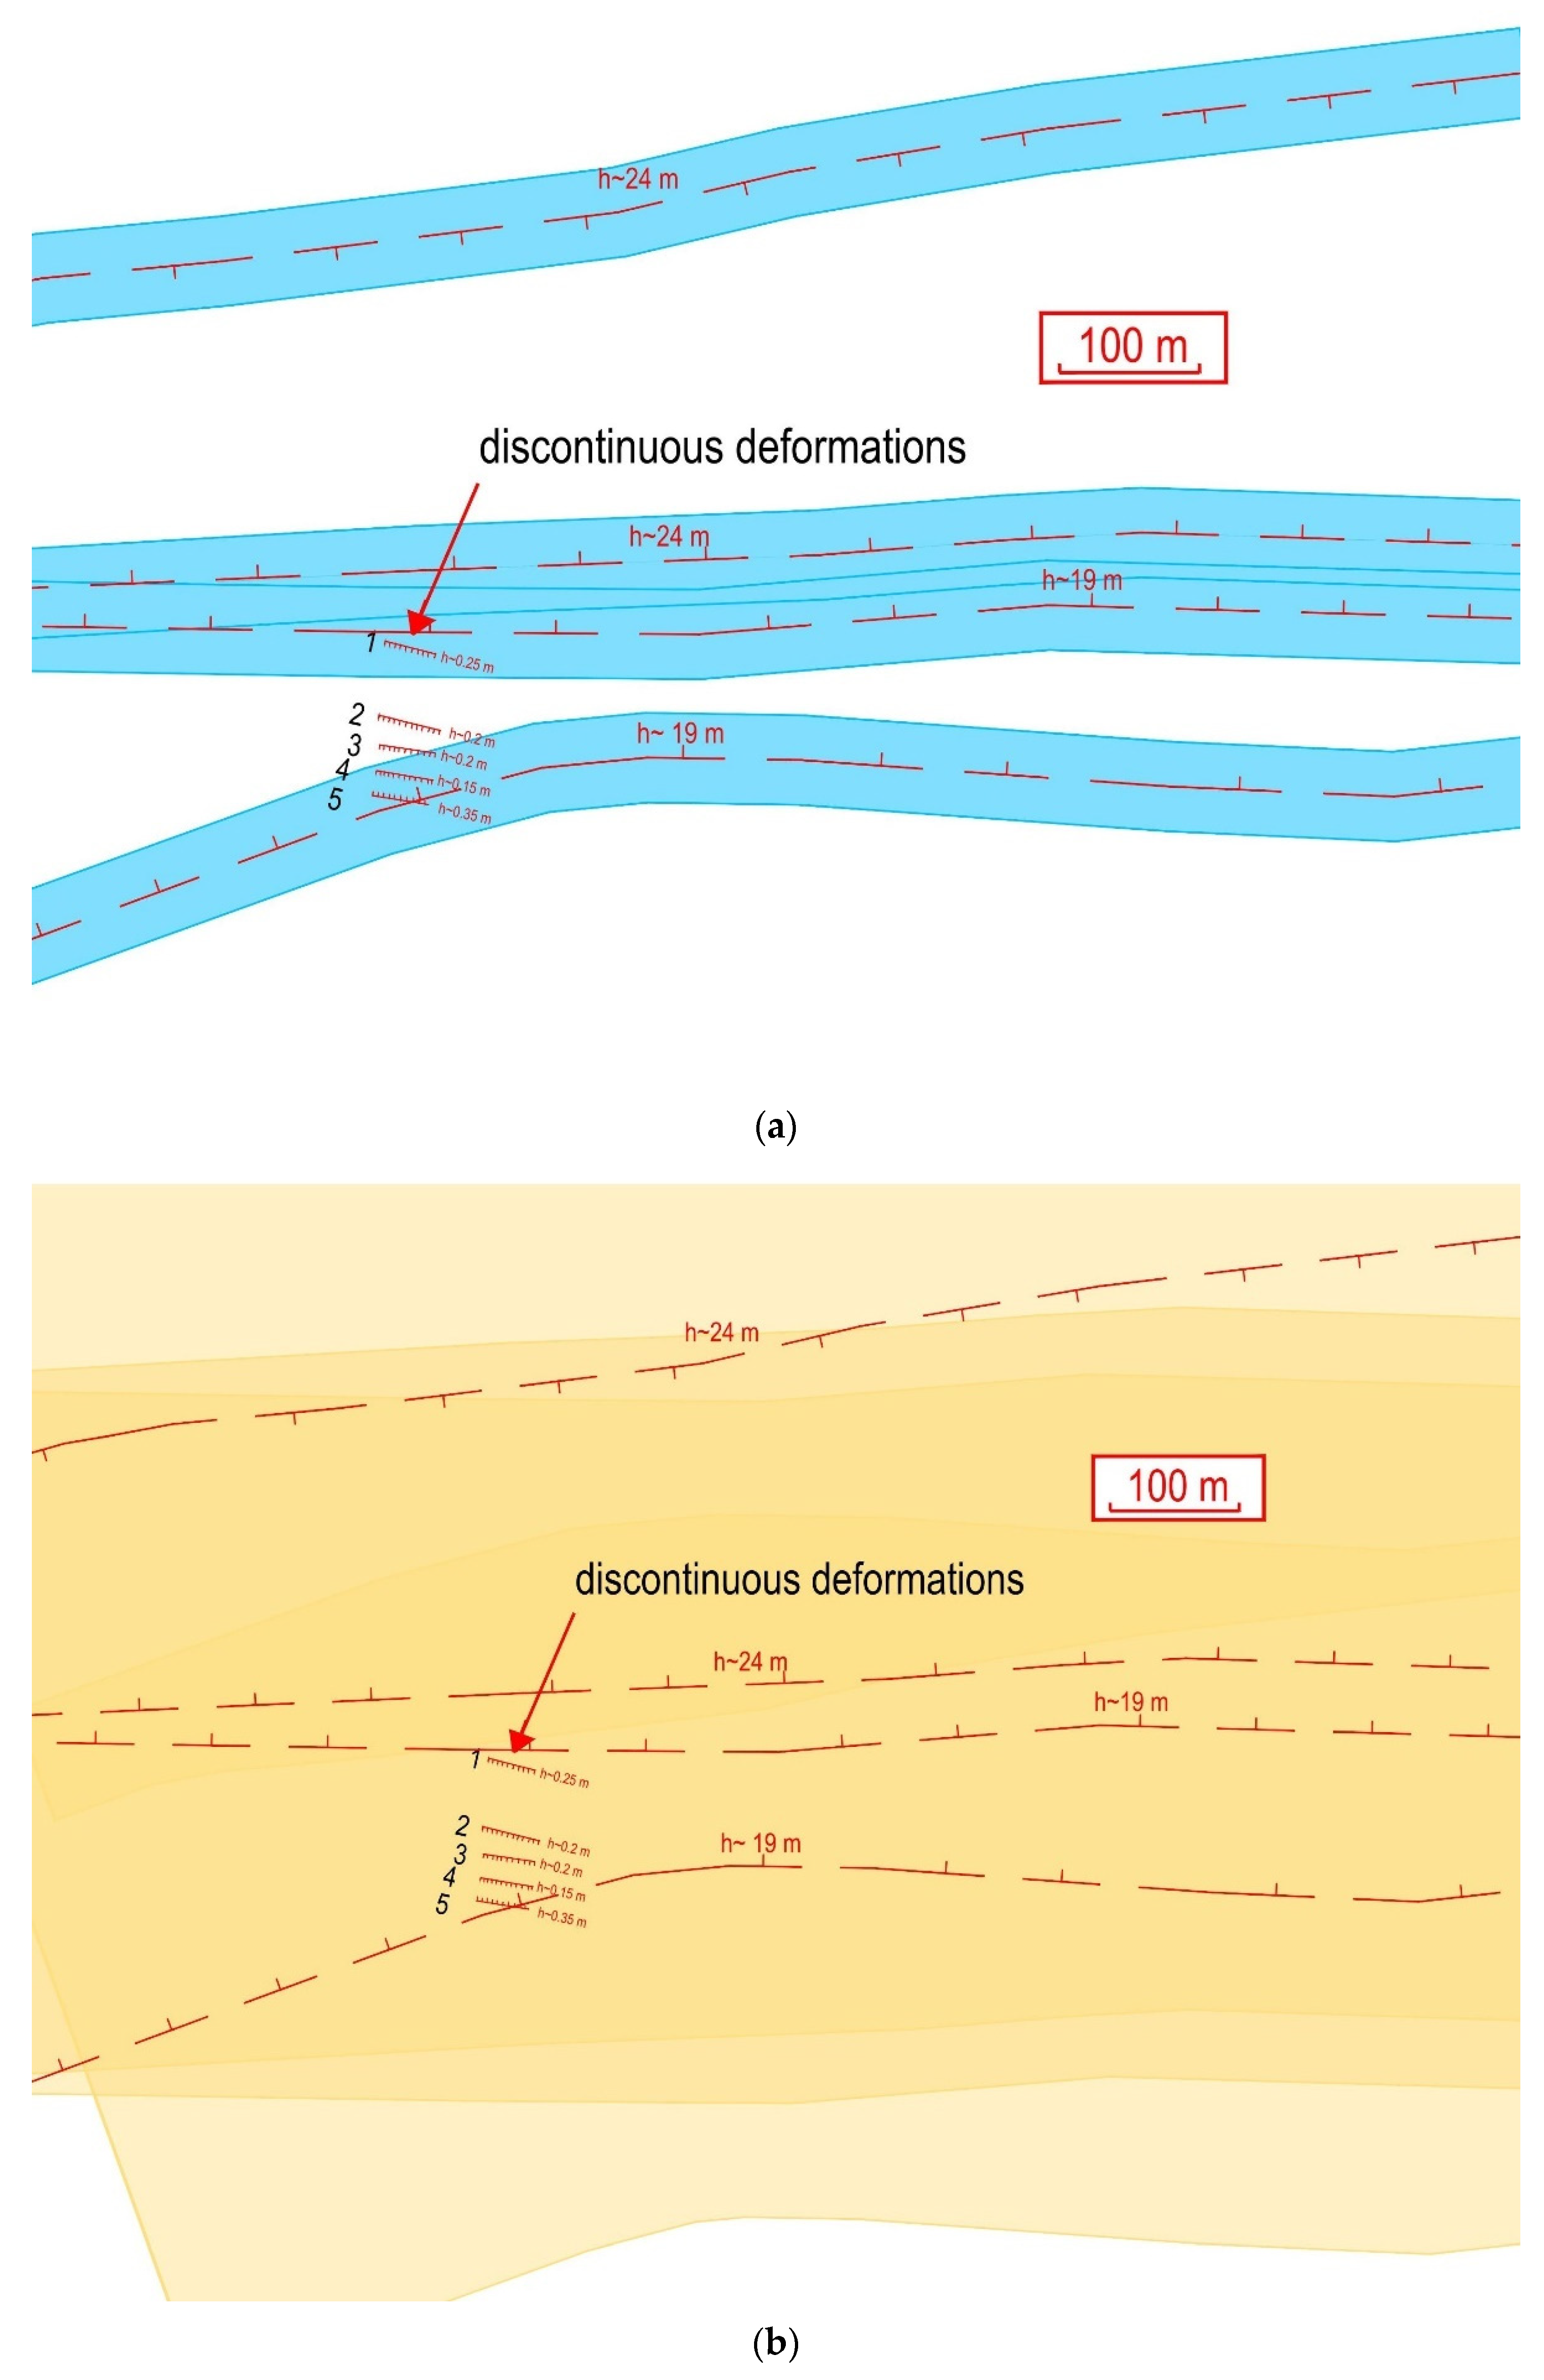
- (1)
- Value “S1” was calculated for data: H = 23 m—Figure 14a, where H is the thickness of the Quaternary loose formations. Only loose overburden was taken into account.
- (2)
- Value “S2” was calculated for data: H = 191 m—Figure 14b, where H is the thickness of formations overlying the Carboniferous formations.
3.5. Concept of Site Protection
4. Summary
5. Conclusions
Author Contributions
Funding
Institutional Review Board Statement
Informed Consent Statement
Data Availability Statement
Acknowledgments
Conflicts of Interest
References
- Kratzsch, H. Mining Subsidence Engineering; Springer: Berlin/Heidelberg, Germany; New York, NY, USA, 1983; p. 543. [Google Scholar]
- Knothe, S. Forecasting the Impact of Mining Exploitations; Publishing House “Slask”: Katowice, Poland, 1984; p. 122. [Google Scholar]
- Whittaaker, B.N.; Reddish, D.J. Subsidence. Occurrence, Prediction and Control; Elsevier: New York, NY, USA, 1989; p. 528. [Google Scholar]
- Chudek, M.; Janusz, W.; Zych, J. Study on diagnosis and prognosis of the formation of discontinuous deformation due to underground mining. Res. J. Silesian Univ. Technol. Gliw. 1988, 141, 165. (In Polish) [Google Scholar]
- Strzałkowski, P. Zarys Ochrony Terenów Górniczych; Wydawnictwo Politechniki Śląskiej: Gliwice, Poland, 2010; p. 192. [Google Scholar]
- Ścigała, R.; Szafulera, K. Linear discontinuous deformations created on the surface as an effect of underground mining and local geological conditions—Case study. Bull. Eng. Geol. Environ. 2019, 79, 2059–2068. [Google Scholar] [CrossRef]
- Strzałkowski, P.; Szafulera, K. Occurrence of linear discontinuous deformations in Upper Silesia (Poland) in conditions of intensive mining extraction—Case study. Energies 2020, 13, 1897. [Google Scholar] [CrossRef] [Green Version]
- Strzałkowski, P.; Ścigała, R.; Szafulera, K.; Kołodziej, K. Surface Deformations Resulting from Abandoned Mining Excavations. Energies 2021, 14, 2495. [Google Scholar] [CrossRef]
- Kowalski, A.; Jędrzejec, E.; Gruchlik, P. Linear discontinuous deformations of the surface in the Upper Silesian Coal Basin. Arch. Min. Sci. 2010, 55, 331–346. [Google Scholar]
- Kowalski, A. Deformacje Powierzchni w Górnośląskim Zagłębiu Węglowym; Główny Instytut Górnictwa: Katowice, Poland, 2015; p. 283. [Google Scholar]
- Koerner, R.M. Designing with Geosynthetics, 5th ed.; Pearson Prentice-Hall Publ. Co.: Upper Saddle River, NJ, USA, 2005; p. 783. [Google Scholar]
- Sarsby, R.W. (Ed.) Geosynthetics in Civil Engineering; Woodhead Publishing Ltd.: Cambridge, UK, 2007; p. 295. [Google Scholar]
- Koerner, R.M.; Te-Yang, S. The evolution of geosynthetics. Civ. Eng. 1997, 67, 62–64. [Google Scholar]
- Ajdukiewicz, J.; Pilch, M.; Zych, J. Obserwacje i wnioski wynikające z pracy nasypu zbrojonego geosyntetykami na terenie podlegającym dużym wpływom eksploatacji górniczej w Jastrzębiu-Bziu. Przegląd Komun. 2013, 3, 14–23. [Google Scholar]
- Cała, M.; Cieślik, J.; Flisiak, J.; Kowalski, M. Przyczyny awarii nasypu autostrady A4 pomiędzy węzłami, Wirek” i, Batorego” w świetle obliczeń numerycznych. Nowocz. Bud. Inżynieryjne 2007, 1, 38–44. [Google Scholar]
- Kotyrba, A.; Kowalski, A. Linear discontinuous deformation of A4 highway within mining area “Halemba”. Gospod. Surowcami Miner. 2009, 25, 303–317. [Google Scholar]
- Zych, J.; Tondera, M.; Machowski, M. Designing, execution and using stage of highway A4 (E40) based on active geological fault. In Proceedings of the EuroGeo 6, Ljubljana, Slovenia, 25–28 September 2016; pp. 916–926. [Google Scholar]
- Grygierek, M. Change in stiffness of pavement layers in the linear discontinuous deformation area. IOP Conf. Ser. Mater. Sci. Eng. 2017, 245, 42051. [Google Scholar] [CrossRef] [Green Version]
- Chudek, M.; Kleta, H. Zagrożenie obiektów przyszybowych deformacjami nieciągłymi typu liniowego. Górnictwo Geoinżynieria 2007, 31, 135–140. [Google Scholar]
- Miłkowski, A.; Pilecki, Z.; Kłosek, K.; Tondera, M. Autostrada A1 zaprojektowana na “dziurawym” podłożu. Cz. 1. Mag. Autostrady 2010, 3, 104–112. [Google Scholar]
- Miłkowski, A.; Pilecki, Z.; Kłosek, K.; Tondera, M. Austostrada A1 zaprojektowana na “dziurawym” podłożu. Cz. 2. Mag. Autostrady 2010, 5, 152–160. [Google Scholar]
- Kawalec, J.; Grygierek, M.; Koda, E.; Osiński, P. Lessons learned on geosynthetics applications in road structures in Silesia mining region in Poland. Appl. Sci. 2019, 9, 1122. [Google Scholar] [CrossRef] [Green Version]
- Grygierek, M.; Sternik, K.J. Identification of pavement model parameters in the area of discontinuous surface deformation based on FWD tests. Int. J. Civ. Eng. 2020, 19, 265–282. [Google Scholar] [CrossRef]
- Juraszek, J.; Gwóźdź-Lasoń, M.; Logoń, D. Fbg strain monitoring of a road structure reinforced with a geosynthetic mattress in cases of subsoil deformation in mining activity areas. Materials 2021, 14, 1709. [Google Scholar] [CrossRef]
- Tong, L.; Liu, L.; Yu, Q. Highway construction across heavily mined ground and steep topography in southern China. Bull. Eng. Geol. Environ. 2013, 73, 43–60. [Google Scholar] [CrossRef]
- Tong, L.; Leo, L.; Amatya, B.; Liu, S. Risk assessment and remediation strategies for highway construction in abandoned coal mine region: Lessons learned from Xuzhou, China. Bull. Eng. Geol. Environ. 2015, 75, 1045–1066. [Google Scholar] [CrossRef]
- Guo, Q.; Guo, G.; Li, Y.; Wang, L.; Zhao, X. Stability evaluation of an expressway construction site above an abandoned coal mine based on the overlay and index method. Sustainability 2019, 11, 5163. [Google Scholar] [CrossRef] [Green Version]
- Guo, Q.; Li, Y.; Meng, X.; Guo, G.; Lv, X. Instability risk assessment of expressway construction site above an abandoned goaf: A case study in China. Environ. Earth Sci. 2019, 78, 588. [Google Scholar] [CrossRef]
- Schwerdt, S. Development of a design method for bridging systems in areas with dolines and sinkholes using geosynthetic reinforcement. Cтpoитeльcтвo Apxитeктypa 2016, 7, 132–147. (In German) [Google Scholar] [CrossRef]
- PN-EN ISO 10319:2010; (U) Geosyntetyki—Badania Wytrzymałości na Rozciąganie Metodą Szerokich Próbek. The Polish Committee for Standardization: Warsaw, Poland, 2010.
- PN-EN 1997-1; Eurokod 7. Projektowanie Geotechniczne. Część 1. Zasady Ogólne. The Polish Committee for Standardization: Warsaw, Poland, 2010.
- Wysokiński, L.; Kotlicki, W. Projektowanie Konstrukcji Oporowych, Stromych Skarp i Nasypów z Gruntu Zbrojonego; ITB Seria Instrukcje, Wytyczne, Poradniki nr 429: Warsaw, Poland, 2007. [Google Scholar]
- DIN 1054:2010; Baugrund, Sicherheitsnachweise im Erd- und Grundbau. Deutsches Institut für Normung: Berlin, Germany, 2010.
- DIN 4084:2009; Baugrund, Geländebruchberechnungen. Deutsches Institut für Normung: Berlin, Germany, 2009.
- Deutsche Gesellschaft für Geotechnik. Empfehlungen für den Entwurf und die Berechnung von Erdkörpern mit Bewehrungen aus Geokunststoffen EBGEO; Ernst & Sohn: Berlin, Germany, 2010. [Google Scholar]
- BS 8006:2010; Code of Practice for Strengthened/Reinforced Soils and Other Fills. BSI: London, UK, 2010.
- XP G 38-064:2010; Utilisation des Géotextiles et Produits Apparentés, Murs Inclinés et Talus Raidis en Solsrenforcés Par Nappes Géosynthétiques. AFNOR: Paris, France, 2010.
- Sobolewski, J.; Ajdukiewicz, J. Geosyntetyki w nasypach komunikacyjnych na terenach zdewastowanych oraz w obszarach zagrożonych deformacjami pogórniczymi, zasady projektowania i przykład zastosowania na autostradzie A1. Inżynieria Morska Geotech. 2015, 5, 746–756. [Google Scholar]
- Papiau, C.; Baraize, E.; Perrier, H. Reinforcement de Plate-Forme autoroutière au-dessus de Cavités Karstiques. In Proceedings of the International Conference Geotextiles Geomembranes-Rencontres 95, Beaune, France, 27–28 September 1995; pp. 93–99. [Google Scholar]
- Gourc, J.P.; Villard, P.; Giraud, H. Sinkholes beneath a reinforced earth fill a large-scale motorway and railway experiment. In Proceedings of the Geosynthetics’99: Specifying Geosynthetics and Developing Design Details, Boston, MA, USA, 28–30 April 1999; Volume 2, pp. 833–846. [Google Scholar]
- Davidovits, J. Chemistry of geopolymer systems, terminology. In Proceedings of the Geopolymer’99 International Conferences, Saint-Quentin, France, 30 June–2 July 1999. [Google Scholar]
- Davidovits, J. Why the Pharaohs Built the Pyramids with Fake Stones; Godefroy, J.-C., Ed.; Institut Géopolymère: Paris, France, 2002. [Google Scholar]
- Stryczek, S.; Gonet, A.; Wiśniowski, R.; Złotkowski, A. New-generation sealing slurries for borehole injection purposes. Arch. Min. Sci. Kraków 2015, 60, 931–940. [Google Scholar] [CrossRef] [Green Version]
- Błaszczyński, T.; Król, M. Durability of Green-Concretes. In Proceedings of the 8th International Conference AMCM 2014, Wrocław, Poland, 16–18 June 2014; pp. 530–540. [Google Scholar]
- Błaszczyński, T.; Król, M. Geopolymers in construction. Civ. Environ. Eng. Rep. 2015, 16, 25–40. [Google Scholar]
- Błaszczyński, T. Betonowe cuda. In Proceedings of the XXV Ogólnopolskie Warsztaty Pracy Projektanta Konstrukcji, Tom I, Szczyrk, Poland, 10–13 March 2010; pp. 1–41. [Google Scholar]
- Król, M.; Błaszczyński, T. Ekobetony geopolimerowe. Mater. Bud. 2013, 11, 23–26. [Google Scholar]
- Available online: https://podnoszenie-posadzek.geobear.pl/ (accessed on 20 November 2021).
- Bromley, L.; Hadfield, D. Geotechnical Asset Management: How Structural Engineers Can Exploit Goe-Polymer Injection Technology; URETEK: Tomball, TX, USA, 2017. [Google Scholar]
- Kwiatek, J. Obiekty Budowlane na Terenach Górniczych; Wydawnictwo GIG: Katowice, Poland, 2003. [Google Scholar]
- Malinowska, A.; Hejmanowski, R. The impact of deep underground coal mining on earth fissure occurrence. Acta Geodyn. Geomater. 2016, 13, 184. [Google Scholar] [CrossRef] [Green Version]
- Ścigała, R. The Influence of Deposit Tectonics on the Distribution on Mining AREA Deformations; Publ. House of Silesian Univ. of Technology: Gliwice, Poland, 2013. [Google Scholar]
- Białek, J. Algorytmy i Programy Komputerowe do Prognozowania Deformacji Terenu Górniczego; Wydawnictwo Politechniki Śląskiej: Gliwice, Poland, 2003; p. 199. [Google Scholar]
- Strzałkowski, P.; Szafulera, K. Przykład analizy sumowania deformacji terenu górniczego w długim przedziale czasu. Bezp. Pr. Ochr. Gór. 2016, 10, 14–19. [Google Scholar]
- PN-EN 1997-2 Eurokod 7. Projektowanie Geotechniczne. Część 2. Rozpoznanie i Badanie Podłoża Gruntowego. Available online: http://ompkg.pl/wp-content/uploads/2015/02/A_PN-EN-1997-2.pdf (accessed on 20 November 2021).
- Mermerdaş, K.; İpek, S.; Sor, N.H.; Mulapeer, E.S.; Ekmen, S. The Impact of Artificial Lightweight Aggregate on the Engineering Features of Geopolymer Mortar. Turk. J. Nat. Sci. 2020, 9, 79–90. [Google Scholar]


| Aramid Geogrid (e.g., Fortrac® R 1200/100-30 AMT, HUESKER Synthetic GmbH, Gescher, Germany) | Polyvinyl Alcohol Geogrid (e.g., Fortrac® R 830/100-30 MT, HUESKER Synthetic GmbH, Gescher, Germany) |
|---|---|
| Short-term tensile strength ≥1200/100 kN/m Elongation at maximum load ≤3.5/6% Mesh size 30/30 mm Aramid/PVA polymer | Short-term tensile strength ≥830/100 kN/m Elongation at maximum load ≤6/6% Mesh size 30/30 mm PVA/PVA polymer |
Publisher’s Note: MDPI stays neutral with regard to jurisdictional claims in published maps and institutional affiliations. |
© 2022 by the authors. Licensee MDPI, Basel, Switzerland. This article is an open access article distributed under the terms and conditions of the Creative Commons Attribution (CC BY) license (https://creativecommons.org/licenses/by/4.0/).
Share and Cite
Perżyło, D.; Szafulera, K.; Kruczkowski, M.; Pilch, M. The Use of Geomaterials to Restore the Utility Value of Post-Mining Areas. Energies 2022, 15, 1447. https://doi.org/10.3390/en15041447
Perżyło D, Szafulera K, Kruczkowski M, Pilch M. The Use of Geomaterials to Restore the Utility Value of Post-Mining Areas. Energies. 2022; 15(4):1447. https://doi.org/10.3390/en15041447
Chicago/Turabian StylePerżyło, Dagmara, Katarzyna Szafulera, Marek Kruczkowski, and Michał Pilch. 2022. "The Use of Geomaterials to Restore the Utility Value of Post-Mining Areas" Energies 15, no. 4: 1447. https://doi.org/10.3390/en15041447