1. Introduction
Due to the increasing power demand and negative impact of conventional primary energy sources, such as fossil fuels [
1,
2], sustainable and clean energy, such as renewable energy sources, must be developed and deployed [
3,
4]. Nowadays, solar energy is the most promising renewable energy source, and its deployment has rapidly increased around the globe. Sunlight is turned into energy in solar photovoltaic power-producing systems. Additionally, deploying solar technology would significantly lessen problems related to energy security, climate change, unemployment, and other challenges [
5].
Perovskite materials are particularly effective solution-processed materials in photovoltaic (PV) manufacturing because of their characteristics, such as strong absorption and extended diffusion length. Therefore, Perovskite solar cells (PSCs), a subset of 3rd generation solar cells, are produced due to the employment of perovskite materials. Within just a few years of improvement, PSCs power conversion efficiency (PCE) reached 25.5% [
6]. This rapid increase in PCE makes PSCs an excellent alternative to silicon-based PV technology. However, a fundamental barrier to their widespread commercialization is the PSC stability issue, which must be resolved [
7,
8,
9]. Researchers have suggested some methods for improving PSCs’ PCE and resolving their stability issues. Dimensionality optimization [
8,
10] employs a stable organic cation in forming perovskite material, and interface engineering [
11,
12] is among the strategies that have played an essential role in improving stability and efficiency. Problems of hysteresis [
13,
14] in PSCs and perovskite degradation [
15,
16] can be resolved using interface engineering [
11,
17].
Authors in [
18,
19,
20,
21] investigated an optimized design of different types of perovskite solar cell via SCAPS-1D, DFT, and wxAMPS software packages where many electron transport layers were used and examined beside the interface between the electron transporting layer and the perovskite absorber layer.
In literature, rare earth oxides are used in the PSCs performance improvement [
22]. In [
23], a review paper, the authors discussed the recent development in the proton-conducting performance of BaZrO3 as standpoint energy materials to integrate the fundamental knowledge of proton-conducting BZO perovskites.
Perovskite absorbers modified with organic molecules have received much attention. This is due to their easy processability and acceptable electronic characteristics of the organic molecules. Electrical modeling of the whole perovskite solar cell device is required to evaluate PSC performance better. Device properties like the current at a short circuit, the voltage at an open circuit, fill factor, diode ideality factor, series, shunt resistances, and efficiency may be easily measured and adjusted using an electrical model [
17,
24,
25]. One of the most frequent methods to characterize the performance of a PV cell and module is through its relation between the current and the voltage. This relation can provide simple information such as the voltage at open circuit and the current at short circuit conditions, and the power at the point of maximum power. Even PV module makers must disclose that essential information is evaluated under defined test settings (STC). Extracting further information from the I–V curves is challenging without the assistance of mathematical models. Because the I–V curves of a PV system contain a significant degree of nonlinearity, the optimal design is challenging.
According to the literature, there are three standard models for solar cell performance: one diode, two diodes, and triple diode models. The main components in these models are the diodes and the attached resistors. The main parameters optimal value has to be determined to successfully model a solar cell. These parameters are the diode ideality factor, series and parallel resistors, and the diode saturation current. The first model for solar cell modeling is the single diode model; however, it has some drawbacks. Due to these drawbacks, more open models with more details are needed as a result. The double and triple-diode models appeared to cover the solar cell performance under different conditions.
The increased installation and penetration of large-scale PV arrays need accurate characterization models, particularly during low solar radiation circumstances, for devising control methods for integrating PV systems to assure the power system stability. Due to including the effect of grain boundaries, leakage current, and the recombination of carriers, the triple diode model is the best model for simulating the solar cell performance [
26].
Recently, the modeling, parameters estimation, and application in real systems of the third-generation solar cells, including PSCs, were discussed in a few publications [
27,
28,
29,
30,
31]. Much research is still required to enhance the parameters estimation problem quality via the mathematical model and the recent bioinspired optimization algorithms [
32,
33,
34,
35,
36,
37,
38].
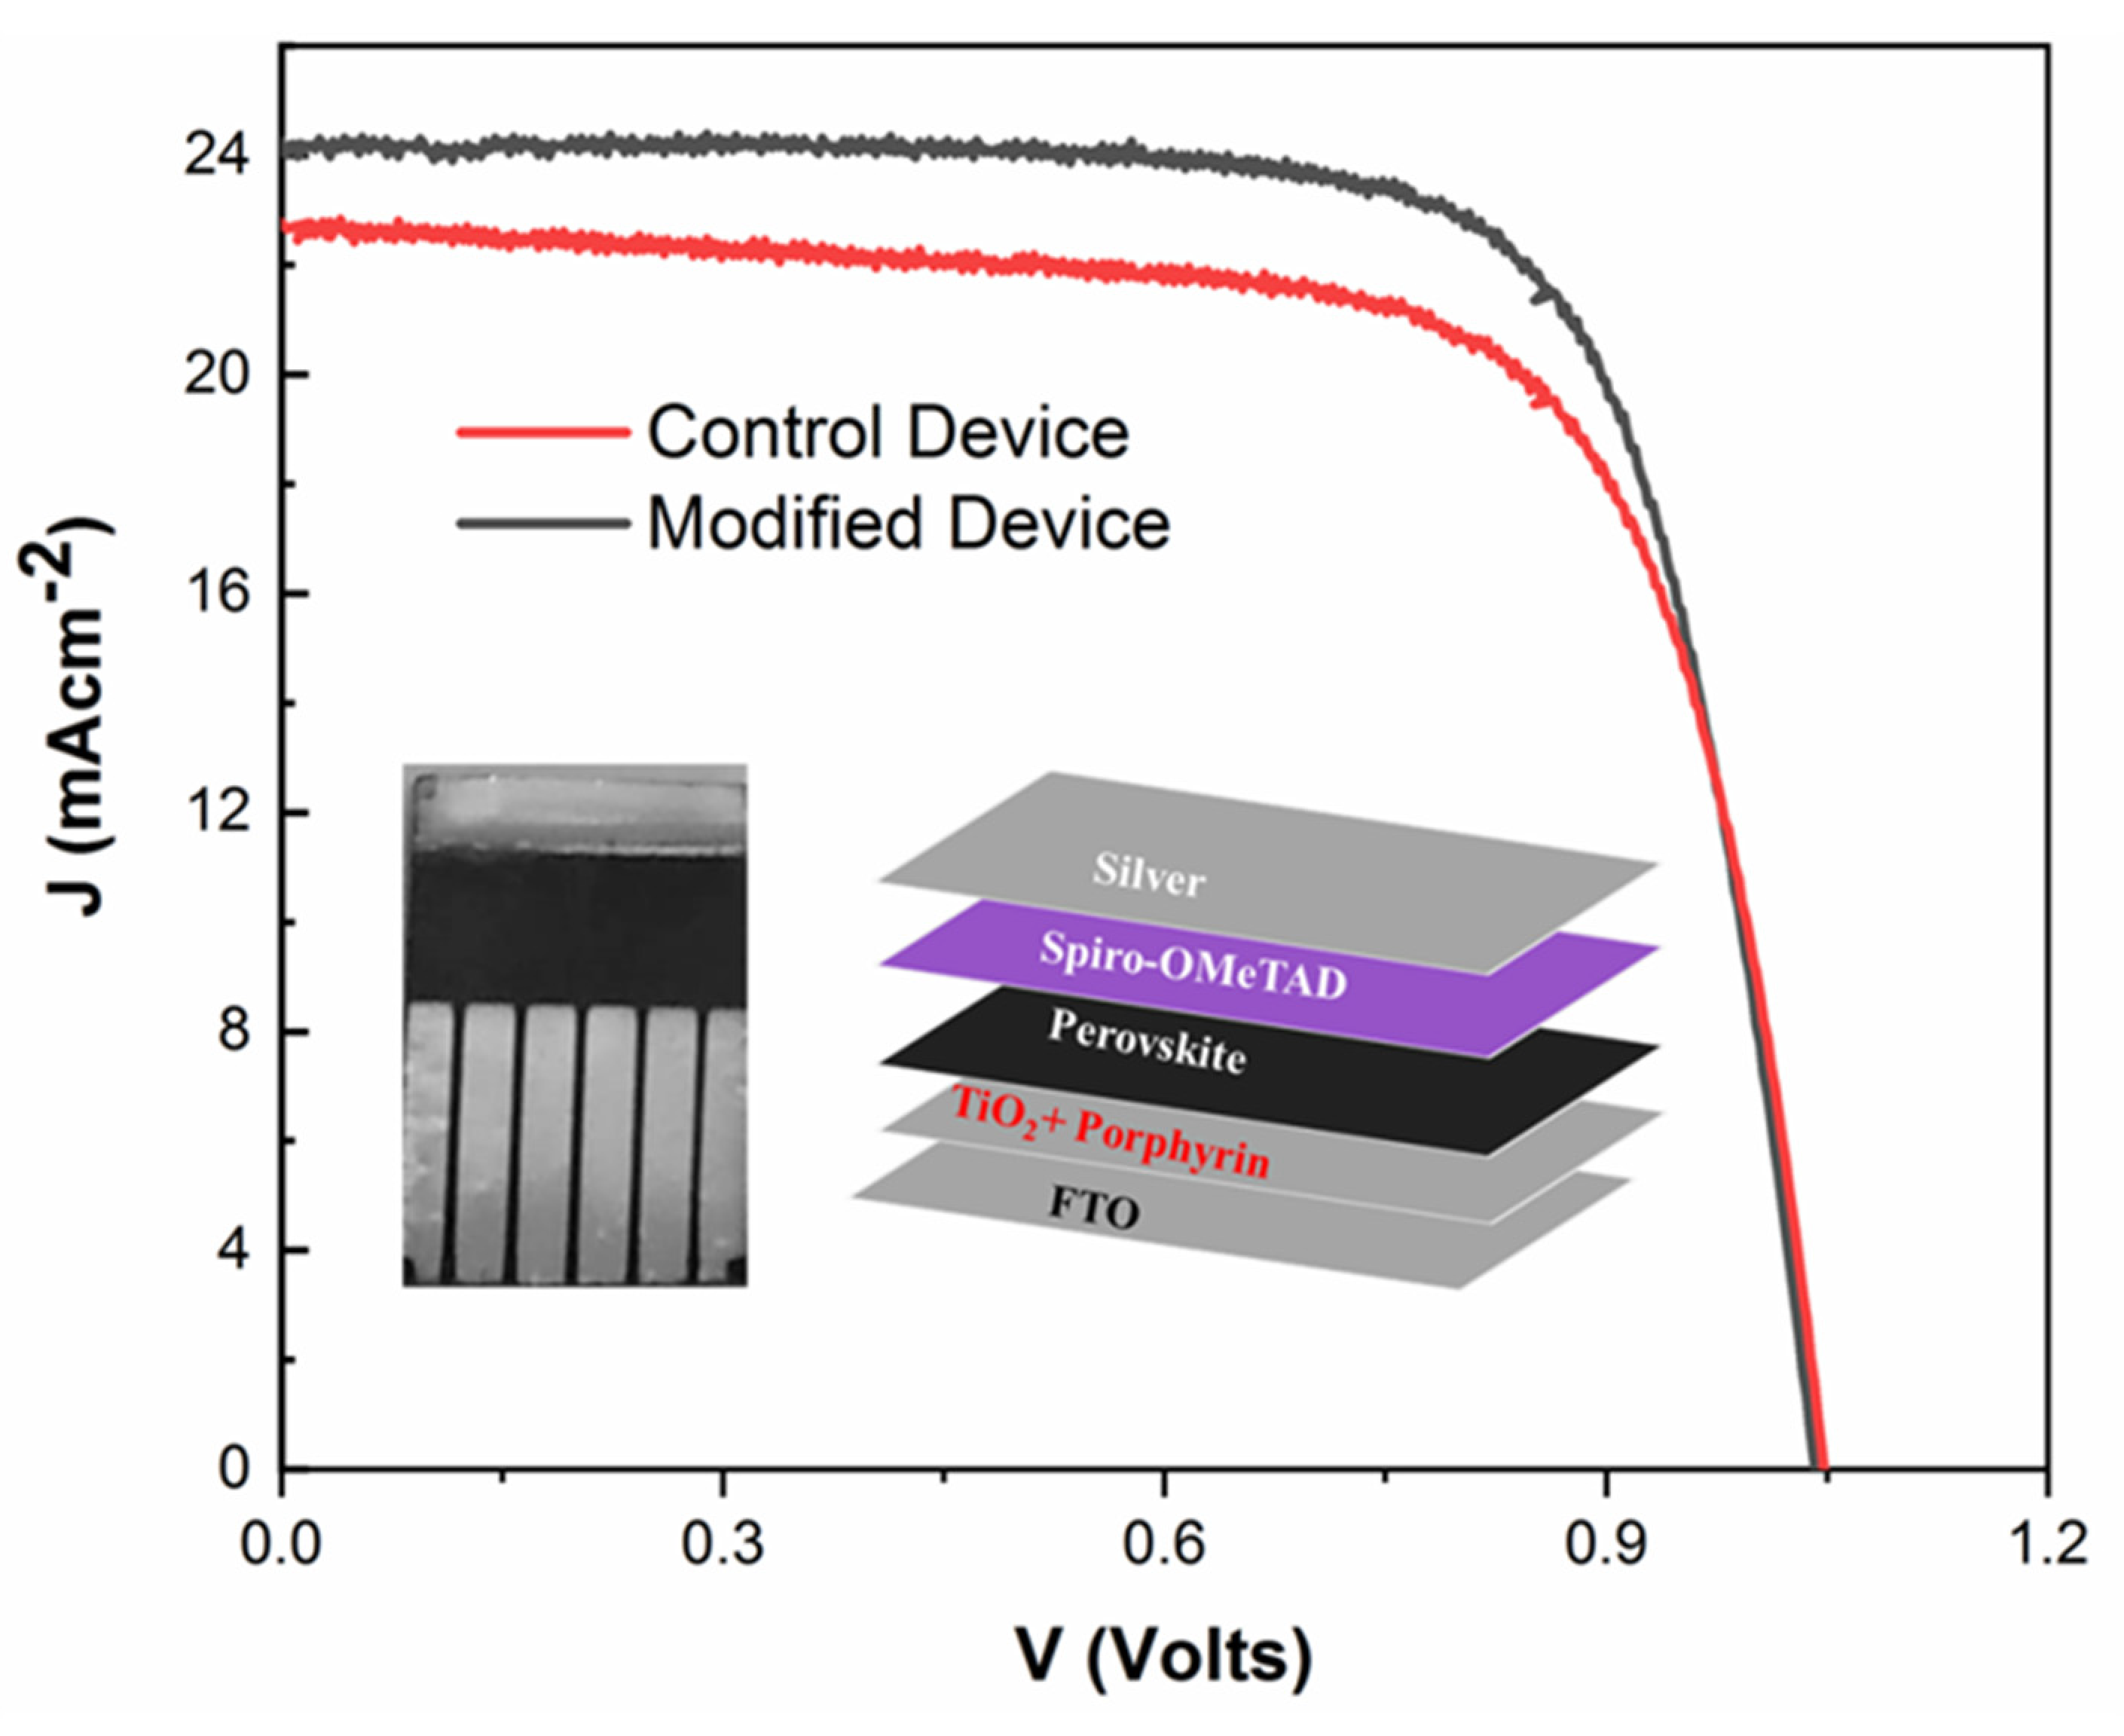
Here, the triple diode model was investigated for PSCs performance simulation and modeling and solved via the modified bald eagle search (mBES) algorithm. The original BED provides its ability for many optimization and engineering issues. The mBES is an updated version with additional features for enhancing its performance compared to the BES. For this end, the mBES was chosen. In this work, two datasets of lab-fabricated PSCs devices (control and modified device) were used, as explained in detail in [
39]. To prove the superiority of mBES, a comparison with the original BES, particle swarm optimizer (PSO), Hunger games search (HGS), recent Coronavirus Disease Optimization Algorithm (COVIDOA), and bald eagle search algorithm (BES) was conducted.
The contribution of the work can be outlined as follows.
For the first time, a modified bald eagle search algorithm has been applied to determine the optimal parameters of TDM of perovskite solar cells.
The attained outcomes by mBES are compared with recent algorithms.
The precision and superiority of mBES in identifying the parameters of the TDM are demonstrated.
The rest of the paper is structured as follows:
Section 2 briefly summarizes the experimental datasets. The problem construction is explained in
Section 3. A brief summary of the modified BES is given in
Section 4. The discussion of the results is conducted in
Section 5. Finally,
Section 6 gives the conclusion of this paper.
3. Problem Formulation
In this section, the mathematical representation of the triple diode model proposed for the performance simulation of perovskite solar cells is presented and investigated. The electrical correspondent circuit of the triple diode model is displayed in
Figure 2.
From
Figure 2, the output current of the solar cell can be estimated by the subsequent relation:
where
Ipv depicts the current generated from photons.
ID1, ID2, and
ID3 represent the current in diode 1, diode 2, and diode 3, correspondingly.
Rs indicates the series resistance.
Rp symbolizes the shun resistance. Based on the Shockley formula, the current through diodes can be formulated as follows:
where
n1, n2, and
n3 signify the first, second, and third diode ideality factor, correspondingly;
I01,
I02 and
I03 are the currents at saturation of diode 1, diode 2, and diode 3, correspondingly.
Vt designates the thermal voltage. It can be considered via the following equation:
where
k symbolizes the Boltzmann constant.
T is the PV panel temperature.
Ns indicates the number of series solar cells, and
q symbolizes the electron’s charge. Based on the relation mentioned above, the solar cell output current considering TDM can be estimated as follows:
To increase the current and voltage of the PV array, the solar devices are connected in series and parallel combinations. Therefore, considering the number of parallel strings (
Np) and a number of series cells (
Ns), the PV output current,
I, is described as:
Considering Equation (5), the triple diode model encloses nine unknown parameters (
Ipv,
,
,
Rs,
Rp). Therefore, accurate values of the unknown parameters must be assessed to get the precise characteristics of the solar PV module. The nine unknown parameters of TDM are required to be identified accurately. The RMSE is estimated using the relation:
where
N means the number of datasets,
Im symbolizes the measured current, and
Ie designates the assessed current. The RMSE helped assess the optimizers’ performance in terms of accuracy (final results accuracy) since it generated smaller fitness values.
4. The Modified Bald Eagle Optimization Algorithm
In this study, the mBES algorithm was employed [
40]. The mBES is based on changing the control factors that regulate location change in each iteration from constant parameters to variables whose values vary depending on the iteration. Furthermore, to improve its exploration and exploitation process, the mBES enhances the influence of this parameter as a function of the maximum number of iterations and the actual iteration. As a result, there was higher performance. This algorithm has three phases, as follows.
- (a)
Phase selection: the eagle searches for a new place close to its optimum position. However, as the number of iterations rises, the gap between the best and new places decreases. This phase may be expressed as follows
where
Pm denotes the mean of all positions, and
TF is an adaptive parameter called transition factor used to improve the exploitation and exploration phases. It can be formulated as
where
Imax expresses the maximum number of iterations,
i is the current iteration, and
k is a gain [1.5, 2].
- (b)
Searching phase: the eagle searches and updates its position in this phase as follows
where
Pj is the
jth new position, and
x and
y are the directional coordinate indicators that can be obtained as follows
where
R is a constant [0.5, 2] and
C1 is a control gain that can be obtained as follows
where
α1 is a constant [
5,
10].
- (c)
Swooping: this is the last step, where the eagle beats its prey. It can be modeled as follows
where
c1 is a random number [
1,
2] used to accelerate the eagle’s movement,
x1 and
y1 are directional coordinate indicators defined in Equation (7), and
EO is an enhancement operator used to improve the eagle’s movement throughout this phase. This parameter can be defined in Equation (8).
where
C2 represents a control parameter [5, 10].
5. Results and Discussion
For fair judgment, the population numbers (25) and the iteration numbers (100) were kept the same for all used optimizers in this study. During the optimization process, the RMSE between the experimental datasets and the calculated current density of PSC was used as an objective function, which was to be minimized. The minimum and maximum limits of PSC parameters and the best parameters of two types of PSCs using different optimizers are shown in
Table 2. To prove the trustworthiness of the recommended mBES, the considered algorithms were executed 30 times. The statistical assessment of the considered algorithms is shown in
Table 3. The details of 30 runs are shown in
Table 4. From
Table 2, the estimated control and modified device parameters are in agreement with their experimental analogy at very low deviation values. It is unblemished that the recommended optimization tool helped in obtaining the superlative results between all the used optimization tools. It is well-known that both the ideality factor and the current at saturation of the diode are essential elements to study and analyze the PSC performance, but it is complicated to determine them experimentally. Therefore, the simulation model and the proposed optimization tool determined their value. Thus, better understanding and performance of PSC can be performed, and this is also a merit of the simulation used in this study.
Table 3 presents the statistical performance evaluation of the different algorithms, while
Table 4 presents the details of this performance. From
Table 3, the recommended tool has superiority in both studied cases. Additionally, it indicates that the recommended tool performance is the best among all the tools used in this study. It is also noticed from
Table 3 that the mean RMSE values for the control device change between 4.11 × 10
−5 and 8.33 × 10
−3. It is clear that the minimum value (4.11 × 10
−5) is obtained by the proposed algorithm, followed by (6.14 × 10
−5) obtained via HGS optimization algorithm. The minimum cost function of 9.22 × 10
−6 was achieved by the proposed mBES optimizer tracked by BES and HGS optimizers correspondingly. Concerning the modified devices, the mean RMSE values change between 4.74 × 10
−5 and 9.84 × 10
−5. The minimum mean RMSE of 4.74 × 10
−5 was attained by the proposed mBES algorithm, followed by 8.70 × 10
−5 using the HGS algorithm. The minimum cost function of 1.91 × 10
−5 was achieved by the proposed mBES optimizer tailed by the BES and HGS optimizers correspondingly.
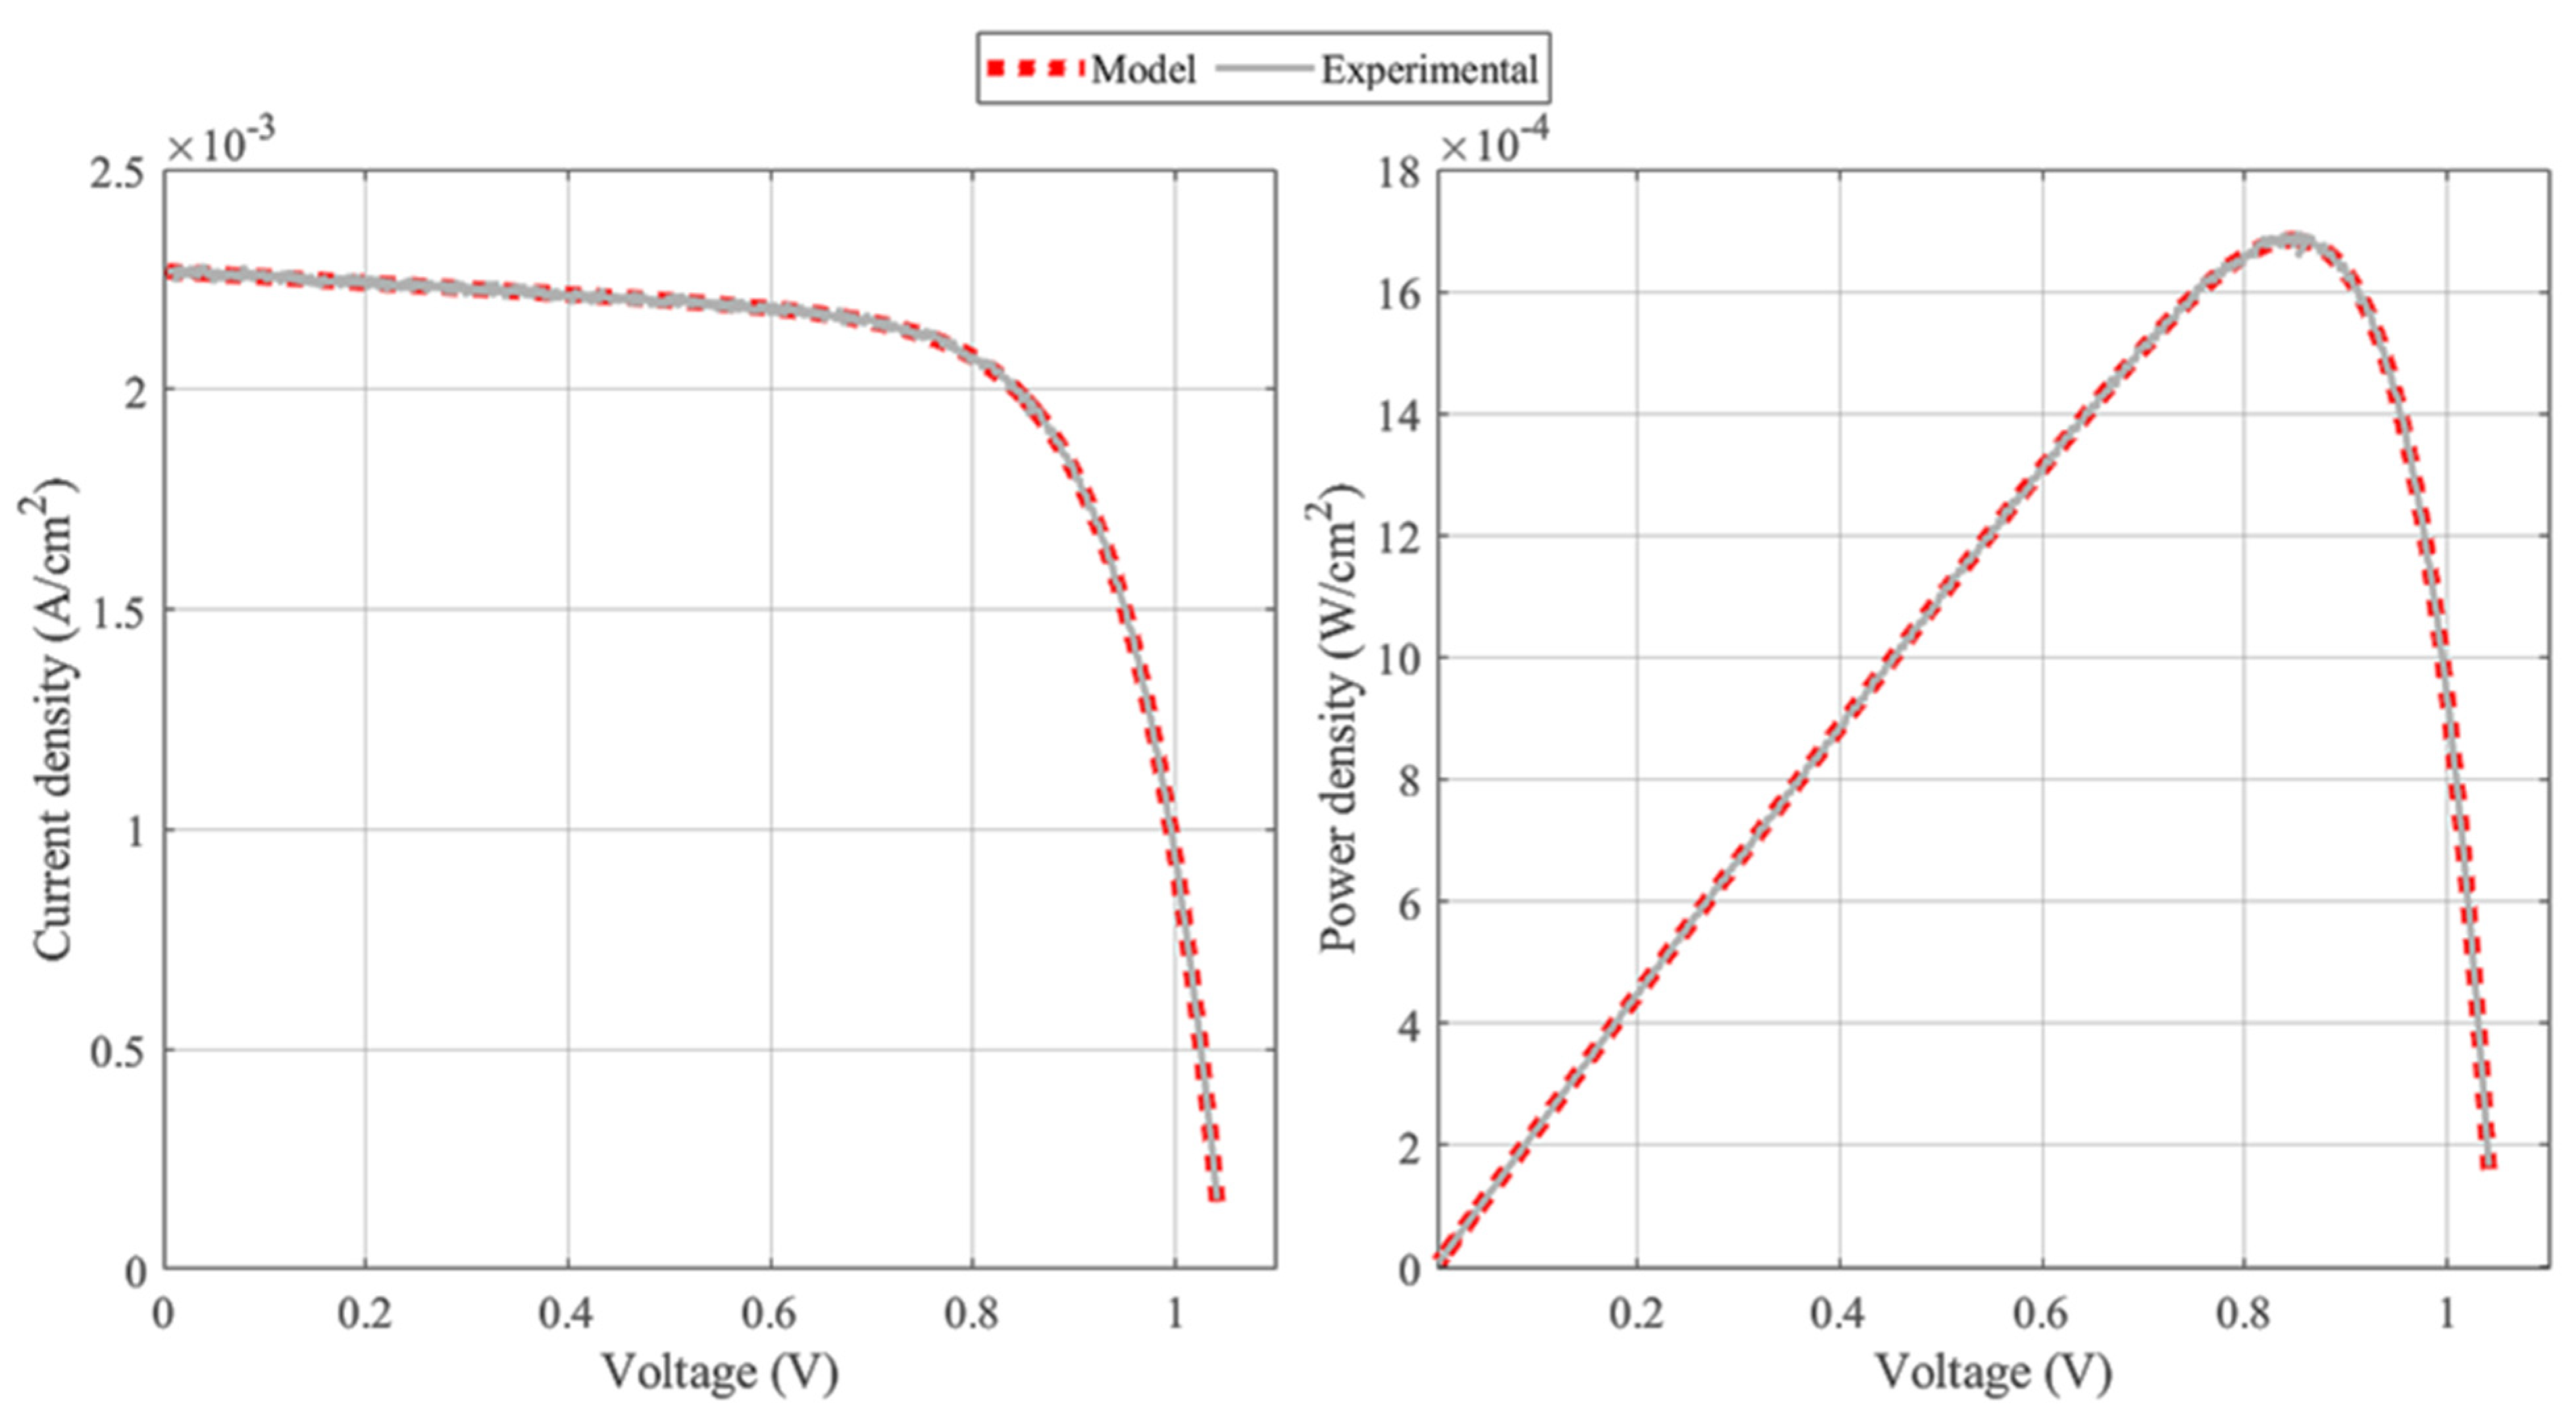
The comparison between the measured datasets and calculated current–voltage and power–voltage for the two studied cases in this work are presented in
Figure 3 and
Figure 4. The assessment showed that the measured datasets and calculated current–voltage and power–voltage curves are practically matching, which is a sign of the effectiveness of mBES in determining the parameters of TDM for PSCs.
Figure 5 indicates the convergence curves while applying the different algorithms for both the control and the modified PSCs parameters determination. Based on these figures, the recommended mBES performance is the best in comparison with other used optimizers. Added to that, there is also a fast convergence and lowest cost function when using the proposed mBES optimizer, proving its superiority.
Table 5 illustrates the ANOVA test outcomes, while the ranking is presented in
Figure 6. The
p-value is much lower than the F value, suggesting that the reported results disagree. As demonstrated in
Figure 6, the mBES can provide higher mean fitness and variances performance.
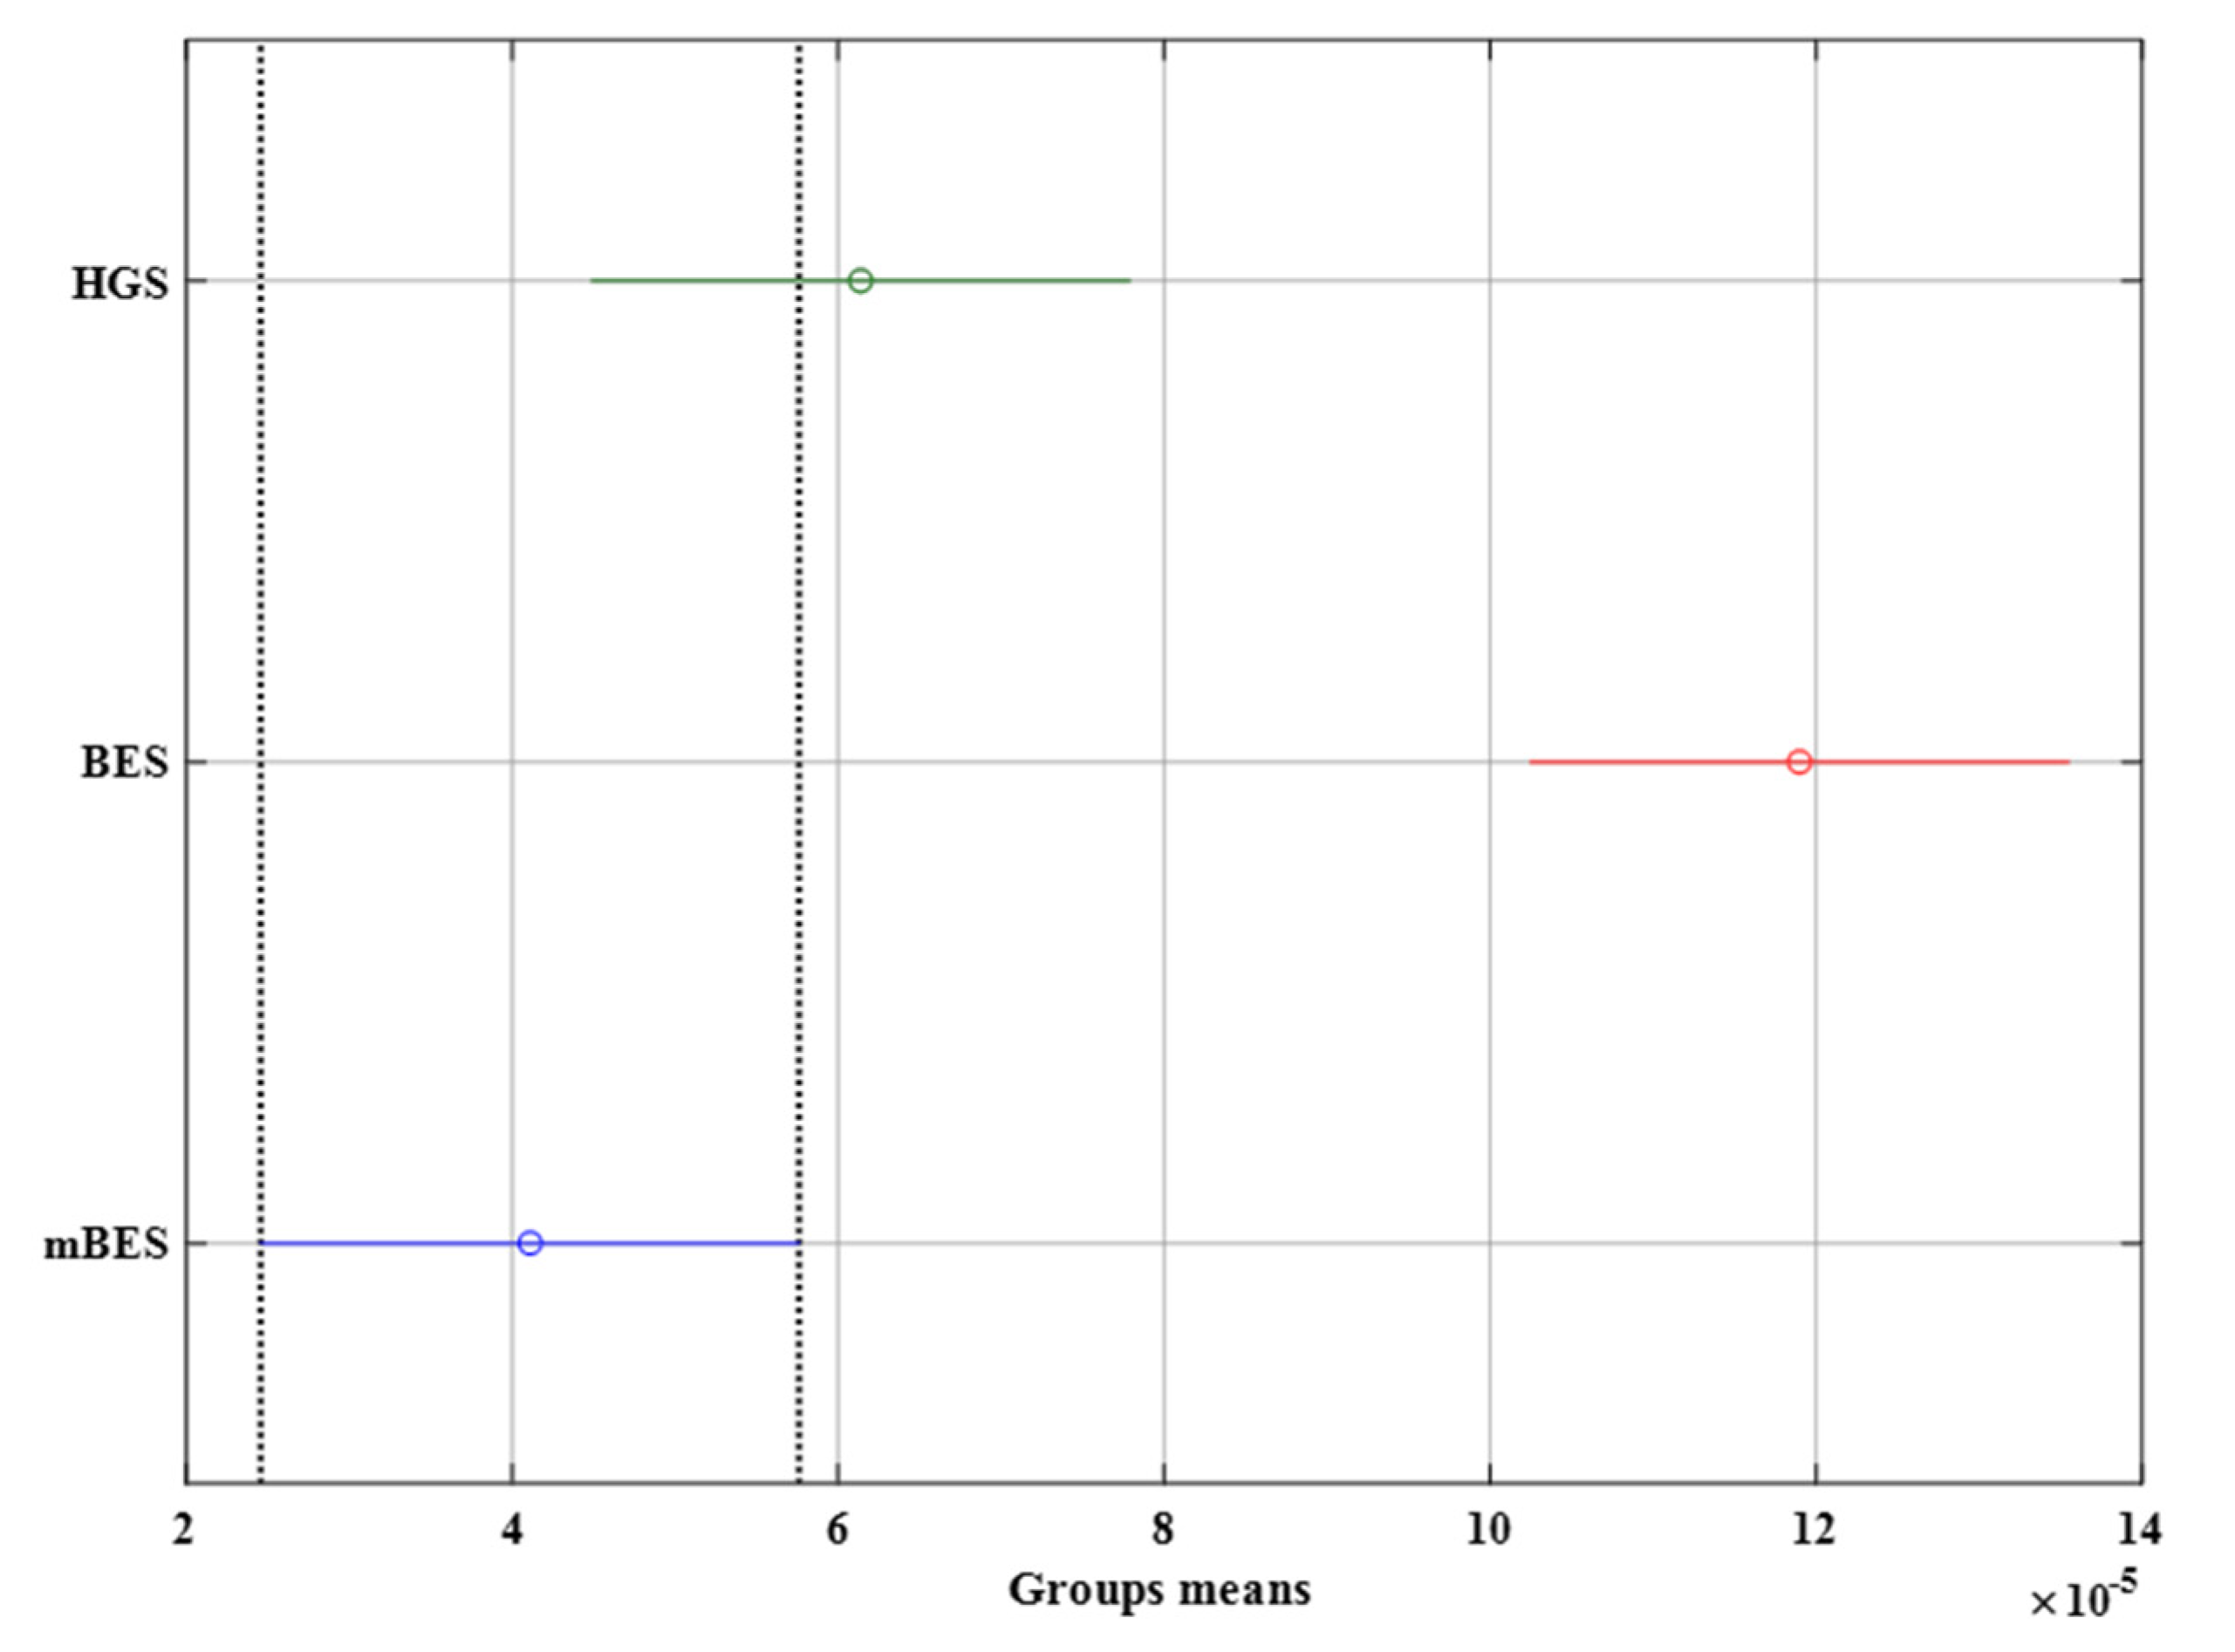
The Tukey HSD (honestly significant difference) examination was used to approve the ANOVA test outcomes after excluding both PSO and COVIDOA due to their limited performances.
Figure 7 depicts the results. The mBES has a more excellent mean fitness, indicating that it can tackle this problem successfully. The HGS follows it, then the standard BES.
Analogous to the previous study, the ANOVA test will be accomplished to confirm the performance of each algorithm. The test results are provided in
Table 6, and the ranking is displayed in
Figure 8. The
p-value is much smaller than the F value, meaning that the reported results differ. As demonstrated in
Figure 8, the mBES can provide higher mean fitness and variances performance. This approves its ability for both types.
The Tukey HSD test was performed after excluding both PSO and COVIDAO.
Figure 9 depicts the results. The mBES has an excellent mean fitness, indicating that it provides the best performance for both types. The HGS also follows it, then the original BES.


 ,
, 


