1. Introduction
Technological breakthroughs in renewable power generation, battery storage, electric mobility, and advanced data logistics are changing the way the electric grid is designed and operated. A large contributor to this change will be the large amount of distributed energy resources (DERs) expected to be installed in the near future. These DERs, which include rooftop solar, battery storage, and electric vehicles, are more intermittent and less predictable in nature. This makes it difficult for electric grid utility companies to balance generation with loads at the right time. If left unchecked, this could lead to a lower quality of service. Phenomena, such as brownouts and blackouts, voltage fluctuations, reverse power flow, and degraded power quality [
1,
2,
3], may increase in frequency.
Overcoming these challenges requires finding more sophisticated device and energy management strategies. Transactive energy (TE) is one popular framework [
4,
5] that promises to achieve flexible, robust, and adaptive energy management systems geared towards integrating DERs into the existing grid. The GridWise Architecture Council (GWAC) defines TE as “a set of economic and control mechanisms that allows the dynamic balance of supply and demand across the entire electrical infrastructure using value as a key operational parameter” [
6]. This high-level definition provides some clues as to how TE should work but leaves the specific implementation details to system designers.
In our previous work [
7], we examined aspects of an economy-based TE system designed to use a group of independent reinforcement learning agents to manage DERs in a community. DERs within the community are coordinated through trading in a local energy market based on double auctions (see
Appendix A for details). We concluded that, given the right market design, the proposed TE system can produce responsive and relevant prices. This would, in turn, translate into bill savings for some participants. However, participants did not have profile shaping capabilities; therefore, additional benefits were left untapped. To the best of our knowledge, there has been no previous contribution that studies the relationship between efficient market interactions by independently acting, fully automated agents equipped with battery storage, and the resulting effects on power flow. This article fills this research gap and explores the effects of battery-storage-based profile shaping in a similar setting as our previous work. We hypothesize that, in addition to bill savings, improvements in power flow can be observed as a result of efficient market interactions between participants.
This article is organized in five sections.
Section 2 describes the necessary background information and provides a review of related work, focusing on topics related to transactive energy and automated demand response.
Section 3 describes the experiments carried out to study the effects of battery energy storage in a local energy market. Specifically, it compares the resulting power flow and end-customer bills of two battery-based profile-shaping strategies. The main conclusions are summarized in
Section 5, along with possible directions for future work.
2. Background and Related Work
The addition of DERs, especially at the edge of the grid, can lead to decreased flexibility, resiliency, and quality of service of the electric grid. To combat these problems, demand response techniques have been used to shape loads at end-customer sites that are more closely aligned with the generation profiles. Demand response (DR) techniques can be divided into two categories: direct and indirect. Direct DR refers to methods in which the electric utility company is given direct control over heavy-loading appliances, such as HVACs, to increase or decrease the load on the grid as needed. Direct DR is limited in scope due to the small variety of controllable appliances available and the large infrastructure overhead [
4,
5,
8]. It is also considered more invasive and tends to create more friction between the utility company and the customers. Indirect DR, on the other hand, uses incentive signals to influence customer behavior in the hope that enough customers will respond to make a difference. Popular methods include time-of-use (TOU) pricing, critical peak pricing, and dynamic pricing (DP) [
8]. A survey by Chen et al. [
4] concludes that customers generally prioritize comfort over responding to price signals, making indirect DR largely ineffective.
Given these challenges and limitations, transactive energy has been gaining interest as a modern DR framework that flexibly offers a mixture of direct and indirect DR. There is a large body of research on TE in the form of transactive control (TC), which uses the TE framework to generate a combination of direct and indirect control signals to achieve optimal power flow (OPF). Typically, transactive control schedules are calculated via a utility function in conjunction with forecasts and expert-designed behavioral models [
4,
5,
8]. Some notable TC approaches include the following.
Works by Hu et al. [
9], who proposed an aggregator-based optimization approach that generates charging/discharging schedules for electric vehicles (EVs). A simulation was performed on a Danish distribution network to show the decrease in the frequency of line congestion and voltage violation.
Nazir et al. [
10] used an aggregator-based model incorporated into a model predictive control (MPC) framework to calculate optimal price signals and to control thermostatically controlled loads (TCLs) and storage devices to decrease power oscillations at substation feeders.
Soarez et al. [
11] introduced a comparable aggregator-based approach using a dual decomposition algorithm. To validate the efficacy of the algorithm, they performed a field test involving six houses. Unfortunately, the results were inconclusive due to the lack of flexibility at the test site.
A key takeaway of the research performed by Soarez et al. is that TC may not be flexible enough to dynamically adapt to changes in real time. Fundamentally, OPF-based TC is not much different from contemporary DR techniques. Therefore, it still suffers from the same issues [
4,
8]. In an effort to solve these issues, research on TE approaches that do not use OPF as a primary objective has been ongoing. A promising approach is economy-based TE. Unlike TC, economy-based TE does not aim to create schedules that must be strictly adhered to in order to achieve OPF. However, improvements in power flow can be observed as a result of efficient market interactions between participants. Some notable research in this area includes the following.
Zhou et al. [
12] used a system that combines fuzzy rules and
Q-learning to train agents exchanging energy in a peer-to-peer energy market that directly ties prices to the supply/demand ratio. They investigated several community configurations with different battery energy storage and renewable generation assets and evaluated their performance. This system uses an aggregator-based method to predetermine local energy prices in a centralized energy pool, and agents are trained to only control battery energy storage in reaction to these price signals. While lower bills are shown against TOU and net-billing, the authors do not show the effects of battery control on power flow. In contrast, our work presented in this article will provide a more holistic view with perspectives on both economic benefits and effects on power flow.
Zhang et al. [
13] trained a reinforcement learning agent to manage a community-shared battery. The battery is allowed to trade on a peer-to-peer TE market, with the goal of maximizing overall economic performance. The authors show that positive economic benefits can be achieved, even when considering the running costs of the battery. This system designates the battery as both the market and the only peer that participants can trade with. In contrast, our work is more representative of a real-world economy by allowing all participants to trade with each other. Energy storage is an optional add-on to any participant for energy profile shaping.
In our previous work [
7], experiments were performed to test the effects of different properties of the double auction market on the development of reinforcement learning policies. This study was performed using Automated Local Energy Exchange (ALEX, see
Appendix B for an overview). The results showed that given rational agents, the market must be truthful and budget balancing must be weakened to develop policies that reflect supply and demand. We also showed that using the market as a DER coordination mechanism can lower bills compared to TOU and net billing (
Appendix C).
The content of this article uses the information presented in our previous work [
7], and we recommend reading it to gain the relevant context.
3. The Effects of Battery Storage in a Local Energy Market
Although the relevant research presented in
Section 2 shows promising economic gains achievable through economy-based TE, there is a lack of understanding of its effects on power flow. The experiments described in this contribution are designed to evaluate the effects of including battery energy storage in a local energy market on both power flow and bills.
3.1. Experimental Design
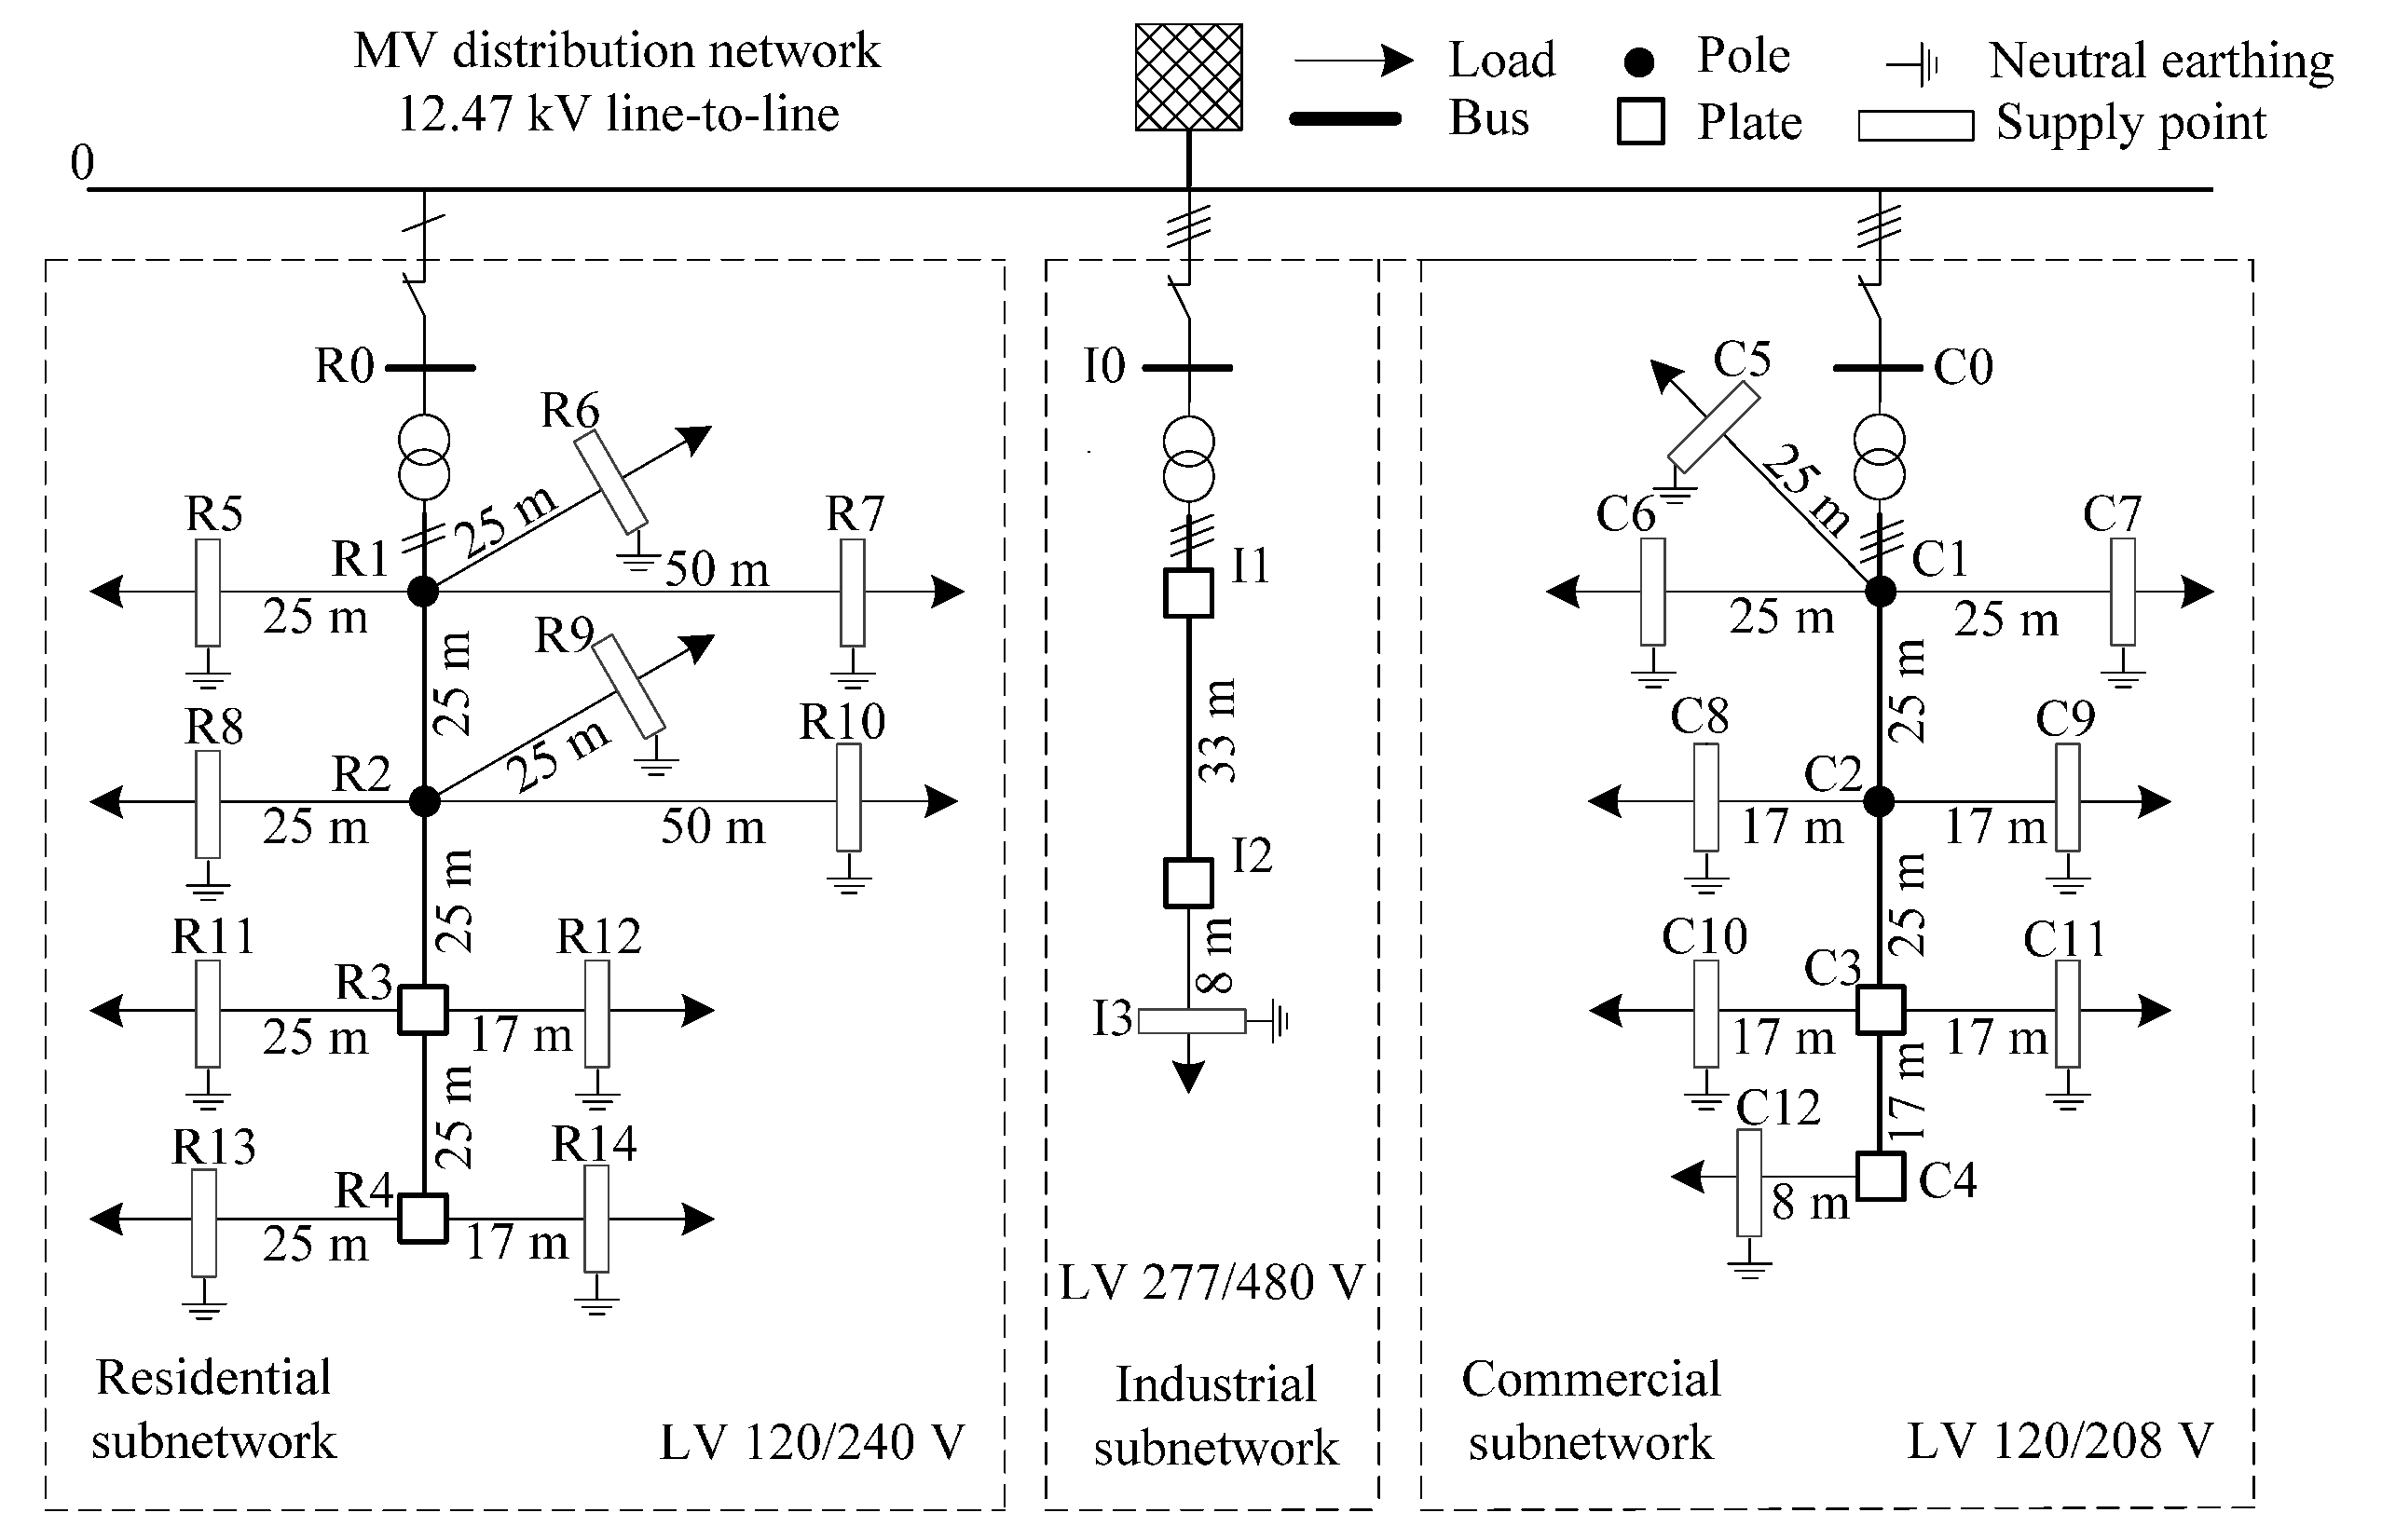
This experiment requires power flow simulations to demonstrate the possible effects of profile shaping. Since our application of profile shaping is focused on the grid edge, the CIGRE North America low voltage residential benchmark circuit [
14,
15] (shown in
Figure 1) is a suitable circuit to perform this study on. Due to its previous inavailability, we created a circuit model of this circuit for OpenDSS and made it available on GitHub [
16]. Simulations were performed and evaluated against the results published in the CIGRE report [
14] for validation, which produced node voltages within 2% of the reported values. As node voltages are the primary metric used for evaluation, this model is considered sufficiently accurate for the purposes of this study.
3.2. Use Case Scenarios
The energy profiles used are selected from the Smart* SunDance Dataset [
17,
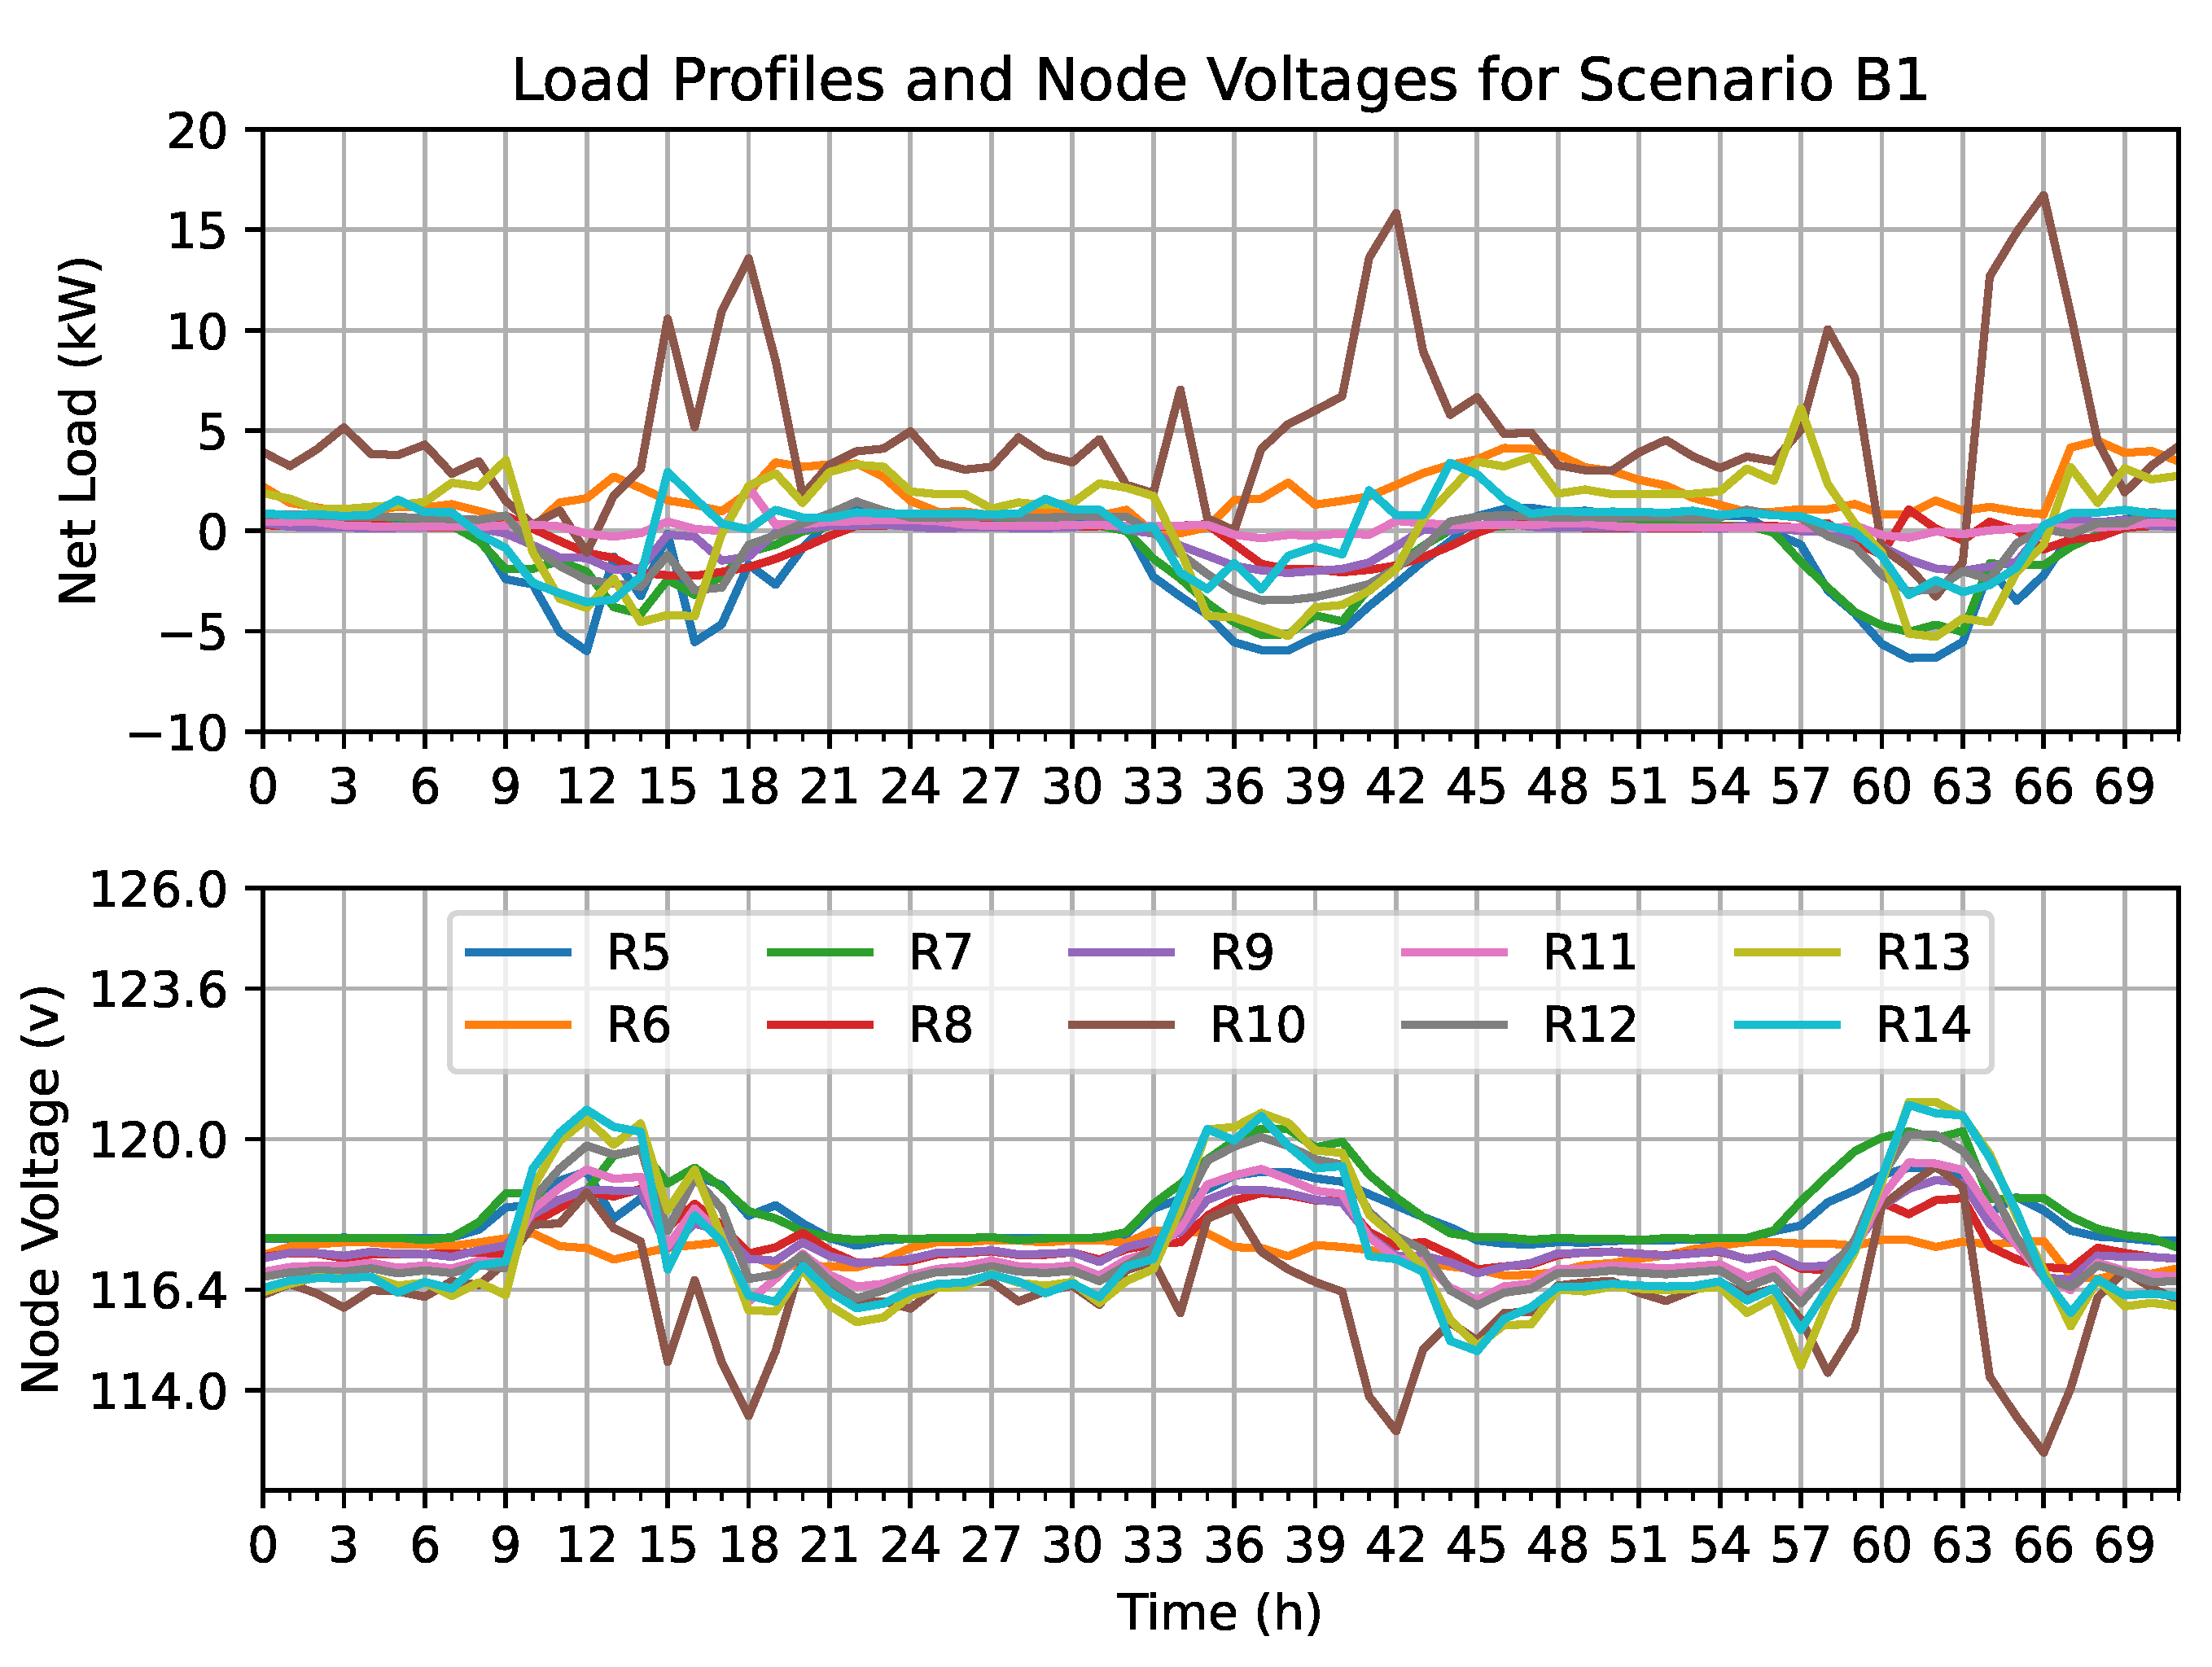
18]. To somewhat ensure location relevance, the selection is limited to the Denver time zone. Monte Carlo search is used to create approximately 500 combinations of energy profile-to-node mappings, each followed by a 24-h time series power flow simulation to produce the same number of time series node voltage plots. The node voltage plots are then inspected both programmatically and visually to establish the baseline configuration (B1). The ideal outcome should have a single participant who causes consistent voltage violations, and its surrounding neighbors should have excess generation to spare. The set of profile IDs for the corresponding node locations that meet this criterion is shown in
Table 1. The energy profiles and the resulting node voltage plots are shown in
Figure 2.
In this case study, R10 has been assigned the energy profile with the largest load (peaking at over 15 kW). As expected, this causes multiple occurrences of under-voltage violations throughout. Consequently, it is the location where the BESS should be deployed. The BESS used are modeled after a typical Tesla Powerwall 2, with a usable capacity of 13.5 kWh and a continuous charge/discharge rating of 5 kW. Profile-shaping strategies can then be deployed and examined. In this study, two strategies are implemented to examine the effects of enabling DER coordination through a local energy market. The strategies are described as follows:
- B2:
Attach a BESS to R10. Use greedy control with no local market access.
- B3:
Attach a BESS to R10. Use a rule-based controller with access to the local market.
B2 is designed to emulate contemporary control strategies that focus on self-sufficiency. Generally, this involves charging the battery (if there is residual generation) and discharging (if there is residual load). Charge/discharge times may be modified by a schedule if time-of-use or dynamic pricing is in play. In general, the success of this strategy relies on the availability of an oversized solar generation system and is often infeasible due to a variety of constraints, such as cost, regulatory, roof area, etc.
The purpose of B3 is to create the simplest scenario that can demonstrate the effects of maximizing the utilization of local DERs. The use of a single profile-shaping capable participant with a rule-based agent makes the outcomes for this participant deterministic. The rules are described by the pseudocode shown in Algorithm 1. The Python implementation used is available in the project repository [
19] as
basic_trader.py.
| Algorithm 1 Energy Trading and Management Algorithm for B3 |
for each market round do for last settled round do adjust BESS schedule based on successful settlements end for if residual load > 0 then if BESS is available then if next_settle is between 8AM to 4PM (inclusive) then Battery is allowed to charge Submit bid where, quantity = residual load + max charge capacity price = $0.14/kWh else Battery is allowed to discharge Submit ask where, quantity = max(0, max discharge capacity − residual load) price = $0.07/kWh end if else Submit bid where, quantity = residual load price = $0.14/kWh end if else if residual generation > 0 then if BESS is available then if next_settle is between 7AM to 3PM (inclusive) then Battery is allowed to charge Submit bid where, quantity = max(0, max charge capacity − residual generation) price = $0.14/kWh else Battery is allowed to discharge Submit ask where, quantity = max discharge capacity + residual generation price = $0.07/kWh end if else Submit ask where, quantity = residual generation price = $0.07/kWh end if end if end if end for
|
3.3. Evaluation of Economic Performance
This algorithm is designed to maximize market interactions using extreme bid and ask prices. Therefore, it does not reflect the equilibrium prices. However, Equation (
1) from our previous work [
7] can be applied after simulation to approximate equilibrium prices at each time step based on total supply and demand, which can then be used to calculate and compare the economic performance between B2 and B3. This equation is reproduced below for convenience.
where
s is energy supply,
d is energy demand,
is the price of electricity when buying from the grid with net billing,
is the price of electricity when selling to the grid with net billing, and
are the adjustment factors when TOU is used.
4. Results and Discussion
Figure 2 shows the energy profiles and node voltages for the baseline. The experiment takes place over three summer days (1–3 June 2015) to show the effects of leftover energy from the previous day(s). The top plot shows the hourly net loads of all participants, where positive means net consumption, and negative means net generation. The bottom plot shows the node voltages, with the major y-axes highlighting the ± 3% and ± 5% thresholds. With the exception of R10, the other profiles show behaviors that are representative of residential prosumers. Consequently, R10 experiences four under-voltage violations throughout the experiment (hours 18, 41, 42, and 66), which can be corrected using a battery storage system and profile shaping strategies.
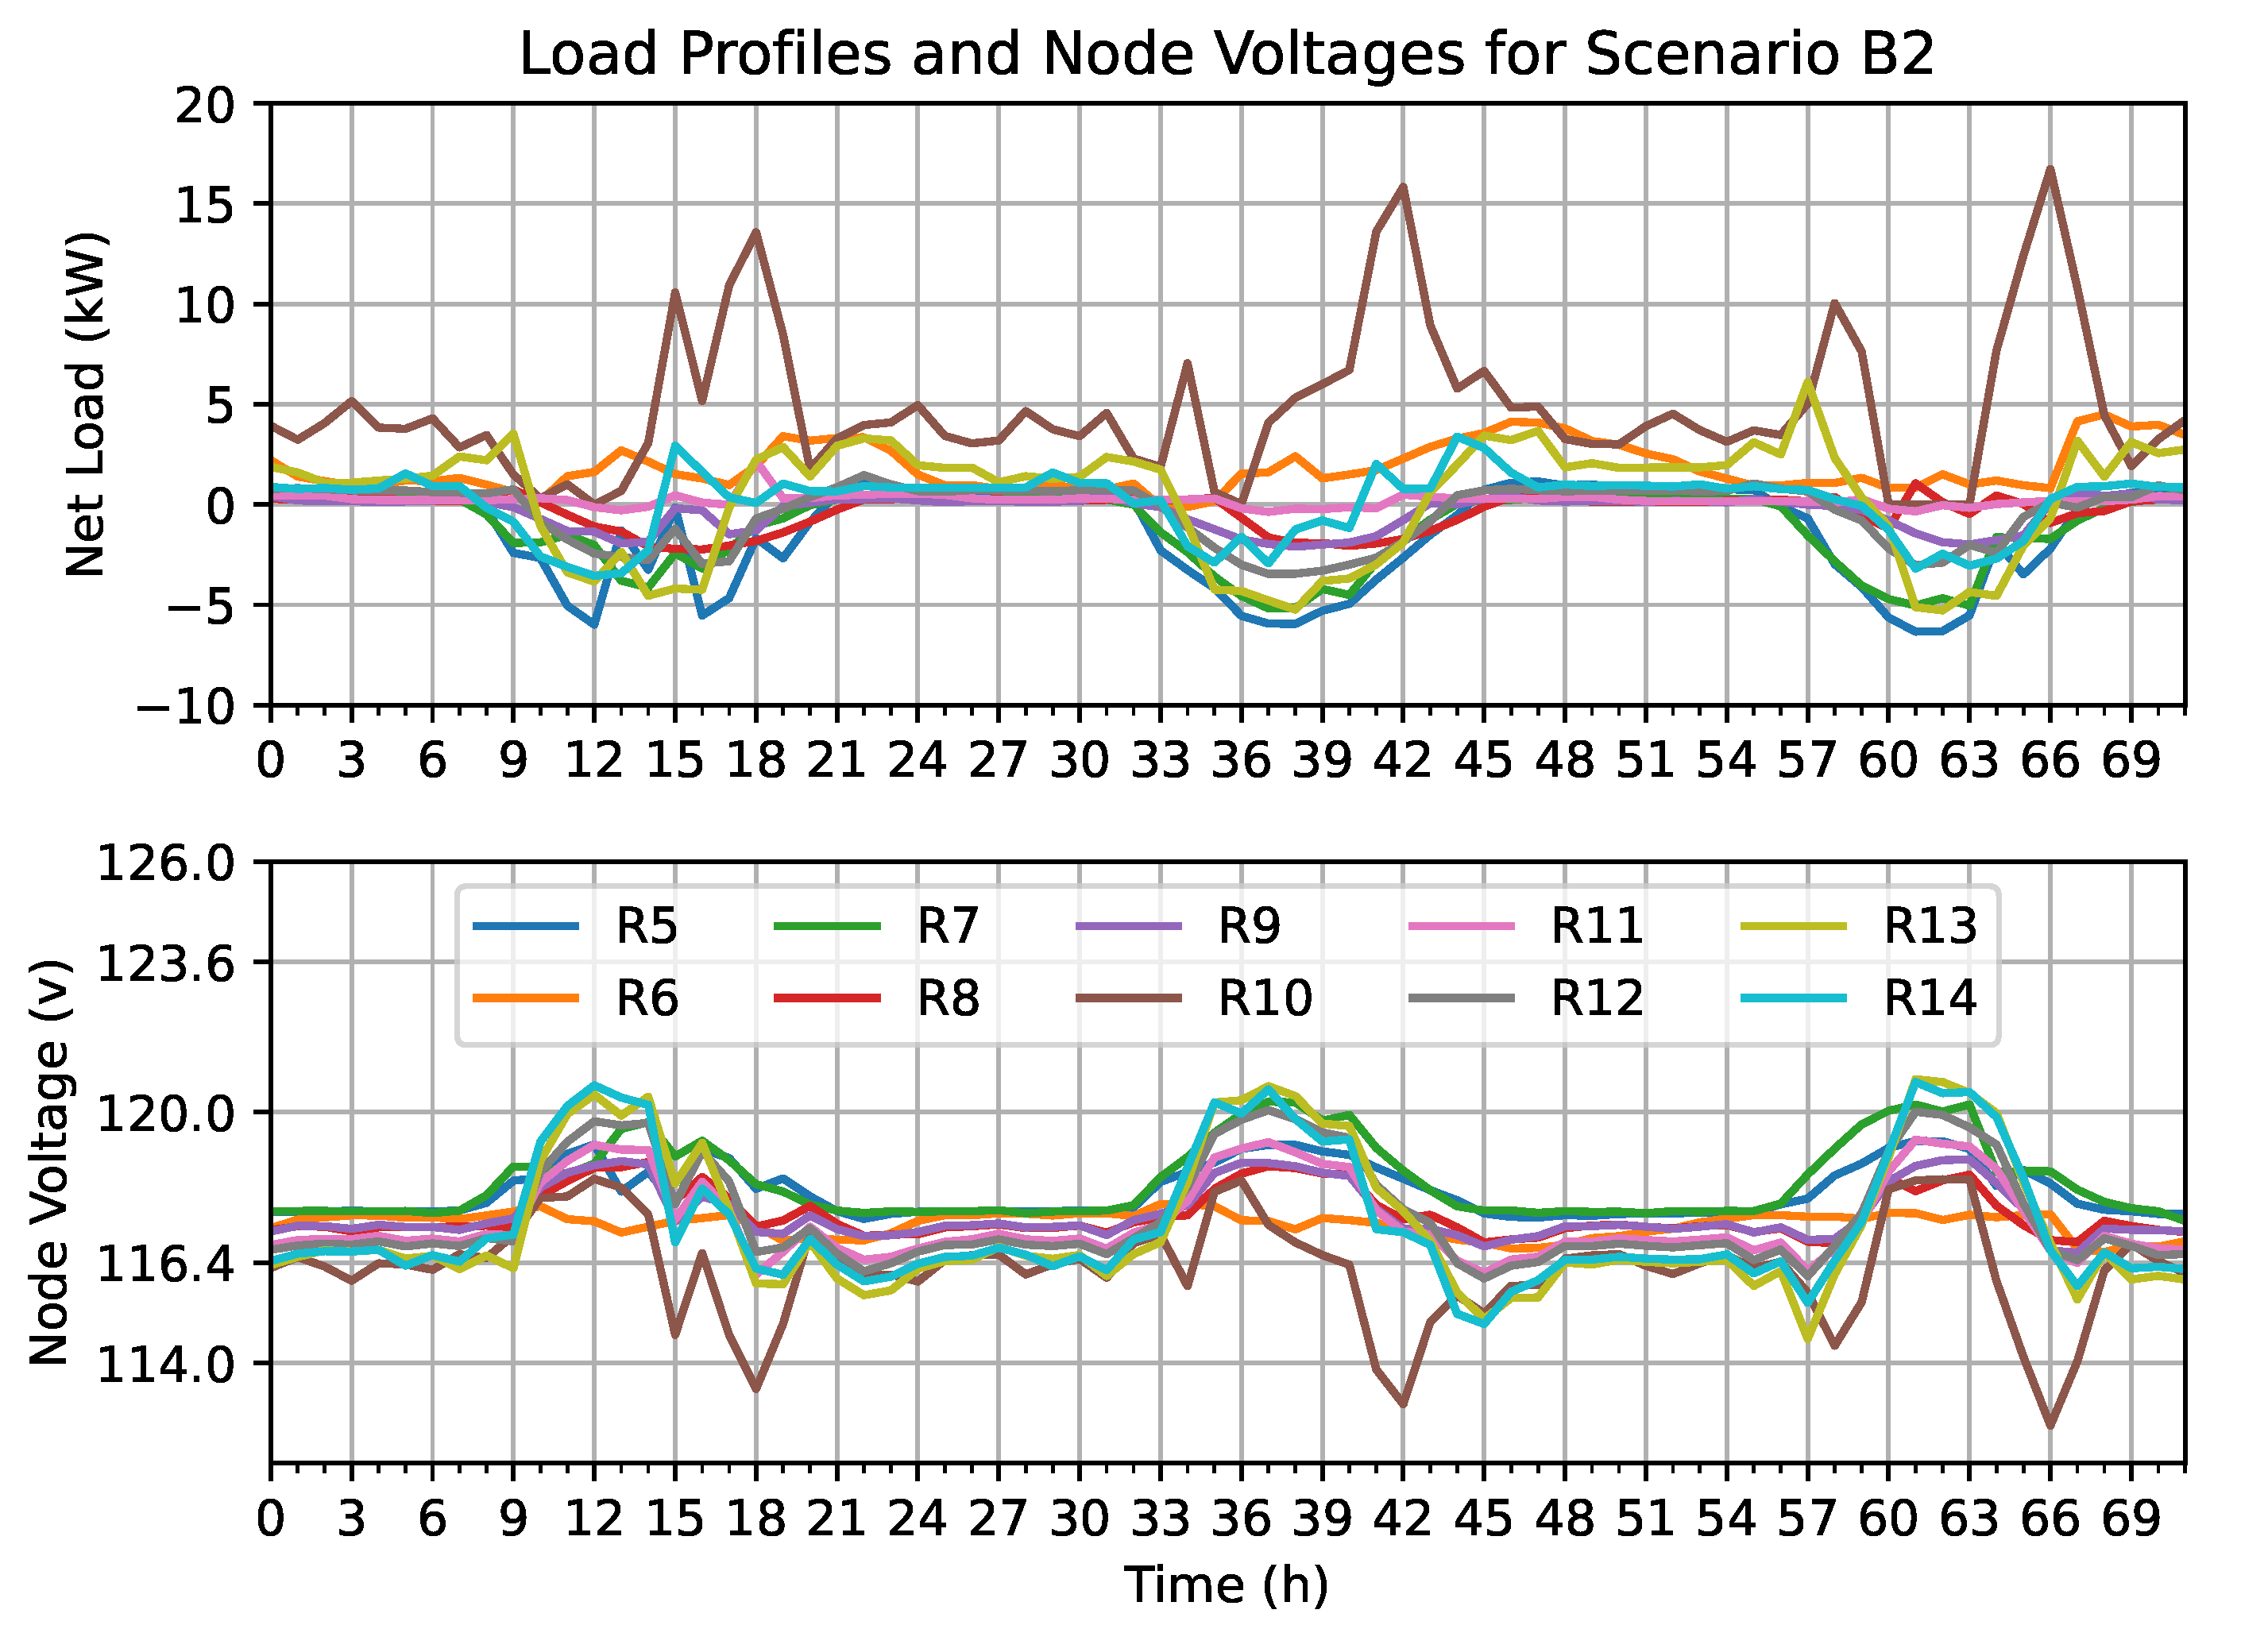
Figure 3 shows the energy profiles and node voltages for applying strategy B2 on participant R10. Upon first inspection, the difference compared to the baseline is minuscule. This should be expected, as R10 only has short windows where net generation is available for storage (hours 12, 60 to 63, peaking at approximately 2.5 kW), which is not enough to make this strategy viable. As a result, the loads at hours 13 and 64 decrease, but not enough to eliminate voltage violations. Although it may be possible to optimize this strategy by predicting load spikes, predicting these spikes with a high degree of accuracy is difficult in the real world and is one of the contributors to the general failure of schedule-based transactive control [
11].
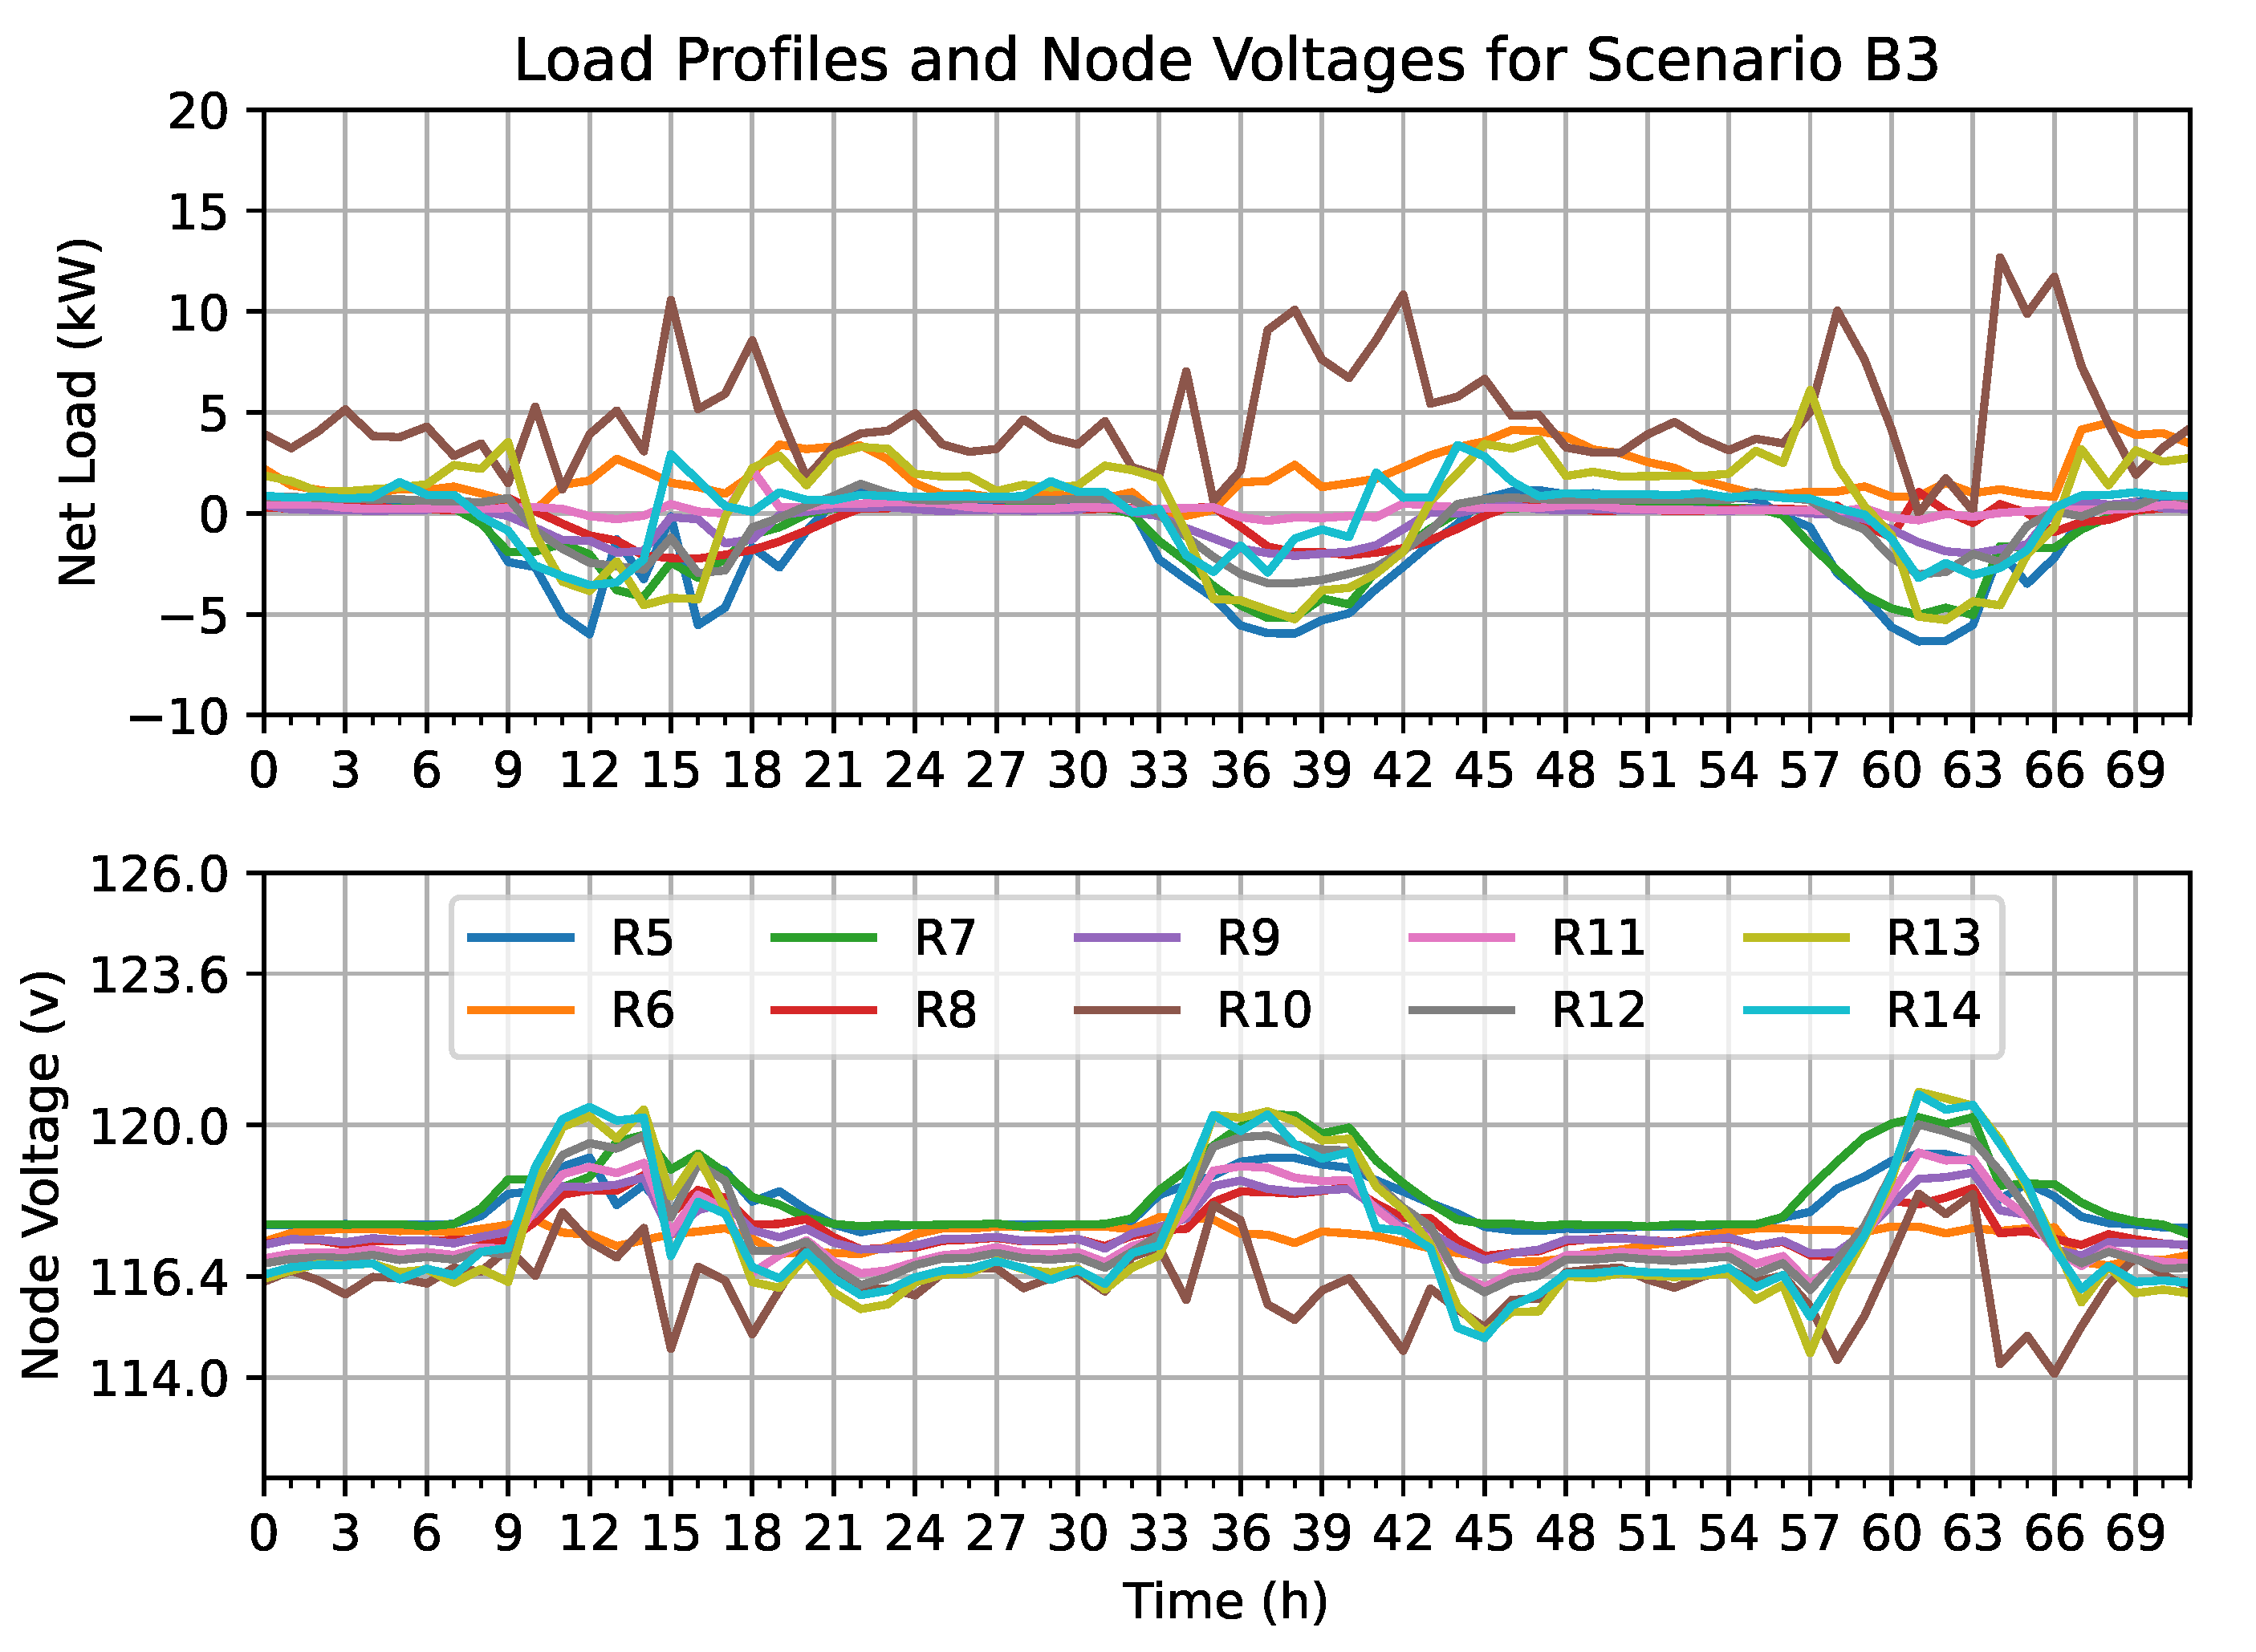
Figure 4 shows the energy profiles and node voltages for applying strategy B3 to participant R10, where local energy trading is enabled. The local energy market allows R10 to buy and store excess generation from its neighbors and bypass some of the aforementioned constraints regarding the purely self-sufficient strategy. This results in clear and drastic improvements compared to B1 and B2, the most obvious being the elimination of all voltage violations.
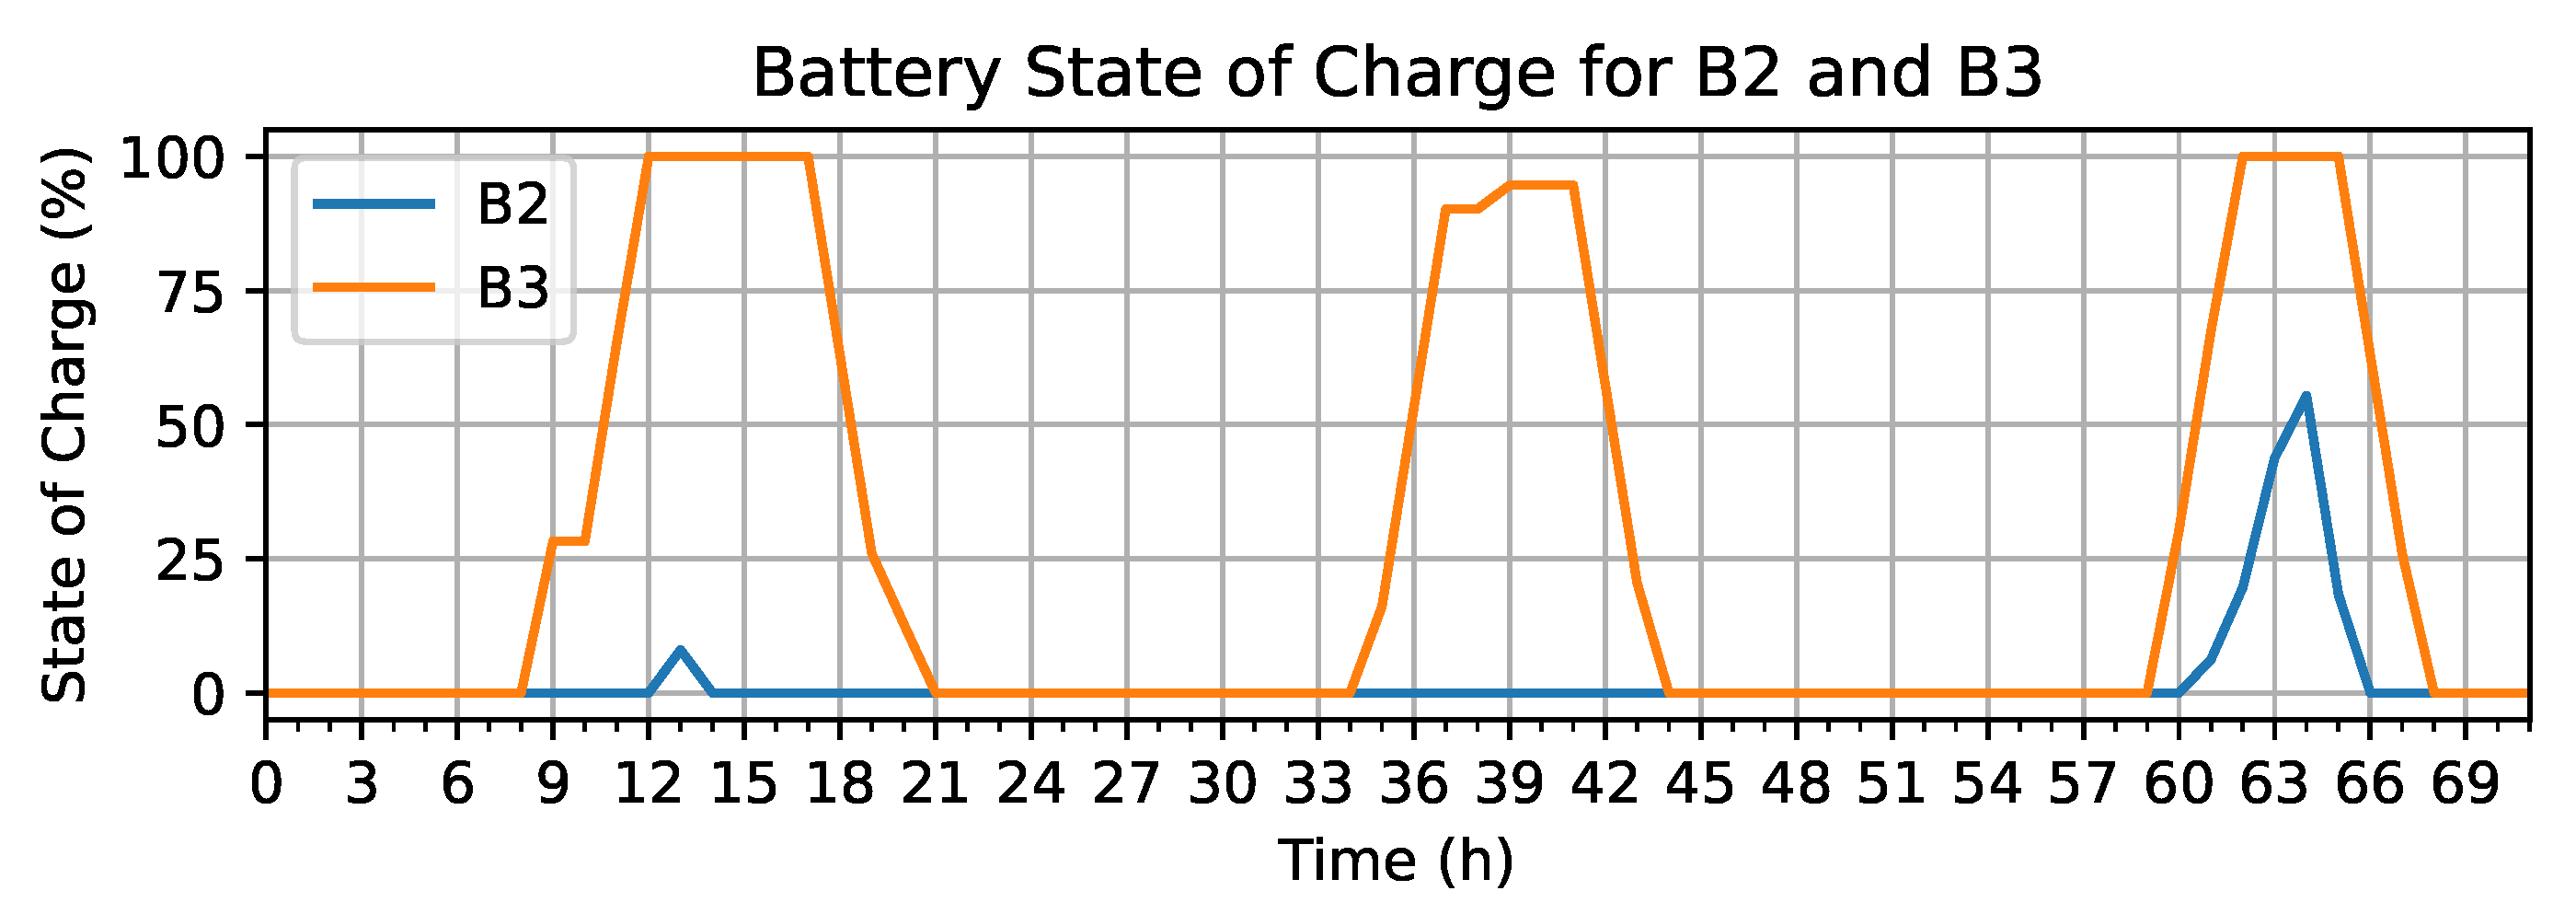
Comparing the state of charge (SoC) of the battery between B2 and B3 (
Figure 5) further shows the improved utilization available through local energy trading. B3 manages to almost always fully charge the battery each day, whereas B2 is unable to utilize the full capacity due to R10’s lack of residual generation.
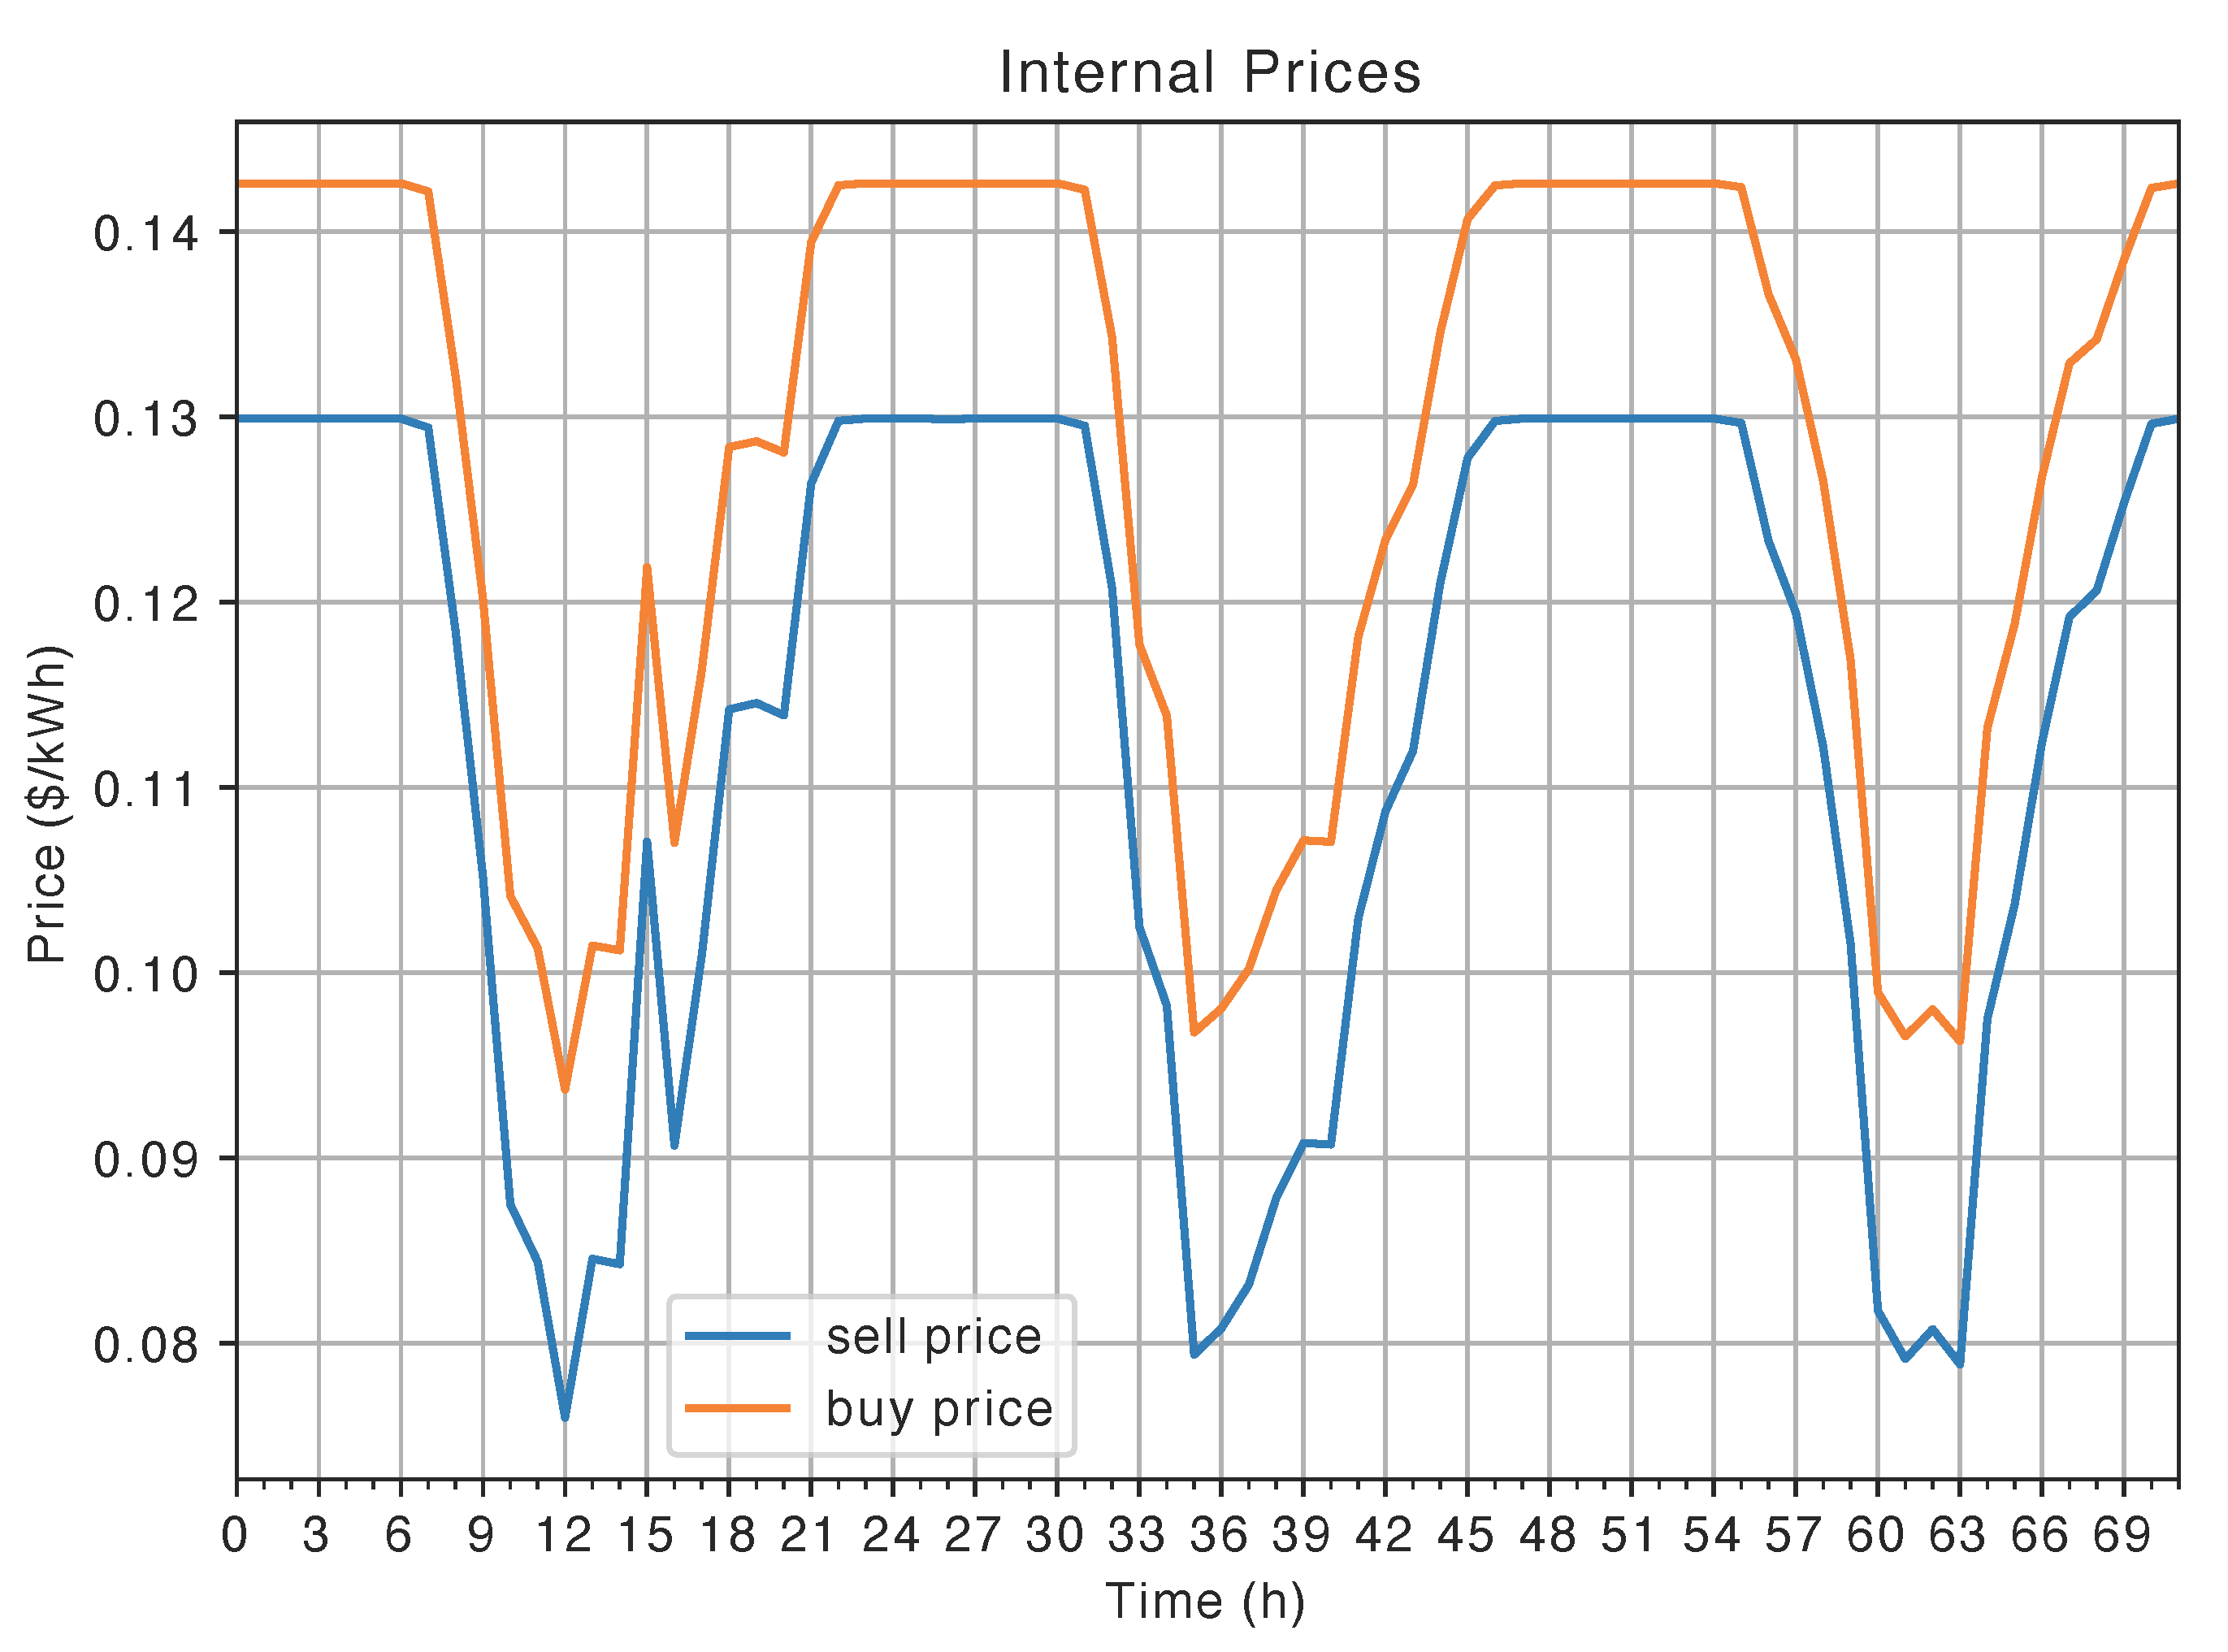
As mentioned above, the rule-based energy trading algorithm is designed to maximize market interactions, and therefore prices do not accurately reflect the observed supply and demand as a learning agent would. At the time of writing, learning agents are still being investigated and developed by colleagues. In lieu of learning agents, Equation (
1) can be applied post-simulation to approximate equilibrium prices at each time step based on total supply and demand. The resulting price curve over the simulation is shown in
Figure 6. The economic performance of all participants under B3 is recalculated by applying this price curve for local energy transactions, then compared to B2. The results of this comparison are summarized in
Table 2.
The results in
Table 2 show that the combination of BESS and the local energy market provides an advantage to the community by socializing the benefits of DERs. When local energy trading is enabled, the amount of energy from the grid is reduced by
, and the amount of energy injected into the grid is reduced by
. As a result of using more locally available energy, the overall cost of the bill decreases by
. In addition to end-customers, the electric utility company may also benefit from this setup. Correcting the under-voltage violation can involve the addition or upgrade of equipment. A battery installed at the affected site may be a less expensive and more effective option under the right conditions.
5. Conclusions and Future Work
The transition to renewable energy leads to the deployment of more distributed energy resources. As the energy mix becomes more complex, automated management and coordination is required to maintain the quality of service expected of the electrical grid. This article continues to explore the economy-based transactive energy approach and focuses on the effects of battery energy storage on both power flow and end-customer bills. A heavily solar-penetrated community, consisting of nine typical residential prosumers (with peak net loads around 1 kW and 5 kW) and one heavily loaded prosumer (R10, with peak loads around 15 kW), who experiences multiple under-voltage violations, is used as the test setting. A 13.5 kWh battery is installed in R10 to test and compare profile-shaping strategies. The first case (B2) uses a common greedy control strategy that maximizes self-sufficiency. The second strategy (B3) uses a local market that allows energy trading between participants and uses a rule-based energy-trading and management agent for control.
In scenario B2, because R10 does not have enough excess generation to be stored, the battery was unable to be fully utilized. The impact on power flow is minimal, and voltage violations still exist. However, because scenario B3 uses the local market as a DER coordination mechanism, R10 is able to access the energy generated by the surrounding participants. The full capacity of the battery can be used, and peak loads are reduced by up to the maximum allowable discharge rate (5kW). As a result, all under-voltage violations are eliminated. Improvements in power flow are observed as a result of efficient market interactions between participants.
The combination of battery storage and the local energy market is also shown to socialize the benefits of DERs. Compared to B2, B3 reduces both the total amount of energy from the grid by and the amount of energy injected into the grid by . From this, every participant receives lower bills. The community as a whole achieves a reduction in bills by . In addition to end-customers, the electric utility company may also see benefits. Correcting the under-voltage violation may involve expensive equipment additions or upgrades. A battery installed at the affected site may be a less expensive and more effective option.
The findings presented in this article lay the crucial foundation for future work. We plan to extend this study by investigating a larger variety of participant compositions, as well as using more sophisticated reinforcement learning agents that can learn equilibrium prices autonomously. The addition of these learning agents makes the overall system stochastic and will require an extensive amount of case studies to be performed. Statistical analysis of the stochastic behaviors of both individual agents and the overall system will be conducted.
Author Contributions
Conceptualization, S.Z. and P.M.; methodology, S.Z. and P.M.; investigation, S.Z.; software, S.Z.; visualization S.Z.; resources, P.M.; writing—original draft preparation, S.Z.; writing—review and editing, P.M.; supervision, P.M.; funding acquisition, P.M. All authors have read and agreed to the published version of the manuscript.
Funding
The authors gratefully acknowledge support provided by the Natural Sciences and Engineering Research Council (NSERC) of Canada and by the Canada First Research Excellence Fund (CFREF) under the Future Energy Systems program at the University of Alberta.
Conflicts of Interest
The authors declare no conflict of interest.
Appendix A. Double Auction Market Design for AI
The market implemented is based on double auctions [
20,
21], which is a well known, widely used design that provides the scalability and efficiency required. The following is an description of the most current market rules for ALEX (see
Appendix B below):
Rates for energy exchanged with the grid is done through net billing. Using retail electricity prices in Alberta as a reference, buying energy from the grid costs $0.1449/kWh, and selling earns $0.069/kWh.
Auctions settle for energy to be delivered during the one-round period from the end of the current round.
During the current round, participants can submit bids and asks for energy to be delivered during or beyond the next delivery period. Non-participation in an auction round means defaulting to the retail electricity prices.
Bids/asks are settled pairwise, with bids sorted from the highest to lowest, and asks in reverse.
Bid/ask quantities can be partially settled.
For each successful settlement, the buyer pays the bid price to the auctioneer, and the seller get paid the ask price by the auctioneer.
During the delivery period, if a seller is in short supply, it must financially compensate for the shortage by buying the difference from the grid at retail prices. If batteries are available, the seller has the option to first compensate by discharging its batteries for all or part of the shortage during this period.
Appendix B. ALEX
Core Concept
ALEX is set up as a behind-the-meter community that operates on two layers. The inside layer comprises participants who can exchange energy over a local market, with energy rates set through the market mechanism. The outside layer acts as an interface between the community and the grid, with energy exchanged at retail rates set by the utility company or electricity retailer in the relevant jurisdiction.
The following assumptions have been made in order to implement ALEX effectively:
Participants are motivated by their own economic well-being and comfort, and will prioritize these factors when making decisions.
Participants are willing to delegate some or all of the decision-making process to RL agents to facilitate interactions with indirect DR measures.
Each unit taking part in the community has access to a smart meter and has gathered enough high-resolution historical data to train the RL agents.
The electricity grid that the community is connected to is an infinite bus, allowing it to both supply and absorb excess energy from the community without causing any issues.
For ALEX to work effectively, it is crucial for the market used to accurately reflect price theory, which states that the price of any good or service is determined by the balance of supply and demand at the time of exchange. To achieve this, it is reasonable to begin with a well-established market design and make necessary adjustments to adapt to ALEX-specific considerations.
Firstly, the market must be suitable for electricity grids with high levels of DERs and RES, and thus capable of effectively targeting localization and the intermittent nature of RES. Secondly, technical constraints and deployment requirements, such as data acquisition, data transportation, data storage, and overall lifetime cost, etc. must be minimized to make the overall solution financially viable and attractive. Finally, AI will play a crucial role in trading and managing energy resources. Therefore, the market should be conducive to machine learning, especially reinforcement learning. This can be achieved by composing the market with a small set of explicit rules that offer enough flexibility to provide large action spaces while ensuring no exceptions, loopholes, or room for different interpretations. Additionally, the market should provide strong feedback signals for learning. By considering these ALEX-specific considerations, a market can be designed that accurately reflects price theory and is conducive to machine learning, making it an effective tool for managing energy resources in the context of DER and RES.
Appendix C. Net Billing vs. Net Metering
The electricity market is a complicated space, and can be baffling for end-customers looking to generate their own energy through rooftop solar. Two terms that are often used in this context are net billing and net metering, and is often a source of confusion when calculating ROI. This section clarifies the distinction between net billing and net metering.
In jurisdictions where the electricity market is “unbundled”, such as Alberta, Canada, electric utilities are only responsible for building and maintaining the infrastructure, while a variety of retailers are allowed to sell electricity to end-users. This means that consumer bills are divided into two main components: infrastructure (mostly comprised of transmission and distribution fees, or T&D fees), and energy.
Under net billing, any electricity that flows into the meter incurs both energy and variable T&D costs, and any electricity that flows out of the meter has energy costs deducted, either as credits or cashback. In contrast, net metering deducts both energy and T&D costs from the total bill. While both approaches have their pros and cons, net metering tends to shift the costs of infrastructure onto those who cannot afford their own generation (a concept known as uneconomic bypass). This is because infrastructure costs are a legislated guaranteed income for the electric utility, and therefore deducting from one customer means spreading the amount deducted from the rest of the customers. This has been criticized as an unfair system, as it places a disproportionate burden on those who cannot afford to generate their own electricity. On the other hand, net billing provides an even distribution of infrastructure costs amongst all customers, making it a fairer approach. However, it also means that the return on investment for solar panel installations can be significantly longer due to fewer bill deductions.
References
- Ismael, S.M.; Abdel Aleem, S.H.; Abdelaziz, A.Y.; Zobaa, A.F. State-of-the-art of hosting capacity in modern power systems with distributed generation. Renew. Energy 2019, 130, 1002–1020. [Google Scholar] [CrossRef]
- Olowu, T.O.; Sundararajan, A.; Moghaddami, M.; Sarwat, A.I. Future challenges and mitigation methods for high photovoltaic penetration: A survey. Energies 2018, 11, 1782. [Google Scholar] [CrossRef] [Green Version]
- Chapelsky, C.; Gerasimov, K.; Musilek, P. DER Impacts to Urban Utilities Study Summary; Technical Report; University of Alberta; EPCOR: Edmonton, AB, Canada, 2019. [Google Scholar]
- Chen, S.; Liu, C.C. From demand response to transactive energy: State of the art. J. Mod. Power Syst. Clean Energy 2017, 5, 10–19. [Google Scholar] [CrossRef] [Green Version]
- Abrishambaf, O.; Lezama, F.; Faria, P.; Vale, Z. Towards transactive energy systems: An analysis on current trends. Energy Strategy Rev. 2019, 26, 100418. [Google Scholar] [CrossRef]
- Forfia, D.; Knight, M.; Melton, R. The View from the Top of the Mountain: Building a Community of Practice with the GridWise Transactive Energy Framework. IEEE Power Energy Mag. 2016, 14, 25–33. [Google Scholar] [CrossRef]
- Zhang, S.; May, D.; Gül, M.; Musilek, P. Reinforcement learning-driven local transactive energy market for distributed energy resources. Energy AI 2022, 8, 100150. [Google Scholar] [CrossRef]
- Meyabadi, A.F.; Deihimi, M.H. A review of demand-side management: Reconsidering theoretical framework. Renew. Sustain. Energy Rev. 2017, 80, 367–379. [Google Scholar] [CrossRef]
- Hu, J.; Yang, G.; Ziras, C.; Kok, K. Aggregator Operation in the Balancing Market Through Network-Constrained Transactive Energy. IEEE Trans. Power Syst. 2019, 34, 4071–4080. [Google Scholar] [CrossRef] [Green Version]
- Nazir, M.S.; Hiskens, I.A. A Dynamical Systems Approach to Modeling and Analysis of Transactive Energy Coordination. IEEE Trans. Power Syst. 2019, 34, 4060–4070. [Google Scholar] [CrossRef] [Green Version]
- Soares, A.; De Somer, O.; Ectors, D.; Aben, F.; Goyvaerts, J.; Broekmans, M.; Spiessens, F.; van Goch, D.; Vanthournout, K. Distributed Optimization Algorithm for Residential Flexibility Activation—Results From a Field Test. IEEE Trans. Power Syst. 2019, 34, 4119–4127. [Google Scholar] [CrossRef]
- Zhou, S.; Hu, Z.; Gu, W.; Jiang, M.; Zhang, X.P. Artificial intelligence based smart energy community management: A reinforcement learning approach. CSEE J. Power Energy Syst. 2019, 5, 1–10. [Google Scholar] [CrossRef]
- Zang, H.; Kim, J. Reinforcement Learning Based Peer-to-Peer Energy Trade Management Using Community Energy Storage in Local Energy Market. Energies 2021, 14, 4131. [Google Scholar] [CrossRef]
- Strunz, K.; Abbasi, E.; Fletcher, R.; Hatziargyriou, N.; Iravani, R.; Joos, G. TF C6.04.02: TB 575—Benchmark Systems for Network Integration of Renewable and Distributed Energy Resources; CIGRE: Paris, France, 2014. [Google Scholar]
- Strunz, K.; Fletcher, R.H.; Campbell, R.; Gao, F. Developing benchmark models for low-voltage distribution feeders. In Proceedings of the 2009 IEEE Power and Energy Society General Meeting, Calgary, AB, Canada, 26–30 July 2009; pp. 1–3. [Google Scholar] [CrossRef]
- Zhang, S. CIGRE North American Low Voltage Residential Circuit OpenDSS Model for T-REX. 2022. Available online: https://github.com/sd-zhang/TREX-Analysis-Tools/tree/powerflow (accessed on 1 February 2023).
- Dong Chen, D.I. SunDance: Black-box Behind-the-Meter Solar Disaggregation. In Proceedings of the e-Energy ’17: Proceedings of the Eighth International Conference on Future Energy Systems, Hong Kong, China, 16–19 May 2017; pp. 45–55. [Google Scholar]
- Barker, S.; Mishra, A.; Irwin, D.; Cecchet, E.; Shenoy, P.; Albrecht, J. Smart*: An Open Data Set and Tools for Enabling Research in Sustainable Homes. In Proceedings of the ACM SustKDD’12, Beijing, China, 12 August 2012. [Google Scholar]
- Zhang, S. TREX-Core-sd-zhang-dev. 2020. Available online: https://github.com/sd-zhang/TREX-Core/tree/dev (accessed on 1 February 2023).
- Friedman, D.; Rust, J. The Double Auction Market: Institutions, Theories, and Evidence; Routledge: London, UK, 1993. [Google Scholar]
- Friedman, D. A simple testable model of double auction markets. J. Econ. Behav. Organ. 1991, 15, 47–70. [Google Scholar] [CrossRef]
| Disclaimer/Publisher’s Note: The statements, opinions and data contained in all publications are solely those of the individual author(s) and contributor(s) and not of MDPI and/or the editor(s). MDPI and/or the editor(s) disclaim responsibility for any injury to people or property resulting from any ideas, methods, instructions or products referred to in the content. |
© 2023 by the authors. Licensee MDPI, Basel, Switzerland. This article is an open access article distributed under the terms and conditions of the Creative Commons Attribution (CC BY) license (https://creativecommons.org/licenses/by/4.0/).


