Article

Life Cycle Assessment and Cost–Benefit Analysis as Combined Economic–Environmental Assessment Tools: Application to an Anaerobic Digestion Plant

by
Morena Bruno
1,
Michela Marchi
1,*,
Nicolò Ermini
2,
Valentina Niccolucci
1 and
Federico Maria Pulselli
1
1
Ecodynamics Group, Department of Physical Sciences, Earth and Environment, University of Siena, Piazzetta Enzo Tiezzi 1, 53100 Siena, Italy
2
Department of Economics and Statistics, University of Siena, Piazza San Francesco 7-8, 53100 Siena, Italy
*
Author to whom correspondence should be addressed.
Energies 2023, 16(9), 3686; https://doi.org/10.3390/en16093686
Submission received: 1 April 2023 / Revised: 18 April 2023 / Accepted: 24 April 2023 / Published: 25 April 2023
(This article belongs to the Section A4: Bio-Energy)

Abstract

:
In the present study, using Life Cycle Assessment (LCA) and Cost–Benefit Analysis (CBA), we assess the economic–environmental performance of an anaerobic digestion (AD) plant, fed by cultured crops (i.e., maize and wheat), in Italy. The biogas generated by the AD plant is used for the production of electricity, imputed into the Italian energy grid. The LCA evaluated potential greenhouse gas (GHG) emissions, measured via Carbon Footprint (CF), while the CBA analysed the financial and economic profiles via the Net Present Value (NPV) and Internal Rate of Return (IRR) indicators. The strength of combining these methodologies is the joint examination of the financial and social–environmental performance of the plant. The results of the CBA are complemented with the GHG emissions avoided by producing electricity from biogas. The CF of 0.28 kg CO2eq·kWh−1 of electricity produced is mainly due to the nitrogen fertilizers involved in the production of the additional feedstock matrix (i.e., maize flour). In the CBA, the negative financial NPV and the financial IRR, which is lower than the discount rate applied, highlight the inability of the net revenue to repay the initial investment. Regarding the social desirability, the economic analysis, enriched by the LCA outcomes, shows a positive economic performance, demonstrating that the combination of information from different methodologies enables wider consideration for the anaerobic digestion plant. In line with the Italian Recovery and Resilience Plan’s aim to strongly increase the exploitation of renewable resources, an AD plant fed by dedicated crops could valorise the marginal uncultivated land, obtaining energy without consuming land for food production. Moreover, this AD plant could contribute to the creation of repeatable small-scale energy production systems able to sustain the demand of local communities.

1. Introduction

The energy sector currently generates around three-quarters of greenhouse gas (GHGs) emissions and holds the key to avoiding the worst effects of climate change, one which requires a radical transformation in the way we produce, transport, and consume energy [1]. Indeed, according to the latest report from the International Energy Agency (IEA), global electricity demand is estimated to grow by 2.4% per year over the rest of this decade to reach more than 30,600 TWh by 2030 [2].
The pandemic crisis had a major impact on energy demand in 2020, reducing global carbon dioxide (CO2) emissions by 5.1% [3]. However, in 2021 the rapid economic recovery led to a resurgence in energy demand, which was also exacerbated by adverse energy market conditions. In this scenario, the use of coal increased at the expense of renewables [3]. As highlighted by [4,5], burning of coal causes enormous amounts of GHG emissions; CO2 are calculated to be 70%, whereas SO2 and dust are calculated to be 90% and 70%, respectively. As a result, GHG amounts increased by more than 2 Gt compared to 2020 levels, making 2021 the year with the largest annual rise in energy-related CO2 emissions on record. The increase in 2021 more than compensated for the decrease in emissions of around 1.9 Gt recorded during the pandemic. In particular, global CO2 from energy production and industrial processes increased by 6% compared to 2020, reaching a value of 36 Gt [3].
Already in 2019, the EU has defined the European Green New Deal to propose a new growth strategy that includes the goals of ecological transition and zero climate impact for 2050, thus confirming the European Commission’s commitment to tackling climate and environmental problems [6].
To overcome the COVID-19 crisis, in July 2020, the European Union (EU) launched the Next Generation EU Programme, an instrument that aims to help countries affected by the health crisis through investments, while confirming the importance of the ecological transition [7].
Other relevant implications can be linked to the Russian invasion of Ukraine in 2022, not only in terms of human lives, but also from a socioeconomic point of view. Russia appears to be the main supplier of natural gas to the EU. By 2021, around 43% of Europe’s natural gas will come from Moscow [8]. The crisis between Russia and Ukraine may reflect the conditions already seen in the post-pandemic economic recovery. For example, the increase in natural gas prices could provide the economic incentive to switch from gas-fired to coal-fired power plants. This would hamper attempts to reduce GHG emissions [9], as the CO2 released from burning coal is 30% higher than oil and 70% higher than natural gas [10].
The fight against climate change requires a strong commitment from all institutions and the necessary involvement of all societal stakeholders to achieve the goal of climate neutrality by 2050. In the Italian context, for example, the Regional Administrations have a central role to play, as they are directly involved in the definition and implementation of energy, transport, and agricultural policies, and also have an important role to play in raising awareness among citizens; indeed, without their full involvement, it will not be possible to achieve the climate objectives and start the process of ecological transition [11].
In this direction, in 2020, Italy has proposed the “Recovery and Resilience Plan” (‘Piano Nazionale di Ripresa e Resilienza’—PNRR), structured along three strategic axes that are shared at the European level: digitisation and innovation, ecological transition, and social inclusion. In particular, Mission 2 (Green Revolution and Ecological Transition) is organized in four Components of which the second one (C2—Renewable energy, hydrogen and sustainable mobility) provides for measures by which to increase the share of energy produced from renewable sources, in line with European and national decarbonisation targets [7].
Within the Plan, the importance given to renewable energy sources (RES) is evident. RES, such as solar, wind, hydro, and biomass energy, have the advantage of being regenerated at the end of the cycle and their GHG emissions are minimal or zero [12]. For these reasons, the Italian Plan aims to accelerate the transition from traditional fuels to RES and to reduce dependence on energy imports by increasing the use of RES, which, to date, cover the 19% of Italy’s energy demand [13]. Tuscany, for example, has defined the Toscana Carbon Neutral strategy, which integrates circular economy processes to promote a more rational and sustainable use of its own resources [14]. The total net production of electricity in Tuscany is 16,783 GWh/year, of which 8288 GWh/year comes from RES, which represents 49% of the total. The largest contribution comes from geothermal energy with 5867 GWh/year, followed by photovoltaic panels with 859 GWh/year, which, together, cover about 81% of the total energy production from RES. Biomass energy contributes only 6% to the production of electricity from renewable sources [15].
Among RES, biomass energy could contribute to achieving a circular economy model and a more sustainable use of energy. According to [16], the biomass energy is produced from living or formerly living organisms. The most common biomass materials used for energy are agricultural crops, such as corn and soybeans. Other types of biomasses include forest residues, livestock manure, and municipal solid waste. The energy from these substrates can be burned to produce heat or converted into electricity. In contrast to the traditional energy sources (e.g., coal, oil products, natural gas), the amount of CO2 emissions associated to the energy production—such as electricity generation—by burning biomass is equal to zero (Table 1). The release and capture of carbon by direct burning, in fact, are supposed to occur in a closed natural cycle of biomass growth, as stated by [17].
There are several ways of using biomass to produce electricity: direct combustion, conversion into liquid fuels, or through anaerobic digestion (AD).
In particular, AD is a biological process that converts organic substrates into biogas, a mixture composed mainly of CO2 and methane (CH4). The process takes place inside structures called digesters, which are designed to ensure the best anaerobic conditions that guarantee the degradation and stabilization of organic materials thanks to the activity of microorganisms [18]. The biomass treated in AD plants releases into the atmosphere the same amount of carbon that was previously absorbed by plants and derived by-products, unlike burning fossil fuels, which emits carbon that has been locked up in the subsoil for millions of years [19]. In other words, the use of fossil fuels increases the total amount of carbon derived from the anthropogenic processes, whereas the bioenergy operates within the biogenic carbon cycle [19]. According to the Fifth Intergovernmental Panel on Climate Change (IPCC) Assessment Report [20], the amount of atmospheric CO2 sequestered in crops’ biomass during their growth corresponds to direct emissions from the use of feedstock of biogenic origin. However, during the AD process, anthropogenic CH4 is also generated but it could be emitted into the atmosphere only due to accidental losses related to a reduction in watertightness of digesters. The by-product of AD, which is rich in nutrients and organic matter, is known as digestate, and can be used on agricultural land to replace mineral fertilizers and prevent the depletion of resources such as phosphorous and potassium [21].
The circulation of products and materials, as in the case of digestate, is a clear example of the application of circular economy principles because anaerobic digestion allows valuable nutrients such as nitrogen, phosphorous, potassium, and micronutrients to be used for the regeneration of soil [22]. In this regard, [23] investigated the utilization of agricultural biomass for energy production in anaerobic digestion plants in Switzerland, analysing mass, nutrients, and energy flows to evaluate its contribution to the circular economy and climate change mitigation. Moreover, [24] highlighted the dual role of biomass as an energy source and a solution for climate change mitigation, assessing the GHGs reduction potential and the economic impact of electricity from food crop residues subjected to anaerobic digestion in Ghana.
A total of 179 AD plants are scattered throughout the Italian national territory and a total capacity of 183 MW is installed; the Tuscany Region hosts 47 biogas plants with a capacity of 61 MW [15]. Grosseto is confirmed as the first province for the electricity production from AD, obtaining 50 GWh. In fact, in the municipality of Grosseto, eight digesters are located, which contribute to 61% of the local electricity production, covering about 35% of the electricity demand of the municipality [25].
Despite its renewable nature, the sustainability of an AD process needs to be adequately assessed and quantified, incorporating into the analysis environmental and economic performance indicators. In this regard, several publications have been dedicated to analysing the environmental and economic performance of AD systems in various locations, applying different methodological approaches. For example, the joint use of Life Cycle Assessment (LCA) and Cost–Benefit Analysis (CBA) has been widely applied in the literature. Ruiz et al. [26] investigated the environmental and economic performance of a commercial AD plant located in Spain and fed by biowaste, using LCA, Life Cycle Costing, and CBA methodologies. Ascher et al. [27] evaluated the economic feasibility and environmental impacts of bioenergy systems to treat solid waste in Glasgow, based on AD and gasification technologies, applying CBA and LCA. Angouria-Tsorochidou et al. [28] assessed the environmental and economic performance of a decentralized biowaste management system, based on AD technology, in Lyon, using the frameworks of LCA and Net Present Value analysis. Finally, Bruno et al. [29] applied LCA and Environmental CBA to assess the environmental performances and economic feasibility of a new eco-industrial system in Italy, which incorporates a micro-scale AD and a solid-state Fermentation unit for the valorisation on food waste.
As highlighted by [26], the combination of environmental and economic evaluation tools enables decision makers to consider both criteria in a coherent manner. For this reason, the aim of this study was to carry out an economic–environmental assessment of an AD plant located in the province of Grosseto, combing the LCA and CBA methodologies. The former quantifies the environmental performance of the plant in terms of potential impact, while the latter assesses its economic and financial viability by considering of the socioenvironmental benefits that the project generates for the community.
Unlike most studies already conducted about the integration between environmental and economic methodologies, the present investigation assessed an AD plant exclusively fed with dedicated cultivated crops with the purpose of producing electricity from RES. In line with the Italian “Recovery and Resilience Plan” objective to increase the share of RES, this study aims to demonstrate the feasibility of accelerating the development of energy communities and decentralized production systems through the valorisation of marginal uncultivated land for energy purposes, in Italy. By planting energy crops in areas where farming is currently unprofitable and where it would not compete with food production, it could pave the way for new opportunities in the Italian energy sector. This management strategy can be realized from the operational viewpoint by exploiting the measure M2C2-47 and the investment 1.2 (specific for the promotion of RES for energy communities and jointly acting renewables self-consumers), accepted by the European Commission under the Italian “Recovery and Resilience Plan” [30]. Thanks to the complementarity of the two methodologies applied (LCA and CBA), described in more detail in the Materials and Methods section, this investigation wants to prove how their combined use can provide a better understanding of the environmental and economic–financial sustainability of the analysed case study. The results in terms of Carbon Footprint and economic performance indicators achieved are presented and argued in the Discussion section. Finally, the Conclusion section presents the main outputs obtained from the current study, with insights into possible future developments and limitations of the research.

2. Materials and Methods

2.1. Case Study

The case study aims to assess the environmental and economic performance of an AD plant built in 2012 with an installed capacity of 999 kW and composed by two distinct production lines. For each methodology, the foreground data were collected directly on site, provided by plant operators, and related to the year 2021. Subsequently, it was possible to derive the missing data (background data as energy and materials that are delivered to the analysed system as aggregated data sets) [31] through the use of international databases.
AD is a biological treatment process in which a microbial consortium breaks down and stabilises organic material under anaerobic and temperature-controlled conditions. Three main stages characterise the AD process: (1) hydrolysis; (2) acidogenesis and acetogenesis; (3) methanization. In this study, the biomass used in the AD process consists of dedicated crops (i.e., maize, grasses, wheat) and by-products such as maize flour and bran. After a preliminary storage in plant open trenches, the organic matter is pre-treated: water and liquid digestate (about 5%) are added to the solid substrate to prepare the mixture that will activate the bacterial metabolism inside the digesters of the two production lines. In detail, the hydrolysis stage involves the breakdown of polymers into monomers and the conversion of cellulose into glucose and cellobiose. Acidogenesis and acetogenesis involve the breakdown of amino acids, sugars, and some volatile fatty acids. Methanogenesis, on the other hand, leads to the formation of CH4 from acetic acid or through the reduction of CO2 using H2 as a co-substrate. In our case study, the conversion of the organic feedstock matrix into CH4, takes place in each single digester (two production lines). Unlike composting, AD takes place in a closed environment and fugitive emissions of CH4 are 1% [32]. The biogas produced is then collected and used as a fuel for combined heat and power generation.

2.2. Life Cycle Assessment (LCA)

The LCA was used to assess the potential environmental impacts along the life cycle of the system analysed. It was carried out according to the international standards ISO (International Organization for Standardization) 14040 and 14044 [33] to calculate the Carbon Footprint (CF) of the AD plant. SimaPro 9.1.1 software [34] was used to model the inventory and conduct the Life Cycle Impact Assessment. Data for the foreground system were obtained from the plant operators or collected from the scientific literature and technical reports. The background data were obtained from the Ecoinvent database version 3.6 [35]. To quantify the potential GHGs emissions associated with 1 kWh of electricity produced (functional unit), the IPCC 2013 characterization method, and the Global Warming Potential (GPW), with a time horizon of 100 year (GWP100y), were used. The system boundary (from cradle to gate), as shown in Figure 1, includes the inputs and outputs of the agricultural phase, organic feedstock matrix storage and pre-treatment, AD process, and the energy generation from biogas. The separation of the digestate into its liquid and solid fractions and its application on the field was not assessed in our analysis, being outside the scope of the study.
The assessment was based on an AD plant with 350 ha of cropland, 300 ha of which were planted with maize and 50 ha with wheat, needed to obtain the portion of the self-produced organic matrix. The maize crop required, annually, 360,000 tonnes of water, 3.6 tonnes of insecticides, and 1 tonne of Adengo Xtra herbicide. To overcome the lack of background data in SimaPro datasets to model this agrichemical product, the Glyphosate was used as a “proxy” as it can be assumed to be similar. For wheat production, the irrigation is not required because the life cycle of the crop coincides with the rainy season, as confirmed by the plant operator. In addition, both crops are fertilized with urea (i.e., 120 tonnes for maize and 10 tonnes for wheat). Most of the agricultural substrate comes from mixed chopped maize (73%, 13,200 tonnes) and wheat (19%, 3400 tonnes), while the rest of the feeding is composed of by-products such as flour and bran (8%, 1400 tonnes), purchased within a distance radius of 50 km. As the exact composition of the chopped crop is unknown, it was assumed that it was entirely derived from maize, as it is one of the most widely used energy crops [36]. The same applies to the exact composition of the additional feedstock matrix, for which we assumed that only maize flour was used. Moreover, this assumption allows us to limit the inputs related to the flour production process based on global estimates.
Then, during the storage and pre-treatment phase, the total biomass (18,000 t) is received at the plant and stored in open trenches covered with polyethylene (PE) film to protect the biomass from atmospheric degradation. The shredding phase of the substrate precedes the pre-treatment stage inside the mixer. At this stage, the addition of water and liquid digestate to the substrate is necessary to activate the AD process. As seen previously, to address the lack of a representative process for digestate production in SimaPro databases, compost was assumed as a good “proxy” [37]. In the AD phase, the production of biogas was foreseen, which is combusted to produce heat and electricity through the co-generator system (CHP—combined heat and power). Part of the heat produced (37 kWh) is used to heat the digesters. The electricity consumed by the plant is 765,510 kWh. The LCA also considered the substitution of materials and components, such as lubricating oil, engine heads (aluminium), pistons (iron), and candles (iron and ceramic), which are grouped in a single phase called maintenance. Finally, the raw digestate is separated into its liquid and solid fractions.

2.3. Cost–Benefit Analisys (CBA)

The Cost–Benefit Analysis (CBA) compares the costs and benefits associated with a project or policy. The advantage lies in the ability to account for costs and benefits that would normally remain outside the decision maker’s choice options, such as positive and negative externalities, as they are not captured by the market and are not considered in normal accounting [38]. The strength of the methodology lies in the use of price [39] to assess the economic performance and then define the net social welfare associated with the policy or project.
The financial and economic analyses were carried out according to the European Commission’s guidelines [40,41]. In our case, the Net Present Value (NPV) and the Internal Rate of Return (IRR) indices were calculated.
The NPV can be defined as the discounted value given by the sum of the future net cash flows expected from the project [42], and is calculated as follows (1):
N P V = t = 0 n S t · a t = S 0 ( 1 + i ) 0 + S 1 ( 1 + i ) 1 + S n ( 1 + i ) n
where St is the cash flow balance at time t, at is the financial discount factor chosen for the discounting at time t, and i is the financial discount rate [41]. The decision rule is to accept an investment project if the NPV is positive, i.e., if the project has the capacity to generate cash flows of a magnitude that will repay the investment.
The IRR is defined as the discount rate at which the present value of all future cash flows equals the initial investment, i.e., the rate at which an investment break even [43]. It is considered one of the key indicators for the evaluation of public and private investments, as it allows to express the profitability margin of the project. The IRR is calculated as the rate of return (r*) for which the NPV is zero [43], as shown in the following Equation (2):
N P V ( r * ) = t = 0 n S t · S n ( 1 + r * ) n
The IRR has to be compared with a basic rate of return, such as the interest rate on bank deposits or a security, to check whether the investment is appropriate or not. If the IRR is lower than the chosen threshold rate, the project is rejected, while, if the IRR is higher, the project is accepted. The threshold rate chosen in the study is the discount rate applied, as reported in the CBA Guide to Investment Projects [41]. Unlike the NPV, the IRR is a dimensionless indicator; that is, it is not affected by the size of the investment [41,44]. This is an important aspect for a performance indicator, as the dimensionality of the index could lead to larger projects being accepted over smaller investments.
In this study, the financial analysis is structured in such a way that the costs and revenues related to the plant are presented in a table and scaled according to the plant’ lifetime of 20-year (from the year of construction, i.e., 2012) [45]. Table S1 (in Supplementary Material) shows the records of the financial analysis. The prices used are constant prices referring to a base year—which, in this case, is 2022—for which values were available.
The financial analysis is aimed at satisfying the interest of the private operator, which is why the assessment of the financial profitability of the project must also include the outgoing flows and taxes such as Value Added Tax (VAT), the Single Municipal Tax (i.e., IMU—Imposta Municipale Unica), and the right to the surface, which represent a cost for the operator (Tuscany Region, 2009) [46]. The main source of revenue is the sale of electricity; the plant produces 7,855,740 kWh of electricity per year, in net consumption, and generates a revenue of 2,199,607 EUR (Table S1).
The selling price of the electricity is the result of an incentive mechanism; in Italy, the production of electricity from renewable sources is subject to incentives. The scheme chosen by the companies is the feed-in tariff of 0.28 EUR·kWh−1, which is paid for the period corresponding to the conventional average useful life of the plants [47].
The CBA normally includes the residual value of the investment, which represents the expected revenue by the sale of the plant at the end of its life (potential liquidation value); however, as reported by [48], this is not valid for biogas plants since they are decommissioned after 20 years. As for the cost data, they were provided after taxes and were divided into costs incurred for the initial investment (fixed costs) and operating; and maintenance costs related to the operation of the plant (operating costs).
Table 2 shows the fixed costs for the plant: civil works include the costs for earthworks, land consolidation, and the start-up of the yard; electromechanical works include the costs of the machines, switchboards, and piping systems; while ancillary works include the costs of the electrical cabin, the weigher, and the control room. The item “engine” includes the costs of the purchase of the durable assets, namely, the engine, the alternator, the transformer, and the cost of their installation. Finally, the cost of purchasing the land was considered.
The operating costs are considered from the year 2013 (Table S1), as they represent the expenditure necessary for the start-up operation of the plant. With regards to the VAT paid on raw materials, seeds, fertilizers, additives, and pesticides, the rate was set at 10%, as these are agricultural operations (Table S1). For other items, such as costs of transport services and spreading the digestate, costs of paying freelancers workers, and ordinary and extraordinary maintenance, the ordinary VAT rate of 22% was applied (Table S1), as they do not fall within the categories of preferential rates provided for by Presidential Decree No. 633 of 26 October 1972 (D.P.R. 633, 1972 [49]). In particular, the cost of spreading digestate was included in the CBA because it is a cost incurred by the company each year and is independent of the system boundaries chosen for the LCA. For more details, see Section S1 in Supplementary Material.
Net cash flow was calculated as the difference between total revenues and total costs. The synthetic financial performance indices, defined as Financial Net Present Value (FNPV) and the Financial Internal Rate of Return (FIRR), reflect the profitability of the plant of the assets. The financial discount rate chosen is 4%, in accordance with Art. 19 (Discounting of cash flows) of the EC Delegated Regulation (EU) No. 480/2014 [41].
In order to assess social welfare, the CBA requires an economic analysis that evaluates the project not only from the private point of view (e.g., plant owners), but also from the point of view of the wider society (e.g., citizens and communities). The economic analysis is conducted using a new set of prices, since most of the financial costs and benefits are distorted by market imperfections and do not reflect the true value of goods and services [40]. The new set of prices (shadow prices) can express collective welfare by making corrections for taxation, externalities, and market prices [50].
The process of correcting for externalities is carried out by multiplying the incoming or outgoing flows of the financial analysis by specific conversion factors that allow for the correction of distortions [41]. Once prices and taxes have been corrected, the Economic Net Present Value (ENPV) and the Economic Internal Rate of Return (EIRR) performance indicators are recalculated. These indicators help identify the social desirability of the project when it promotes an effective net welfare for the community. Table S2 (in Supplementary Material) shows the records of the financial analysis.
Tax adjustments are made by directly eliminating taxes from cash flows, in accordance with [41]. This is achieved by looking at items’ net of VAT, assuming that there are no additional fiscal factors of distortion. However, where it is not possible to determine the exact extent of the distortion, correction factors derived from the literature and reported in Table S2 are applied. For more details regarding tax corrections and specific correction factors used, see Section S2 in Supplementary Material.
In some cases, as an exception to the general rule, subsidies (or taxes) may be retained because they do not represent a real transfer of resources (fiscal factors), but a way in which the government corrects environmental externalities [41]. In these cases, it is therefore correct to include them in the costs or benefits of the project, provided that double counting is avoided. In this connection, the standard correction factor has been applied to the selling price of the electricity, as the amount of the subsidy is not known and to avoid a possible double counting, both the feed-in tariff and the CO2 avoided by the electricity production from biogas have been considered.
In this case study, the CO2 emissions avoided by producing electricity from biogas rather than from fossil fuels have been considered; the externality, as defined, is shown in the economic analysis under the heading “economic benefits” in order to distinguish it from sales revenues and is called GHGsaving (Table S2). Natural gas is taken as the fossil reference source because among the primary energy sources; it is the one with the greatest weight in the Italian electricity mix; in fact, it represents about 40% of the total production [51]. To calculate the savings in terms of reduction of GHG, the externalities are considered by comparing the amount of CO2eq emitted annually by the analysed AD plant, as defined by the CF, with the CO2eq that would be released if the electricity were produced by a thermoelectric plant fired by natural gas. SimaPro was therefore used to calculate the CF of a gas-fired power plant located in Italy, which is 0.78 kg CO2eq·kWh−1. The result obtained was assigned the unit cost of GHG emissions, which is 25 EUR·t CO2eq−1, so that GHGsaving can have a monetary value. An annual premium of 1 EUR was also considered to evaluate the increase in the cost of GHG emissions over time [41].

Sensitivity Analysis

Uncertainty is an implicit factor in CBA, as it is based on estimates and forecasts made by the analyst; therefore, the methodology requires the development of risk analysis, represented by sensitivity analysis. The latter is identified as the process that allows the verification of performance indicators by changing some variables considered critical for the analysis. The identification of the critical parameters depends on the project, but the literature suggests considering those variables for which a 1% variation leads to a 1% variation in the IRR or a 5% variation in the NPV [40].
The variables considered in the study are the selling price of electricity, the operating costs, and the price of CO2. The production of electricity from biogas seems to benefit from a system of incentives, for this reason the selling price of energy is considered as critical, as we want to investigate how the competitiveness of the AD in the market changes with the variation of 1% of the feed-in tariff. In order to take into account the economic benefits, the GHG saving results has been multiplied by the unit cost of GHG emissions, which is 25 EUR·t CO2eq−1, but this is the “average” cost assigned to GHG emissions, even though the [41] sets both a “low” cost (10 EUR·t CO2eq−1) and a “high” cost (40 EUR·t CO2eq−1) in its annual supplement. For this reason, these values are also considered in the sensitivity analysis to verify how the economic performance can vary because of an increase or decrease in these values. Finally, we consider the variation of 1% of the operating costs since they correspond to one of the critical parameters always evaluated in the risk analysis [41].

3. Results

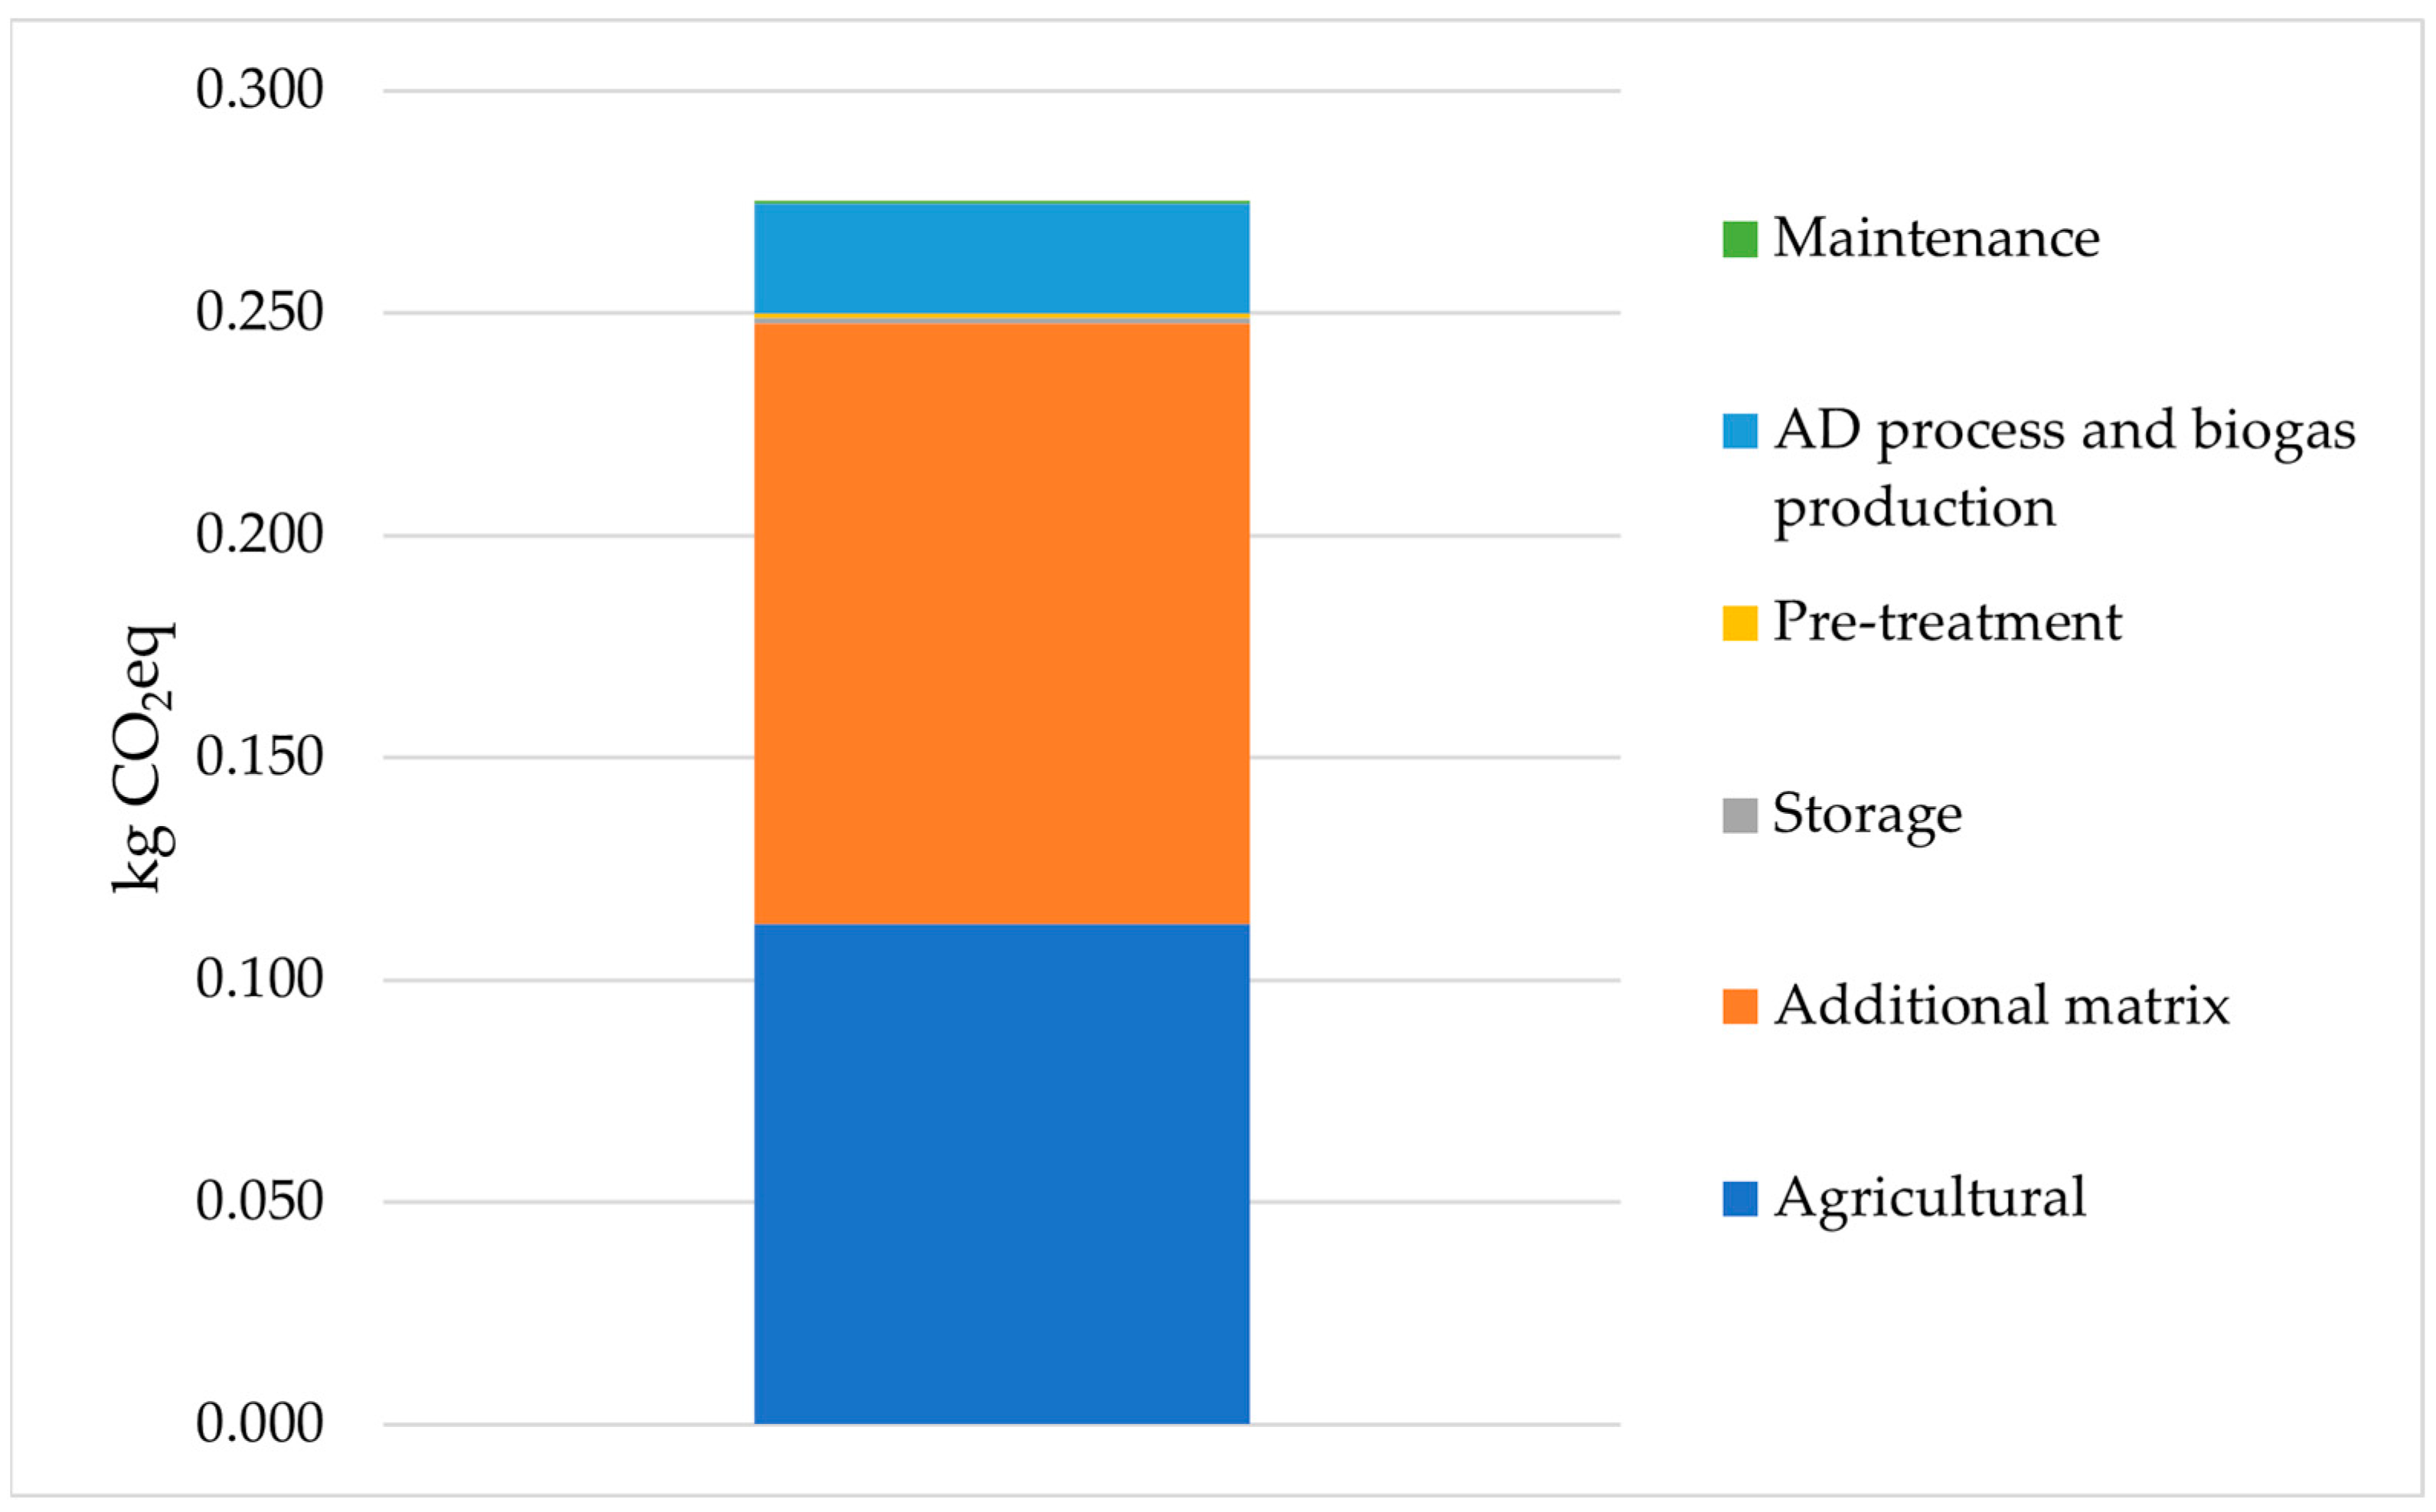
3.1. Environmental Performance

Table 3 shows the results of the CF associated with each system inventory flow analysed. Each process extracted from the Ecoinvent dataset is associated with the GWP100y value for each input unit.
Figure 2 shows the CF results for different stages of the plant lifecycle. The overall CF of the plant is 0.28 kg CO2eq·kWh−1 of electricity produced from biogas. The agricultural phase is responsible for 40.9% (0.11 kg CO2eq·kWh−1) of the total emissions. In this first phase, the impact is mainly due to the use of urea for fertilization, which contributes to the 18.5% of the emissions of the agricultural phase. The remaining percentage of emissions is due to the purchase of maize seed (9.7%), water taken from the grid for maize irrigation (5.2%), and diesel consumption tractors and other agricultural machineries (3.6%).
The purchase of the additional feedstock matrix turns out to be the phase with the greatest impact on the entire AD process, being responsible for 49.2% of the total emissions (0.14 kg CO2eq·kWh−1). The impact is due to the use of maize flour as an additional energy substrate for feeding the digester. In particular, the impact is related to the cultivation of the maize (23.5%) required to produce the flour, which involves the use of nitrogen fertilizers, responsible for 7% of the GHGs emissions in this process.
GHG emissions related to the substrate storage and pre-treatment are negligible, as their contribution is around 1% of the total (0.001 kg CO2eq·kWh−1 each one). However, the most significant inputs at this phase are the diesel (0.56%) and electricity (0.52%) used to operate the mixer; and the polyethylene film (0.46%) used to protect the biomass from atmospheric degradation.
The AD phase and biogas production are responsible for 9% (0.03 kg CO2eq·kWh−1) of the total emissions. The main contribution comes from the 765,510 kWh of electricity produced and consumed (8.6%).
Finally, the impact of the maintenance phase is negligible (less than 1%); the main hotspot is due the consumption of lubricating oil (0.2%).

3.2. Economic Performance

3.2.1. Financial and Economic Analysis

The AD plant has a FNPV of −838,639 EUR, which shows the inability of the net revenue generated by the sale of electricity to repay the initial investment, regardless of the sources of financing. The FIRR, which represents the profitability of the plant, is 1.89% (i.e., lower than the discount rate applied, which is 4% [41]), which therefore expresses the financial undesirability of the project, despite the positive but very low FIRR value.
The economic performance Indicators (ENPV and EIRR) for the plant show a different scenario from the financial analysis. By correcting for market distortions and considering the GHGsaving, the evaluation of the plant has become socially desirable. It gives an ENPV of 3,876,989 EUR and an EIRR of 11.58%, which is higher than the social discount rate (equal to the 3%).

3.2.2. Sensitivity Analysis

A 1% reduction in the electricity feed-in tariff (from 0.28 EUR·kWh−1 to 0.27 EUR·kWh−1) has determined a critical variation for both the FNPV (from −838,639 EUR to −1.116.423 EUR) and the FIRR (from 1.89% to 1.14%) (Table 4), showing how the profitability of the plant depends on the variation in the tariff and how the competitiveness of the AD is strongly linked to the incentive. We also show a critical assessment of the operating costs variable, for which a 1% increase leads to a variation from −838,639 EUR to −1,028,974 EUR for the FNPV and from 1.89% to 1.39% for the FIRR (Table 4).
Table 5 shows the change in the synthetic indices characterizing the economic analysis of the plant. Both the feed-in tariff and the operating costs are critical factors. Even after correcting for market distortions and accounting for GHGsaving, the influence of the variables on the performance indicators cannot be eliminated. However, there has been a marked improvement compared to the situation in the financial analysis. The criticality of the feed-in tariff is restored, as the variation of the NPV goes from 33% in the financial analysis to −7% in the economic analysis. For the operating costs, the assessment of criticality remains, and in this case, there is a clear improvement: the variation of the NPV goes from 23% in the financial analysis to −5% in the economic one (Table 5).

4. Discussion

The LCA result shows that the agricultural phase and the purchase of the additional feedstock matrix contribute most to the CF of the system. In particular, the highest impact is given by the use of chemical nitrogen fertilisers associated with the cultivation of maize for flour production, which is used as an additional organic matrix to feed the digesters. These results are in line with [52], which evaluated the life cycle environmental impacts associated with the generation of electricity from five real AD plants in Italy fed by agricultural crops and wastes. Their results suggest that maize silage, used as a feedstock, is one of the main contributors to the impacts of electricity production from biogas.
Although the study investigated only one plant, our results show that at least from the perspective of the climate change category, the most relevant potential impacts are related to some secondary inputs of the production process. The absence of direct emissions for certain uses of fossil energy, as there might be in other energy production systems, underlines the overall low impact of this technology. The CF of kWh produced by AD plants (280 g CO2eq·kWh−1) is much lower than that of the same unit of energy produced by other sources, both fossil and some renewable. As reported by [53], the CF per kWh of electricity produced by natural gas is equal to 443 g CO2eq; for petroleum products, it is 778 g CO2eq; and for solid fossil fuels, mainly coal, it is 1050 g CO2eq. The same is true for some alternative energy carriers and sources such as hydrogen (664 g CO2eq·kWh−1 [53] and geothermal (380 g CO2eq·kWh−1 [54]). At the same time, the AD values are higher than those of electricity produced by other technologies such as solar photovoltaic panels (32 g CO2eq·kWh−1), hydroelectric (12 g CO2eq·kWh−1), onshore wind (10 g CO2eq·kWh−1) [53], offshore bottom fixed wind (32 g CO2eq·kWh−1), and offshore floating wind (49 g CO2eq·kWh−1) [55]. This is due to a higher technology readiness level, which implies better and more advantageous performances of these more widespread energy generation systems [56].
In terms of the CBA, the plant is undesirable from a purely financial point of view. The judgement at the end of the analysis led to the rejection of the biogas plant, with an FNPV of −838,639 EUR and a FIRR of 1.89%, lower than the discount rate applied [41]. The result obtained is in line with [57], which carries out an economic–financial evaluation through the application of NPV and IRR of different types of biogas plants, located in Italy and fed with different substrates (i.e., maize, manure, sorghum). Using a discount rate of 5%, approximately equal to the one adopted in our study, and considering the same plant’s lifetime (20 years), the study confirmed that plants fed with maize alone have a negative financial performance. The revenues are unable to repay the investments with a negative FNPV and a FIRR lower than the discount rate. The systems which use energy crops such as maize as substrates are not economically feasible with the current feed-in tariff. For this reason, future capacity expansion will have to rely on the use of feedlot manures and other agricultural residues in order to be profitable [57].
In our analysis, a relevant role is played by the initial investment cost (4,060,000 EUR), which weighs more for the discount rate than the future revenue. This is because the high operating costs (1,698,980 EUR) absorb most of the sales revenue (2,199,607 EUR), which does not guarantee that the revenue will generate sufficient flows to repay the total investment. The result obtained here does not necessarily indicate that the plant is not desirable from the point of view of the community; in fact, the FIRR lower than the discount rate may indicate that the project needs support from public or EU structures [41], as the plant generates positive net cash flows during the operating years (Table 2). However, as the objective of the study is to verify the social desirability of the AD plant, it is not desirable if only the financial aspect is considered.
It should also be noticed that biogas benefits from a system of incentives determined by the feed-in tariff; therefore, even if subsidised, the operational management does not seem to guarantee an adequate financial return to repay the initial investment. The result obtained does not show that biogas is not competitive on the market, but the result could, for example, depend on inefficient cash flow management.
On the other hand, by correcting for market distortions and considering the GHGsaving, the valuation of the plant becomes socially desirable. This gives an ENPV of 3,876,989 EUR and an EIRR of 11.58%, which is higher than the social discount rate. The improvement between FNPV and ENPV in our analysis should be seen as the additional information provided by the economic analysis, which can improve the outcome of the evaluation. In fact, the inclusion of socioenvironmental aspects may lead to a different judgement, which could result in the ultimate approval of the project by virtue of a wider view of aspects other than the mere financial ones, which can be found to be beneficial for the well-being of the community. The strength of CBA lies in its ability to integrate socioenvironmental aspects that are not considered by conventional assessment tools.
Although it is difficult to find comparative studies in the literature to support the results of the economic analysis, [58] applied CBA to compare the performance of an AD plant and a composting plant in the treatment of the organic fraction of municipal solid waste. The results show that the composting system is the most cost-effective alternative in terms of financial and environmental viability, but it also highlights that AD brings significant benefits to the community in terms of electricity generation, fertiliser production, and the ability to reduce the environmental impact perceived by the local inhabitants because of energy production with low emissions.
The dependence of the plants on the feed-in tariff is certainly one of the most important aspects of our analysis; indeed, the sale of electricity to the public utility is the main source of income. The importance of the feed-in tariff highlighted by the sensitivity analysis leads to the consideration of other sources of income, such as the production of biofertilizers from digestate [59]. The production of biofertilizers would therefore not only contribute to reducing the environmental impact on local ecosystems by replacing chemical fertilizers; it would also lead to the development of a market for biofertilizers, which are currently experiencing a significant expansion as a substitute for chemical fertilizers and as an “environmentally friendly” strategy [60]. However, the decision of the plant operators must be supported by an ex ante analysis of the quality of the fertilizer that would be obtained from the digestate, as the nutrient content depends on the type of feeding of the digester [61]. An analysis of market demand is also necessary to understand its dynamics and characteristics. For example, the expansion of the biofertilizers market in Italy is estimated at 4.9% in a forecast from 2022 to 2030 [62]. However, our study does not consider the impact of the war in Ukraine on the price of chemical fertilizers, as methane gas is expected to be used in the synthesis process [63,64,65]. As a result, the “opportunity cost” of organic fertilisers could be higher and market growth could be significant.
Moreover, with regards to the results of the sensitivity analysis for the financial perspective (Table 4), the dependence of biogas on incentive schemes is reflected in the literature. According to [57,66], the profit margin for biogas depends on the incentive granted by the state to produce electricity from renewable sources. Salerno et al. [67] show how the profitability of biogas plants decreases as the incentive granted decreases. The analysis is carried out for small-scale plants (installed capacity less than 300 kW) fed with a mixture of animal manure and maize (less than 30%). The discount rate applied is 6% over a time horizon of 15 years for the 0.28 EUR·kWh−1 scenario and 20 years for the 0.18 EUR·kWh−1 scenario. The FIRR obtained in the study ranges from 26% (incentive 0.28 EUR·kWh−1) to 2.6% (incentive 0.18 EUR·kWh−1).
Table 4 also shows the critical assessment of operating costs because, as explained in the financial analysis, the costs of the plant provide a margin of low profitability by eroding a large part of the sales revenue. Consequently, even a small variation in operating costs can have a significant impact on the change in the synthetic indices.
Regarding the variation in the economic performance indices (Table 5), the change in the unit cost of CO2 is followed by a change in the performance indicators, so we can say that the change in the assumed value determines a change in social welfare: improvement when the price goes from 25 EUR·t CO2eq−1 to 40 EUR·t CO2eq−1 and deterioration when it goes from 25 EUR·t CO2eq−1 to 10 EUR·t CO2eq−1. This confirms that accounting for GHGsaving is a relevant factor in the outcome of the assessment.
Finally, the joint use of the two methodologies presented in our study, LCA and CBA, has shown how these tools complement each other, ensuring a better awareness of the social and environmental impact of the processes studied. According to Manzo et al. [68], the CBA ignores the indirect environmental costs associated with the project, and it suggests how the combination of this methodology with the LCA ensures a better quality of information for the decision-maker. In addition, the information provided by the LCA alone is difficult to use in the decision-making process, as the result it provides is expressed in units other than the euro (i.e., kg CO2eq), whereas the operational evaluation of projects takes place in monetary units.
Environmental policies based on the improvement of energy efficiency and renewable resource exploitation (as in in this case study) have special significance for carbon emissions reduction and the mitigation of the effects of climate change. However, the energy rebound effect caused by technological progress and green energies availability can indirectly increase consumptions, determining an opposite effect as greater as the efficiency is [69,70].

5. Conclusions

The objective of the study was to evaluate the environmental, economic, and financial performance of a biogas plant located in the province of Grosseto through the combined use of LCA and CBA methodologies. In line with the Recovery and Resilience Plan purpose to decisively increase the penetration of renewables, the implementation of an AD plant fed by cultured crops, such as the one analysed, does not implicate land grabbing for food production, but could contribute to the creation of repeatable small-scale energy production systems able to sustain the demand of local communities. The study demonstrates that this plant is able to valorise the marginal uncultivated land, increasing the electricity production from RES and restoring abandoned areas that would otherwise never be used, with the possibility of accelerating the development of local energy communities. In summary, the conclusions drawn show how the integration of socioenvironmental information with financial data can improve the project evaluation process by considering aspects that would otherwise remain outside the scope of the decision maker’s evaluation.
As an analytical tool aimed at interpreting reality, LCA offers a limited level of detail in terms of the databases available, but this study has demonstrated its ability to monitor and quantify the sustainability performance of public and/or private projects. On the other hand, CBA assesses the economic and financial viability of public and/or private projects by considering of the socioenvironmental benefits that they generate for the community.
The complementarity of the two methodologies is therefore confirmed; the two tools complement each other, ensuring a better awareness of the social and environmental impact of the processes studied. The ability of the two methodologies to complement each other shows how two seemingly very different instruments can be combined to produce a better result. This joint approach allows the complexity of environmental, social, and economic systems and dynamics to be considered. It can also encourage public reflection and political action to tackle climate change.
Future studies could evaluate the outcomes of the analysis of several AD plants. Moreover, the extension of the system boundaries could be assessed, with a view to considering both the impacts associated with the spreading of digestate on fields and the end-of-life or refurbishment phase of the biogas plant. In addition, future research could focus on a more thorough evaluation of additional matrices (i.e., composition) and an assessment of the impact of replacing these matrices with more sustainable alternatives. In fact, the main environmental impacts of energy crops depend on the choice of areas used for cultivation according to the soil characteristics, the climatic conditions, the type of crop selected, and the agronomic practices adopted—all elements which could be further examined. Additional investigations on the rebound effect linked to the renewable energy exploitation could be conducted in the future to guide policy makers’ decisions, to raise consumer awareness of responsible energy use, and to develop energy communities with the aim of equitably sharing the energy flows produced by AD plants between users.
The industrial conversion of dedicated crops and agricultural residues—such as residual straw from the local production of wheat, barley, and oat [71]—into biogas could become a technically viable reality in agricultural regions with a highly productive vocation for industrial crops, such as those presented in the Italian national territory. This could be a way to develop vast agricultural landscapes—and thus to maximize social benefits—as well as sustainable bioenergy cropping systems.
The present study aims to promote the development of AD systems further, and to encourage the sharing of knowledge and skills about the potential of this technology, especially among policy makers. To do this, policy makers need to be equipped with appropriate assessment tools such as LCA and CBA.

Supplementary Materials

The following supporting information can be downloaded at: https://www.mdpi.com/article/10.3390/en16093686/s1, Table S1: The statement of the financial analysis; Table S2: The statement of the economic analysis [72,73].

Author Contributions

Conceptualization, M.B., M.M., N.E., and F.M.P.; methodology, M.B., M.M., and N.E.; software, M.B. and N.E.; validation, V.N. and F.M.P.; formal analysis, M.B., M.M. and N.E.; investigation, M.B. and N.E.; resources, M.M.; data curation, M.B., M.M., and N.E.; writing—original draft preparation, M.B., M.M., and N.E.; writing—review and editing, M.B., M.M., N.E., V.N., and F.M.P.; visualization, M.B. and N.E.; supervision, V.N. and F.M.P. All authors have read and agreed to the published version of the manuscript.

Funding

This research received no external funding.

Data Availability Statement

The data presented in this study are available on request from the corresponding author.

Acknowledgments

The authors thank Graziano Ferrari for his expertise and availability in providing primary data and illustrating the AD plant operation. The authors also thank Silvia Ferrini from the Department of Political and International Sciences, University of Siena (Italy), for the review of the CBA analysis.

Conflicts of Interest

The authors declare no conflict of interest.

References

  1. International Energy Agency (IEA). Net Zero by 2050—A Roadmap for the Global Energy Sector. 2021. Available online: https://unfccc.int/documents/278467?gclid=CjwKCAjw9J2iBhBPEiwAErwpeXG32pZ5wD4fOe9idJF1AaSeYPU4BO8OalvQ37FpW-1MRm_G1oC1rBoCQRMQAvD_BwE (accessed on 20 February 2023).
  2. International Energy Agency (IEA). World Energy Outlook 2022. 2022. Available online: https://www.iea.org/reports/world-energy-outlook-2020?mode=overview (accessed on 13 March 2023).
  3. International Energy Agency (IEA). Global Energy Review: CO2 Emissions in 2021 Global Emissions Rebound Sharply to Highest Ever Level. 2021. Available online: https://www.iea.org/reports/global-energy-review-co2-emissions-in-2021-2 (accessed on 20 February 2023).
  4. Wei, W.; Mushtaq, Z.; Sharif, M.; Zeng, X.; Wan-Li, Z.; Qaisrani, M.A. Evaluating the Coal Rebound Effect in Energy Intensive Industries of China. Energy 2020, 207, 118247. [Google Scholar] [CrossRef]
  5. Mushtaq, Z.; Wei, W.; Jamil, I.; Sharif, M.; Chandio, A.A.; Ahmad, F. Evaluating the Factors of Coal Consumption Inefficiency in Energy Intensive Industries of China: An Epsilon-Based Measure Model. Resour. Policy 2022, 78, 102800. [Google Scholar] [CrossRef]
  6. European Commission (EC). European Green Deal. 2022. Available online: https://www.consilium.europa.eu/en/policies/green-deal/ (accessed on 20 February 2023).
  7. Italia Domani. Piano Nazionale di Ripresa e Resilienza #Nextgenerationitalia. 2022. Available online: https://www.italiadomani.gov.it/content/sogei-ng/it/it/home.html (accessed on 3 March 2023).
  8. Eurostat. From Where Do We Import Energy? 2022. Available online: https://ec.europa.eu/eurostat/cache/infographs/energy/bloc-2c.html (accessed on 20 February 2023).
  9. Harvey, F.; Ukraine War Prompts European Reappraisal of Its Energy Supplies. The Guardian 2022. Available online: https://www.theguardian.com/environment/2022/mar/04/ukraine-war-european-reappraisal-energy-supplies-coal-renewables (accessed on 11 March 2023).
  10. ANSA. Greenpeace, Ecco Quanto Inquina il Carbone Europeo. Wwf, in Italia 12 Centrali Che Possono Essere Chiuse Subito. 2015. Available online: https://www.ansa.it/canale_ambiente/notizie/inquinamento/2015/12/05/greenpeace-ecco-quanto-inquina-il-carbone-europeo_7c6c426c-40f8-4384-a649-7f590067b6b8.html#:~:text=Una%20quota%20modesta%2C%20osserva%20Greenpeace,e%20del%20cemento%20messi%20insieme (accessed on 11 March 2023).
  11. Italy for Climate. La Corsa Delle Regioni Verso la Neutralità Climatica. Il Primo Ranking Delle Regioni Italiane Sul Clima. 2021. Available online: www.italyforclimate.org (accessed on 11 March 2023).
  12. De Luca, E. Il Contributo Delle Tecnologie Energetiche Alla Decarbonizzazione. 2020. Available online: https://www.eai.enea.it/archivio/energia-e-green-new-deal-sommario/il-contributo-delle-tecnologie-energetiche-alla-decarbonizzazione.html (accessed on 20 February 2023).
  13. Enel. Quali Sono le Energie Rinnovabili in Italia, Qual è la più Diffusa e Quanta Energia Producono. 2023. Available online: https://www.enelgreenpower.com/it/learning-hub/energie-rinnovabili/italia (accessed on 13 March 2023).
  14. Tuscany Region. Documento di Economia e Finanza Regionale. 2020. Available online: https://www.regione.toscana.it/-/documento-di-economia-e-finanza-regionale-2022 (accessed on 11 March 2023).
  15. Legambiente. Comuni Rinnovabili, Sole, Vento, Acqua, Terra e Biomasse, lo Scenario Della Generazione Distribuita nel Territorio, Toscana. 2018. Available online: https://www.comunirinnovabili.it/comuni-rinnovabili-2018-edizioni-regionali/ (accessed on 11 March 2023).
  16. National Geographic. Biomass Energy. 2022. Available online: https://education.nationalgeographic.org/resource/biomass-energy (accessed on 20 February 2023).
  17. Silva Ortiz, P.; Flórez-Orrego, D.; de Oliveira Junior, S.; Maciel Filho, R.; Osseweijer, P.; Posada, J. Unit Exergy Cost and Specific CO2 Emissions of the Electricity Generation in the Netherlands. Energy 2020, 208, 118279. [Google Scholar] [CrossRef]
  18. Nati, C.; Genesio, L.; Picchi, G.; Sala, C. Digestori anaerobici di biomasse. In Decarbonizzazione Dell’economia Italiana. Il Catalogo Delle Tecnologie Energetiche; Sanson, A., Giuffrida, L.G., Eds.; ENEA: Rome, Italy, 2017; p. 232. [Google Scholar]
  19. IEA Bioenergy. Fossil vs Biogenic CO2 Emissions. 2023. Available online: https://www.ieabioenergy.com/iea-publications/faq/woodybiomass/biogenic-co2/ (accessed on 20 February 2023).
  20. Intergovernmental Panel on Climate Change (IPCC). AR5 Climate Change 2014: Mitigation of Climate Change. 2014. Available online: https://www.ipcc.ch/report/ar5/wg3/ (accessed on 20 February 2023).
  21. Adam, G.; Mottet, A.; Lemaigre, S.; Tsachidou, B.; Trouvé, E.; Delfosse, P. Fractionation of anaerobic digestates by dynamic nanofiltration and reverse osmosis: An industrial pilot case evaluation for nutrient recovery. J. Environ. Chem. Eng. 2018, 6, 6723–6732. [Google Scholar] [CrossRef]
  22. Ellen MacArthur Foundation. Circulate Products and Materials. 2022. Available online: https://ellenmacarthurfoundation.org/circulate-products-and-materials (accessed on 20 February 2023).
  23. Burg, V.; Rolli, C.; Schnorf, V.; Scharfy, D.; Anspach, V.; Bowman, G. Agricultural Biogas Plants as a Hub to Foster Circular Economy and Bioenergy: An Assessment Using Substance and Energy Flow Analysis. Resour. Conserv. Recycl. 2023, 190, 106770. [Google Scholar] [CrossRef]
  24. Seglah, P.A.; Neglo, K.A.W.; Wang, H.; Cudjoe, D.; Kemausuor, F.; Gao, C.; Bi, Y.; Wang, Y. Electricity Generation in Ghana: Evaluation of Crop Residues and the Associated Greenhouse Gas Mitigation Potential. J. Clean. Prod. 2023, 395, 136340. [Google Scholar] [CrossRef]
  25. Municipality of Grosseto. Monitoraggio Delle Emissioni d Gas Serra Nel Comune di Grosseto. 2020. Available online: https://new.comune.grosseto.it/web/comunicati/monitoraggio-dei-gas-serra-approvato-lo-schema-di-convenzione-con-luniversita-di-siena/ (accessed on 20 February 2023).
  26. Ruiz, D.; San Miguel, G.; Corona, B.; Gaitero, A.; Domínguez, A. Environmental and economic analysis of power generation in a thermophilic biogas plant. Sci. Total Environ. 2018, 633, 1418–1428. [Google Scholar] [CrossRef] [PubMed]
  27. Ascher, S.; Watson, I.; Wang, X.; You, S. Township-based bioenergy systems for distributed energy supply and efficient household waste re-utilisation: Techno-economic and environmental feasibility. Energy 2019, 181, 455–467. [Google Scholar] [CrossRef]
  28. Angouria-Tsorochidou, E.; Teigiserova, D.A.; Thomsen, M. Environmental and economic assessment of decentralized bioenergy and biorefinery networks treating urban biowaste. Resour. Conserv. Recycl. 2022, 176, 105898. [Google Scholar] [CrossRef]
  29. Bruno, M.; Marini, M.; Angouria-Tsorochidou, E.; Pulselli, F.M.; Thomsen, M. Ex ante Life Cycle Assessment and Environmental Cost-Benefit Analysis of an anaerobic digester in Italy. Clean. Waste Syst. 2022, 3, 100021. [Google Scholar] [CrossRef]
  30. European Commission. ANNEX to the Proposal for a Council Implementing Decision on the Approval of the Assessment of the Recovery and Resilience Plan for Italy. 2021. Available online: https://data.consilium.europa.eu/doc/document/ST-10110-2021-ADD-1/en/pdf (accessed on 14 April 2023).
  31. United States Environmental Protection Agency (EPA). Available online: https://sor.epa.gov/sor_internet/registry/termreg/searchandretrieve/glossariesandkeywordlists/search.do?details=&glossaryName=Lifecycle%20Assessment%20Glossary#:~:text=Definition%3A%20The%20background%20data%20include,and%20operations%20are%20not%20identified (accessed on 13 March 2023).
  32. Edwards, J.; Othman, M.; Crossin, E.; Burn, S. Anaerobic co-digestion of municipal food waste and sewage sludge: A comparative life cycle assessment in the context of a waste service provision. Bioresour. Technol. 2017, 223, 237–249. [Google Scholar] [CrossRef]
  33. UNI EN ISO 14040; Environmental Management e Life Cycle Assessment e Principles and Framework. International Organization for Standardization (ISO): London, UK, 2006.
  34. PRé Consultants. SimaPro 9.1.1. 2022. Available online: https://simapro.com/ (accessed on 13 February 2023).
  35. Ecoinvent. 2022. Available online: https://ecoinvent.org/ (accessed on 13 February 2023).
  36. Consiglio per la Ricerca in Agricoltura e L’analisi Dell’economia Agraria (CREA); Libera Associazione Agricoltori Cremonesi; Confagricoltura Brescia. Mais: Come Produrre Trinciato di Qualità. 2019. Available online: https://www.crea.gov.it/documents/43052/0/3.%20Volume%20trinciato%20mais_Bergamo.pdf (accessed on 13 February 2023).
  37. Gioanas, E.M. Compost da Digestato: Valutazioni Agronomiche e con LCA. Master’s Thesis, University of Torino, Torino, Italy, 2017. [Google Scholar]
  38. Cancila, E.; Orecchini, F.; Zecca, F. Oltre il PIL. I Nuovi Indicatori del Benessere e la Sostenibilità Dello Sviluppo. 2010. Available online: https://cipesalute.org/cedo/allegati/3408-Oltre_il_Pil.pdf (accessed on 15 February 2023).
  39. Levin, H.M.; McEwan, P.J. Cost-Effectiveness Analysis: Methods and Applications, 2nd ed.; SAGE Publications, Inc.: Thousand Oaks, CA, USA, 2001. [Google Scholar]
  40. Florio, M.; Tracogna, A.; Maffii, S.; Levarlet, M.F.; Genco, M.; Finzi, U.; Vignetti, S. Guida All’analisi Costi-Benefici dei Progetti di Investimento, 2nd ed.; Publications Office of the European Union: Luxembourg, 2003. [Google Scholar]
  41. Sartori, D.; Catalano, G.; Genco, M.; Pancotti, C.; Sirtori, E.; Vignetti, S.; Del Bo, C. Guida All’analisi Costi-Benefici dei Progetti D’investimento. Strumento di Valutazione Economica per la Politica di Coesione 2014–2020; Casalini Libri: Fiesole, Italy, 2014. [Google Scholar]
  42. Natale, F. I Progetti Generatori di Entrate Nella Valutazione Degli Investimenti Pubblici. 2019. Available online: https://www.unisalento.it/documents/20152/208192/I+progetti+generatori+di+entrate+nella+valutazione+degli+investimenti+pubblici.pdf/a418f926-9c0b-f215-b3d5-5ed0ba006fcf?version=1.0 (accessed on 11 March 2023).
  43. Reniers, G.; Talarico, L.; Paltrinieri, N. Cost-Benefit Analysis of Safety Measures. In Dynamic Risk Analysis in the Chemical and Petroleum Industry: Evolution and Interaction with Parallel Disciplines in the Perspective of Industrial Application; Butterworth-Heinemann: Oxford, UK, 2016; pp. 195–205. [Google Scholar]
  44. Huang, J.; Tong, J.; Wang, P.; Zheng, X. Application and Comparison of NPV and IRR Methods in the Company Investment Decision. In Proceedings of the 7th International Conference on Financial Innovation and Economic Development (ICFIED 2022), Zhuhai, China, 14–16 January 2022. [Google Scholar]
  45. Utilitalia federazione utilities. Schema di Decreto Legislativo Recante Attuazione Della Direttiva (UE) 2018/2001 Sulla Promozione Dell’uso di Energia da Fonti Rinnovabili Atto del Governo Sottoposto a Parere Parlamentare n. 292. 2021. Available online: https://www.senato.it/application/xmanager/projects/leg18/attachments/documento_evento_procedura_commissione/files/000/417/101/2021_09_23_Utilitalia.pdf (accessed on 11 March 2023).
  46. Tuscany Region. Analisi Dell’impatto Della Regolamentazione Manuale di Pratiche. 2009. Available online: https://www.regione.toscana.it/documents/10180/727277/Manuale+AIR.pdf/22e6ca00-075d-49e4-ac66-ecb493f9c4b8 (accessed on 11 March 2023).
  47. Gestore dei Servizi Energetici (GSE). Regolamento Operativo per L’accesso agli Incentivi del DM 4 luglio 2019. 2022. Available online: https://www.gse.it/servizi-per-te/news/fer-elettriche-regolamento-operativo-per-l-accesso-agli-incentivi-del-dm-4-luglio-2019-e-apertura-dei-bandi (accessed on 15 February 2023).
  48. Lorenzoni, A.; Bano, L. I Costi di Generazione di Energia Elettrica da Fonti Rinnovabili. 2007. Available online: https://www.astrid-online.it/static/upload/protected/Stud/Studio-Aper_Universit--Padova_25_10_07.pdf (accessed on 11 March 2023).
  49. D.P.R. n. 633. Testo Unico Iva. 1972. Available online: https://www.altalex.com/documents/codici-altalex/2019/01/25/decreto-iva (accessed on 11 March 2023).
  50. Maiolo, S.; Scandizzo, P.L. La valutazione economica nell’analisi costi benefici: Una stima dei prezzi ombra attraverso le tavole Input-Output. In RIV: Rassegna Italiana di Valutazione; Digital Casalini: Fiesole, Italy, 2005; Volume 32. [Google Scholar]
  51. ISPI (Istituto per gli Studi di Politica Internazionale) Data Lab. Crisi Energetica: L’Italia è Diversa? 2022. Available online: https://www.ispionline.it/it/pubblicazione/crisi-energetica-litalia-e-diversa-33404 (accessed on 15 February 2023).
  52. Fusi, A.; Bacenetti, J.; Fiala, M.; Azapagic, A. Life cycle environmental impacts of electricity from biogas produced by anaerobic digestion. Front. Bioeng. Biotechnol. 2016, 4, 26. [Google Scholar] [CrossRef]
  53. Sovacool, B.K. Valuing the greenhouse gas emissions from nuclear power: A critical survey. Energy Policy 2008, 36, 2950–2963. [Google Scholar] [CrossRef]
  54. Pulselli, R.M.; Marchi, M.; Neri, E.; Marchettini, N.; Bastianoni, S. Carbon accounting framework for decarbonisation of European city neighbourhoods. J. Clean. Prod. 2019, 208, 850–868. [Google Scholar] [CrossRef]
  55. Pulselli, R.M.; Maccanti, M.; Bruno, M.; Sabbetta, A.; Neri, E.; Patrizi, N.; Bastianoni, S. Benchmarking Marine Energy Technologies Through LCA: Offshore Floating Wind Farms in the Mediterranean. Front. Energy Res. 2022, 10, 902021. [Google Scholar] [CrossRef]
  56. Bruno, M.; Maccanti, M.; Pulselli, R.M.; Sabbetta, A.; Neri, E.; Patrizi, N.; Bastianoni, S. Benchmarking marine renewable energy technologies through LCA: Wave energy converters in the Mediterranean. Front. Energy Res. 2022, 10, 980557. [Google Scholar] [CrossRef]
  57. Agostini, A.; Battini, F.; Padella, M.; Giuntoli, J.; Baxter, D.; Marelli, L.; Amaducci, S. Economics of GHG emissions mitigation via biogas production from Sorghum, maize and dairy farm manure digestion in the Po valley. Biomass Bioenergy 2016, 89, 58–66. [Google Scholar] [CrossRef]
  58. Zulkepli, N.E.; Muis, Z.A.; Mahmood, N.A.N.; Hashim, H.; Ho, W.S. Cost Benefit Analysis of Composting and Anaerobic Digestion in a Community: A Review. Chem. Eng. Trans. 2017, 56, 1777–1782. [Google Scholar]
  59. Ekinci, K.; Erdal, I.; Uysal, Ö.; Uysal, F.Ö.; Tunce, H.; Doğan, A. Anaerobic Digestion of Three Microalgae Biomasses and Assessment of Digestates as Biofertilizer for Plant Growth. Environ. Prog. Sustain. Energy 2019, 38, e13024. [Google Scholar] [CrossRef]
  60. Kumar, S.; Sindhu, S.S.D.; Kumar, R. Biofertilizers: An ecofriendly technology for nutrient recycling and environmental sustainability. Curr. Res. Microb. Sci. 2022, 3, 100094. [Google Scholar] [CrossRef] [PubMed]
  61. Guido, V.; Riva, E.; Finzi, A.; Bacenetti, L.; Provolo, G.; Guidetti, A.; Sanguanini, A.; Merigo, G.; Ruffini, G.; Sommariva, F. Il Digestato, un Buon Fertilizzante per il Mais. 2020. Available online: https://www.informatoreagrario.it/difesa-e-fertilizzazione/fertilizzazione/il-digestato-un-buon-fertilizzante-per-il-mais/ (accessed on 11 March 2023).
  62. Market Analysis Report. Italy Foliar Fertilizer Market Size Report, 2022–2030. 2021. Available online: https://www.grandviewresearch.com/industry-analysis/italy-foliar-fertilizer-market-report# (accessed on 20 February 2023).
  63. Cappellini, M. Costi Delle Semine Alle Stelle per i Rincari dei Fertilizzanti. Il Sole 24 Ore. 2022. Available online: https://www.ilsole24ore.com/art/costi-semine-stelle-i-rincari-fertilizzanti-AE5pjC9 (accessed on 20 February 2023).
  64. Neri, V. News Quale Legame tra Gas e Fertilizzanti. 2022. Available online: https://www.cure-naturali.it/articoli/vita-naturale/vita-green/gas-fertilizzanti.html (accessed on 15 February 2023).
  65. Ingiuso, N. CO2, Effetto Coronavirus. Report. 2020. Available online: https://www.startmag.it/energia/c02-effetto-coronavirus-report/ (accessed on 11 March 2023).
  66. Cucchiella, F.; D’Adamo, I.; Gastaldi, M. An economic analysis of biogas-biomethane chain from animal residues in Italy. J. Clean. Prod. 2019, 230, 888–897. [Google Scholar] [CrossRef]
  67. Salerno, M.; Gallucci, F.; Pari, L.; Zambon, I.; Sarri, D.; Colantoni, A. Costs-benefits analysis of a small-scale biogas plant and electric energy production. Bulg. J. Agric. Sci. 2017, 23, 357–362. [Google Scholar]
  68. Manzo, S.; Salling, K.B. Integrating Life-cycle Assessment into Transport Cost-benefit Analysis. Transp. Res. Procedia 2016, 14, 273–282. [Google Scholar] [CrossRef]
  69. Galvin, R.; Dütschke, E.; Weiß, J. A conceptual framework for understanding rebound effects with renewable electricity: A new challenge for decarbonizing the electricity sector. Renew. Energy 2021, 176, 423–432. [Google Scholar] [CrossRef]
  70. Wang, Z.; Han, B.; Lu, M. Measurement of energy rebound effect in households: Evidence from residential electricity consumption in Beijing, China. Renew. Sustain. Energy Rev. 2016, 58, 825–861. [Google Scholar] [CrossRef]
  71. Patrizi, N.; Caro, D.; Pulselli, F.M.; Bjerre, A.B.; Bastianoni, S. Environmental Feasibility of Partial Substitution of Gasoline with Ethanol in the Province of Siena (Italy). J. Clean. Prod. 2013, 47, 388–395. [Google Scholar] [CrossRef]
  72. Marchesi, R.; Bombarda, P.; Bresciani, F.; Casalegno, A.; Guilizzoni, M.; Gino Manfredi, A.; Escobar, P.; Rota, A.; Zago, M. Costi di Produzione di Energia Elettrica da Fonti Rinnovabili. 2013. Available online: https://www.autorita.energia.it/allegati/docs/13/RappPolitecnicoRinn.pdf (accessed on 15 February 2023).
  73. Del Bo, C.; Fiorio, C.; Florio, M. Shadow Wages for the EU Regions. Fisc. Stud. 2011, 32, 109–143. [Google Scholar] [CrossRef]
Figure 1. Flowchart of the system analysed. The figure shows the main phases that characterise the life cycle of the energy production from biomass.
Energies 16 03686 g001
Figure 2. The CF results for different stages of the plant lifecycle.
Energies 16 03686 g002
Table 1. Carbon dioxide emissions (gCO2/kJel) related to the electricity production through different energy sources [17].
Energy SourceDirect Specific Emissions (gCO2/kJel a)
Coal0.0783
Oil products0.0710
Natural gas0.0565
Nuclear-
Wind-
Biomass (e.g., wood)-
a kJel: kilo Joule of electricity produced.
Table 2. The fixed costs for the plant analysed.
DescriptionCost (EUR)
Civil works1,840,000
Electromechanical works1,100,000
Ancillary works160,000
Engine870,000
Field90,000
Table 3. CF results for each inventory flow analysed associated with the total electricity produced in 2021.
Life Cycle
Phase
InputQuantityUnitGWP100y
(kg CO2eq·
Single Unit of Input−1)
Ecoinvent 3
Process
1. AgriculturalWheat seeds11,000.00kg0.49Wheat seed, Swiss integrated production, for sowing {CH}|market for wheat seed, Swiss integrated production, for sowing|Cut-off, U
Diesel9812.00kg0.56Diesel, low-sulfur {Europe without Switzerland}|market for|Cut-off, U
Urea10,000.00kg3.26Urea, as N {GLO}|market for|Cut-off, U
Maize seeds225,000.00t1.03Maize seed, Swiss integrated production, at farm {CH}|market for maize seed, Swiss integrated production, at farm|Cut-off, U
Water360,000,000.00kg0.0003Tap water {Europe without Switzerland}|market for|Cut-off, U
Urea120,000.00kg3.26Urea, as N {GLO}|market for|Cut-off, U
Pesticide3600.00kg9.71Pesticide, unspecified {GLO}|market for|Cut-off, U
Herbicide99.00kg10.80Glyphosate {GLO}|market for|Cut-off, U
Diesel110,721.00kg0.56Diesel, low-sulfur {Europe without Switzerland}|market for|Cut-off, U
Transport166,000.00t·km0.51Transport, freight, lorry 3.5–7.5 metric ton, EURO6 {RER}|transport, freight, lorry 3.5–7.5 metric ton, EURO6|Cut-off, U
2. Additional feedstock matrixMaize flour1,400,000.00kg0.81Maize flour {RoW}|market for maize flour|Cut-off, U
Transport70,000.00t·km0.51Transport, freight, lorry 3.5–7.5 metric ton, EURO6 {RER}|transport, freight, lorry 3.5–7.5 metric ton, EURO6|Cut-off, U
3. Storage and pre-treatmentWater4,000,000.00kg0.0003Tap water {Europe without Switzerland}|market for|Cut-off, U
Compost360,000.00kg0.0031Compost {GLO}|market for|Cut-off, U
Diesel7932.50kg0.56Diesel {Europe without Switzerland}|market for|Cut-off, U
Electricity2626.00kWh0.12Electricity, low voltage {Europe without Switzerland}|market group for|Cut-off, U
Polyethylene (PE) film3400.00kg3.14Packaging film, low density polyethylene {GLO}|market for|Cut-off, U
4. AD and biogas productionMolybdenum trioxide60.00kg40.70Molybdenum trioxide {GLO}|market for|Cut-off, U
Selenium60.00kg2.52Selenium {GLO}|market for|Cut-off, U
Nickel sulphate60.00kg6.00Nickel sulfate {GLO}|market for|Cut-off, U
Iron sulphate60.00kg0.17Iron sulfate {RER}|market for iron sulfate|Cut-off, U
Copper sulphate60.00kg2.94Copper sulfate {GLO}|market for|Cut-off, U
Zinc monosulphate60.00kg0.70Zinc monosulfate {RER}|market for zinc monosulfate|Cut-off, U
Magnesium sulphate60.00kg0.43Magnesium sulfate {GLO}|market for|Cut-off, U
Aluminium7300.00kg1.01Aluminium hydroxide {GLO}|market for|Cut-off, U
Heat490.69MJ0.11Heat, central or small-scale, other than natural gas {Europe without Switzerland}|market for heat, central or small-scale, other than natural gas|Cut-off, U
5. MaintenanceAluminium37.50kg5.31Aluminium, cast alloy {GLO}|market for|Cut-off, U
Iron45.50kg0.11Iron pellet {GLO}|market for|Cut-off, U
Ceramic3.00kg1.29Frit, for ceramic tile {GLO}|market for|Cut-off, U
Lubricating oil3520.00kg1.35Lubricating oil {GLO}|market for|Cut-off, U
Table 4. Variation in financial performance indices as critical variables change.
VariableFNPV
before (EUR)
FNPV
after (EUR)
Variation (%)FIRR
before (%)
FIRR
after (%)
Variation (%)
Electricity feed-in tariff−838,639−1,116,423331.891.14−40
Operating costs−838,639−1,028,974231.891.39−27
Table 5. Variation in economic performance indices as critical variables change.
VariableENPV
before (EUR)
ENPV
after (EUR)
Variation (%)EIRR
before (%)
EIRR
after (%)
Variation (%)
Electricity feed-in tariff3,876,9893,586,393−711.5811.00−5
Operating costs3,876,9893,688,426−511.5811.19−3
CO2 price
(10 EUR·t CO2eq−1)
3,876,9892,948,495−2411.589.71−16
CO2 price
(40 EUR·t CO2eq −1)
3,876,9894,833,4662511.5813.4316
Disclaimer/Publisher’s Note: The statements, opinions and data contained in all publications are solely those of the individual author(s) and contributor(s) and not of MDPI and/or the editor(s). MDPI and/or the editor(s) disclaim responsibility for any injury to people or property resulting from any ideas, methods, instructions or products referred to in the content.

