Article

Research on Gas Channeling Identification Using the Fuzzy Comprehensive Evaluation Method

1
PetroChina Research Institute of Petroleum Exploration and Development, Beijing 100083, China
2
PetroChina Jilin Oilfield, Songyuan 138000, China
3
Institute of Unconventional Oil and Gas Science and Technology, China University of Petroleum, Beijing 102249, China
*
Author to whom correspondence should be addressed.
Energies 2024, 17(16), 3908; https://doi.org/10.3390/en17163908
Submission received: 6 July 2024 / Revised: 26 July 2024 / Accepted: 2 August 2024 / Published: 8 August 2024
(This article belongs to the Topic Enhanced Oil Recovery Technologies, 3rd Volume)

Abstract

:
With the development of the petroleum industry and advancements in technology, gas injection techniques have gradually matured and become an important means to enhance oil recovery in reservoir development. Gas channeling is a major challenge in the process of gas injection development. The presence of gas channeling can lead to a decrease in the swept volume of gas flooding, severely affecting the effectiveness of gas injection development. This paper focuses on low-permeability reservoirs, comprehensively analyzing the development characteristics of low-permeability reservoirs and the dynamic characteristics of gas flooding production. It selects and evaluates indicators for assessing the development degree of gas channeling and establishes a fuzzy comprehensive evaluation method for evaluating gas channeling in the gas injection development of low-permeability reservoirs. Based on the evaluation values derived from the fuzzy comprehensive evaluation, it classifies the development levels of gas channeling. Application in oilfield cases shows that the evaluation results of this method are generally consistent with the dynamic response of production data, with high evaluation accuracy. This provides strong support for implementing gas channeling prevention and control measures on site and improving the effectiveness of gas injection development.

1. Introduction

Low-permeability reservoirs have enormous development potential. Research and practice have shown that gas injection development can significantly enhance the recovery rate of low-permeability reservoirs [1,2]. To address the issue of decreased water injection efficiency during the high water cut period in low-permeability reservoirs, gas injection development, as a tertiary recovery technique following water flooding, demonstrates significant advantages and tremendous application prospects, with an average increase in recovery rate exceeding 10% [3,4,5,6]. Due to the strong heterogeneity of low-permeability reservoirs, the development of natural and artificial fracture networks, the high mobility of injected gas, and the unreasonable design of injection–production parameters, injected gas tends to form channeling flows along fractures, large pores, and high-permeability streaks [7,8]. The presence of gas channeling leads to a decrease in the swept volume of gas flooding, reducing oil recovery rates and deteriorating oilfield development performance.
Currently, the widely used methods for identifying channeling pathways mainly include tracer monitoring, core sample identification, well logging curve identification, and well test analysis. The tracer monitoring method determines the channeling pathways by monitoring the changes in the concentration and production time of tracers produced from the production well [9,10]. Abbaszadeh et al. [11] established a method for calculating parameters such as porosity and permeability from the tracer characteristic curves of multilayer reservoirs through theoretical analysis and nonlinear optimization techniques. Although the tracer monitoring method is simple to apply, it is time-consuming and affects normal production [12,13,14]. The core sample identification method can obtain the physical parameters of core samples through laboratory experiments. By analyzing parameters such as permeability and pore throat radius, it intuitively determines the development of channeling [15]. Xiaolu Zhang [16] summarized and analyzed physical parameters such as permeability and pore throat radius based on core sample experiments and established criteria for identifying channeling pathways. However, obtaining core samples is costly, and the core data only reflect the characteristics of the formation in a specific period. Long-term fluid injection can change the characteristics of the formation [17,18]. The well logging curve identification method interprets well logging curves, calculating formation parameters based on the factors of different curves to identify channeling pathways [19,20]. Sun Liang et al. [21] used well logging curve data to calculate the true resistivity variation coefficient of each layer in the oil well, obtaining identification parameters for each layer and identifying the channeling pathways development layers based on these parameters. However, the large volume of well logging data makes it difficult for traditional manual interpretation methods to meet the requirements for fast and accurate analysis [22,23]. Well test analysis uses well test data to obtain pressure change curves of the reservoir. By analyzing the characteristics of these curves, it identifies near-well channeling pathways [24,25]. B. Lage et al. [26] established an improved Hall curve equation, using the separation of pressure curves and their derivative curves to determine channeling pathways. However, well test analysis requires shutting in the well to collect data, which to some extent limits the widespread application of well test interpretation [27].
Conventional methods for identifying channeling pathways each have certain limitations. The fuzzy comprehensive evaluation method for identifying channeling pathways is favored by scholars both domestically and internationally due to its high evaluation flexibility, simplicity in obtaining evaluation parameters, and accurate identification results. Zheng et al. [28] established an evaluation index system based on the characteristics and influencing factors of water-flooded reservoirs using a fuzzy comprehensive evaluation method. Hualin Liu [29] used fuzzy mathematical analysis to establish an evaluation system for channeling pathways in production wells and injection wells, respectively. Based on the identification results of production and injection wells, they determined the distribution of channeling pathways in the well area. Yurun Li [30] developed an evaluation index system for identifying gas channeling pathways and used a fuzzy comprehensive evaluation method, combining weight vectors and membership matrices, to identify and assess the development levels of gas channeling pathways in clastic rock reservoirs.
Currently, research on fuzzy comprehensive evaluation methods mainly focuses on water-flooded reservoirs, with relatively few studies on identifying gas channeling pathways in gas injection development. Additionally, the evaluation index systems are not comprehensive, making it challenging to provide guidance for field implementation. Therefore, there is an urgent need to establish a comprehensive evaluation index system for gas channeling pathways and to develop a fuzzy comprehensive evaluation method suitable for identifying gas channeling pathways in low-permeability reservoirs to ensure efficient gas injection development.
This study establishes a method for identifying gas channeling pathways in low-permeability reservoirs based on fuzzy comprehensive evaluation. Based on geological and production characteristics, six static indicators and six dynamic indicators were identified for evaluating gas channeling pathways in the gas injection development of low-permeability reservoirs. Through comparative research, the contribution of each indicator to the formation and development of gas channeling pathways was clarified, and the evaluation weights of the indicators were calculated. Based on the evaluation results of the fuzzy comprehensive evaluation, five development levels of gas channeling pathways were classified. Field application in the H block demonstrated that this method can determine the development degree of gas channeling pathways between injection and production wells with high identification accuracy. For strong gas channeling pathways, this method can analyze layer by layer, identify strong gas channeling layers, and guide oilfield blockage and regulation.

2. Comprehensive Fuzzy Evaluation Method of Gas Channeling Pathways

The formation and development of gas channeling pathways are influenced by multiple factors, such as geological environment and production parameters. Conventional analysis methods, such as production dynamic analysis and numerical simulation studies, are time-consuming and difficult to characterize. For objects or phenomena controlled by multiple factors, the fuzzy comprehensive evaluation method can use the principles of fuzzy mathematics to evaluate the impact degree of each indicator. By combining the importance of the indicators with actual data, an overall evaluation result of the object or phenomenon can be obtained [31]. Through fuzzy comprehensive evaluation, the contribution degree of multiple indicators to gas channeling pathways can be assessed, and the evaluation result of the gas channeling pathway can be obtained through fuzzy calculation [32]. Based on the evaluation results, the development grading standards of gas channeling pathways can be classified. The process of identifying gas channeling pathways using the fuzzy comprehensive evaluation method includes: (1) selecting the static and dynamic indicators for evaluating gas channeling pathways; (2) determining the indicator weight matrix and calculating the weight of each indicator; (3) calculating the membership degree of each indicator based on field data; (4) constructing an evaluation model to identify gas channeling pathways.

2.1. Determination of Static and Dynamic Indicators

During the gas injection development process, the factors influencing the formation of dominant gas channeling pathways can be roughly divided into two categories: static reservoir factors and dynamic production parameters. Static reservoir factors characterize the potential for channeling pathway formation and provide the geological basis for gas channeling development. Dynamic production parameters reflect the effects of development adjustments and directly characterize the formation of gas channeling pathways. By comprehensively analyzing the development characteristics of low-permeability reservoirs and the production dynamics of gas injection development, and considering factors such as overall evaluation, data availability, and indicator relevance, combined with previous research results, the evaluation indicators for fuzzy comprehensive evaluation are determined. The influence patterns and performance characteristics of these evaluation indicators on the development of gas channeling pathways are also analyzed.
(1) Static Reservoir Indicators
Effective Thickness: The greater the effective thickness of the reservoir, the more pronounced the gravitational differentiation among the three phases of oil, gas, and water, the more severe the gas overrun phenomenon, and the higher the likelihood of forming gas channeling pathways [30].
Permeability: The higher the average permeability of the reservoir, the faster the gas displacement speed, the lower the flow resistance, and the more severe the frontal fingering phenomenon, increasing the probability of forming dominant gas channeling pathways [30].
Planar Heterogeneity: The stronger the planar heterogeneity of the reservoir development, the easier it is for the injected gas to break through along high-permeability areas, reducing the volume swept by the gas and leading to more severe gas channeling.
Vertical Heterogeneity: The greater the vertical heterogeneity, the more high-permeability layers there are, the more uneven the gas absorption by the reservoir, and the more severe the gas channeling. Vertical heterogeneity is a major geological factor restricting injection effectiveness.
Angle between the Injection–Production Direction and the Main Fracture Direction (simplified as “angle” in the following tables): This indicator represents the development of reservoir fractures. Due to the low flow resistance of fractures, the smaller the angle between the injection–production direction and the main fracture direction, the higher the probability of gas channeling along fractures, and the greater the likelihood of forming gas channeling pathways [33].
Sedimentary Rhythm: Sedimentary rhythm refers to the layering pattern of rock formation according to the order of grain size. In normal rhythmic reservoirs, the lithology becomes finer from bottom to top, while in reverse rhythmic reservoirs, the lithology becomes coarser from bottom to top [34]. Under the influence of gravitational differentiation, reverse rhythmic reservoirs are more prone to gas channeling compared to normal rhythmic reservoirs.
(2) Dynamic Production Indicators
Injection–Production Gas Ratio: This ratio indicates the volume of gas retained underground after injection. The larger the injection–production gas ratio, the more gas is retained underground, and the lower the probability of forming gas channeling pathways.
Production Gas–Oil Ratio (GOR): This ratio represents the effectiveness of gas injection development in oilfields. The change in the gas–oil ratio is generally used to determine whether gas channeling has occurred at the bottom of the production well [35]. The higher the production gas–oil ratio, the lower the gas injection oil recovery rate, and the higher the probability of forming gas channeling pathways.
Production Gas–Liquid Ratio (GLR): Similar to the production gas–oil ratio, during significant gas channeling, both gas production and liquid production will show a marked increase [35]. The higher the production gas–liquid ratio, the higher the probability of forming gas channeling pathways.
Injection Water–Gas Ratio (WGR): For reservoirs developed with alternating water–gas injection, the smaller the ratio of water slug to gas slug, the larger the volume of gas injected in a single cycle of alternating water–gas injection, and the higher the probability of forming gas channeling pathways.
Injection Intensity: This refers to the daily gas injection volume per unit thickness. The greater the gas injection intensity, the faster the gas advancement speed, the more severe the frontal fingering, and the higher the probability of forming gas channeling pathways [29].
Distance between the Injection and Production Wells (simplified as “distance” in the following tables): The shorter the distance between the production well and the injection well, the faster the average gas breakthrough speed, the shorter the time for the production well to detect gas, and the more likely gas channeling will occur [29].
Based on the analysis results of the influence patterns and performance characteristics of evaluation indicators on the development of gas channeling pathways, the analytic hierarchy process [36] is used to analyze each evaluation indicator and establish a fuzzy comprehensive evaluation hierarchical structure (Figure 1). According to the interrelationships and affiliations of each indicator, they are decomposed into a three-tier hierarchical model, gradually narrowing the evaluation scope from top to bottom. The gas channeling pathway identification system is the target layer, representing the final result of the fuzzy comprehensive evaluation method. Static indicators and dynamic indicators form the criterion layer, representing the evaluation units of the gas channeling pathway identification system. Indicators such as effective thickness, permeability, and planar heterogeneity form the evaluation layer, representing the specific evaluation indicators of the gas channeling pathway identification system.

2.2. Determination of Indicator Weights

The determination of weights is a crucial step in the fuzzy comprehensive evaluation method. Weight values represent the importance of each evaluation indicator and reflect their contribution to the evaluation target. In this study, the analytic hierarchy process is used to calculate the indicator weights. For the constructed multi-level hierarchical structure model, a discrimination matrix for each level is established based on the nine-point scale method. The weights of the evaluation indicators within the matrix are calculated using the square root method. Through the hierarchical affiliations, the weight values of the indicators for evaluating gas channeling pathways are obtained.

2.2.1. Construction of the Weight Discrimination Matrix

The nine-point scale method qualitatively characterizes the relative importance of different indicators through various scales. The meanings of different scale values are shown in Table 1. Based on the principles of the nine-point scale method, the indicators within the same level can be compared pairwise to determine the relative importance of each indicator sequentially.
Based on the fuzzy comprehensive evaluation hierarchical structure model for gas channeling pathways, the nine-point scale method is used to assign judgment values to indicators within each level, forming a weight discrimination matrix. In the decision layer matrix, static indicators are equally important compared to themselves; thus, the first row, first column of the discrimination matrix should be filled with 1. When comparing static indicators to dynamic indicators, dynamic indicators are more important. The degree of importance falls between equal importance and moderate importance, so the first row, second column should be filled with 1/2. By analogy, the discrimination matrices for the decision layer, static indicators, and dynamic indicators are established as shown in Table 2, Table 3 and Table 4.

2.2.2. Weight Calculation Method

The principle of the square root method for calculating matrix weights is as follows:
M = [ m 1 , m 2 , , m i , , m n ] T
m i = j = 1 n b i j n ( i = 1 , 2 , , n )
where mi is the product of the elements in the ith row of the discrimination matrix, bij represents the value in the ith row and jth column of the discrimination matrix, and n is the number of indicators in the discrimination matrix.
Normalize the vector M to obtain
ω = [ ω 1 , ω 2 , , ω i , , ω n ] T
ω i = m i / j = 1 n m j
where ω represents the weight matrix of the evaluation indicators, and ωi is the weight of the ith indicator in the discrimination matrix.
Based on the principle of the square root method, the weights of the indicators in the discrimination matrices shown in Table 2, Table 3 and Table 4 are calculated. The results of the weight calculations are shown in Table 5.

2.3. Calculation of Indicator Membership Degree

The calculation of the membership degree is the process of mapping field data to membership values. The purpose is to eliminate errors in the evaluation system caused by differences in magnitude and units of the evaluation data. Through the calculation of the membership function, the actual data of evaluation indicators are converted into values between 0 and 1. These values are then combined with the weights of the evaluation indicators to obtain fuzzy evaluation results. This paper uses a trapezoidal membership function to calculate the membership values of the evaluation indicators. Based on the influence of static and dynamic indicators on the development of gas channels, the membership calculation functions for each evaluation indicator have been determined.

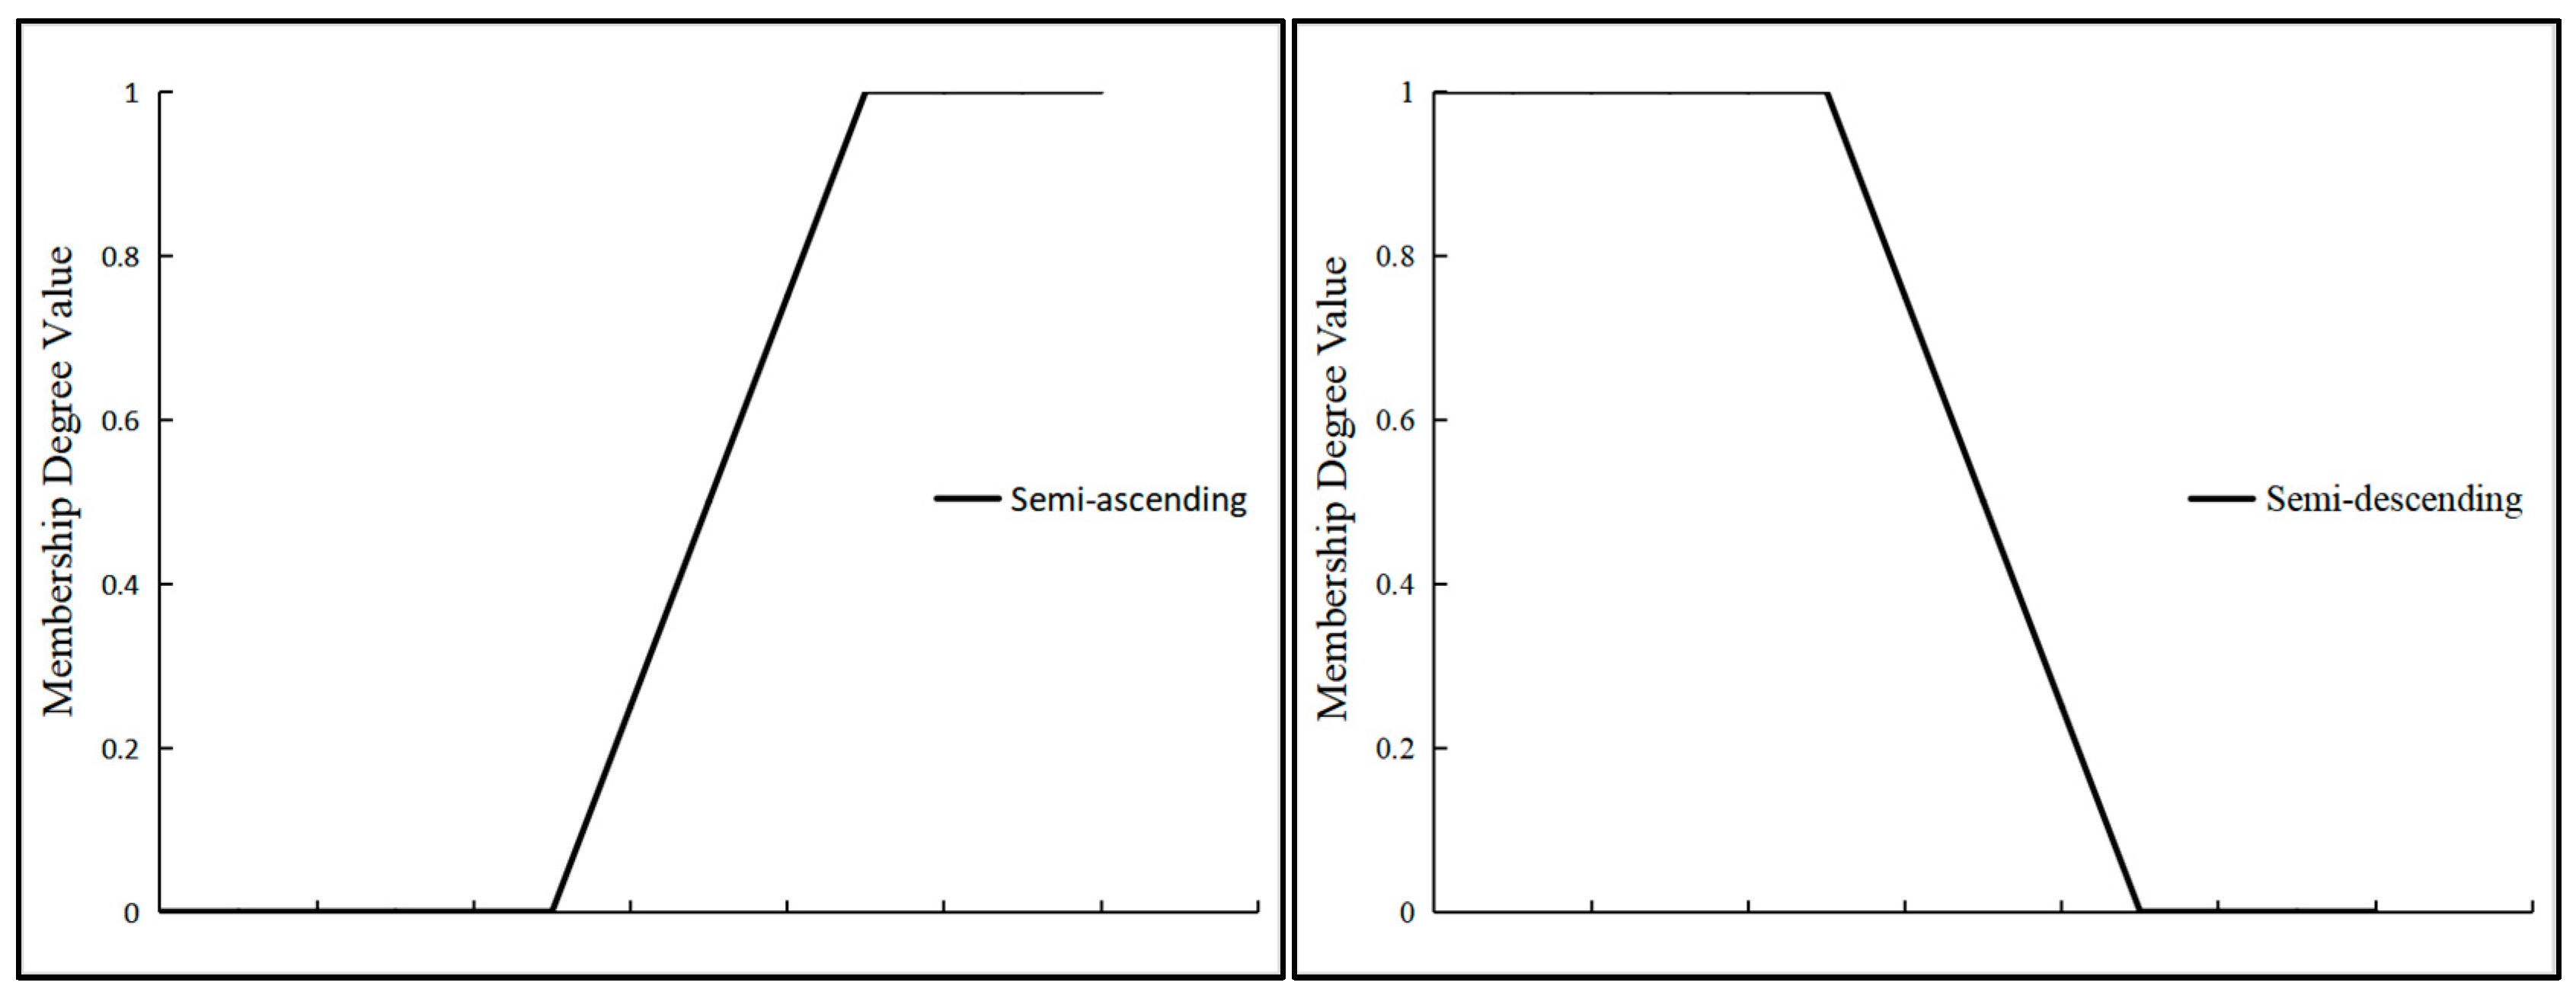
2.3.1. Membership Function

Trapezoidal membership functions can be divided into semi-ascending trapezoidal membership functions and semi-descending trapezoidal membership functions based on their distribution rules (Figure 2). The calculation methods for the trapezoidal membership functions are shown in Equations (5) and (6).
r u ( x ) = { 0 ( x a ) / ( b a ) 1 if if if x a x ( a , b ) x b
r d ( x ) = { 1 ( b x ) / ( b a ) 0 if if if x a x ( a , b ) x b
where ru and rd are semi-ascending and semi-descending trapezoidal membership functions, respectively, and a and b represent the lower and upper limits for the calculation of the indicator membership degree, respectively.
By using the membership function, the corresponding membership values for different evaluation indicators can be obtained. This results in the membership evaluation matrix R.
R = ( r 11 r 12 r 1 n r 21 r 22 r 2 n r m 1 r m 2 r m n )
where R is the membership matrix of the evaluation indicators, and rmn represents the membership value of the mth indicator and the nth calculation result.

2.3.2. Calculation Functions for Indicator Membership Degrees

Based on the analysis of the impact of static and dynamic indicators on the development of gas channels in low-permeability reservoirs, the membership degree calculation functions for each indicator are determined. The greater the membership values for indicators such as effective thickness, planar heterogeneity, and production gas–oil ratio, the higher the probability of gas channel formation. Therefore, a semi-ascending membership function is used for these indicators. Conversely, the smaller the membership values for parameters like the angle between the injection–production direction and the main fracture direction, injection–production gas ratio, and injection–production well spacing, the higher the probability of gas channel formation. Hence, a semi-descending membership function is used for these parameters. The membership degree for the sedimentary rhythm indicator is defined as follows: the membership value is 0 for normal rhythmic reservoirs, 1 for reverse rhythmic reservoirs, and 0.5 for composite rhythmic reservoirs. The membership degree calculation functions for each indicator are shown in Table 6.

2.4. Gas Channel Grading Standards

The result of the fuzzy comprehensive evaluation is obtained by multiplying the weight of the evaluation indicators by their membership values, resulting in a value between 0 and 1. According to Equations (3) and (7), the calculation formula for the fuzzy comprehensive evaluation result is as follows:
F = R ω
where F represents the fuzzy comprehensive evaluation result, R is the membership matrix of the evaluation indicators, and ω is the weight matrix of the evaluation indicators.
The degree of development of gas channels is divided into five levels: no obvious gas channeling, slight gas channeling, weak gas channeling, strong gas channeling, and complete gas channeling. When the fuzzy comprehensive evaluation result F < 0.25, it indicates that there is no obvious gas channeling in the reservoir. When the evaluation result is 0.25 ≤ F < 0.4, it indicates slight gas channeling in the reservoir. When the evaluation result is 0.4 ≤ F < 0.6, it indicates weak gas channeling in the reservoir. When the evaluation result is 0.6 ≤ F < 0.8, it indicates strong gas channeling in the reservoir. When the evaluation result is 0.8 ≤ F ≤ 1.0, it indicates that gas injection has entered the complete gas channeling stage. The grading standards of gas channels are shown in Table 7.

3. Application Example

The H block features an upthrown nose structure shielded by a reverse normal fault, with the reservoir type being a structural–lithologic reservoir. The main fracture direction is N70°E, with an average fracture density of 0.25 fractures/m. Initially, the block was developed using water flooding. After entering a high water cut stage, CO2 injection development was implemented, followed by water-alternating-gas injection development. Currently, a 160 × 240 m infill five-spot well pattern is used for development. The oil layer in this block is buried at a depth of 2420 m, with an average permeability of 2–5 mD. The permeability ratio (maximum permeability over minimum permeability) ranges from 2.4 to 133.3, indicating strong heterogeneity. The block features complex injection–production layers, with more than ten auxiliary oil layers in addition to the main oil layer, making injection–production optimization and control challenging.
Due to the strong horizontal and vertical heterogeneity of the reservoir and the difficulty in controlling the injection–production layers, this block has low residual oil utilization, slow response to gas injection, prominent gas absorption in high-permeability layers, uneven areal sweep efficiency, a continuous increase in the number of high-yield gas wells, and serious gas channeling issues within well groups. Through fuzzy comprehensive evaluation, four well groups (H + 1, H + 2, H + 3, and H + 4) in this block were analyzed. The interconnection of injection–production wells was clarified, and the average permeability of the interconnected layers between the injection and production wells was calculated. The heterogeneity coefficient of permeability (maximum permeability over average permeability) and permeability ratio were used as indicators of reservoir horizontal and vertical heterogeneity, respectively. The start time of water-alternating-gas injection in the block was used as the dynamic parameter calculation starting point. Based on the oilfield data, the calculated geological static parameters and production dynamic parameters of the well groups are shown in Table 8 and Table 9.
After analyzing the data of the evaluation indicators of the well groups, boundary limits for the evaluation indicator membership degrees were determined to eliminate the impact of abnormally high or low indicator values within the well groups on the calculation results of the indicator membership degree. The boundary limits for each evaluation indicator are shown in Table 10.
Based on the boundary limits for evaluation indicators, the membership degree values were calculated using Equations (5) and (6). The fuzzy comprehensive evaluation results between injection and production wells within the well group were then calculated using Equation (8). The results and verification from the oilfield production data are shown in Table 11.
Jianbo Wang [35] analyzed the production characteristics of production wells at different stages during CO2 injection in low-permeability reservoirs. Injection–production wells at the strong gas channeling stage typically exhibit high and rapidly increasing cumulative gas production and maintain a high production gas–oil ratio in production dynamic curves. The accuracy of the result can be validated through analysis of the production dynamic curve. Taking the H + 2 well group as an example: The cumulative gas production and production gas–oil ratio of the H + 2 well group are shown in Figure 3. The H2 well has high cumulative gas production, with stable growth in cumulative gas production and a consistently high production gas–oil ratio. The fuzzy comprehensive evaluation indicates strong gas channeling. The H3 well has high cumulative gas production, with rapid growth in cumulative gas production and a fluctuating but high production gas–oil ratio. The fuzzy comprehensive evaluation indicates strong gas channeling. The H5 well has low cumulative gas production, with slow growth in cumulative gas production and a low production gas–oil ratio. The fuzzy comprehensive evaluation indicates weak gas channeling. The H6 well has high cumulative gas production, with rapid growth in cumulative gas production and a production gas–oil ratio comparable to the H2 and H3 wells, but the fuzzy comprehensive evaluation indicates weak gas channeling. The difference between the dynamic production data and the fuzzy comprehensive evaluation result is due to strong gas channeling from the injection in the H + 3 well, leading to high and rapidly increasing cumulative gas production and a relatively high gas–oil ratio in the H6 well. Comparing the results of the fuzzy comprehensive evaluation with the production dynamic curves of the well group, the degree of gas channeling development evaluated by the fuzzy comprehensive evaluation closely matches the shape of the dynamic production curves, demonstrating the high accuracy of the evaluation method.
The results of the fuzzy comprehensive evaluation indicate the degree of development of gas channeling pathways. According to Table 11, the H + 2 and H + 3 well groups have strongly developed gas channeling pathways and require blockage measures or optimization of injection and production parameters. The gas flooding situation in the H + 1 and H + 4 well groups is relatively stable, but some wells within these groups, like H2 and H3, have shown trends of developing strong gas channeling pathways. The distribution map of gas channeling pathways in the block is shown in Figure 4.
Using the fuzzy comprehensive evaluation method, further layer-by-layer analysis can be conducted on injection–production wells with strongly developed gas channeling pathways. Since the block uses generalized gas injection development, dynamic production data cannot be accurately segmented by layers. By calculating the static indicator values of the interconnection layers between the injection and production wells, and based on the fuzzy comprehensive evaluation method, the fuzzy comprehensive evaluation results for each layer can be obtained. The evaluation results can be used to assess the gas channeling situation of each layer, thereby providing guidance for implementing blockage and control adjustment measures in the block.
Taking the H6 well in the H + 3 well group as an example: The static index evaluation result is 0.565. The dynamic index evaluation result is 0.679. The comprehensive evaluation result is 0.64. This indicates a strongly developed gas channeling pathway. The perforation data of the H6 well can be used to obtain the interconnection layers between the injection and production wells. Based on data of the interconnection layers, the effective thickness, permeability, heterogeneity coefficient of permeability, and permeability ratio of each layer can be calculated. The static indicators and the calculated fuzzy comprehensive evaluation results for each layer of the H6 well in the H + 3 well group are shown in Table 12.
From the evaluation results of the layers in Table 12, it can be seen that Layer 2 and Layer 5 have lower evaluation results, indicating a lower probability of gas channeling. Layers 3 and 4 have higher evaluation results, indicating a higher probability of gas channeling. These layers should be prioritized for blockage. The results from the fuzzy comprehensive evaluation method can provide guidance for the oilfield to implement measures such as layer blockage and layered gas injection.

4. Conclusions

Through the analysis of the geological characteristics and gas injection development dynamics of low-permeability reservoirs, this study optimized the static and dynamic indicators for evaluating gas channeling pathways. The influence weight of each indicator on the development of gas channeling pathways was clarified, and a method for identifying gas channeling pathways in the gas injection development of low-permeability reservoirs based on the fuzzy comprehensive evaluation method was established. This method offers fast evaluation, a comprehensive index system, and high accuracy. It can provide an important basis for formulating measures to stabilize oil production and control gas production in gas-driven oil field development.
The understanding obtained from the fuzzy comprehensive evaluation method for gas channeling pathways in low-permeability reservoir gas injection development is as follows:
1. This paper established a fuzzy comprehensive evaluation method for identifying gas channeling pathways. This method is simple to apply and has a high evaluation accuracy rate. However, the selection of evaluation indicators, determination of the weight matrix, and selection of membership degree boundaries involve subjectivity. The evaluation results of the fuzzy comprehensive evaluation method are influenced by the analyst’s experience and understanding.
2. The application of the fuzzy comprehensive evaluation requires high-quality field data. The correctness and completeness of the data affect the calculation results of the membership degree of evaluation indicators, determining the accuracy of the judgment results of the fuzzy comprehensive evaluation method.
3. The evaluation results of the fuzzy comprehensive evaluation are values between 0 and 1. Based on the size of the evaluation values, five qualitative standards for the development of gas channeling pathways are divided. This method can only assess the degree of development of gas channeling pathways but cannot characterize the size of the gas channeling pathway or predict its formation. It is necessary to combine the fuzzy comprehensive evaluation method with other methods to comprehensively assess gas channeling pathways in gas injection development.

Author Contributions

Conceptualization, R.B. and M.H.; methodology, Y.L. and R.B.; validation, Y.L. and X.W.; investigation, C.B.; data curation, C.B.; writing—original draft preparation, Y.L.; writing—review and editing, M.H. and R.B. All authors have read and agreed to the published version of the manuscript.

Funding

This research received no external funding.

Data Availability Statement

Dataset available on request from the authors.

Conflicts of Interest

The authors declare no conflict of interest.

References

  1. Kang, W.-L.; Zhou, B.-B.; Issakhov, M.; Gabdullin, M. Advances in enhanced oil recovery technologies for low permeability reservoirs. Pet. Sci. 2022, 19, 1622–1640. [Google Scholar] [CrossRef]
  2. Shiyi, Y.; Qiang, W. New progress and prospect of oilfields development technologies in China. Pet. Explor. Prod. 2018, 45, 698–711. [Google Scholar]
  3. Hu, Y.; Hao, M.; Chen, G.; Sun, R.; Li, S. Technologies and practice of CO2 flooding and sequestration in China. Pet. Explor. Dev. 2019, 46, 753–766. [Google Scholar] [CrossRef]
  4. Yan, S.; Ma, D.; Li, J.; Zhao, T.; Ji, Z.; Han, H. Progress and prospects of carbon dioxide capture, EOR-utilization and storage industrialization. Pet. Explor. Prod. 2022, 49, 955–962. [Google Scholar] [CrossRef]
  5. Afzali, S.; Rezaei, N.; Zendehboudi, S. A comprehensive review on Enhanced Oil Recovery by Water Alternating Gas (WAG) injection. Fuel 2018, 227, 218–246. [Google Scholar] [CrossRef]
  6. Gbadamosi, A.O.; Kiwalabye, J.; Junin, R.; Augustine, A. A review of gas enhanced oil recovery schemes used in the North Sea. J. Pet. Explor. Prod. Technol. 2018, 8, 1373–1387. [Google Scholar] [CrossRef]
  7. Gao, Y.; Zhao, M.; Wang, J.; Zong, C. Performance and gas breakthrough during CO2 immiscible flooding in ultra-low permeability reservoirs. Pet. Explor. Dev. 2014, 41, 88–95. [Google Scholar] [CrossRef]
  8. Xu, T.; Wei, Y.; Ma, T. Experiment and Simulation of Gas Channeling Control Technique during CO2 Flooding in Normal Pressure Tight Oil Reservoir of South Ordos Basin. In Proceedings of the Abu Dhabi International Petroleum Exhibition & Conference, Abu Dhabi, United Arab Emirates, 9–12 November 2020. [Google Scholar]
  9. Rein, E.; Schulz, L.K. Applications of natural gas tracers in the detection of reservoir compartmentalisation and production monitoring. J. Pet. Sci. Eng. 2007, 58, 428–442. [Google Scholar] [CrossRef]
  10. Brigham, W.E.; Abbaszadeh-Dehghani, M. Tracer testing for reservoir description. Pet. Technol 1986, 1, 519–527. [Google Scholar] [CrossRef]
  11. Abbaszadeh-Dehghani, M.; Brigham, W.E. Analysis of Well-to-Well Tracer Flow to Determine Reservoir Layering. J. Pet. Technol. 1984, 36, 1753–1762. [Google Scholar] [CrossRef]
  12. Ren, B.; Ren, S.; Zhang, L.; Chen, G.; Zhang, H. Monitoring on CO2 migration in a tight oil reservoir during CCS-EOR in Jilin Oilfield China. Energy 2016, 98, 108–121. [Google Scholar] [CrossRef]
  13. Chen, M.; Tang, W.; Wang, L.; Sun, X.; Li, N.; Tan, J.; Zhang, W. Tracer Research Methods for Hydrocarbon Substances in Shale Oil Reservoirs. Chem. Technol. Fuels Oils 2024, 60, 197–206. [Google Scholar] [CrossRef]
  14. Du, D.; Hao, F.; Li, Y.; Li, D.; Tang, Y. Study on Interpretation Method of Multistage Fracture Tracer Flowback Curve in Tight Oil Reservoirs. ACS Omega 2024, 9, 11628–11636. [Google Scholar] [CrossRef]
  15. Albertoni, A.; Lake, L.W. Inferring Interwell Connectivity from Well-Rate Fluctuations in Waterfloods. In Proceedings of the SPE/DOE Thirteenth Symposium on Improved Oil Recovery, Tulsa, OK, USA, 13–17 April 2002. [Google Scholar]
  16. Zhang, X. Microscopic Characterization and Identification Criteria for Water Flow Dominance Channels. Inn. Mong. Petrochem. Ind. 2013, 16, 146–149. [Google Scholar]
  17. Jeong, J.; Park, E.; Emelyanova, I.; Pervukhina, M.; Esteban, L.; Yun, S.T. Interpreting the Subsurface Lithofacies at High Lithological Resolution by Integrating Information from Well-Log Data and Rock-Core Digital Images. J. Geophys. Res.-Solid Earth 2020, 125, e2019JB018204. [Google Scholar] [CrossRef]
  18. Mahdy, A.; Zakaria, W.; Helmi, A.; Helaly, A.S.; Mahmoud, A.M.E. Machine learning approach for core permeability prediction from well logs in Sandstone Reservoir, Mediterranean Sea, Egypt. J. Appl. Geophys. 2024, 220, 105249. [Google Scholar] [CrossRef]
  19. Lunny, C. Well Log Channel Matching. U.S. Patent 202017247580, 17 December 2020. [Google Scholar]
  20. Anees, A.; Shi, W.; Ashraf, U.; Xu, Q. Corrigendum to “Channel identification using 3D seismic attributes and well logging in lower Shihezi Formation of Hangjinqi area, northern Ordos Basin, China. J. Appl. Geophys. 2022, 197, 104554. [Google Scholar] [CrossRef]
  21. Sun, L.; Li, B.; Li, Y.; Jiao, Y. Method and device for identification of layer section with advantageous channel development based on logging curve. China. Patent 201811508998.0, 11 December 2018. [Google Scholar]
  22. Wood, D.A. Predicting Total Organic Carbon from Few Well Logs Aided by Well-Log Attributes; DWA Energy Limited: Lincoln, UK, 2023. [Google Scholar]
  23. Verma, S.; Yılmaz, E.Y.; Sanguino, L.O.; Yandell, J.; Henderson, M.; Trentham, R. Seismic attribute and well-log analysis for channel characterization in the upper San Andres and Grayburg formations of the Midland Basin, Texas. Energy Geosci. 2023, 5, 100188. [Google Scholar] [CrossRef]
  24. Feng, Q.; Wang, S.; Gao, G.; Li, C. A new approach to thief zone identification based on interference test. J. Pet. Sci. Eng. 2010, 75, 13–18. [Google Scholar] [CrossRef]
  25. Li, S. Investigation and Application of Integration Approaches for Thief Zone Identification. Master’s Thesis, China University of Petroleum (East China), Dongying, China, 2013. [Google Scholar]
  26. Izgec, B.; Chevron, S.; Kabir, C.S.; Hess, S. Identification and Characterization of High-Conductive Layers in Waterfloods. SPE Reserv. Eval. Eng. 2011, 14, 113–119. [Google Scholar] [CrossRef]
  27. Lei, X. Studying the Advantage Channels of Waterflooding Reservoir by Using Reservoir Engineering Methods. Master’s Thesis, China University of Petroleum, Beijing, China, 2018. [Google Scholar]
  28. Zheng, W.; Jiang, H.; Chen, M.; Zhang, F. Fuzzy comprehensive evaluation for injection-production effectiveness in medium-high water cut stage. In Proceedings of the 2011 Asia-Pacific Power and Energy Engineering Conference, Washington, DC, USA, 25–28 March 2011. [Google Scholar]
  29. Liu, H. Study on the Identification of Dominant Channel and Profile Control of CO2 Foam in 530 Well Area. Master’s Thesis, Southwest Petroleum University, Chengdu, China, 2019. [Google Scholar]
  30. Li, Y. Identification and Forewarning Method of Gas Channeling in Gas Injection Development of Clastic Reservoir. Master’s Thesis, China University of Petroleum (East China), Dongying, China, 2021. [Google Scholar]
  31. Klir, G.J.; Yuan, B. Fuzzy Sets, Fuzzy Logic, and Fuzzy Systems: Selected Papers by Lotfi A Zadeh; Advances in Fuzzy Systems-Applications and Theory; World Scientific: Singapore, 1996; p. 842. [Google Scholar]
  32. Lu, C.; Liu, H.; Pang, Z.; Dong, X.; Xiu, W. A new profile control design based on quantitative identification of steam breakthrough channel in heavy oil reservoirs (Article). J. Pet. Explor. Prod. Technol. 2014, 4, 17–35. [Google Scholar] [CrossRef]
  33. Lei, Z.; Qingdong, C. Study and application of identification method of channeling-path in the fractured ultra-low permeability reservoir. Drill. Prod. Technol. 2015, 38, 29–32+8. [Google Scholar]
  34. Kuenen, P.H.; Migliorini, C.I. Turbidity Currents as a Cause of Graded Bedding. J. Geol. 1950, 58, 91–127. [Google Scholar] [CrossRef]
  35. Wang, J.B.; Gao, Y.C.; Wang, K.Z. Law of gas breakthrough on CO2 flooding well in ultra-lower permeability reservoir of Yao Yingtai Oilfield. Fault-Block Oil Gas Field 2013, 20, 118–122. [Google Scholar]
  36. Saaty, T.L. Highlights and critical points in the theory and application of the Analytic Hierarchy Process. Eur. J. Oper. Res. 1994, 74, 426–447. [Google Scholar] [CrossRef]
Figure 1. Fuzzy comprehensive evaluation hierarchical structure.
Energies 17 03908 g001
Figure 2. Schematic diagram of trapezoidal membership functions.
Energies 17 03908 g002
Figure 3. The cumulative gas production and production gas–oil ratio of the H + 2 well group.
Energies 17 03908 g003
Figure 4. The distribution map of gas channeling pathways in the block.
Energies 17 03908 g004
Table 1. Scale values and their meanings in the nine-point scale method.
Scale ValueMeaning
1Equal importance
3Moderate importance
5Strong importance
7Very strong importance
9Extreme importance
2, 4, 6, 8Intermediate values between adjacent judgments
ReciprocalIf the judgment value for factor i relative to factor j is bij, then the judgment value for factor j relative to factor i is the reciprocal 1/bij
Table 2. Decision layer discrimination matrix.
Decision LayerStatic IndicatorsDynamic Indicators
Static Indicators11/2
Dynamic Indicators21
Table 3. Static indicators discrimination matrix.
Effective ThicknessPermeabilityPlanar
Heterogeneity
Vertical
Heterogeneity
AngleSedimentary Rhythm
Effective Thickness131/31/41/22
Permeability1/311/41/61/41/2
Planar Heterogeneity3511/224
Vertical Heterogeneity462135
Angle241/21/313
Sedimentary Rhythm1/221/41/21/31
Table 4. Dynamic indicators discrimination matrix.
Injection–Production Gas RatioProduction GORInjection WGRProduction GLRInjection
Intensity
Distance
Injection–Production Gas Ratio135342
Production GOR1/313121/2
Injection WGR1/51/311/31/21/4
Production GLR1/313121/2
Injection Intensity1/41/221/211/3
Distance1/224231
Table 5. Results of the weight calculations at each level.
Target LayerWeightCriterion LayerWeightEvaluation Layer
Gas Channeling Identification0.33Static Indicators0.101Effective Thickness
0.042Permeability
0.252Planar Heterogeneity
0.381Vertical Heterogeneity
0.160Angle
0.064Sedimentary Rhythm
0.67Dynamic Indicators0.364Injection–Production Gas Ratio
0.136Production GOR
0.051Injection WGR
0.136Production GLR
0.080Injection Intensity
0.232Distance
Table 6. Calculation functions for indicator membership degrees.
IndicatorMembership Function Type
Effective ThicknessSemi-ascending
PermeabilitySemi-ascending
Planar HeterogeneitySemi-ascending
Vertical HeterogeneitySemi-ascending
AngleSemi-descending
Injection–Production Gas RatioSemi-descending
Production GORSemi-ascending
Injection WGRSemi-descending
Production GLRSemi-ascending
Injection IntensitySemi-ascending
DistanceSemi-descending
Table 7. Grading standards for evaluation results.
Evaluation ResultDegree of Gas Channel Development
F < 0.25No obvious gas channeling
0.25 ≤ F < 0.4Slight gas channeling
0.4 ≤ F < 0.6Weak gas channeling
0.6 ≤ F < 0.8Strong gas channeling
0.8 ≤ F ≤ 1.0Complete gas channeling
Table 8. Geological static parameters of well groups.
Inj. WellProd. WellEff. Thickness (m)Perm. (mD)Heterogeneity Coeff. of Perm.Perm. RatioAngle (°)Sedimentary Rhythm
H + 1H15.002.1591.60134.86818Composite Rhythm
H210.353.0361.69534.86875
H35.751.5451.47634.86820
H413.852.9291.22134.86873
H + 2H27.703.0331.53345.27117Composite Rhythm
H54.851.8571.55045.27170
H64.553.9691.77645.27120
H36.001.5451.39145.27169
H + 3H37.502.5861.36863.82620Composite Rhythm
H610.054.7281.51563.82645
H78.304.9401.41463.82679
H + 4H46.553.0191.24526.46420Composite Rhythm
H36.552.4381.56726.46460
H74.954.4631.24026.46422
H87.104.6511.16526.46472
Table 9. Production dynamic parameters of well groups.
Inj. WellProd. WellInj.-Prod. Gas Ratio (m3/m3)Production GOR (m3/t)Injection WGR (t/m3 × 104)Production GLR (m3/t)Injection Intensity (m3/d/m)Distance (m)
H + 1H147.717713.4991.43357.63411.212266
H217.7732583.1871.433170.1459.868146
H313.2312261.2851.433148.78612.839202
H425.5391590.0931.433109.3496.772159
H + 2H212.8952583.1871.513170.1458.893158
H523.804528.9801.51381.2368.646258
H610.3312040.6381.513174.90411.111214
H39.6002261.2851.513148.78612.610143
H + 3H314.3952261.2851.324148.78611.385190
H615.4912040.6381.324174.9049.964162
H720.7131759.2761.324192.1759.822199
H + 4H427.5451590.0931.441109.34911.920206
H314.2702261.2851.441148.78613.794178
H720.5341759.2761.441192.17511.604280
H815.123891.8721.441150.44514.709154
Table 10. Boundary limits of membership degree for evaluation indicators.
IndicatorsBoundary Limits of Membership Degree
0(x − a)/(b − a) or (b − x)/(b − a)1
Effective Thickness (m)<1[1, 15]>15
Permeability (mD)<0.01[0.01, 5]>5
Heterogeneity Coeff. of Perm.<1[1, 5]>5
Permeability Ratio<10[10, 100]>100
Angle (°)>80[10, 80]<10
Sedimentary RhythmNormalComposite = 0.5Reverse
Inj.-Prod. Gas Ratio (m3/m3)>50[1, 50]<1
Production GOR (m3/t)<500[500, 2500]>2500
Injection WGR (t/m3 × 104)>2[0.01, 2]<0.01
Production GLR (m3/t)<25[25, 250]>250
Injection Intensity (m3/d/m)<2[2, 15]>15
Distance (m)>300[100, 300]<100
Table 11. Fuzzy comprehensive analysis results.
Inj. WellProd. WellStatic Indicators Evaluation
Results
Dynamic
Indicators
Evaluation
Results
Comprehensive
Evaluation Results
Gas Channeling LevelEvaluation
Results
Verification
H + 1H10.4800.1620.27SlightTrue
H20.4000.6870.59WeakTrue
H30.3170.6630.55WeakTrue
H40.3530.5150.46WeakTrue
H + 2H20.4190.7250.62StrongTrue
H50.3920.3330.35SlightTrue
H60.4450.6590.59WeakTrue
H30.3710.7550.63StrongTrue
H + 3H30.5040.6620.61StrongTrue
H60.5650.6790.64StrongTrue
H70.5380.5870.57WeakTrue
H + 4H40.2430.4770.40WeakTrue
H30.2920.6890.56WeakTrue
H70.2430.5030.42WeakTrue
H80.2480.6240.50WeakTrue
Table 12. Static indicators and fuzzy comprehensive evaluation results for each layer of the H6 well in the H + 3 well group.
Inj. WellProd. WellLayer No.Eff. Thickness (m)Perm. (mD)Heterogeneity Coeff. of Perm.Perm. RatioComprehensive Evaluation
Results
H + 3H612.905.7411.7232.0290.538
20.400.3481.3641.5520.178
33.555.0331.5774.7020.685
42.155.4941.2948.8790.632
51.051.0051.2391.4530.162
Disclaimer/Publisher’s Note: The statements, opinions and data contained in all publications are solely those of the individual author(s) and contributor(s) and not of MDPI and/or the editor(s). MDPI and/or the editor(s) disclaim responsibility for any injury to people or property resulting from any ideas, methods, instructions or products referred to in the content.

