Article

Factors Influencing the Energy Consumption in a Building: Comparative Study between Two Different Climates

by
Abdoul-Razak Ali-Tagba
1,2,
Mazabalo Baneto
1,2,* and
Dumitru Dorin Lucache
3
1
Centre d’Excellence Régional pour la Maîtrise de l’Electricité (CERME), Université de Lomé, 01BP1515 Lome, Togo
2
Département de Physique, Laboratoire sur l’Energie Solaire, Université de Lomé, 01BP1515 Lome, Togo
3
Faculty of Electrical Engineering, “Gheorghe Asachi” Technical University of Iaşi, 700050 Iasi, Romania
*
Author to whom correspondence should be addressed.
Energies 2024, 17(16), 4041; https://doi.org/10.3390/en17164041
Submission received: 16 May 2024 / Revised: 16 July 2024 / Accepted: 22 July 2024 / Published: 15 August 2024
(This article belongs to the Section G: Energy and Buildings)

Abstract

:
The design of a high energy performance building requires an assessment of the various design options. Energy simulation offers interesting possibilities for clarifying the architect’s decisions at this level, especially in the initial design phases where the greatest opportunities for optimization lie. The aim of this work is to develop an approach for the evaluation and optimal use of energy simulation in the building design phases. To do this, EnergyPlus building simulation software was used to simulate the energy consumption of the Faculty of Electrical Engineering building at “Gheorghe Asachi” Technical University in Iasi, in order to identify the factors influencing energy consumption in buildings. The results of this study show that an increase in the cooling setpoint temperature from 22 °C to 28 °C in the roof construction can reduce operating temperatures by 14.2% and 20.0%, respectively. This optimization could significantly reduce the hours of thermal discomfort, in a ratio of 6.0 and 3.25, respectively. Consequently, optimizing parameters linked to design and the heating and cooling systems within the building makes it possible to achieve energy savings and ensure thermal comfort in buildings.

1. Introduction

Environmentally friendly building architecture helps to minimize the impact of construction on the environment. This may include using sustainable materials, reducing construction waste, optimizing energy efficiency and minimizing greenhouse gas emissions. Technical and architectural choices impact not only the daily lives of users, but also the future of the planet: the building sector alone currently contributes 37% of greenhouse gas emissions linked to energy and operational processes and accounts for more than a fifth of global emissions [1].
In recent decades, mitigation measures have been gradually put in place to encourage the design of more eco-sensitive buildings, among other things in terms of energy efficiency. These measures have resulted in numerical objectives, marking the evolution of more ecological construction materials and more efficient systems. However, these have not yet been of much help in the search for an efficient architecture, which, according to studies by [2,3], is relative to the methods by which the building is designed.
Building with performance in mind requires a holistic approach, for which the energy question is important in this study. However, this approach is not always obvious if the design process is linear. The literature also mentions that it is possible to achieve substantial energy savings if the architect relies on passive strategies in his concept. Consideration of this aspect, according to studies by Optis et al. [4], is important, since a large part of energy consumption (nearly 65%) is in the operating phase. It is worth mentioning that, in mechanics, ASHRAE (American Society of Heating, Refrigerating and Air- Conditioning Engineers) constitutes a good database for engineers. However, ASHRAE needs to be improved concerning electrical and architectural design.
With this in mind, energy simulation offers interesting possibilities for clarifying the architect’s decisions and thus achieving performance objectives in terms of energy efficiency in buildings. Thus, in this work, the energy simulation software for buildings EnergyPlus was used to simulate the energy consumption of the Faculty of Electrical Engineering building at the “Gheorghe Asachi” Technical University of Iasi, in order to identify factors influencing energy consumption in buildings.
This study aims to identify the parameters influencing energy consumption and to develop a methodological approach to the problem of integrating energy simulation at the start of the process of design and then the use of the building, within the framework of an architecture targeting a passive strategy to achieve energy performance objectives. This will involve evaluating and maximizing the energy performance of a building by opting for passive approaches.

2. Materials and Methods

The objective of this work is to analyze the performance of a building of “Gheorghe Asachi” Technical University simulated through a space of complete parameters, by estimating the energy consumption of the space based on its design. Particular attention was paid to occupancy rate, electrical equipment and lighting, as these are the loads most controllable by residents. Below, the overall approach to the modeling process is described: the occupancy estimation tool, including data; ASHRAE standards [5]; the prototype-building model; and standards compliance using OpenStudio Standards.

2.1. Theoretical Approach

Figure 1 illustrates the energy optimization technique in the traditional mode presented in this work. This corresponds to the approach described in the literature [6,7], and to current practices deduced from case studies [8].
According to the architect’s code of practice, this process is divided into four main stages:
  • The site analysis study, which involves seeking the most economical option over the entire life cycle of the building;
  • The architectural model: This phase of the process addresses the architectural aspects, the identification of the key performance parameters which were considered in the energy simulation and the analysis of the barriers for which the simulation is still limited in the traditional design framework, in order to achieve performance;
  • The design of the architectural model: This phase consists of identifying the parameters which influence the performance of the building, such as the envelope, lighting, natural ventilation, heating and cooling equipment;
  • The development of the energy model, which concerns the definition of the thermal parameters of the building spaces, the setting of temperature and finally the evaluation of the energy performance of the HVAC equipment.
The first stages of the process (stages 1, 2 and 3) provide the framework for the study, as they offer the greatest potential for taking advantage of the site’s passive energies.
For each of these aspects, the relevant analysis methods and tools are used. Table 1 presents best practices from the literature, which are detailed in Section 2.1.1, Section 2.1.2, Section 2.1.3 and Section 2.1.4.

2.1.1. Site Analysis Phase

The analysis of the site, particularly its climatic conditions, allows the architect to modulate their concept according to the environment. Otherwise, this study aims to estimate the potential of the site in free energy and evaluate the comfort levels of the spaces according to the psychometric diagram [9].

Site Analysis Phase

This study includes a basic evaluation:
  • Air temperature and humidity using the psychometric diagram;
  • Solar gains and sky clearance levels for a rough estimate of daylight and solar heat gains;
  • Wind (speed and direction angles) for a natural ventilation analysis.

The Tools

In choosing the climate file, one that has approximately the same latitude and height as the site was selected. Also, climate files that cover only one year (test meteorological data for a reference year) were avoided, because they cannot represent the long-term meteorological situation [10,11]. The climate analysis was carried out using the Meteonorm tool presented in Table 2.

2.1.2. Form and Orientation Phase

Studying building options is an important step early in the design process. Architectural decisions at this level will influence the heating and cooling loads, daylighting and natural ventilation [12,13].
Figure 2 shows the building that was evaluated and which is located on the campus of “Gheorghe Asachi” Technical University. It was built in the early 80s and renovated very recently. The building studied in Figure 3 has a total surface area of 1795 m2 and is made up of a set of two buildings joined by corridors, one called Corp A (P + 2E) and the other called Corp B (P + 3E). The main facades of the two buildings face southwest. The building is a reinforced concrete frame structure, with lightweight concrete masonry walls. The upper slab is made of reinforced concrete and thermally insulated by a layer of stacked granulite 25 cm thick. The exterior walls are made of 110 mm double bricks with 50 mm cavities and 10 mm cement mortar on each side with a U-value of 1.46 W/m2·K. Figure 4 represents the architectural model that was created in SketchUp.

Study Parameters

Various parameters that affect the building’s consumption were studied to improve its design and increase its efficiency. Studies on the impact of certain architectural parameters, such as the shape of the building [14,15], the percentage of opening of the facades, colors and shading devices [16], as well as occupancy [17], showed that overall consumption and energy costs fluctuate significantly depending on these parameters.
At this phase of the process, the energy model will be based on approximations of the site’s climatic conditions and a limited amount of data such as geometries, building typology, total floor space and floor height, etc. HVAC systems and building materials are defined by default in the simulation tool (Figure 5).

The Tools

The tools presented in Table 3 are those commonly used in firms for the analysis of passive options. SketchUp is used in some architectural firms for orientation studies and mask effects. OpenStudio (SketchUp plug-in) (Figure 6) is a solution which first uses the architectural model of the building designed in SketchUp, then relies on EnergyPlus, which is a calculation engine, to evaluate the energy consumption of the building. Thus, it allows all architectural aspects to be evaluated for this phase. The calculation time is longer, compared to Ecotect. However, it has limits in terms of the analysis of options (volume, shape). The advantage of using the latter is that it allows immediate calculations from limited input data that are suitable criteria for rough sketch calculations.

2.1.3. Natural Lighting Phase

A good management of natural light offers the advantage of making substantial energy savings by reducing the need for artificial lighting and associated cooling loads [18,19]. This passive strategy requires a more sophisticated approach than simply purchasing windows with a high light transmittance. The integration of this component involves finding a balance between utilizing daylight, controlling glare and ensuring a uniform light distribution throughout the building.
In the simulation approach, the most adequate lighting performance measures for the climatic conditions of Iasi and Lomé were prioritized. This means that the decision is made to proceed either by the simplified static method, which consists of averaging the daylight factor, or by the dynamic method, which consists of visualizing the daily variations in natural lighting [20]. The first approach is often used by designers by referring to the minimum thresholds indicated by guides and directives. However, this method lacks precision, since it estimates illuminance levels under a single type of sky, while the sky model constantly varies depending on the climate. Therefore, it is advantageous to design this strategy based on dynamic methods to have precise results, predict artificial lighting consumption and have a better design [21].
In the second step, the type of sky most compatible with the meteorological conditions of each site was chosen. Although this step appears simple, it has a considerable impact on the precision of the results, and it is important to control it well. Depending on the performance indicator of the lighting strategy chosen, the type of spaces and lighting thresholds, as well as occupancy times, are also requirements for this study [22]. Based on all these data, a calculation of the lighting and/or luminance of the spaces will be carried out.

2.1.4. Building Envelope Phase

The envelope, including the external walls, roof and openings, often represents the greatest energy loss in the building; hence, depending on its characteristics, the heating and cooling needs will be more or less important.
The way in which the envelope affects the energy needs of the building is a question of playing on well-defined parameters: the level of insulation must be guaranteed at every point of the envelope by carefully avoiding thermal bridges (discontinuity in the insulating layer), because they cause significant thermal losses [23]. Significant thermal inertia avoids the risk of overheating and ensures a delay in heat input. When designing these parameters, the climate, the purpose of the building and the behavior of the occupants were taken into account.

Study Parameters

The energy performance of the envelope was evaluated according to three phenomena: limitation of heat flows, control of solar radiation and limitation of air leaks.
Table 4 presents the main parameters controlling these flows, which are resistance, tightness, quality of fenestration and thermal mass [24]. In the stages of the energy simulation of the building, the strategies associated with the structural parameters in order to improve their performance were considered.
In the energy model, these parameters are controlled by variables: the thermal mass is defined by a light, medium-heavy or heavy material. The resistance of the walls depends on the thickness, as well as the heat transmission coefficient. To effectively optimize the performance of the envelope, a parametric analysis of all its components was carried out, also considering the geometry and orientation of the building, the surface area of the glazing and the shading devices: These data were necessary so that the model could take into account solar gains and heat losses to predict the performance of the envelope.
This subsection provides an overview of the input ranges and weights that make up the parameter space for building the model and defining the internal environment of the building. To facilitate the energy audit of the building, the building was divided into ten specific zones (Figure 7) according to their utility within the building, while defining a specific thermal zone for each of the ten zones. Then, the indoor environment parameters were set. The indoor temperature is 18 °C and the feedback temperature is 12 °C in winter for the Iasi climate. The indoor temperature is 25 °C and the return temperature is 28 °C in summer for the tropical climate (in Lomé). The humidity control is between 10% and 90%. Then, the parameters associated with occupancy, lighting, schedule and electrical equipment were defined in OpenStudio based on real data from the university building [25]. The population density is 0.04 person/m2. The personnel coefficient is 0.9. The lighting power is 5 W/m2–100 lux. The power of the equipment is 3.58 W/m2. The schedule of the different rooms was defined according to the schedule of the teaching staff and students of the different spaces of the university building. Finally, the building envelope was adjusted to different conditions. The architectural model of the different spaces of the building is illustrated in Figure 7.

2.2. Proposed Evaluation Framework

The modeling process comprises three main stages, illustrated in Figure 8. A prototype model of the university building based on ASHRAE standards [5] is developed and adapted to the location, age and size of the building. This prototype model is then customized to represent each space, using data on geometry, envelope properties and internal loads. A series of HVAC system sizing tests are performed to ensure that the HVAC loads are estimated correctly based on the size of the building. An analysis of the HVAC system’s sizing and the operation of the internal loads is performed to ensure that the building model operates as intended.

2.2.1. Building Equipment

The data for lighting and equipment are determined from the building data, while assumptions for the equipment and operation of the heating, ventilation and air conditioning systems are derived from the standards.

Internal Loads

Electric lighting and electrical loads are treated separately. The occupancy density, expressed as the number of people per floor area, is calculated for university spaces. Additional controls related to internal loads and schedules have been applied during the analysis. The following checks have been performed on the internal parameters to ensure that the loads are reasonable and function as expected:
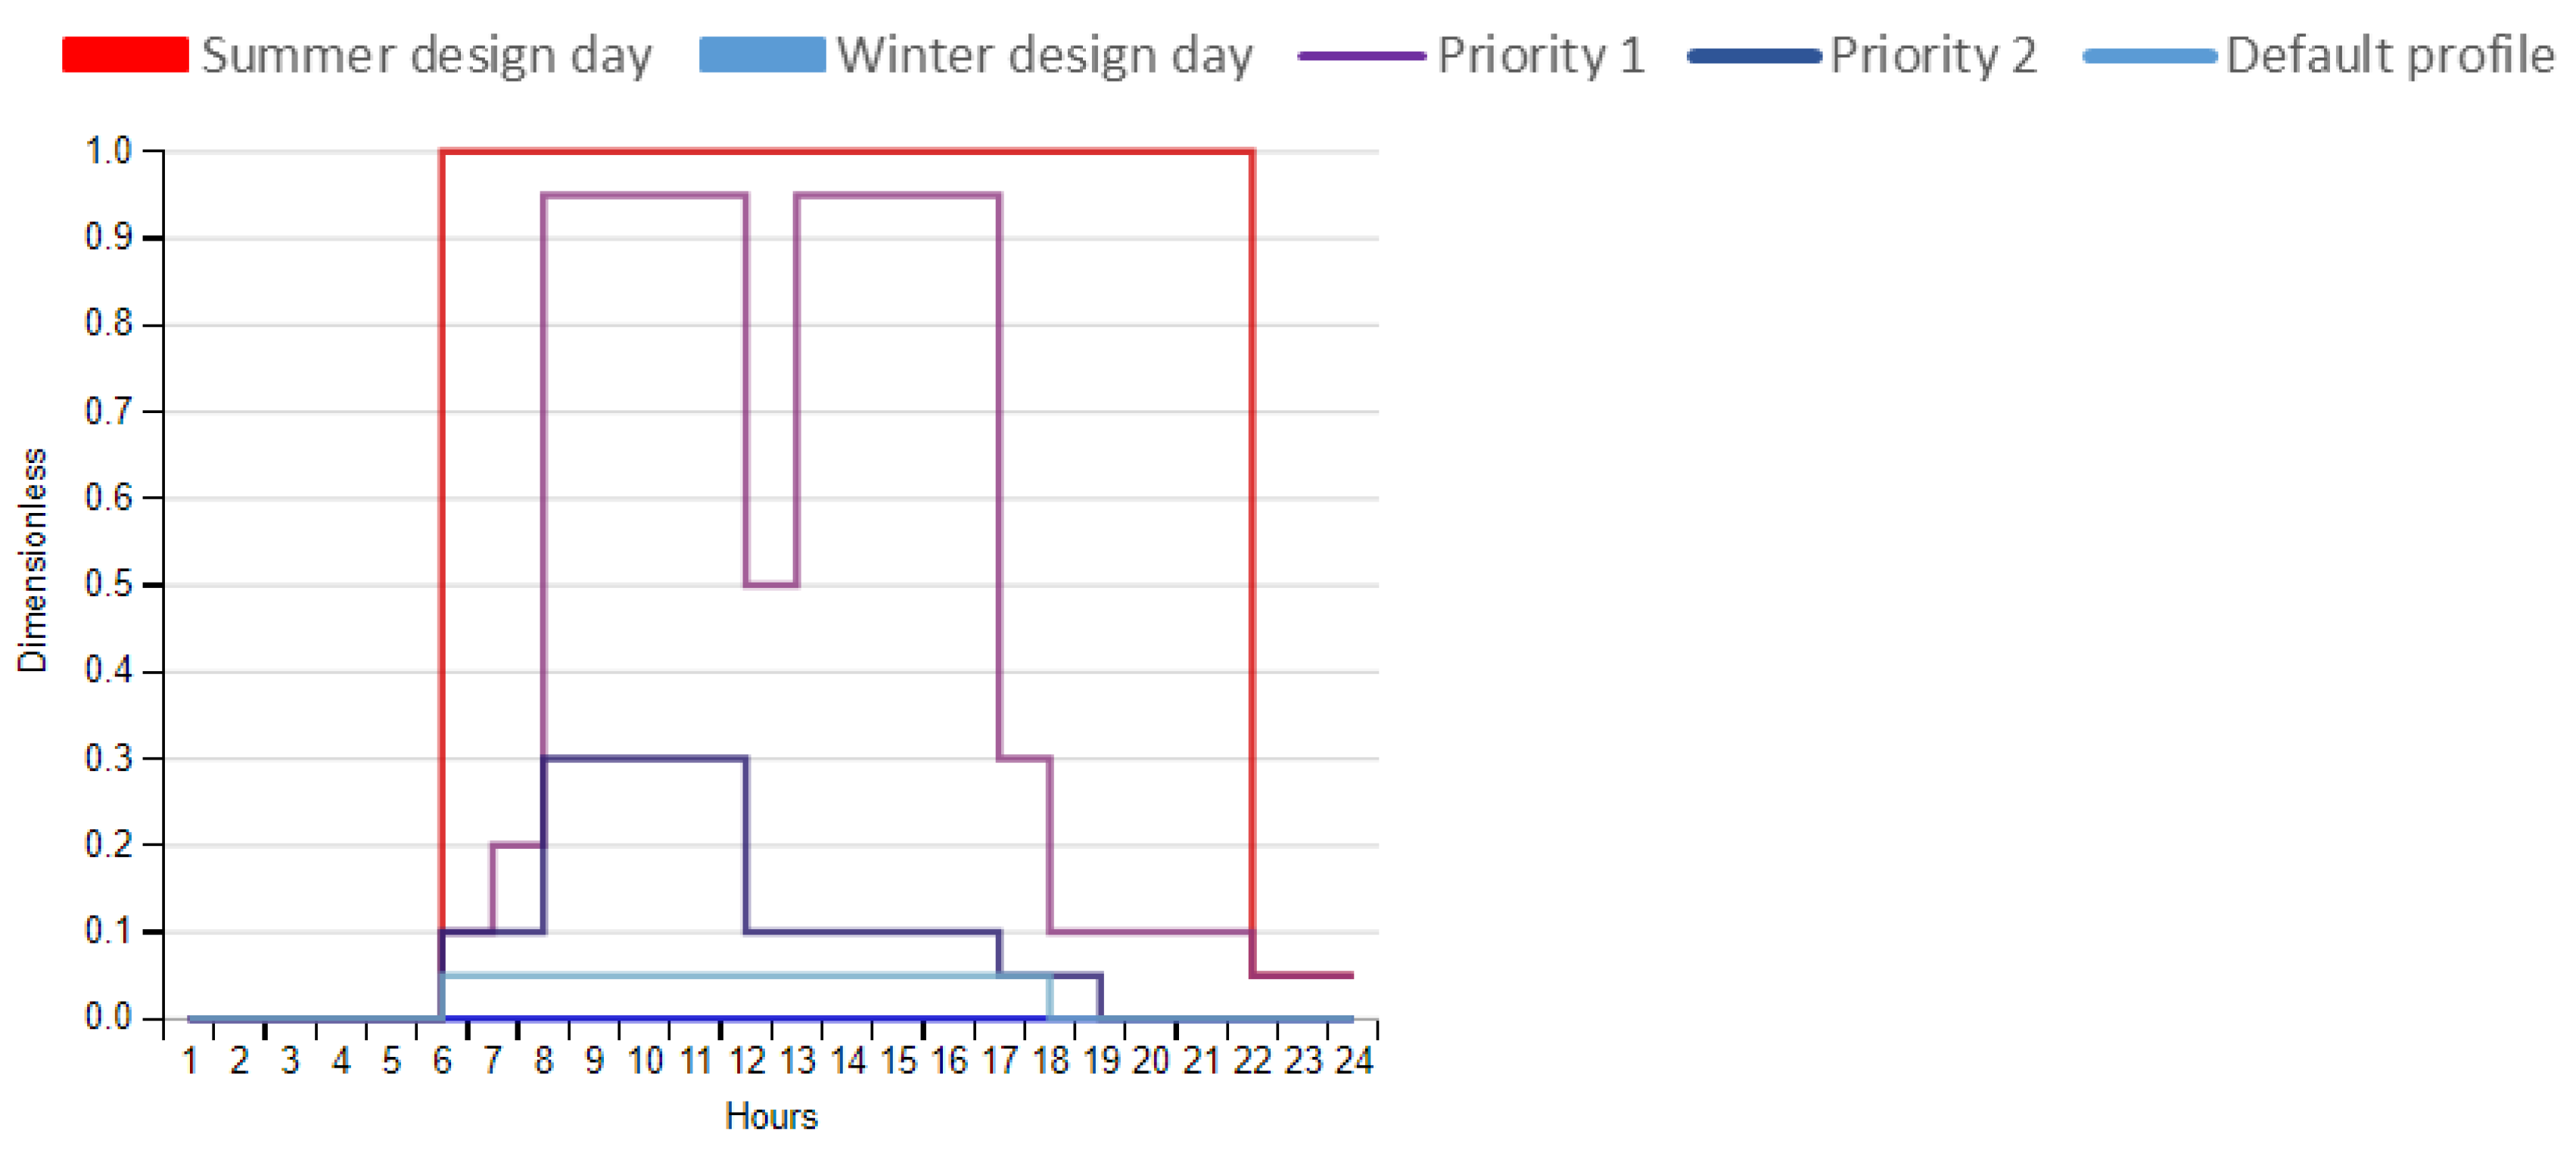
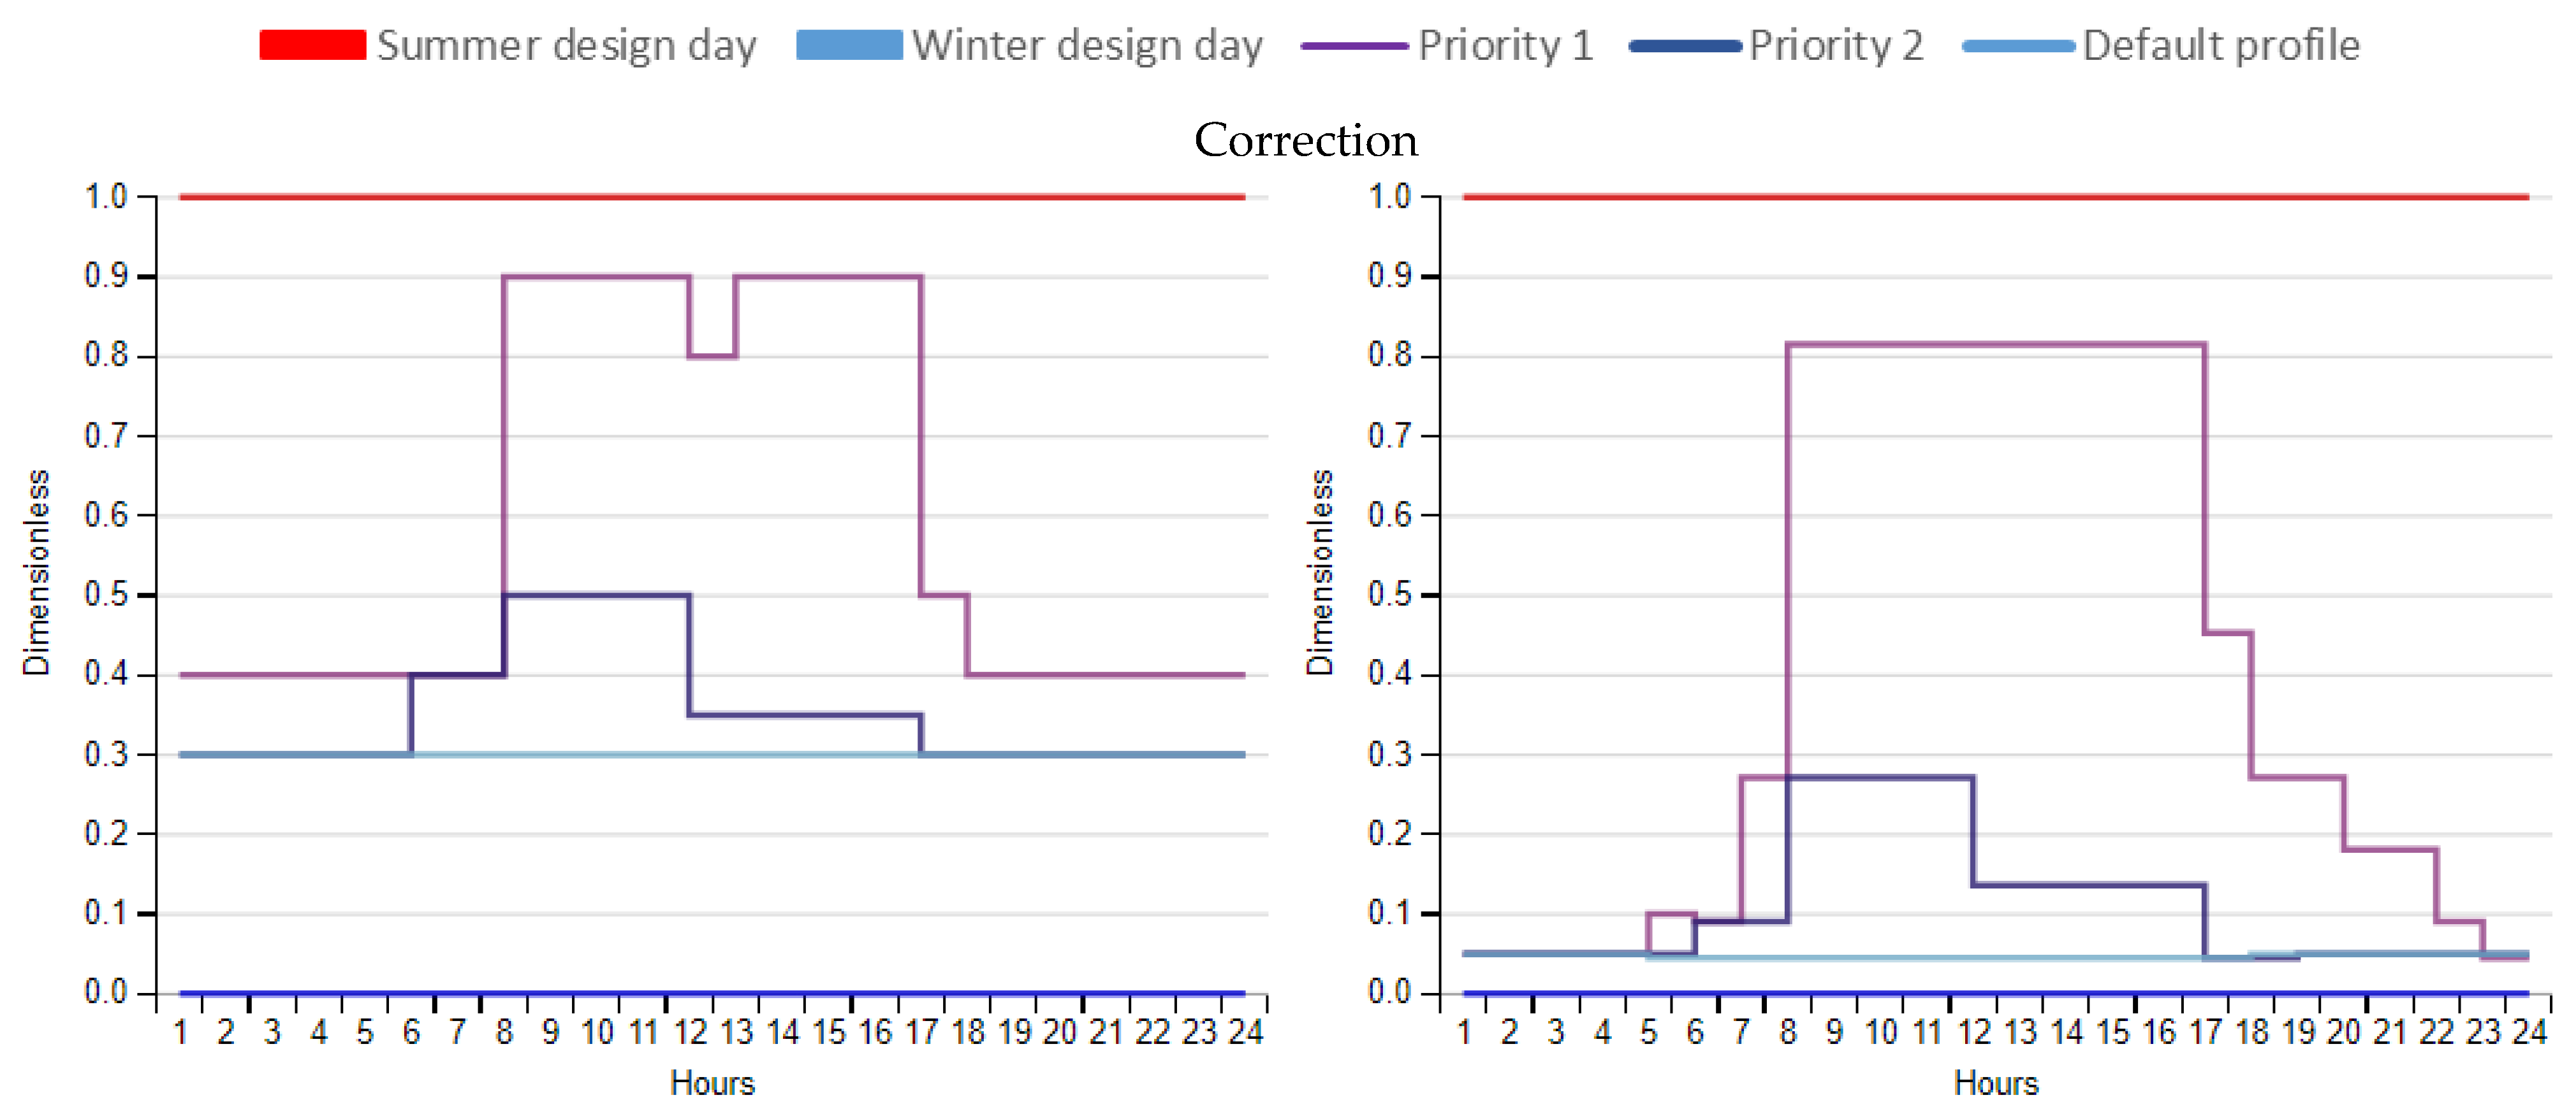
  • Facilities, lighting and occupancy follow schedules generated by the Create Parametric Schedules command in the OpenStudio software version 3.6.1. For a given number of operating hours per week, the measurement generates internal load schedules typical for an office and university space;
  • Equipment, lighting and occupancy programming is carried out for 24 h time slots; they are presented and discussed in the Section 3.

Plug and Process Loads

To estimate the outlet loads, occupant information was used to determine the power density of the equipment in each room of the building. For each type of space, the number of electrical equipment items set in the space is defined. The power of the equipment is estimated based on the number of residents. Equipment schedules are created based on the number of weekly operating hours.
The Equipment Power Density (EPD) was calculated using Equation (1). The annual energy consumption of the equipment in kBtu can then be calculated using the EPD, floor area and weekly operating hours. The annual site energy consumption can be accurately estimated using Equation (2). Equation (3) provides the annual energy consumption of the source in kBtu/ft2, which is calculated by multiplying the site energy by a conversion factor of 2.8 and dividing by the building area.
E P D W f t 2 = ( p e a k   p o w e r c o n v W × q u a n t i t y c o n v ) t e n a n t   f l o o r   a r e a   ( f t 2 )
T E C E = E P D W f t 2 × t e n a n t   f l o o r   a r e a   f t 2 × ( 2.59 + 0.0285 × h o u r s   p e r   w e e k + i f   h o u r s   p e r   w e e k > 60   t h e n   0.1 ,   e l s e   0 )

2.2.2. The Hypotheses

The main assumptions relate in particular to the presence of people and electrical equipment. Sizing checks were carried out to determine whether the selected HVAC systems could meet the thermal loads of the building spaces. Several hypotheses concerning the sizing of the systems were made and are summarized below:
  • For all models, the assumption of an unoccupied building (zero internal load) was used to size the HVAC systems, as engineers usually do. In practice, there is always a certain base load due to lighting and equipment. Therefore, sizing HVAC systems with a zero base load is a conservative approach and generally results in some oversizing.
  • Dimensioning factors of 1.25 for cooling and 1.15 for heating in OpenStudio were utilized. A factor greater than 1 provides an additional margin of safety for extreme weather conditions and unusually high loads.
  • A standard sizing routine for non-matching installations was used for all models. This means that sizing decisions for the sized HVAC systems are based on the total distributed loads of the area, regardless of when they occur. Coincidental design is the maximum sum of all loads at a given time, typically represented in design assuming a diversity factor of ~70% on the sum of non-coincidental loads. Inadequate sizing is another conservative approach that contributes to the oversizing of HVAC equipment. A system sizing analysis is performed by considering idle time, partial load factors and several other validation checks.
  • Validation: Checking the pressure losses of the fans, the HVAC systems of the building being equipped with a controller for the activation and deactivation of the system were verified, which made it possible to carry out control tests on the economizers installed in the operation heating and cooling loads, and to check the energy consumption of the heating, ventilation and air conditioning systems as a function of temperature and their influences. Thus, the HVAC energy consumption was estimated as a function of temperature: to ensure that the HVAC systems worked as expected and reacted correctly to the outside temperature of the two climate zones (Figure 9 and Figure 10), the energy consumption HVAC versus outdoor air-dry bulb temperature was tracked for each climate zone and HVAC system type. The results obtained after the simulation were compared with the energy balances of the building over the last three years.

3. Results and Discussion

An energy consumption analysis was carried out on the building structure. For this model, two energy sources were introduced in the case of the building in Iasi. The structure of the primary energy source is closely related to the type of heating/cooling system in this case. For the Lome city model, the building has only one source for cooling throughout the year. The diagrams shown in Figure 9 and Figure 10 allow you to visualize at a glance the energy consumption data from the primary energy source for both climate zones. These are categorized according to the energy demand and activity of each space in the building.
Thanks to the assumptions on these systems, the HVAC energy consumption was estimated as a function of temperature. Figure 11 shows the building in Iasi, Romania, with a VAV (Variable Air Volume) ventilation system to independently regulate the air flow and ventilation parameters in each room of the building. The heating energy far exceeds cooling in a cold climate like Iasi, which is normal. On the other hand, Figure 12 shows the building in Lomé, Togo, with a PVAV system with PFP boxes (electric cooling, electric heating). The calculations show that the impact of warming on annual HVAC energy (reduction or increase) depends significantly on the climate category. This aligns with the work of Kharseh et al. [26], who demonstrated that the variation in annual HVAC systems energy depends on the climate, varying from cold to hot climates. In mild climates, such as Lome, it has been shown that warming does not significantly impact on the annual energy of HVAC systems. Improving building design parameters can mitigate the impact of warming. The histograms presented in Figure 11 and Figure 12 show the demands of the HVAC systems and the temperature required to achieve thermal comfort.
Tests on the ventilation rate and the infiltration effect of the building were carried out. The results showed that they have a significant impact on the thermal comfort of students and the energy consumption of the building, which is in agreement with the results of previous studies [27,28]. One of the primary causes of infiltration was the difference in atmospheric pressure across the building envelope. This is due to differences in indoor and outdoor air temperatures (stack effect), the operation of the mechanical ventilation system and wind movement [29,30]. Ventilation and infiltration rates affect the heating/cooling load, as well as indoor air temperature and indoor air humidity levels in buildings [31,32]. The infiltration rate is affected by exterior environmental variables, architecture, building age and construction materials. It should be noted that closing air leakage cracks can reduce the energy consumption of the building by reducing the infiltration rate [33].
In this study, sensitivity analyses revealed that the mechanical ventilation rate per zone positively influences both the thermal discomfort of students and the building’s energy consumption. Increased ventilation rates lead to lower air and operating temperatures, which can contribute to thermal discomfort. The optimal energy consumption was achieved with a zone mechanical ventilation rate of six, while the lowest hours of thermal discomfort were observed with a rate of zero. These results are in agreement with the work of A. Franco et al. and of R. Maddaa-lena et al. [34,35]. Conversely, a study by Scherer et al. [36] highlights that inadequate ventilation rates result in thermal discomfort and excessive energy consumption. Current thermal comfort regulations concerning Indoor Air Quality (IAQ) are not universally defined, leading to varied minimum ventilation rates for similar buildings across different countries [37]. This variation explains the inverse relationship between mechanical ventilation rates and thermal comfort, which subsequently affects the building’s energy consumption.
Understanding a building’s HVAC system can be complex and often inaccessible to occupants, limiting their detailed knowledge of its operation. Therefore predetermined HVAC systems in OpenStudio are assigned based on building size, following the guidelines in Appendix G of ASHRAE 90.1 [38]. This approach streamlines building modeling and reduces complexity. However, analyzing HVAC energy consumption for individual spaces within a larger building system presents additional challenges due to uncertainties associated with HVAC systems. Due to the uncertainties associated with HVAC systems, the online tool provides a range for annual HVAC energy consumption.
Figure 13 and Figure 14, respectively, show the occupancy schedule and lighting and occupancy programming for 24 h time slots. Reasonable internal loads and time slots operating as expected could be achieved. Figure 13 shows the parametric occupancy schedule for a work week. This schedule assumes shortened work days from Monday to Friday and low occupancy on Saturday and Sunday. Figure 14 outlines the lighting schedule for weekdays, with minimal usage during weekends. Overall, weekend energy consumption remains notably lower than on weekdays.
The definition of interior lighting was made by considering the luminous flux received per unit area depending on the type of space in the building, with an estimate of approximately 5 W/m2. The model has been equipped with standard equipment to ensure the proper functioning of various space types, including electrical equipment offices, laboratories, and classrooms in accordance with their installation.
Following the hypothesis applied to the model, it was observed that the climatic conditions experienced by the building have a significant impact on heating and cooling needs and on the evolution of the overall electrical consumption of the building (see Figure 11 and Figure 12). As a result, this affects the energy performance of the building. Figure 15 shows that the city of Iasi has a percentage of energy demand and expenditure that fluctuates depending on the winter and summer seasons.
On the other hand, when the model is subject to the climatic constraints of the city of Lomé (Figure 16), a trend reversal of the energy needs of buildings is observed in terms of comfort and the use of electrical equipment. This means that in the case of Lomé, electrical equipment requires much more power to operate optimally than in the case of Iasi. Indeed, in the case of the city of Lomé, electrical appliances are constantly exposed to heat, and thermal conditions are unfavorable for the proper functioning of electrical appliances, which leads to poor performance and the reduced efficiency of the equipment. The energy expenditure linked to HVAC systems is higher in the city of Iasi than that of Lomé, with a difference of 20% for the same electrical equipment used.
Technical and electrical equipment contributes significantly to the overall environmental impacts of the building. These results are in agreement with the work of Hoxha et al. [39], who showed the impact of technical and electrical equipment in a building and recommended including impacts linked to technical and electrical equipment through detailed calculations from the phase of building design.
An analysis of factors influencing energy consumption by region was conducted. In this study, data were collected from meteorological files and design days for each climatic zone. As with Shiker et al. [40], a correlation analysis (Pearson’s correlation coefficient) was used to evaluate the degree of correlation between the influencing factors and the intensity of total energy consumption, as well as the intensity of energy consumption of the HVAC system. The Pearson correlation coefficient is the covariance of two variables divided by the product of their standard deviations. The Pearson correlation coefficient is determined by Equation (3):
ρ = C o v x , y D x D y
The value of ρ ranges from −1 to 1, where 1 indicates a positive linear correlation, while −1 indicates a negative correlation. A statistical test is then implemented to determine whether the correlation is significant. The relationship between lighting and energy consumption was calculated using Equation (3), resulting in a value of 0.775. This value, being close to 1, indicates a strong influence of the number of openings, the location of windows and shading devices on the interior lighting level of the building. Indeed, all orientations provide natural lighting, but it is, however, preferable to place the openings in such a way that the sun can penetrate inside the room when it is most used. In addition, natural light varies depending on the orientation of the building. This result is in agreement with the work of Piotrowska et al. [41], who reduced the energy consumption of a university building by automatically controlling lighting based on the amount of sunlight entering the rooms.
Furthermore, Figure 11 and Figure 12 show that the power requested by HVAC systems changes with the set temperature. The analysis of the energy consumption intensities of HVAC systems shows that it directly depends on the level of occupancy and the surrounding weather conditions. Hussin et al. [42] studied the correlation coefficient of influencing factors and found that the coefficient of heat sources was higher than those of cooling sources in an academic building. These test results are consistent with the results obtained in the present work. On the other hand, Figure 15 and Figure 16 show that the evolution of energy consumption is mainly explained by the local climatic conditions to which the building is exposed in each zone. Figure 14 outlines the lighting schedule for weekdays, with minimal usage during weekends. Overall, weekend energy consumption remains notably lower than on weekdays. To obtain a more precise estimate of the annual energy consumption of the HVAC, a measurement carrying out a sizing cycle for the entire building was carried out, and the efficiency value of the system was extracted to replace the efficiency in the building space design cycle. However, a limitation of this approach is potential discrepancies in part-load operation between individual spaces and the entire building.
Compared to the relationship between occupancy and electrical energy consumption, following monthly consumption peaks and using equation 4, the strength of the relationship between occupancy and energy consumption is 0.870, which indicates a strong positive correlation for this factor. The influence of this factor is significant regardless of the two climatic zones (see Figure 14). Ambient heat tends to increase the power required by air conditioners to maintain a cool temperature in the space, and vice versa for heating units during winter. However, regardless of the configuration of the HVAC system in the building, when it operates at a constant regime, its energy consumption is reduced. This is in good correlation with the results obtained by Solano et al. [43], where it is found that maintaining a constant mode satisfies over 80% of potential occupants with interior temperatures more than 90% of the time.
In this model, spaces covering a large surface area are those that consume the most energy. Part of this energy expenditure is due to the artificial lighting systems installed. But the vast majority of consumption is due to the use of equipment by the occupants of these spaces. The simulations that were carried out in the two areas show that 75.6% of the overall variation in energy consumption is directly linked to the occupation of the building spaces. Note that for a fixed building, the performance of its envelope structure is fixed, but not the behavior of its occupants. Zhang et al. [44] proposed new parameters to build correlation models between energy consumption and user behavior to predict energy consumption in academic buildings. They were able to predict the evolution of consumption based on the behavior of the occupants. The evolution of energy consumption is directly linked to the behavior of occupants regarding the use and management of this energy.
With the electrical equipment used, the evolution of consumption is fundamentally driven by the commissions and adjustments made by the occupants, which are linked to their behavior. An analysis of the results revealed that 70% of the total variation in energy consumption was due to the equipment used in the building. This is again in line with the value of 68.4% reported by Hussin et al. [42], who used the Pearson correlation coefficient to measure the impact of the use of electrical appliances on the energy consumption of a university building.
In both climatic environments, power demand varies throughout the day and across seasons, with variations of 20% for equipment and almost 30.76% for HVAC systems. A comparative analysis of the results of the two case studies leads to the same conclusion. This means that in most cases, the parameters affecting the building’s consumption are more linked to the discomfort felt by the occupants. Alghamdi et al. [45] showed in a study that correctly determining the set temperature of an HVAC system can significantly reduce operating temperatures. These reductions can result in a significant reduction in heat discomfort and improve energy efficiency.

4. Conclusions

In the context of a shortage of fossil resources and high energy needs, buildings constitute potential sources of energy savings, particularly with heating and lighting systems. Hence the importance of identifying them and finding solutions to optimize consumption and reduce bills. This work contributes to the advancement of knowledge by proposing evaluation and optimization methods for integration into the energy simulation of a building. In this work, the study was aimed at university architecture, relying on passive strategies in order to achieve performance objectives.
Thus, an evaluation of HVAC systems, occupancy, thermal comfort and energy consumption was carried out using simulation software, in order to identify the parameters of greatest concern and to show their real impacts in a university building placed in two different climatic conditions. From the analysis, several conclusions emerged: the simulation results identified the parameters that influence consumption and showed significant potential for optimizing these parameters within the building, in order to achieve energy savings and thermal comfort in educational buildings.
Parametric and sensitivity analyses revealed a strong correlation between student occupancy hours and the building’s cooling/heating load. Adjustments to cooling and heating setpoint temperatures, along with roof construction details, significantly influenced these design parameters’ sensitivity, impacting both energy consumption and student comfort.
Increasing the cooling setpoint temperature from 22 °C to 28 °C in roof construction can reduce operating temperatures by 14.2% and 20.0%, respectively. This optimization could significantly reduce the hours of thermal discomfort, in a ratio of 6.0 and 3.25, respectively.
This study offers actionable insights for architectural design teams, facilitating informed decisions on prioritizing sensitive building parameters based on simulation outcomes.

Author Contributions

Conceptualization, A.-R.A.-T. and M.B.; methodology, A.-R.A.-T. and M.B.; software, A.-R.A.-T.; validation, A.-R.A.-T., M.B. and D.D.L.; formal analysis, A.-R.A.-T.; investigation, A.-R.A.-T.; resources, M.B.; data curation, D.D.L.; writing—original draft preparation, A.-R.A.-T.; writing—review and editing, M.B. and D.D.L.; visualization, A.-R.A.-T.; supervision, M.B. and D.D.L.; project administration, M.B. All authors have read and agreed to the published version of the manuscript.

Funding

This research received no external funding And The APC was funded by Centre d’Excellence Régional pour la Maitrise de l’Electricité (CERME).

Data Availability Statement

The data presented in this study are available on request from the corresponding author. The data are not publicly available due to the fact that these data belong to “Gheorghe Asachi” Technical University.

Acknowledgments

The authors thank the AUF through the “Eugen Ionescu” Mobility Program, which allowed them to carry out a research stay at the “Gheorghe Asachi” Technical University in Iasi (Romania).

Conflicts of Interest

The authors declare no conflict of interest.

References

  1. UN Environment. Les Émissions du Secteur Mondial du Bâtiment Restent Élevées et Continuent d’Augmenter. Available online: http://www.unep.org/fr/actualites-et-recits/communique-de-presse/les-emissions-du-secteur-mondial-du-batiment-restent (accessed on 8 June 2024).
  2. Bozonnet, E.; Jolas, C.; Le Dréau, J. BIM et conception intégrée—Interopérabilité et optimisation de la performance environnementale. Tech. Ing. 2018. [Google Scholar] [CrossRef]
  3. Reed, B. The Integrative Design Guide to Green Building: Redefining the Practice of Sustainability; John Wiley & Sons: Hoboken, NJ, USA, 2009. [Google Scholar]
  4. Optis, M.; Wild, P. Inadequate documentation in published life cycle energy reports on buildings. Int. J. Life Cycle Assess. 2010, 7, 644–651. [Google Scholar] [CrossRef]
  5. Vaughn, M. ASHRAE Research Report. ASHRAE J. 2016, 58, 81–91. [Google Scholar]
  6. Imrie, R.; Street, E. Architectural Design and Regulation; John Wiley & Sons: Hoboken, NJ, USA, 2011. [Google Scholar] [CrossRef]
  7. Aydemir, A.; Jacoby, S. Architectural design research: Drivers of practice. Des. J. 2022, 25, 657–674. [Google Scholar] [CrossRef]
  8. Aburamadan, R.; Trillo, C. Applying design science approach to architectural design development. Front. Archit. Res. 2020, 9, 216–235. [Google Scholar] [CrossRef]
  9. Bambardekar, S.; Poerschke, U. The Architect as Performer of Energy Simulation in The early Design Stage. 2009. Available online: https://www.aivc.org/resource/architect-performer-energy-simulation-early-design-stage (accessed on 8 June 2024).
  10. Crawley, D.B. Which weather data should you use for energy simulations of commercial buildings? Trans.-Am. Soc. Heat. Refrig. Air Cond. Eng. 1998, 104, 498–515. [Google Scholar]
  11. Giama, E.; Chantzis, G.; Kontos, S.; Keppas, S.; Poupkou, A.; Liora, N.; Melas, D. Building Energy Simulations Based on Weather Forecast Meteorological Model: The Case of an Institutional Building in Greece. Energies 2023, 16, 191. [Google Scholar] [CrossRef]
  12. Alghamdi, S.; Tang, W.; Kanjanabootra, S.; Alterman, D. Optimal configuration of architectural building design parameters for higher educational buildings. Energy Rep. 2023, 10, 1925–1942. [Google Scholar] [CrossRef]
  13. Latha, H.; Patil, S.; Kini, P.G. Influence of architectural space layout and building perimeter on the energy performance of buildings: A systematic literature review. Int. J. Energy Environ. Eng. 2023, 14, 431–474. [Google Scholar] [CrossRef]
  14. Yildirim, M.; Gocer, O.; Globa, A.; Brambilla, A. Investigating restorative effects of biophilic design in workplaces: A systematic review. Intell. Build. Int. 2023, 15, 205–247. [Google Scholar] [CrossRef]
  15. Gassar, A.A.A.; Koo, C.; Kim, T.W.; Cha, S.H. Performance Optimization Studies on Heating, Cooling and Lighting Energy Systems of Buildings during the Design Stage: A Review. Sustainability 2021, 13, 9815. [Google Scholar] [CrossRef]
  16. Mangkuto, R.A.; Koerniawan, M.D.; Apriliyanthi, S.R.; Lubis, I.H.; Atthaillah; Hensen, J.L.M.; Paramita, B. Design Optimisation of Fixed and Adaptive Shading Devices on Four Façade Orientations of a High-Rise Office Building in the Tropics. Buildings 2022, 12, 25. [Google Scholar] [CrossRef]
  17. de Meester, T.; Marique, A.-F.; De Herde, A.; Reiter, S. Impacts of occupant behaviours on residential heating consumption for detached houses in a temperate climate in the northern part of Europe. Energy Build. 2013, 57, 313–323. [Google Scholar] [CrossRef]
  18. Mbadinga, D.; Alibaba, H. Improvement of Thermal Efficiency Through Natural Lighting: Energy Saving. 2019, p. 5. Available online: https://www.researchgate.net/profile/Halil-Alibaba/publication/338188729_Improvement_of_Thermal_Efficiency_Through_Natural_Lighting_Energy_Saving/links/5e05e07f4585159aa49d892c/Improvement-of-Thermal-Efficiency-Through-Natural-Lighting-Energy-Saving.pdf (accessed on 1 January 2019).
  19. Bashir, F.M.; Dodo, Y.A.; Mohamed, M.A.S.; Norwawi, N.M.; Shannan, N.M.; Afghan, A.A. Effects of natural light on improving the lighting and energy efficiency of buildings: Toward low energy consumption and CO2 emission. Int. J. Low-Carbon Technol. 2024, 19, 296–305. [Google Scholar] [CrossRef]
  20. Ibarra, D.I.; Reinhart, C.F. Daylight Factor Simulations—How Close Do Simulation Beginners ‘Really’ Get? June 2009. Available online: https://www.aivc.org/resource/daylight-factor-simulations-how-close-do-simulation-beginners-really-get (accessed on 13 May 2024).
  21. Lamberts, R.; Hensen, J.L. Building Performance Simulation for Design and Operation; Spoon Press: London, UK, 2011. [Google Scholar]
  22. Ezeh, C.I.; Hong, Y.; Deng, W.; Zhao, H. High rise office building makeovers—Exploiting architectural and engineering factors in designing sustainable buildings in different climate zones. Energy Rep. 2022, 8, 6396–6410. [Google Scholar] [CrossRef]
  23. Stagrum, A.E.; Andenæs, E.; Kvande, T.; Lohne, J. Climate Change Adaptation Measures for Buildings—A Scoping Review. Sustainability 2020, 12, 1721. [Google Scholar] [CrossRef]
  24. Motawa, I.; Elsheikh, A.; Diab, E. Energy Performance Analysis of Building Envelopes. J. Eng. Proj. Prod. Manag. 2021, 11, 196–206. [Google Scholar] [CrossRef]
  25. De Dear, R. Recent enhancements to the adaptive comfort standard in ASHRAE 55-2010. In Proceedings of the 45th annual conference of the Architectural Science Association, Sydney, Australia, 14–16 November 2011; Citeseer: University Park, PA, USA, 2011; pp. 16–19. [Google Scholar]
  26. Kharseh, M.; Altorkmany, L.; Al-Khawaj, M.; Hassani, F. Warming impact on energy use of HVAC system in buildings of different thermal qualities and in different climates. Energy Convers. Manag. 2014, 81, 106–111. [Google Scholar] [CrossRef]
  27. Kükrer, E.; Eskin, N. Effect of design and operational strategies on thermal comfort and productivity in a multipurpose school building. J. Build. Eng. 2021, 44, 102697. [Google Scholar] [CrossRef]
  28. Moret Rodrigues, A.; Santos, M.; Gomes, M.G.; Duarte, R. Impact of Natural Ventilation on the Thermal and Energy Performance of Buildings in a Mediterranean Climate. Buildings 2019, 9, 123. [Google Scholar] [CrossRef]
  29. Sfakianaki, A.; Pavlou, K.; Santamouris, M.; Livada, I.; Assimakopoulos, M.-N.; Mantas, P.; Christakopoulos, A. Air tightness measurements of residential houses in Athens, Greece. Build. Environ. 2008, 43, 398–405. [Google Scholar] [CrossRef]
  30. Caruggi de Faria, L.; Roméro, M.; Porras-Amores, C.; Pirro, L.; Sáez, P. Prediction of the Impact of Air Speed Produced by a Mechanical Fan and Operative Temperature on the Thermal Sensation. Buildings 2022, 12, 101. [Google Scholar] [CrossRef]
  31. Anand, V.; Kadiri, V.L.; Putcha, C. Passive buildings: A state-of-the-art review. J. Infrastruct. Preserv. Resil. 2023, 4, 3. [Google Scholar] [CrossRef] [PubMed]
  32. Sadineni, S.B.; Madala, S.; Boehm, R.F. Passive building energy savings: A review of building envelope components. Renew. Sustain. Energy Rev. 2011, 15, 3617–3631. [Google Scholar] [CrossRef]
  33. Kent, R. Energy Management in Plastics Processing: Strategies, Targets, Techniques, and Tools; Elsevier: Amsterdam, The Netherlands, 2018. [Google Scholar]
  34. Franco, A.; Schito, E. Definition of Optimal Ventilation Rates for Balancing Comfort and Energy Use in Indoor Spaces Using CO2 Concentration Data. Buildings 2020, 10, 135. [Google Scholar] [CrossRef]
  35. Maddalena, R.; Mendell, M.J.; Eliseeva, K.; Chan, W.R.; Sullivan, D.P.; Russell, M.; Satish, U.; Fisk, W.J. Effects of ventilation rate per person and per floor area on perceived air quality, sick building syndrome symptoms, and decision-making. Indoor Air 2015, 25, 362–370. [Google Scholar] [CrossRef] [PubMed]
  36. Scherer, P.; de Fauro, D.O.; de Grigoletti, G.C.; Scherer, P.; Fauro, D.d.O.; Grigoletti, G.d.C. Energy Efficiency, Thermal Comfort, and Quality of Natural Ventilation Strategies for Classrooms. In Cooling Technologies—Technologies and Systems to Guarantee Thermal Comfort in Efficient Buildings; IntechOpen: Rijeka, Croatia, 2023; ISBN 978-1-83769-582-9. [Google Scholar]
  37. Wouters, P.; Delmotte, C.; Faÿsse, J.-C.; Barles, P.; Bulsing, P.; Filleux, C.; Hardegger, P.; Blomsterberg, Å.; Pennycook, K.; Jackman, P.; et al. Towards improved performances of mechanical ventilation systems. Tip-Vent Proj. EC Joule 2001, 58. [Google Scholar]
  38. Goel, S.; Rosenberg, M.I.; Eley, C. ANSI/ASHRAE/IES Standard 90.1-2016 Performance Rating Method Reference Manual; Pacific Northwest National Lab (PNNL): Richland, WA, USA, 2017. [Google Scholar]
  39. Hoxha, E.; Maierhofer, D.; Saade, M.R.M.; Passer, A. Influence of technical and electrical equipment in life cycle assessments of buildings: Case of a laboratory and research building. Int. J. Life Cycle Assess. 2021, 26, 852–863. [Google Scholar] [CrossRef]
  40. Shiker, M. Multivariate Statistical Analysis. Br. J. Sci. 2012, 6, 55–66. [Google Scholar]
  41. Piotrowska, E.; Borchert, A. Energy consumption of buildings depends on the daylight. E3S Web Conf. 2017, 14, 01029. [Google Scholar] [CrossRef]
  42. Hussin, N.H.; Said, R.M.; Ishak, N. Analysis of Influence Factors Affecting The Energy Consumption in Technology Campus, UTEM. Malays. Constr. Res. J. 2020, 32, 29–36. [Google Scholar]
  43. Solano, J.C.; Caamaño-Martín, E.; Olivieri, L.; Almeida-Galárraga, D. HVAC systems and thermal comfort in buildings climate control: An experimental case study. Energy Rep. 2021, 7, 269–277. [Google Scholar] [CrossRef]
  44. Zhang, C.; Zhao, T.; Li, K. Quantitative correlation models between electricity consumption and behaviors about lighting, sockets and others for electricity consumption prediction in typical campus buildings. Energy Build. 2021, 253, 111510. [Google Scholar] [CrossRef]
  45. Alghamdi, S.; Tang, W.; Kanjanabootra, S.; Alterman, D. Effect of Architectural Building Design Parameters on Thermal Comfort and Energy Consumption in Higher Education Buildings. Buildings 2022, 12, 329. [Google Scholar] [CrossRef]
Figure 1. Analysis of the design process.
Energies 17 04041 g001
Figure 2. The Faculty of Electrical Engineering of Iasi.
Energies 17 04041 g002
Figure 3. Architectural model of blocks A and B of the university building.
Energies 17 04041 g003
Figure 4. SketchUp modeling of blocks A and B of the Faculty of Electrical Engineering (profile view).
Energies 17 04041 g004
Figure 5. Energy simulation of options during the sketch phase (shape and orientation).
Energies 17 04041 g005
Figure 6. OpenStudio Construction Sets interface.
Energies 17 04041 g006
Figure 7. Overview of the different space types.
Energies 17 04041 g007
Figure 8. Modeling protocol flowchart.
Energies 17 04041 g008
Figure 9. Diagram of energy consumption needs in Iasi.
Energies 17 04041 g009
Figure 10. Diagram of energy consumption needs in Lomé.
Energies 17 04041 g010
Figure 11. HVAC system energy consumption as a function of building temperature in the continental area.
Energies 17 04041 g011
Figure 12. Energy consumption of HVAC system as function of building temperature in tropical zone.
Energies 17 04041 g012
Figure 13. Parametric occupancy calendar with priority days and seasons.
Energies 17 04041 g013
Figure 14. Parametric lighting program and electrical equipment based on space occupancy over 24 h time slot.
Energies 17 04041 g014
Figure 15. Energy consumption of different building needs in Iasi.
Energies 17 04041 g015
Figure 16. Electricity consumption for different building needs in Lome.
Energies 17 04041 g016
Table 1. Analysis framework for energy simulation according to the literature. Adapted from [9].
MiscellaneousEnergyThermalLighting
Aspects to StudyMask Effect of Peripheral BuildingsPsychometric ChartSun PositionWind SpeedDirect and Indirect Solar RadiationHeating SavingsCooling SavingsSavings in Artificial LightingOverall Energy ConsumptionThermal ConductivityHeat Phase ShiftThermal LoadsThermal Gains by DaylightGlare AnalysisDaylight Factor/Lighting AutonomyIlluminance EstimationArchitectural Settings
Analysis of
site
Shape Volumetry,
Geometry
Orientation Optimal orientation
Envelope Thermal conductivity,
Thickness,
Thermal storage capacity,
Fenestration
(WWR, U,
FS, TL)
Lighting
natural
WWR, DF optimum,
Glare control
√: The checkmark corresponds to the validation of the options by the different parameters addressed in the table.
Table 2. Climate analysis tool features.
FeaturesTool
MeteonormEcotect
Psychometric chart
Degrees—heating and cooling days
Sun position
Direct solar radiation
Diffuse solar radiation
Cloud cover
Wind (speed and direction)
Temperature, humidity
LimitationsOnly accepts the file in Energy Plus Weather formatLimited functionality for studying natural ventilation effects
Table 3. Comparison of simulation tool options.
Study SettingsTools
OpenStudio SketchUp Plug-inEcotect
Building compactness1
Shape1
Orientation of facades
Window/wall ratio
Energy consumption11
Analysis of solar gains
Free software
Graphic interface
Import geometry2
Comments: 1: calculations via EnergyPlus 2: plug-in from SketchUp.
Table 4. Main parameters improving envelope performance.
Thermal Resistance (Opaque Walls, Openings)Limit heat gains or losses due to conduction by providing an envelope with a low conductivity coefficient. Be very attentive to thermal bridges.
Thermal MassRecommend heavy materials, especially for premises with prolonged occupancy presenting significant internal loads and heavily exposed to sunlight.
Glazing QualityEvaluate the trade-off in glazing using low-e material with other (reflective) coatings.
WaterproofingLimit infiltration and exfiltration as much as possible to ensure continuity of waterproofing
Disclaimer/Publisher’s Note: The statements, opinions and data contained in all publications are solely those of the individual author(s) and contributor(s) and not of MDPI and/or the editor(s). MDPI and/or the editor(s) disclaim responsibility for any injury to people or property resulting from any ideas, methods, instructions or products referred to in the content.

