Article

Analysis of the Possibility of Applying Biochars from Biowaste as Adsorbents to Eliminate Odors from Wastewater Treatment

by
Jacek Piekarski
1,
Katarzyna Ignatowicz
2,*,
Tomasz Dąbrowski
1 and
Bartosz Dąbrowski
3
1
Faculty of Civil Engineering, Environmental and Geodetic Sciences, Koszalin University of Technology, 75-453 Koszalin, Poland
2
Faculty of Civil Engineering and Environmental Sciences, Białystok University of Technology, 15-351 Białystok, Poland
3
Faculty of Power and Aeronautical Engineering, Warsaw University of Technology, Pl. Politechniki 1, 00-661 Warsaw, Poland
*
Author to whom correspondence should be addressed.
Energies 2024, 17(16), 4129; https://doi.org/10.3390/en17164129
Submission received: 8 July 2024 / Revised: 5 August 2024 / Accepted: 14 August 2024 / Published: 19 August 2024
(This article belongs to the Collection Bioenergy and Biofuel)

Abstract

:
Due to its nitrogen, phosphorus, and magnesium content, sewage sludge is used, among other things, to grow plants for energy purposes or to intensify biogas production. These processes are always accompanied by odor emissions, which are treated as pollution according to European legislation and are subject to legal regulations in many countries. Therefore, this publication presents the results of a study on the removal of odor from sewage sludge by adsorption on biochars produced from selected biowaste. Beekeeping waste (grain) and coffee brewing residues (spent coffee grounds) were selected for the study. Both materials were pyrolyzed to produce biochar which was applied for adsorption of odors from sewage sludge. Commercial Organosorb 200-1 Wi activated carbon was used as a comparison material. The odors were taken from dried sewage sludge from a municipal wastewater treatment plant. The obtained biochars are suitable for odor adsorption and can be an alternative to commercial adsorbents. The biochar from beekeeping waste showed the highest efficiency, allowing 100% odor removal. Slightly worse results were obtained for biochar from spent coffee grounds.

1. Introduction

We constantly and unconsciously inhale odor molecules from our environment. The sense of smell communicates exceptionally quickly to the brain via the olfactory bulb, hippocampus, and the amygdala, which is also responsible for emotions and memories. Without knowing the source of an odor, we react positively or negatively. The sense of smell functions like an alarm, informing people of potential danger. In particular, odors cause feelings of discomfort, lack of appetite, headaches, insomnia, and depression, and highly unpleasant odors cause nausea, vomiting, and even respiratory problems [1]. As a result of human activity, there are often emissions of odors into the environment, which are treated as pollution according to European legislation and are regulated in many countries [2,3].
Under practical conditions, odor emissions are mostly related to the operation of wastewater or waste management facilities [4].
The problem of wastewater management mainly affects expansion wells in sanitary sewer systems and the catchment points for wastewater haulage at wastewater treatment plants. Odorants are also generated during wastewater treatment and sludge treatment. Practically, odorant emissions occur at every stage of wastewater treatment, i.e., at the point of inflow of wastewater to the treatment plant, on screens, in raw sewage pumping stations, in sand traps, skimmers, primary settling tanks and activated sludge chambers, biological beds, as well as at places of turbulent wastewater flow and biomass storage, and, among others, landfills for screenings, sand, grease, sludge dewatering, drying, and collection stations [3,4,5]. Municipal sewage sludge is characterized by its ability to putrefy because the high content of organic substances in oxygen depletion favors the growth of bacteria that reduce sulfur compounds. That, in turn, combined with the fermentation process, generates a large amount of odor-inducing compounds in the form of hydrogen sulfide, carbon disulfide, dimethyl sulfide and disulfide, methyl and ethyl mercaptans, trimethylamine, and indoles and skatoles [6]. Due to the content of nutrients, sewage sludge is used, among other purposes, for growing plants for energy, for intensifying biogas production, and for neutralizing sewage sludge, e.g., from coking plants in the co-fermentation process [7,8].
Odor problems also affect municipal waste management facilities at all technological stages of waste disposal. The primary odor-forming pollutants are volatile organic compounds characterized by odor nuisance, toxicity, and significant environmental harm [4]. For example, the composting process generates odors from biomass, which is characteristic of municipal waste. Compost mass, due to mesophilic aerobic–anaerobic transformations, emits putrid odors. Also, substances strongly emitting odors are formed in the thermophilic phase, during which organic matter is rapidly decomposed. A particularly intense odor occurs when the process temperature exceeds 60 °C. Of course, by aerating or flipping the piles, it is possible to reduce the emission of hydrogen sulfide or mercaptans during composting. However, there is no way to prevent the formation of organic acids or aldehydes [9,10].
Odor problems in wastewater and waste management facilities are mainly related to temperature and wind speed values. As a result of an increase in the temperature of wastewater, the molecular diffusion of particles increases due to a decrease in surface tension. Consequently, according to the value of Henry’s dimensionless constant, there is a greater or lesser emission of odors to the environment. The emission of odor as a mixture of compounds varies unevenly, and the mentioned parameters affect the composition of the mixture and, as a result, the odor itself in the environment [4,11,12].
Odor emission problems can be effectively reduced by the encapsulation of facilities and equipment (Figure 1a) and masking, neutralization, or odor elimination methods (Figure 1b).
Odor masking does not eliminate the source of unpleasant odors but only “hides” them. Under real-world conditions, this involves introducing an additional odor that is more pleasant and stronger in perception than the unwanted odors [13]. Among other things, natural essential oils, extracted, for example, from fresh plant materials by steam distillation, are used as masking agents [14]. For example, to reduce the odor nuisance of operating equipment such as sedimentation centrifuges in a wastewater treatment plant, odor masking is used by applying essential oils to dewatering as a partial substitute for flocculants. Using oils compared to flocculants is a less effective solution, but it dramatically reduces the odor nuisance of dewatered sludge [15].
The elimination of unpleasant odors, among other things, is carried out by biological methods using microorganisms formed on shredded wood, peat, etc. The process of so-called biofiltration is characterized by a high efficiency of gas purification and odor elimination [16]. It removes aromatic, aliphatic, readily biodegradable organic compounds, hydrophobic terpenes, and sulfur compounds [17,18,19]. For example, unpublished data from a wastewater treatment plant show that 100% efficiency was achieved in the removal of hydrogen sulphide (initial concentration 10.20–213.80 µg/m3), mercaptans (initial concentration 2.10–49.10 µg/m3), and ammonia (initial concentration 0.1–0.7 µg/m3) using the biofiltration method of polluted air from a dried sludge storage facility. Similarly, in the process of photocatalytic oxidation of air from a dried sludge storage facility, 100% efficiency of hydrogen sulphide (initial concentration 1.9–484.70 µg/m3), mercaptans (initial concentration 70.20–540.50 µg/m3), and ammonia (initial concentration 0.1–1.10 µg/m3) removal was also achieved. Biofiltration does not result in the formation of toxic byproducts [20], so it is widely used due to its simplicity and low investment and operating costs. Nevertheless, the proper operation of biofilters involves using appropriate design solutions, pre-treatment and conditioning of gases, and providing optimal temperature and humidity for the development and degradation activity of microorganisms, resulting in an increase in the efficiency of gas purification from odor-forming compounds.
However, the biofiltration process is always accompanied to a greater or lesser extent by the physicochemical phenomenon of adsorption. Adsorption occurs best on materials characterized by a developed internal spatial structure and a particular chemical character of the surface, which, among other things, may be due to the structure of the carbon skeleton and, in particular, the presence of oxygen forming groupings capable of ion exchange. Such adsorbents can be produced by carbonization from any material that contains much elemental carbon, that is, from raw materials of organic origin (wood, peat, coal and lignite, nut shells, etc.). In carbonization at 650–850 °C, degassing of volatile substances and initial packing of the pore structure of activated carbon takes place. Taking advantage of the disordered crystalline structure of such adsorbents and their large specific surface area, they can be easily modified by thermal, physicochemical, or a combination of these methods. As a result, the mass and volume of the adsorbent, the size of the average pore radius, and the specific surface area can be changed. Physical activation is carried out in the presence of oxidizing gas and steam or activators in the case of chemical activation. The activation process is carried out at about 800–1100 °C.
There is a great demand for adsorbents in water treatment, wastewater treatment, gas emission reduction, and odor elimination. However, due to operation, their adsorption capacity decreases, and used activated carbons are often deposited in landfills, incinerated, or subject to regeneration. Therefore, due to the high cost of activated carbons, an interesting solution is the production of activated carbon by thermochemical conversion of plant biomass waste materials, such as beekeeping or coffee waste.
According to the literature, one bee colony in modern apiary management can produce about 2.8 kg/year of beeswax, of which about 10% is waste, so-called slumgum. Annual production of grain is estimated at 55,500 t [21]. Classic apiary management is based on systematically restoring bee nests by introducing knotted frames. The dried frames, which are about 1/3 of all frames, are subject to replacement. Withdrawn dried frames are subjected to a smelting process, resulting in the production of beeswax, a valuable product with many uses, such as in the re-production of bee’s bilge, wax castings, etc. On the other hand, waste bee hives, consisting of wax in the amount of about 18–40% and non-water-soluble non-wax parts, e.g., brood swarms, quilts, propolis, remains of dead bees, etc., can be the base for the production of adsorbents [22,23].
On the other hand, coffee is one of the world’s most popular energy drinks. According to the International Coffee Organization, 178 million 60 kg bags (10.7 million tons) were produced in 2023/24 [24]. Spent coffee grounds (SCGs) are the waste generated during coffee brewing. Each kilogram of green coffee is estimated to produce 0.65 kg of SCGs [25]. They consist mainly of cellulose, hemicellulose, lignin carbohydrates, and proteins. They can also contain fatty acids, vitamins, and fats [26,27]. SCGs, if improperly disposed of, can negatively impact the environment. Leachate from SCGs stored in landfills negatively affects groundwater and soil [28]. SCGs can be recycled through the composting process as an additive [26]. The composting process is difficult and depends on many parameters [29,30]. SCGs are also used as an additive to improve the physical properties of soil [31], for the production of biofuels [28,32,33,34], biocomposites [35,36], adsorbents for the removal of heavy metals, dyes, pesticides, and other contaminants from water [26,37,38,39,40,41], and even for the production of supercapacitors [42].
This publication presents a study of the elimination of noxious odors from municipal sewage sludge by adsorption on selected modified biowaste, i.e., beekeeping waste and spent coffee grounds subjected to pyrolysis. In order to compare the adsorption capacity of the obtained materials, a comparative study of odor elimination from the sludge of municipal wastewater treatment plants was carried out using commercial activated carbon Organosorb 200-1 Wi produced by DESOTEC Company, Roeselare, Belgium.

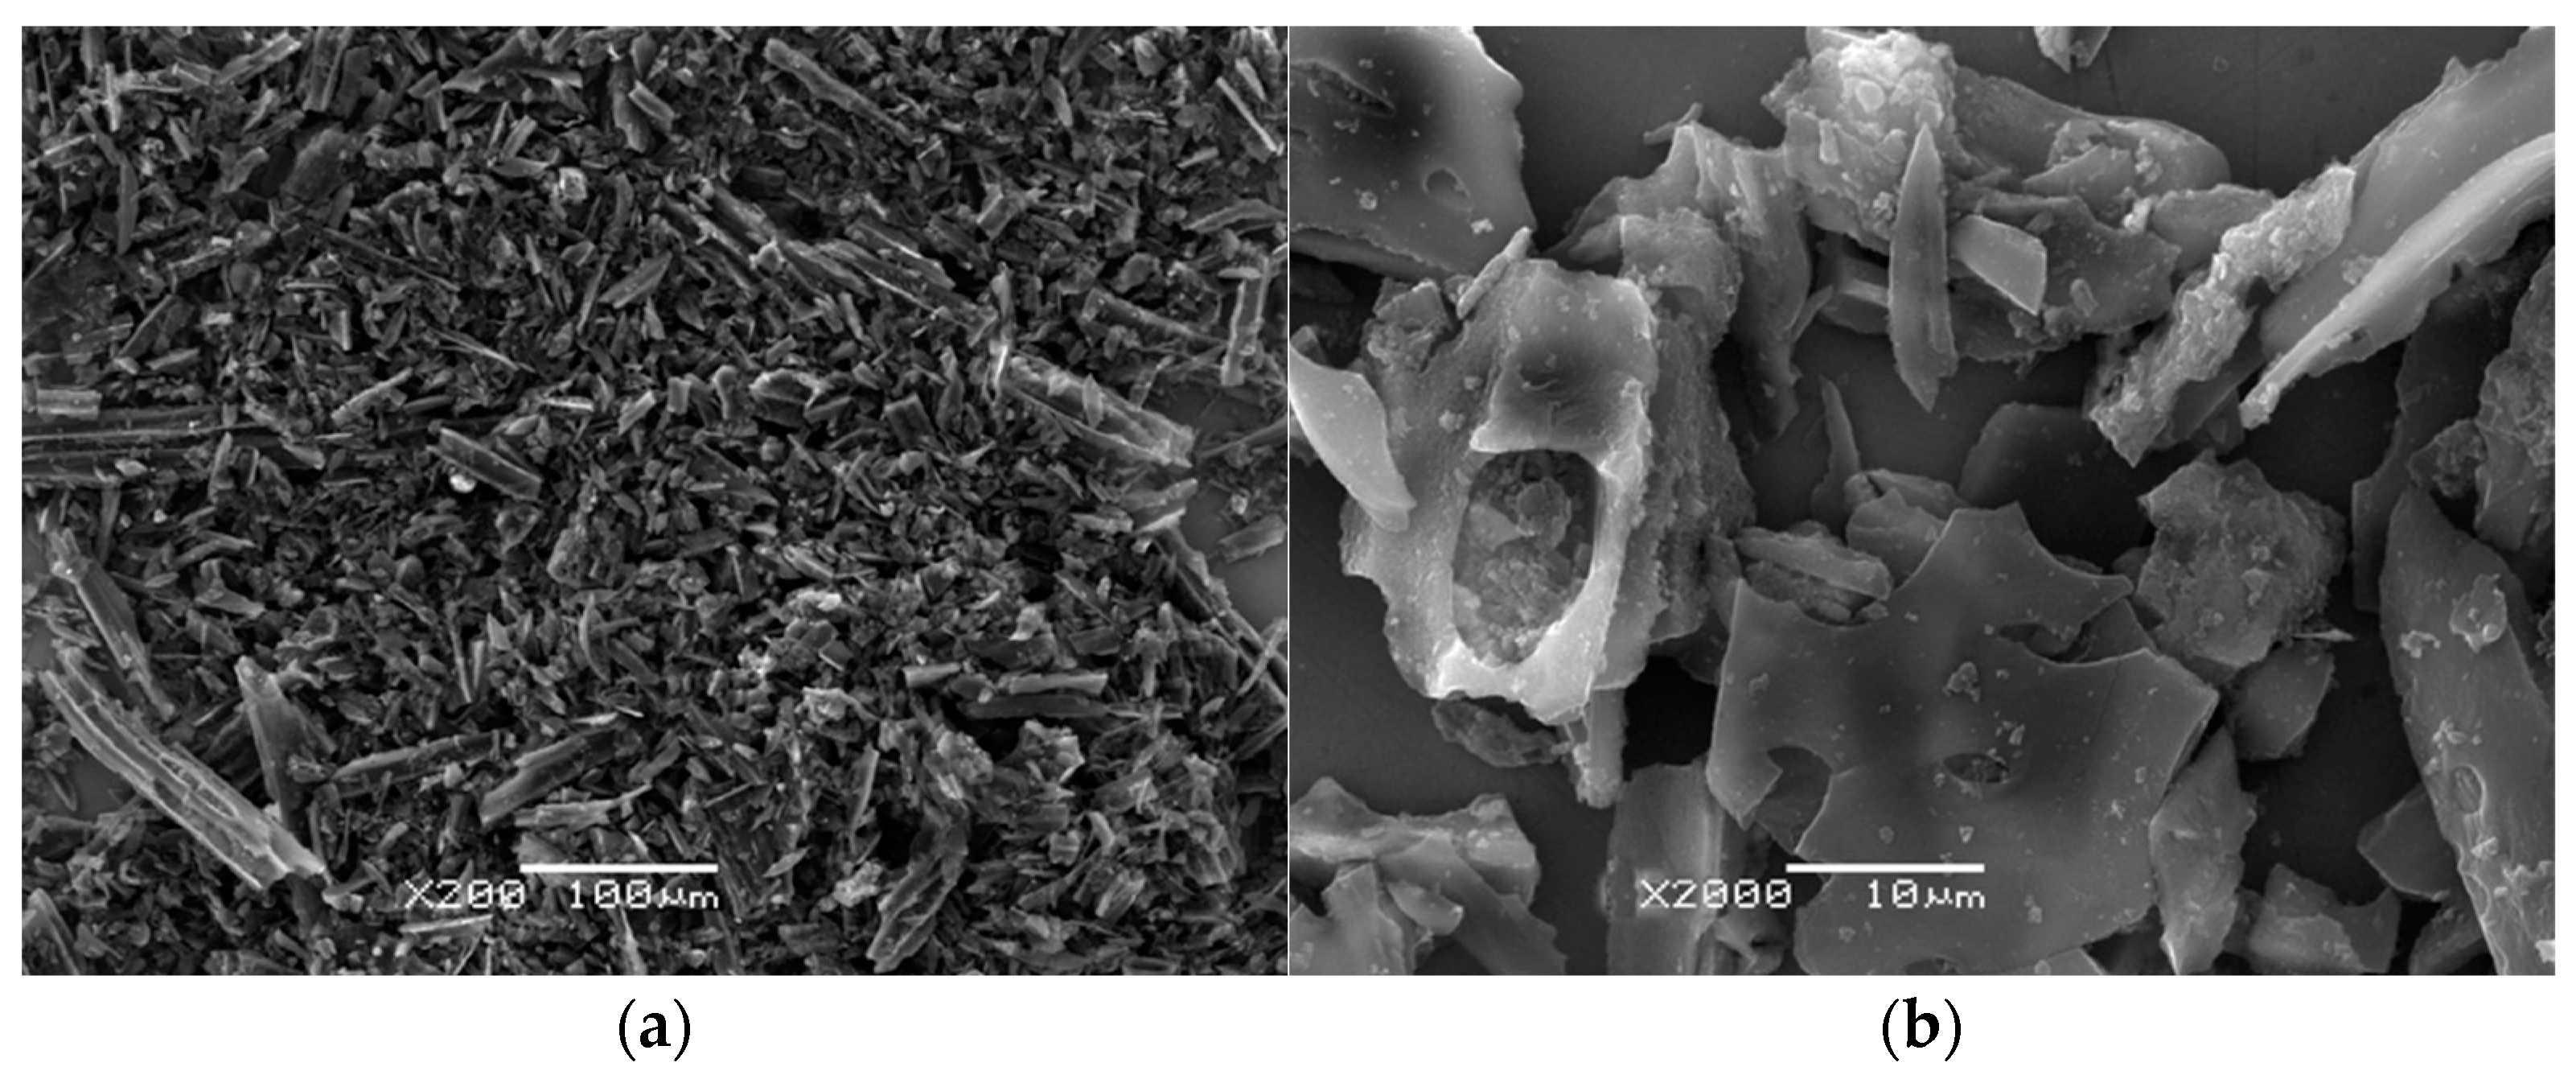
2. Materials and Methods

The test material consisted of beekeeping waste and spent coffee grounds. The commercial adsorbent Organosorb 200-1 Wi from DESOTEC was used as a comparison material. It is a powdered activated carbon produced from charcoal with a low ash content and a steam-activated binder. Due to its large specific surface area and developed pore structure, it is used in various applications, including water treatment and air purification. It also has high efficiency in removing organic contaminants.
The beekeeping waste came from a typical apiary located in the West Pomeranian region. SCGs, on the other hand, were obtained from a household coffee brewing machine. Popular coffee was used for brewing, which, according to the manufacturer’s information, consists of a blend of two species—Arabica at 80% and Robusta at 20%. The biowaste thus obtained was dried and subjected to a slow pyrolysis process. The process temperature was 650 °C. The material was heated in a closed chamber for about an hour, maintaining a temperature increase of 10 °C per hour. After reaching 650 °C, the material remained in the chamber for 3 h. The cooled beekeeping waste biochar (BKW-B) was then ground. Biochar from SCGs (SCG-B) did not require additional grinding.
Selected physicochemical properties such as moisture content [43], ash [44], volatile matter [45], fixed carbon, iodine number [46], and bulk density [47] were measured for considered adsorbents. The iodine number is defined as the mass of iodine adsorbed from an aqueous iodine solution by 1 g of activated carbon, while the iodine concentration in the remaining filtrate is 0.01 mol/dm3. During the study, the mass of adsorbed iodine Xm [mg] (1) per gram of carbon and the concentration of remaining iodine C [mol/dm3] (2) were calculated using the following equations:
X m = cI 2 2.2 · c Na 2 S 2 O 3 · V · 126.9 · m 1 mg ,
C = c Na 2 S 2 O 3 · V · 100 1 mol / dm 3 ,
where:
  • cI2—iodine concentration [mol/dm3],
  • 2.2—dilution factor for 10 cm3 of hydrochloric acid and filtrate,
  • cNa2S2O3—sodium thiosulfate concentration [mol/dm3],
  • V—volume of sodium thiosulfate solution used for titration [cm3],
  • 126.9—the relative atomic mass of iodine,
  • m—mass of adsorbent used for testing [g].
During the tests, it was checked that the C (2) values were within the range of 0.004 to 0.020 mol/dm3. For each adsorbent portion, the Xm values were plotted on a logarithmic scale on the ordinate axis and the C values on the abscissa axis. A curve graph was drawn using the least squares method for three points. The iodine number X was the value when the residual iodine concentration was C = 0.01 mol/dm3, with the least squares correlation coefficient value greater than 0.995.
Odor samples were taken with a compressor directly from above the municipal sewage sludge and collected in a tank at a pressure of p = 3 at. Odorants from the tank were directed through a pressure line via a control valve and flow meter to the adsorption process on a bed with a diameter of d = 15 mm. Based on the capacity of the tank, a process time of t = 15 min was assumed. After this, gas samples were taken into PTFE bags, characterized by a lack of absorption and odor release. Then, olfactometric tests were performed, in which one measurement of odor concentration consisted of four series.
Odor concentration, also called individual olfactory sensory threshold, is the concentration value at which a person senses a single odorous substance. In actual conditions typical of the population, we use the averaged value of the sensory threshold. The value of odorant concentration produces an olfactory effect in at least half of a representative group exposed to odor. For individual substances, the odorant concentration is equal to the value of the quotient of the odorant and threshold concentrations. Unfortunately, this method cannot be applied to mixtures of odorants since it is impossible to determine the value of the threshold of olfactory perception under such conditions. In such situations, the odorant concentration value can be calculated as a multiple of the dilution with odorless air of the analyzed sample needed to reach the olfactory sensing threshold.
The tests were performed on a TO8 olfactometer connected to a computer with specialized software installed. The measurement team consisted of four probands and an operator. According to normative guidelines, the probands were selected using the n-butanol-in-nitrogen method as a certified reference material. The initial dilution of the odor samples was set so that the presence of odor could not be determined. Subsequent dilutions were set in a descending manner. Among the samples presented were “blank samples”, in which odorless air was introduced instead of odor. During the tests, probationers indicated whether they could smell the odor in the dynamically diluted gas stream. Based on this, the computer, using an application, calculated the result of the team measurement (Zite, pan) in the form of a geometric mean value of all individual measurements, which is the value of odor concentration in a given sample (Cod), expressed in European odor units per cubic meter (ouE/m3) according to PN-EN 13725:2022-07 [48].
During the analysis of the adsorption process, the resulting variable parameter was the odorant concentration Cod [ou/m3], while the independent variable parameters were the height of the bed H [mm] and the flow rate of odorants through the bed vp [m/h]. The height of the bed varied from 0 to 30 mm, with gradations of 5 mm, while the flow velocity varied from 1.0 to 2 m/h, with gradations of 0.5 m/h. The tests were carried out at a room temperature of 21 °C.
First, based on the odorant concentration, the efficiency of the odorant adsorption process E [%] was calculated according to the formula:
E = 1 C · C 0 1 · 100   % ,
where:
  • C0—initial odor concentration value [ouE/m3],
  • C—final value of odor concentration [ouE/m3].
Then, the change in the efficiency of the odorant adsorption process E [%] depending on the height of the bed H [mm] was described by the equation [22]:
E = a 0 a 1 H 1 + a 1 H 1   %
where:
  • E—odorant adsorption efficiency [%],
  • H—height of the activated carbon bed [mm],
  • a0, a1—coefficients of the equation [-].

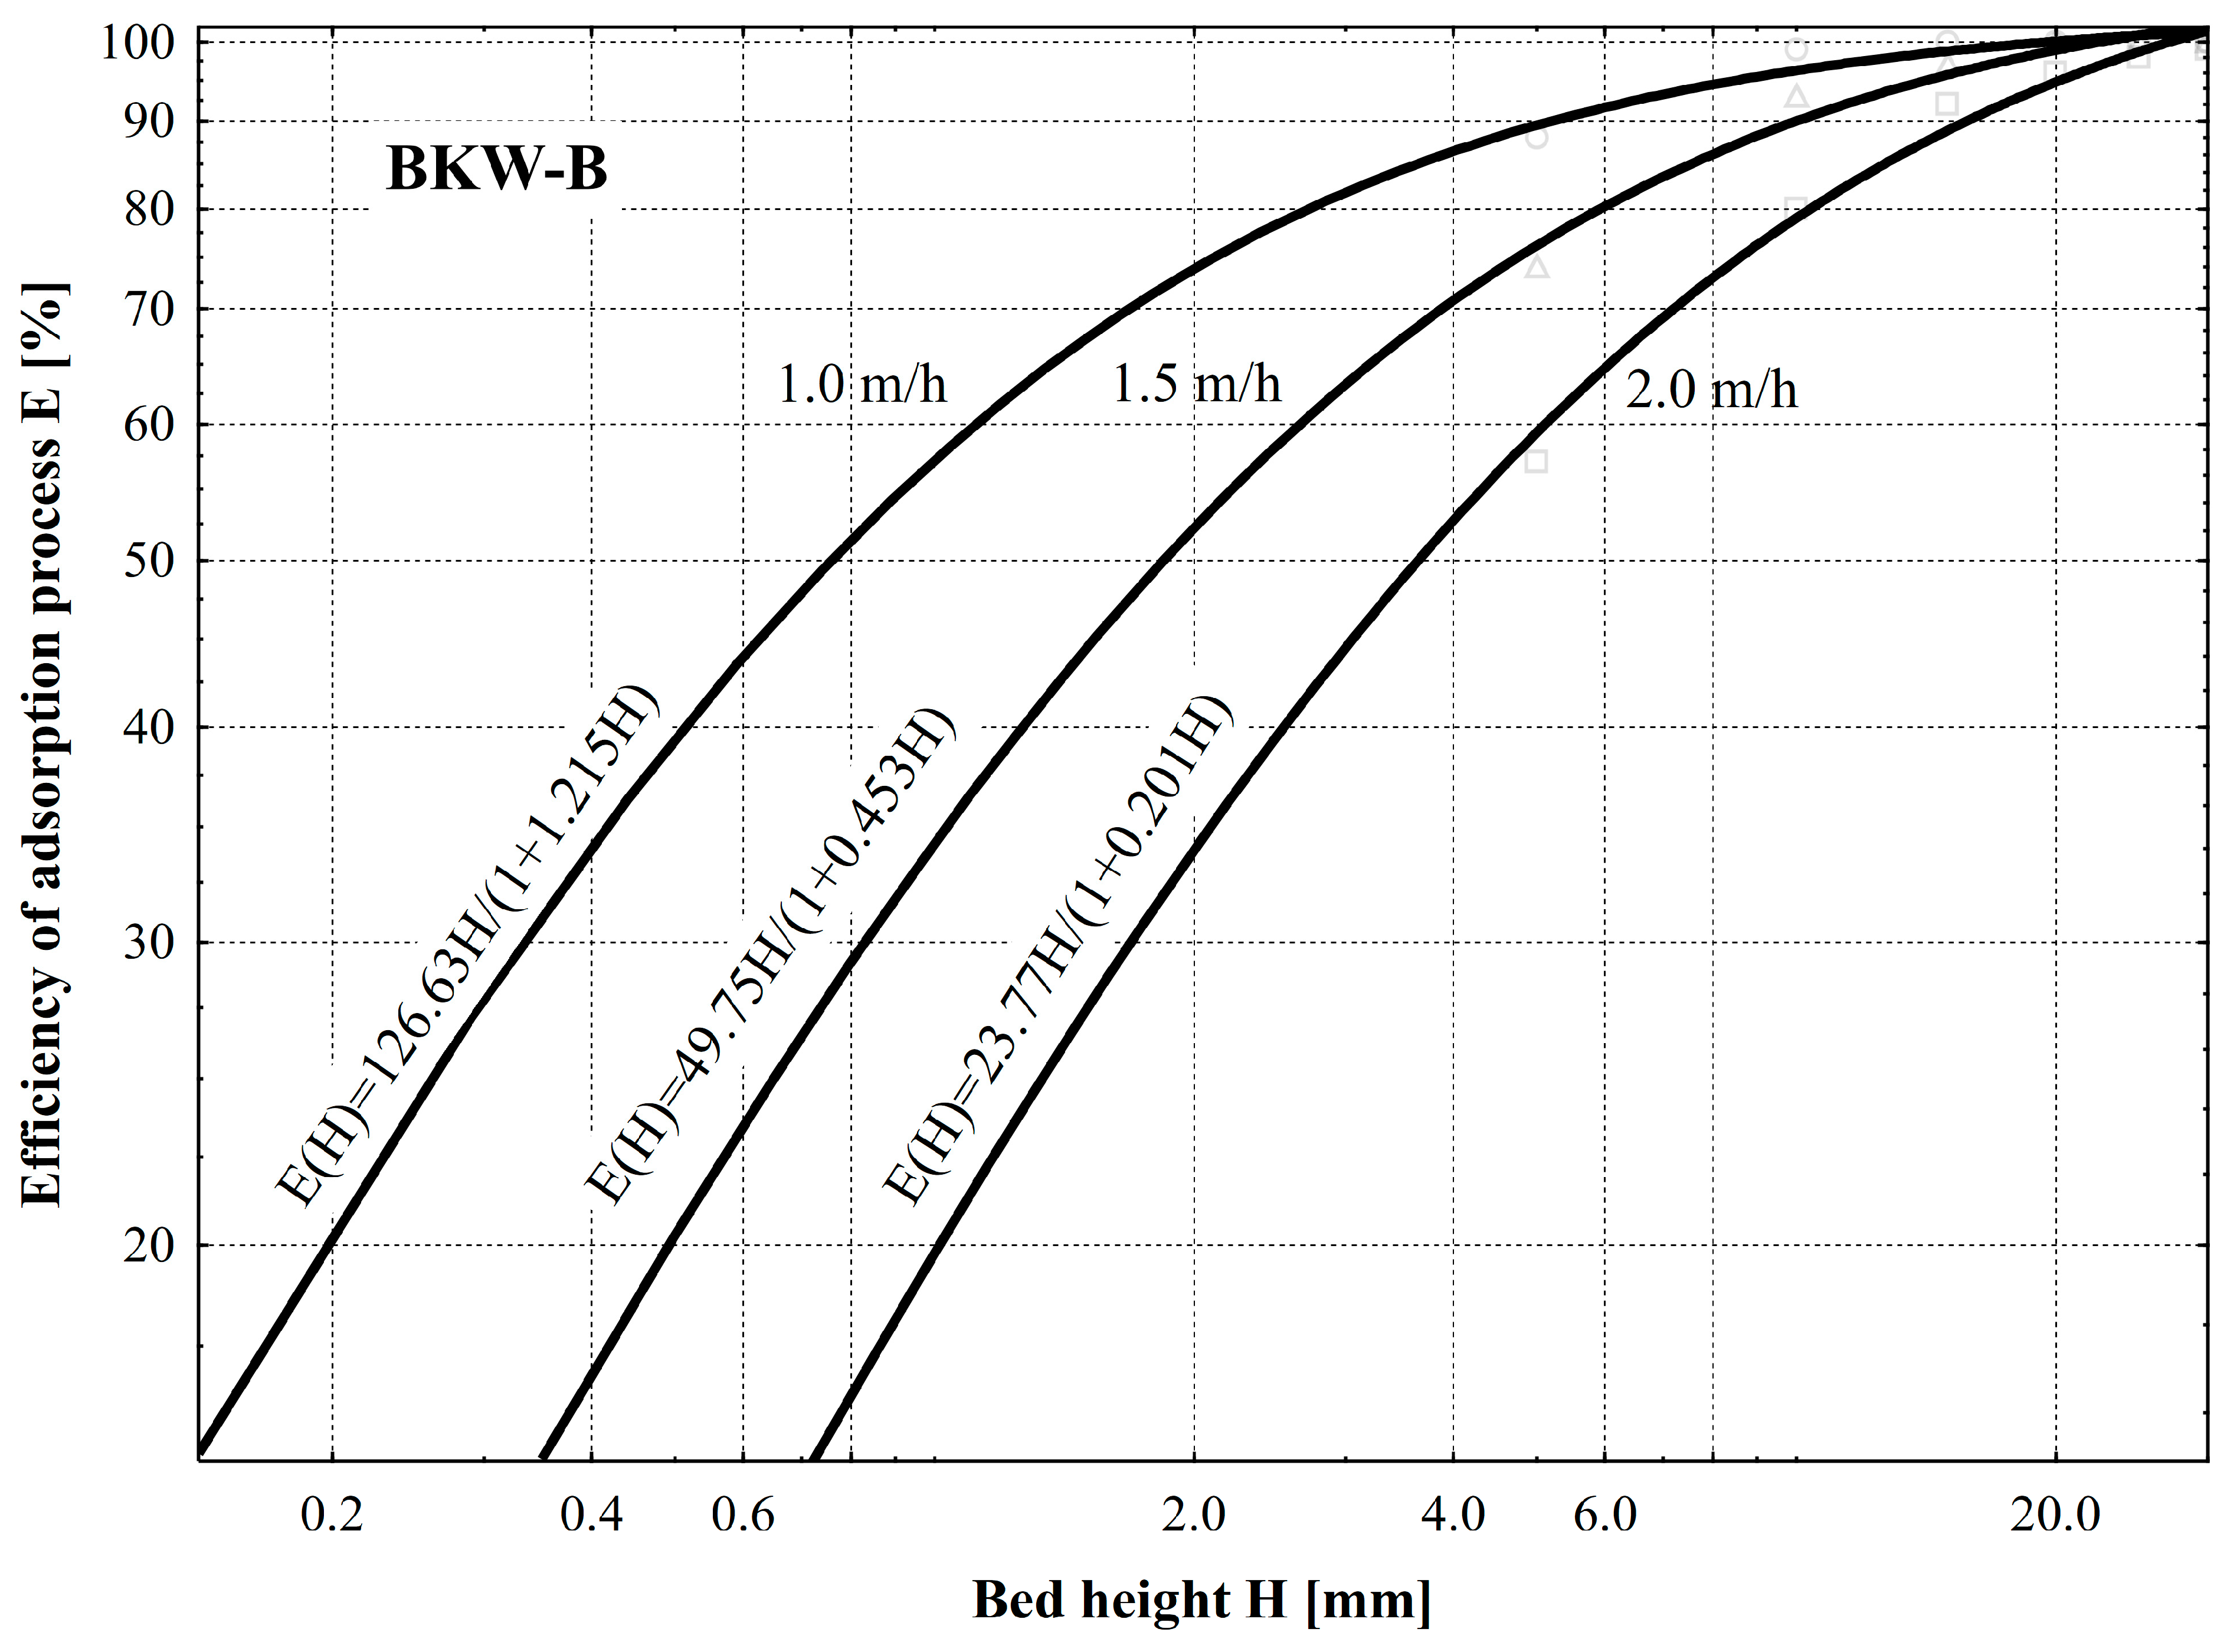
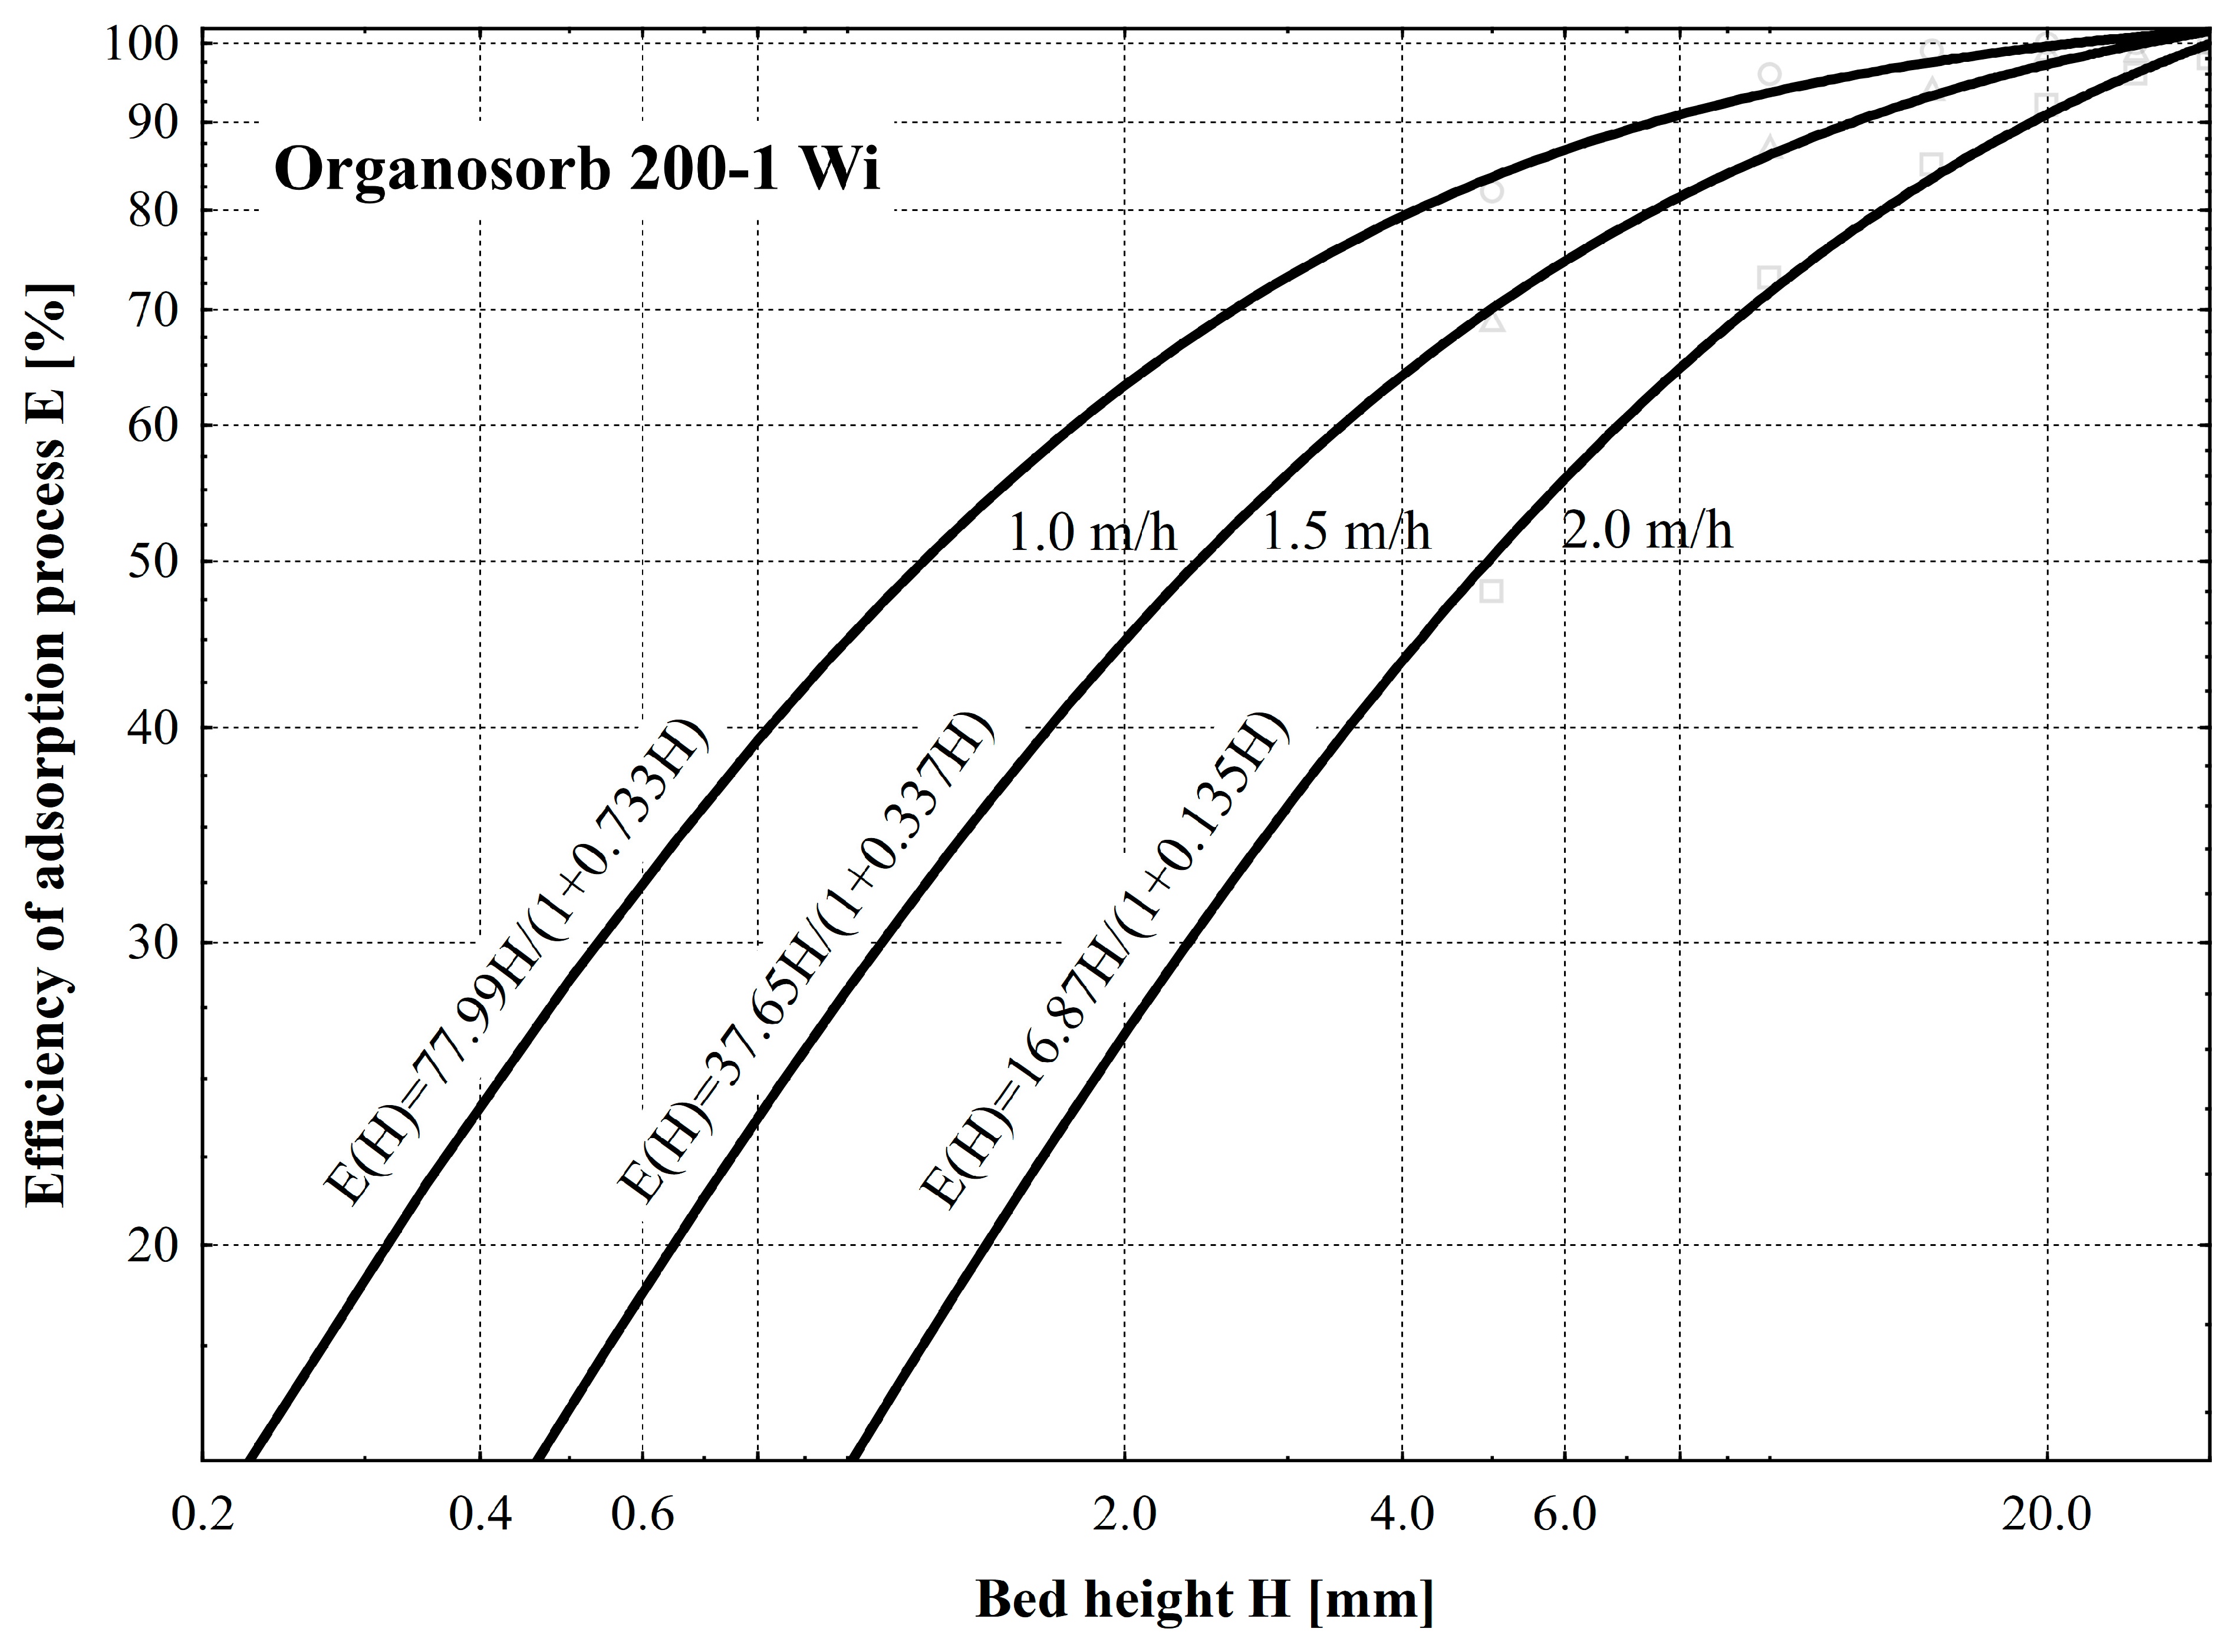
3. Results and Discussion

The results of the characteristic indicators describing the studied biochars and the series-produced Organosorb 200-1 Wi adsorbent are shown in Table 1.
The parameter values of the materials used in the study are at a similar level, except for the iodine number. The highest iodine number value suggests the best adsorption properties. The significantly lower iodine number values of adsorbents obtained from waste materials than commercial activated carbon are most likely due to chemical modification of the adsorption surface of Organosorb. Also, Organosorb activated carbon has the lowest ash content, which indicates the lowest mineral content. The highest value of the iodine number suggests the best adsorption properties. The parameters obtained for SCG-B are consistent with results reported in the literature [49,50].
In order to characterize the morphology of the biocarbons, images of the surfaces of the materials studied were taken using a scanning electron microscope (Figure 2), which, due to the diversity of the source material, confirmed the varied nature of the porous surface of the BKW-B, SCG-B, and Organosorb 200-1 Wi activated carbon. Commercial Organosorb 200-1 Wi activated carbon (Figure 2a,b) and BKW-B (Figure 2c,d) are relatively flat and more homogeneous with various compact irregular fragments containing individual particles, most likely of mineral origin. On the other hand, SCG-B is characterized by a developed macroporous structure (Figure 2e,f) [50].
Macropores are part of the carbon structure that allows the transport of impurities into smaller pores, which significantly determine the adsorption capacity. The specific surface of each type of adsorbent has a characteristic and unique chemical structure that determines the interaction with different types of adsorbates. Its edges and discontinuities are decisive for chemical reactions with atoms.
The results of olfactometric studies of odor elimination by adsorption on selected BKW-B, SCG-B, and Organosorb 200-1 Wi activated carbon are shown in Table 2.
Based on the nine-fold sampling of odor directly from the municipal sewage sludge, it can be concluded that the initial value of the odor concentration C0 varied from 2415 to 2898 ouE/m3 (Table 2). The initial values are very high, comparable to the odor concentrations in the grille chamber and the primary settling tank. Values in the 100–300 ouE/m3 range are the level of anaerobic reactors [51]. Acceptable odorant concentrations vary depending on the country, type of emissions, and conditions, and they range from 0.5 to as high as 100 ouE/m3 [2].
Based on the test results shown in Table 2, 3D graphs (Figure 3) were made showing the change in the value of odor concentration C [ouE/m3] as a function of the change in the value of flow velocity vp [m/h] and bed height H [mm]. Then, using Equations (1) and (2) employing nonlinear estimation using the Gauss–Newton least squares method in Statistica 13 software, the values of coefficients a1 and a2 were calculated (Table 3), and graphs of the change in the efficiency of the adsorption process E [%] as a function of the bed height H [mm] and the flow velocity of odorants through the bed vp [m/h] of SCG-B (Figure 4), BKW-B (Figure 5), and Organosorb 200-1 Wi activated carbon (Figure 6) were developed. In turn, based on the values of the coefficients of the equations (Table 3), the height of the adsorption bed required to achieve 50% odor elimination efficiency was calculated.
Based on the graph shown in Figure 4, it can be concluded that as a result of shorter contact between the odorants and the adsorbent, the efficiency of the odorant disposal process on a bed of SCG-B decreases as the flow velocity of odorants through the bed vp increases in the studied range from 1 to 2 m/h. Assuming the efficiency of the odorant adsorption process to be within 50%, such an increase in flow velocity results in a linear increase in bed height in the range of about 4 mm to about 10 mm. In this case, the effect of odorant elimination was not 100% since the minimum value of odorant concentration was C = 15 ouE/m3 at a bed height of 30 mm and maintaining the lowest flow velocity value of 1 m/h.
The BKW-B was a much better adsorbent (Figure 5). The efficiency of the odorant adsorption process E also decreased due to the increased flow velocity of odorants through the bed. Also, assuming the efficiency of the odorant adsorption process to be within 50%, an increase in flow velocity from 1 m/h to 2 m/h results in an increase in bed height of only about 1 mm to about 4 mm. Using such an adsorbent, it is possible to achieve up to 100% odorant inactivation efficiency at flow velocities of up to 1.5 m/h on a bed height of about 20 mm. A decrease in flow velocity to 1 m/h allows total odor elimination on an adsorbent bed of 15 mm height. During adsorption tests on a bed with a height of 30 mm and using the highest flow velocity value of 2 m/h, odor concentration C = 16 ouE/m3 was obtained.
Also, commercially produced Organosorb 200-1 Wi activated carbon proved to be a better adsorbent (Figure 6). As a result of the increase in the velocity of odorant flow through the bed, the efficiency of the odorant adsorption process decreased. This time, an increase in flow velocity from 1 m/h to 2 m/h, assuming the efficiency of the odorant adsorption process within 50%, results in an increase in bed height in the range of about 1 mm to about 5 mm. Using this activated carbon, achieving 100% odorant elimination efficiency at a flow rate of up to 1.5 m/h on a bed height of about 30 mm is possible. On the other hand, reducing the flow velocity to 1 m/h allows total odor elimination on an adsorption bed with a height of 20 mm. During adsorption tests on a bed with a height of 30 mm and using the highest flow velocity value of 2 m/h, 100% odor reduction efficiency was also not achieved, and the odor concentration value obtained was C = 49 ouE/m3.
Based on the similar course of the graphs presented in Figure 5 and Figure 6, the probable cause-and-effect mechanism of odorant retention on the surface of the analyzed materials may be the same, i.e., in addition to the adsorption process, the chemisorption phenomenon is probably also essential [52,53]. According to Brunauer, the adsorption isotherms of vapors and gases can be divided into five basic types [54,55]. The type I curve characterizes chemical adsorption (chemisorption), while type II, III, IV, and V curves characterize physical adsorption. The isotherms presented belong to type I. Initially, a steep curve corresponds to chemisorption, which then gradually flattens out. It is assumed that the steep section of the curve corresponds to a strong tendency of the surface to bind gas molecules and the flat part of the curve to the saturation of the surface binding forces. Type I corresponds to the Langmuir isotherm. The course of the isotherm reflects the basic assumption of the Langmuir theory that the surface of the adsorbent has a certain number of active sites (called active centers), and only one adsorbate molecule can be adsorbed on one active site. The adsorption capacity initially increases proportionally to the pressure, then this increase gradually decreases, and the adsorption reaches a constant value. All active sites are occupied, and a monolayer (monomolecular layer) is formed (Figure 7). A larger number of adsorbate molecules cannot be adsorbed on the adsorbent surface.

4. Conclusions

Based on the study, it can be concluded that:
  • The selected biowaste, which would otherwise find little use, is suited to the problem of developing adsorbents for odor elimination.
  • Biochars from beekeeping waste and coffee spent grounds are good alternatives to commercial adsorbents, such as Organosorb 200-1 Wi activated carbon.
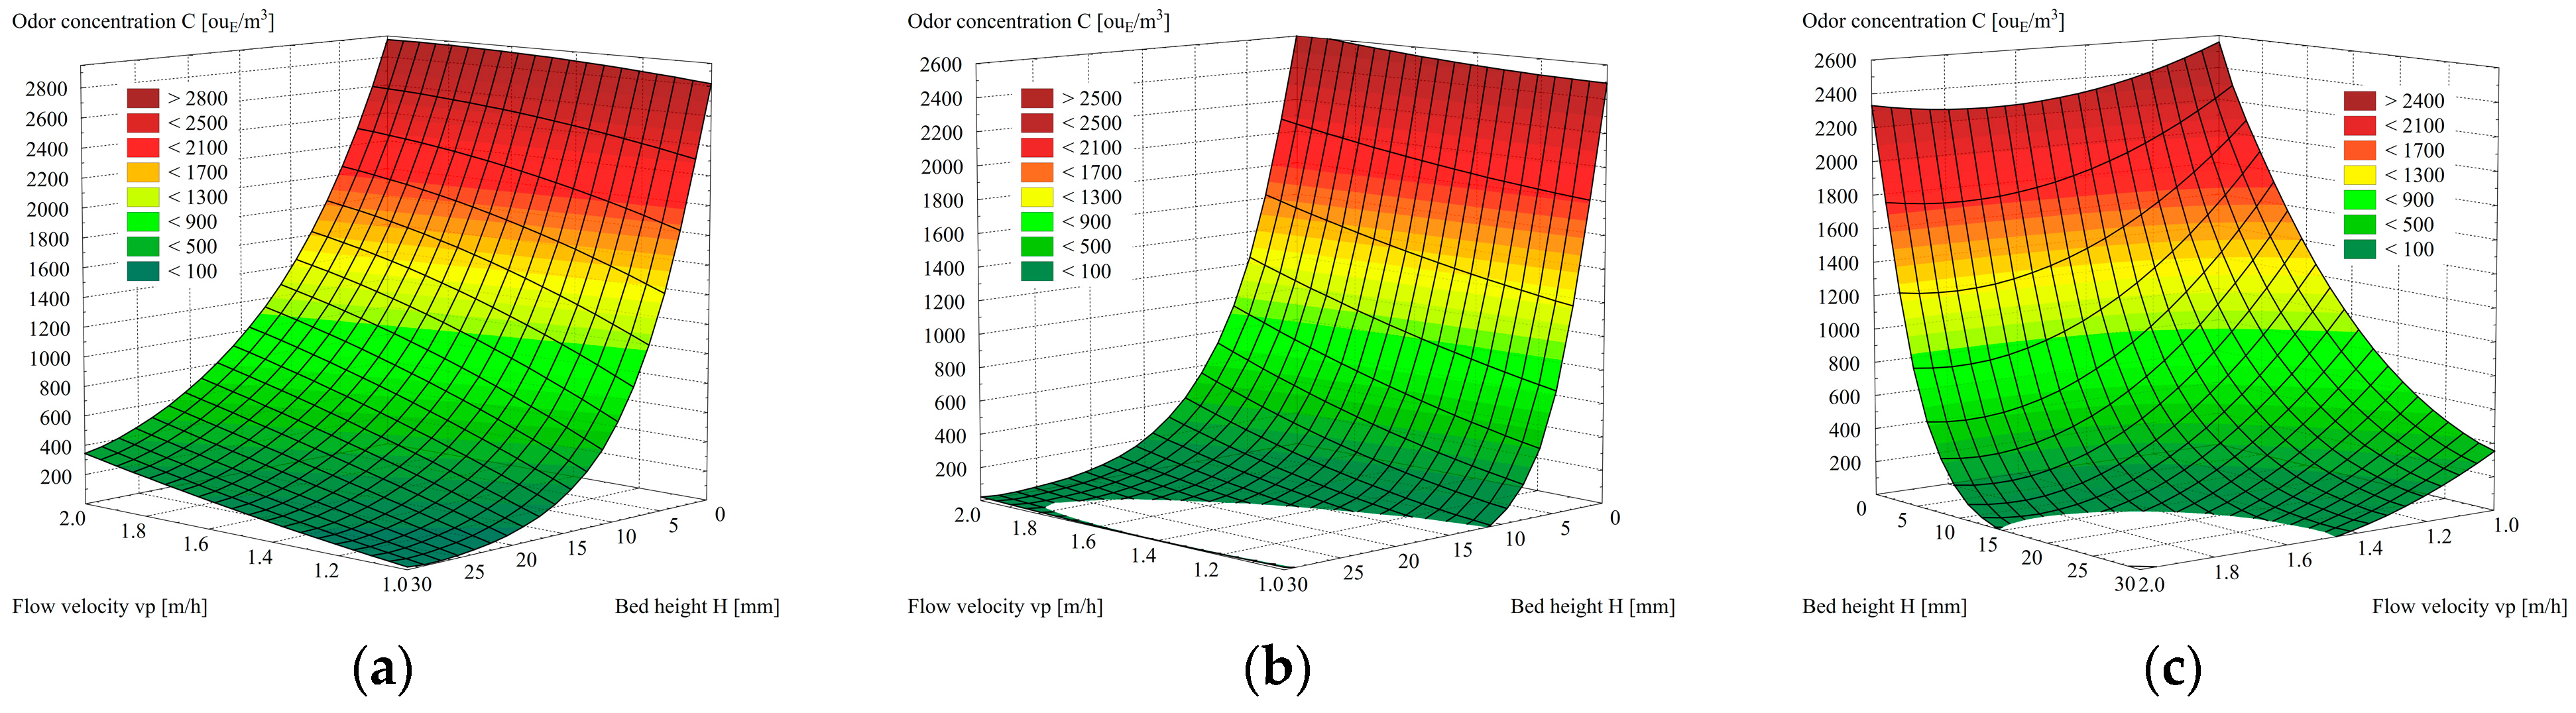
  • The biochar from beekeeping waste showed the highest efficiency of odor neutralization. At the height of the bed H = 15 mm and odorant flow rate vp = 1.0 m/h, it is 100% efficient. Biochar from SCGs prepared identically and maintaining the same values of the parameters of the independent variables does not guarantee 100% efficiency since the minimum value of odorant concentration was C = 15 ouE/m3. This is due to the developed macroporous structure, as under the same conditions, the efficiency of commercially produced Organosorb 200-1 Wi activated carbon is slightly higher than that of SCG-B and, simultaneously, lower than that of BKW-B. While maintaining the flow velocity vp =1.0 m/h, total adsorption of odorants occurs in a bed with a minimum height of H = 30 mm.
  • The efficiency of the adsorption process E [%] depending on the change in the height of the bed H [mm] is sufficiently described by the mathematical Formula (2), as evidenced by the value of the correlation coefficient ranging from 0.98 to 0.99. Based on the values of the coefficients of Equation (2), the efficiency of the process of adsorption of odorants can be estimated. As a result of decreasing the value of the coefficient a1 and increasing the value of the coefficient a2, an increase in adsorption efficiency was found. Based on the averaged values of the coefficients, an adsorption efficiency series of odor elimination was obtained: SCG-B (a1 = 131; a2 = 0.12) < commercial Organosorb 200-1 Wi (a1 = 114; a2 = 0.40) < BKW-B (a = 111; a12 = 0.62).
  • After selecting the most optimal biochars in terms of the adsorption process efficiency results, in the next cycle of research, it is planned to perform a detailed structural analysis and studies on the content of the main functional groups on the surface of adsorbents obtained from biowaste to indicate methods for modifying textural features and specific surface area using different reagents.
  • In the next stage of the research, it is necessary to introduce an additional independent variable parameter, i.e., the duration of the adsorption process, and on this basis, estimate the migration rate of the adsorption front, which can enable the possible practical application of modified waste materials.

Author Contributions

Conceptualization, J.P. and K.I.; methodology, J.P. and K.I.; software (Statistica 13), J.P.; investigation, J.P., K.I., and T.D.; supervision, J.P. and K.I.; formal analysis, J.P., K.I., and T.D.; validation, K.I.; writing—original draft, J.P., K.I., T.D., and B.D.; writing—review and editing, J.P., K.I., B.D., and T.D. All authors have read and agreed to the published version of the manuscript.

Funding

The research was carried out within the framework of thesis no. W/WB-IIŚ/2/2024 at the Bialystok University of Technology and was financed by the research subsidy granted by the Minister of the Ministry of Science and Higher Education.

Data Availability Statement

The original contributions presented in the study are included in the article, further inquiries can be directed to the corresponding author.

Conflicts of Interest

The authors declare no conflicts of interest.

References

  1. Shusterman, D. Critical Review: The Health Significance of Environmental Odor Pollution. Arch. Environ. Health Int. J. 1992, 47, 76–87. [Google Scholar] [CrossRef] [PubMed]
  2. Brancher, M.; Griffiths, K.D.; Franco, D.; De Melo Lisboa, H. A Review of Odour Impact Criteria in Selected Countries around the World. Chemosphere 2017, 168, 1531–1570. [Google Scholar] [CrossRef]
  3. Sówka, I.; Grzelka, A. Application of National and European Solutions in the Assessment of Odour Air Quality in the Vicinity of Waste Facilities. Rocz. Ochr. Śr. 2016, 18, 794–802. [Google Scholar]
  4. Sobczyński, P.; Miller, U.; Sówka, I. Variability of Odour Emissions from Selected Passive Area Source: Preliminary Analysis for a One-Year Study at a Municipal Wastewater Treatment Plant in Poland. Rocz. Ochr. Śr. 2023, 25, 228–234. [Google Scholar] [CrossRef]
  5. Lebrero, R.; Bouchy, L.; Stuetz, R.; Muñoz, R. Odor Assessment and Management in Wastewater Treatment Plants: A Review. Crit. Rev. Environ. Sci. Technol. 2011, 41, 915–950. [Google Scholar] [CrossRef]
  6. Hvitved-Jacobsen, T.; Vollertsen, J.; Yongsiri, C.; Nielsen, A.H.; Abdul-Talib, S. Sewer Microbial Processes, Emissions and Impacts. In Proceedings of the 3rd International Conference on Sewer Processes and Networks, Paris, France, 15–17 April 2002; pp. 1–13. [Google Scholar]
  7. Milik, J.; Pasela, R.; Szymczak, M.; Chalamonski, M. Evaluation of the Physico-Chemical Composition of Sludge from Municipal Sewage Treatment Plan. Rocz. Ochr. Śr. 2016, 18, 579–590. [Google Scholar]
  8. Sava, C.; Iluţiu-Varvara, D.-A.; Mare, R.; Roman, M.D.; Rada, S.; Pică, E.M.; Jäntschi, L. Physico-Chemical Characterization and Possible Uses of Sludge Processed from an Urban Sewage Treatment Plant. Heliyon 2024, 10, e29576. [Google Scholar] [CrossRef]
  9. Kwarciak-Kozłowska, A.; Bańka, B. Neutralization of Odors Generated during Composting of Biodegradable Fraction of Municipal and Industrial Waste by Biofiltration. Inż. Ochr. Śr. 2014, 17, 631–645. [Google Scholar]
  10. Gatwa-Widera, M.; Kwarciak-Kozlowska, K.-K. Anna Methods for Elimination of Odor in the Composting Process. Rocz. Ochr. Śr. 2016, 18, 850–860. [Google Scholar]
  11. Frechen, F.-B. Odour Emission Inventory of German Wastewater Treatment Plants–Odour Flow Rates and Odour Emission Capacity. Water Sci. Technol. 2004, 50, 139–146. [Google Scholar] [CrossRef]
  12. Jiang, G.; Melder, D.; Keller, J.; Yuan, Z. Odor Emissions from Domestic Wastewater: A Review. Crit. Rev. Environ. Sci. Technol. 2017, 47, 1581–1611. [Google Scholar] [CrossRef]
  13. Suffet, I.H.; Decottignies, V.; Zhou, Y.; Bian, Y.; Vitko, T.G. An Evaluation of Masking Nuisance Odors from a Source by Chemical and Sensory Analyses. Water Environ. Res. 2023, 95, e10901. [Google Scholar] [CrossRef] [PubMed]
  14. Kowalczyk, A.; Piecuch, T.; Andriyevska, L. The Use of Pine Essential Oil for Masking the Odors Emitted in the Process of Mechanical Dewatering of Municipal Sewage Sludge. Rocz. Ochr. Śr. 2013, 15, 807–822. [Google Scholar]
  15. Kowalczyk, A.; Piecuch, T. Application of Essential Oil as a Substitute of Flocculant in the Process of Mechanical Dewatering of Municipal Sewage Sludge. Rocz. Ochr. Śr. 2016, 18, 414–444. [Google Scholar]
  16. Fulazzaky, M.A.; Talaiekhozani, A.; Ponraj, M.; Abd Majid, M.Z.; Hadibarata, T.; Goli, A. Biofiltration Process as an Ideal Approach to Remove Pollutants from Polluted Air. Desalin. Water Treat. 2014, 52, 3600–3615. [Google Scholar] [CrossRef]
  17. Wani, A.H.; Branion, R.M.R.; Lau, A.K. Biofiltration: A Promising and Cost-effective Control Technology for Odors, VOCs and Air Toxics. J. Environ. Sci. Health Part A Environ. Sci. Eng. Toxicol. 1997, 32, 2027–2055. [Google Scholar] [CrossRef]
  18. Galwa-Widera, M.; Kwarciak-Kozlowska, A. Biofiltration–An Ecological Method of Removing Odors Generated during Drying Sewage Sludge-Case Study. Desalin. Water Treat. 2021, 232, 236–243. [Google Scholar] [CrossRef]
  19. Pecorini, I.; Rossi, E.; Iannelli, R. Mitigation of Methane, NMVOCs and Odor Emissions in Active and Passive Biofiltration Systems at Municipal Solid Waste Landfills. Sustainability 2020, 12, 3203. [Google Scholar] [CrossRef]
  20. Estrada, J.M.; Kraakman, N.J.R.B.; Muñoz, R.; Lebrero, R. A Comparative Analysis of Odour Treatment Technologies in Wastewater Treatment Plants. Environ. Sci. Technol. 2011, 45, 1100–1106. [Google Scholar] [CrossRef]
  21. Morales-Corts, R.; Gomez-Sanchez, M.A.; Perez-Sanchez, R.; Prieto-Calvo, C. Characterization of Beekeeping Wastes for Using in Seedling Production. Span. J. Agric. Res. 2010, 8, 493–500. [Google Scholar] [CrossRef]
  22. Piekarski, J.; Dąbrowski, T.; Ignatowicz, K. Effect of Bed Height on Efficiency of Adsorption of Odors from Sewage Sludge Using Modified Biochars from Organic Waste Materials as an Adsorbent. Desalin. Water Treat. 2021, 218, 252–259. [Google Scholar] [CrossRef]
  23. Piekarski, J.; Dąbrowski, T.; Dąbrowski, J.; Ignatowicz, K. Preliminary studies on odor removal in the adsorption process on biochars produced form sewage sludge and beekeeping waste. Arch. Environ. Prot. 2021, 47, 20–28. [Google Scholar] [CrossRef]
  24. International Coffee Organization. Coffee Report and Outlook; International Coffee Organization: London, UK, 2023. [Google Scholar]
  25. Pfluger, R.A. Soluble Coffee Processing. In Solid Wastes: Origin, Collection, Processing, and Disposal; Wiley: New York, NY, USA, 1975. [Google Scholar]
  26. Pujol, D.; Liu, C.; Gominho, J.; Olivella, M.À.; Fiol, N.; Villaescusa, I.; Pereira, H. The Chemical Composition of Exhausted Coffee Waste. Ind. Crops Prod. 2013, 50, 423–429. [Google Scholar] [CrossRef]
  27. Singh, T.A.; Pal, N.; Sharma, P.; Passari, A.K. Spent Coffee Ground: Transformation from Environmental Burden into Valuable Bioactive Metabolites. Rev. Environ. Sci. Biotechnol. 2023, 22, 887–898. [Google Scholar] [CrossRef]
  28. Tun, M.M.; Raclavská, H.; Juchelková, D.; Růžičková, J.; Šafář, M.; Štrbová, K.; Gikas, P. Spent Coffee Ground as Renewable Energy Source: Evaluation of the Drying Processes. J. Environ. Manag. 2020, 275, 111204. [Google Scholar] [CrossRef] [PubMed]
  29. Sidełko, R.; Janowska, B.; Szymański, K.; Mostowik, N.; Głowacka, A. Advanced Methods to Calculation of Pressure Drop during Aeration in Composting Process. Sci. Total Environ. 2019, 674, 19–25. [Google Scholar] [CrossRef] [PubMed]
  30. Sidełko, R.; Walendzik, B.; Smuga-Kogut, M.; Janowska, B.; Szymański, K.; Głowacka, A.; Leśniańska, A. Impact of reduced straw content on the sewage sludge composting process. Arch. Environ. Prot. 2020, 46, 70–77. [Google Scholar] [CrossRef]
  31. Cervera-Mata, A.; Molinero-García, A.; Martín-García, J.M.; Delgado, G. Sequential Effects of Spent Coffee Grounds on Soil Physical Properties. Soil Use Manag. 2023, 39, 286–297. [Google Scholar] [CrossRef]
  32. Massaya, J.; Chan, K.H.; Mills-Lamptey, B.; Chuck, C.J. Developing a Biorefinery from Spent Coffee Grounds Using Subcritical Water and Hydrothermal Carbonisation. Biomass Convers. Biorefin. 2023, 13, 1279–1295. [Google Scholar] [CrossRef]
  33. Kim, H.-J.; Oh, S.-C. Hydrothermal Carbonization of Spent Coffee Grounds. Appl. Sci. 2021, 11, 6542. [Google Scholar] [CrossRef]
  34. Kang, S.B.; Oh, H.Y.; Kim, J.J.; Choi, K.S. Characteristics of Spent Coffee Ground as a Fuel and Combustion Test in a Small Boiler (6.5 kW). Renew. Energy 2017, 113, 1208–1214. [Google Scholar] [CrossRef]
  35. Bomfim, A.; Oliveira, D.; Voorwald, H.; Benini, K.; Dumont, M.-J.; Rodrigue, D. Valorization of Spent Coffee Grounds as Precursors for Biopolymers and Composite Production. Polymers 2022, 14, 437. [Google Scholar] [CrossRef] [PubMed]
  36. Alharbi, M.; Bairwan, R.D.; Rizg, W.Y.; Khalil, H.P.S.A.; Murshid, S.S.A.; Sindi, A.M.; Alissa, M.; Saharudin, N.I.; Abdullah, C.K. Enhancement of Spent Coffee Grounds as Biofiller in Biodegradable Polymer Composite for Sustainable Packaging. Polym. Compos. 2024, 45, 9317–9334. [Google Scholar] [CrossRef]
  37. Figueroa Campos, G.A.; Perez, J.P.H.; Block, I.; Sagu, S.T.; Saravia Celis, P.; Taubert, A.; Rawel, H.M. Preparation of Activated Carbons from Spent Coffee Grounds and Coffee Parchment and Assessment of Their Adsorbent Efficiency. Processes 2021, 9, 1396. [Google Scholar] [CrossRef]
  38. Castro, C.S.; Abreu, A.L.; Silva, C.L.T.; Guerreiro, M.C. Phenol Adsorption by Activated Carbon Produced from Spent Coffee Grounds. Water Sci. Technol. 2011, 64, 2059–2065. [Google Scholar] [CrossRef]
  39. Le, V.T.; Pham, T.M.; Doan, V.D.; Lebedeva, O.E.; Nguyen, H.T. Removal of Pb(ii) Ions from Aqueous Solution Using a Novel Composite Adsorbent of Fe3O4/PVA/Spent Coffee Grounds. Sep. Sci. Technol. 2019, 54, 3070–3081. [Google Scholar] [CrossRef]
  40. Milanković, V.; Tasić, T.; Pejčić, M.; Pašti, I.; Lazarević-Pašti, T. Spent Coffee Grounds as an Adsorbent for Malathion and Chlorpyrifos—Kinetics, Thermodynamics, and Eco-Neurotoxicity. Foods 2023, 12, 2397. [Google Scholar] [CrossRef]
  41. Nguyen, V.-T.; Nguyen, T.-B.; Huang, C.P.; Chen, C.-W.; Bui, X.-T.; Dong, C.-D. Alkaline Modified Biochar Derived from Spent Coffee Ground for Removal of Tetracycline from Aqueous Solutions. J. Water Process Eng. 2021, 40, 101908. [Google Scholar] [CrossRef]
  42. Andrade, T.S.; Vakros, J.; Mantzavinos, D.; Lianos, P. Biochar Obtained by Carbonization of Spent Coffee Grounds and Its Application in the Construction of an Energy Storage Device. Chem. Eng. J. Adv. 2020, 4, 100061. [Google Scholar] [CrossRef]
  43. PN-80/G-04511; Solid Fuels—Determination of Moisture Content. Polish Committee for Standardization: Warsaw, Poland, 1980.
  44. PN-80/G-04512; Solid Fuels—Determination of Ash by Gravimetric Method. Polish Committee for Standardization: Warsaw, Poland, 1980.
  45. PN-G-04516:1998; Solid Fuels—Determination of Volatile Matter by Gravimetric Method. Polish Committee for Standardization: Warsaw, Poland, 1998.
  46. PN-EN 12902:2005; Drinking Water Treatment Products—Inorganic Support and Filter Materials—Test methods. Polish Committee for Standardization: Warsaw, Poland, 2005.
  47. PN-EN 12915-1:2009; Drinking Water Treatment Products—Granular Activated Carbon—Part 1: Primary Granular Activated Carbon. Polish Committee for Standardization: Warsaw, Poland, 2009.
  48. PN-EN 13725:2022-07; Emission from Stationary Sources—Determination of Odor Concentration Using Dynamic Olfactometry and Odor Emission Rate. Polish Committee for Standardization: Warsaw, Poland, 2022.
  49. Yang, J.; Zhao, Z.; Hu, Y.; Abbey, L.; Cesarino, I.; Goonetilleke, A.; He, Q. Exploring the Properties and Potential Uses of Biocarbon from Spent Coffee Grounds: A Comparative Look at Dry and Wet Processing Methods. Processes 2023, 11, 2099. [Google Scholar] [CrossRef]
  50. Tangmankongworakoon, N. An Approach to Produce Biochar from Coffee Residue for Fuel and Soil Amendment Purpose. Int. J. Recycl. Org. Waste Agric. 2019, 8, 37–44. [Google Scholar] [CrossRef]
  51. Kang, J.-H.; Song, J.; Yoo, S.S.; Lee, B.-J.; Ji, H.W. Prediction of Odor Concentration Emitted from Wastewater Treatment Plant Using an Artificial Neural Network (ANN). Atmosphere 2020, 11, 784. [Google Scholar] [CrossRef]
  52. Anfruns, A.; Martin, M.J.; Montes-Morán, M.A. Removal of Odourous VOCs Using Sludge-Based Adsorbents. Chem. Eng. J. 2011, 166, 1022–1031. [Google Scholar] [CrossRef]
  53. Guo, S.; Wang, Z.; Wu, S.; Cai, Y.; Zhang, J.; Lou, C.; Zhao, W. Modification of the Adsorption Model for the Mixture of Odor Compounds and VOCs on Activated Carbon: Insights from Pore Size Distribution. Sep. Purif. Technol. 2024, 339, 126669. [Google Scholar] [CrossRef]
  54. Ruthven, D.M. Adsorption, Fundamentals. In Kirk-Othmer Encyclopedia of Chemical Technology; Kirk-Othmer, Ed.; Wiley: Hoboken, NJ, USA, 2001; ISBN 978-0-471-48494-3. [Google Scholar]
  55. Bastos-Neto, M.; De Azevedo, D.C.S.; De Lucena, S.M.P. Adsorption. In Kirk-Othmer Encyclopedia of Chemical Technology; Kirk-Othmer, Ed.; Wiley: Hoboken, NJ, USA, 2020; pp. 1–59. ISBN 978-0-471-48494-3. [Google Scholar]
Figure 1. Example of encapsulation of a secondary settling tank in a municipal wastewater treatment plant (a) and elimination of odors from the expansion well of the wastewater system by adsorption on activated carbon (b) (own photo).
Energies 17 04129 g001
Figure 2. SEM images of adsorbents: commercial activated carbon Organosorb 200-1 Wi (a) and (b); BKW-B (c) and (d); and SCG-B (e) and (f) at ×200 and ×2000 magnification (own photo).
Energies 17 04129 g002aEnergies 17 04129 g002b
Figure 3. Variation of odor concentration values C [%] as a function of bed height H [mm] and odorant flow velocity through the bed vp [m/h] of SCG-B (a), BKW-B (b), and Organosorb 200-1 Wi activated carbon (c).
Energies 17 04129 g003
Figure 4. Variation of the efficiency of the adsorption process E [%] as a function of bed height H [mm] and the velocity of odorant flow through the bed vp [m/h] of SCG-B.
Energies 17 04129 g004
Figure 5. Variation of the efficiency of the adsorption process E [%] depending on the height of the bed H [mm] and the velocity of odorant flow through the bed vp [m/h] of BKW-B.
Energies 17 04129 g005
Figure 6. Variation of adsorption process efficiency E [%] as a function of bed height H [mm] and odorant flow rate through the bed vp [m/h] of Organosorb 200-1 activated carbon Wi.
Energies 17 04129 g006
Figure 7. Langmuir’s monolayer model.
Energies 17 04129 g007
Table 1. Values of selected indicators of commercial activated carbon and beekeeping waste and SCG biochars.
Lp.ParameterUnitAdsorbent
SCG-BBKW-BOrganosorb
200-1 Wi
1Moisture[%]4.03.17.8
2Ash[%]8.712.55.3
3Volatile parts[%]10.96.610
4Fixed carbon[%]76.477.876.9
5Iodine number[mg/g]8695900
6Bulk density[kg/m3]269462500
Table 2. Results of olfactometric studies of odor elimination by adsorption on selected pyrolyzed waste materials and Organosorb 200-1 Wi activated carbon.
No.Flow
Velocity
Height of the DepositAdsorbent
SCG-BBKW-BOrganosorb
200-1 Wi
Odor Concentration
vp [m/h]H [mm]C [ouE/m3]
11.000289025902410
251234306443
3105193693
415234016
52010200
6254800
7301500
81.500288225792417
951760682756
10101054174310
111565069149
12204101221
1325236015
143014800
152.000289825992415
165204811192048
171014105111410
1815992200992
192068494684
202547648476
213034116341
Table 3. Values and quality of estimation of nonlinear coefficients of analytical–empirical mathematical equations of the change in the efficiency of the adsorption process E [%] depending on the height of the bed H [mm] and the rate of flow of odorants through the bed vp [m/h] of SCG-B, BKW-B, and activated carbon Organosorb 200-1 Wi.
AdsorbentFlow VelocityFactorValueR2
SCG-B1.0a0117.880.99
a10.21
1.5a0132.040.99
a10.09
2.0a0144.780.99
a10.05
BKW-B1.0a0104.220.99
a11.22
1.5a0109.850.99
a10.45
2.0a0118.400.98
a10.20
Organosorb
200-1 Wi
1.0a0106.400.99
a10.73
1.5a0111.650.98
a10.34
2.0a0124.540.99
a10.14
Disclaimer/Publisher’s Note: The statements, opinions and data contained in all publications are solely those of the individual author(s) and contributor(s) and not of MDPI and/or the editor(s). MDPI and/or the editor(s) disclaim responsibility for any injury to people or property resulting from any ideas, methods, instructions or products referred to in the content.

