Article

Experimental Investigation of R404A Indirect Refrigeration System Applied Internal Heat Exchanger: Part 2—Exergy Characteristics

by
Min-Ju Jeon
and
Joon-Hyuk Lee
*
Department of Refrigeration and Air-Conditioning Engineering, College of Engineering, Pukyong National University, 45, Yongso-ro, Nam-gu, Busan 48513, Republic of Korea
*
Author to whom correspondence should be addressed.
Energies 2024, 17(16), 4143; https://doi.org/10.3390/en17164143
Submission received: 15 July 2024 / Revised: 7 August 2024 / Accepted: 13 August 2024 / Published: 20 August 2024
(This article belongs to the Section J: Thermal Management)

Abstract

:
Although the R404A indirect refrigeration system (IRS) with an internal heat exchanger (IHX) and R744 as the secondary fluid has potential applications in supermarkets and hypermarkets, the exergy characteristics of this IRS have not been extensively investigated. In this study, the factors affecting the R744 exergy characteristics (degree of subcooling (DSB) and degree of superheating (DSP) of the R404A cycle, DSP of the R744 cycle, condensation temperature (CT) and cascade evaporation temperature (CET), and IHX efficiency) were experimentally evaluated to obtain basic data for the design of R404A IRS with R744 as the optimal secondary fluid. The main results can be summarized as follows: (1) Under given conditions, the smallest change in the system exergy destruction rate (EDR) according to the change in each parameter is the DSP of the R744 cycle (0.3–1%), followed by the DSB of the R404A cycle (6.1–8.8%), the IHX efficiency of the R404A cycle (3.8–14.3%), the DSP of the R404A cycle (11.7–15.9%), the CET (29.4–41.9%), and the CT (35–47%). (2) Also, in terms of the exergy efficiency of system (EES), the largest value was obtained for the DSP of the R404A cycle (2.4–12.7%), followed by the IHX efficiency of the R404A cycle (3–10.2%), the CET (2.2–8.7%), the CT (4–6.9%), the DSB of the R404A cycle (2.7–6.2%), and the DSP of the R744 cycle (0.04–1.2%). (3) In order to lower the system EDR, DSP, DSB, and IHX efficiency of the R404A cycle, the CET must be increased to the maximum, and to lower the DSP of the R744 cycle, the CT must be reduced to the minimum.

1. Introduction

The cascade refrigeration system (CRS) [1,2,3,4] and indirect refrigeration system (IRS) [5,6] are common refrigeration systems that are used in numerous supermarkets and hypermarkets worldwide. The CRS is primarily used for low-temperature (−45 to −25 °C) refrigeration, and the IRS is primarily used for medium-temperature (−25 to 5 °C) refrigeration. Single-phase brines, such as ethylene glycol, propylene glycol, ethyl alcohol, methyl alcohol, glycerol, potassium carbonate, calcium chloride, magnesium chloride, and sodium chloride, are commonly used in the IRS. The viscosity of single-phase brines increases rapidly with a decrease in the cooling temperature, while the power consumption of the pump (PCP) significantly increases. R744 (CO2; carbon dioxide), which is not a single-phase brine, has attracted attention as a secondary fluid or refrigerant that can help address the limitations of single-phase brines. Accordingly, the use of R744 as a secondary fluid for the IRS has been investigated.
The risk of refrigerant leaks from supermarket refrigeration systems has been highlighted in numerous studies [7,8,9,10,11,12]. The annual refrigerant leakage from supermarkets in different countries is listed in Table 1 [13,14,15]. R404A is classified as a group A1 refrigerant in the ASHRAE 34 safety group [16], and, hence, it is considered safe for supermarkets and hypermarkets [17]. R404A continues to be used in developing countries despite its high global warming potential.
Previous studies have investigated refrigeration systems with secondary refrigerant circulation. For example, Pearson (1995) [18] patented R744 as a secondary refrigerant that can easily evaporate, including a general hot gas defrosting system. Pearson (2005) [19] also used R744 as an easy-to-evaporate secondary refrigerant in Swedish supermarket refrigeration systems.
Pachai [20] examined the secondary refrigerant loop system installed in Helsingborg, Sweden, where a mixture of R290 and R170 (which are hydrocarbon-based refrigerants) was used as the primary refrigerant; R744 and propylene glycol were used as the secondary refrigerants for low and medium temperatures, respectively. The system has been functioning smoothly since 1997 and has been installed in more than 50 stores. Nilsson et al. [21] reported a 15 kW ice rink refrigeration system, with R744 as the secondary refrigerant. The primary refrigerant loop comprised a brine cooler, an expansion valve (EV), a cascade condenser (CC), and a compressor. The secondary refrigerant loop comprised a tank (liquid receiver) for R744 and a pump. The R744 (liquid receiver) tank was cooled by the cascade condenser of the refrigeration system that could adjust the brine temperature to −11 °C or lower.
Jahn [22] examined 300 kW air-conditioning systems used to protect computer servers from overloading at a bank. In that case, cold water condensed R744 at 6 °C. R744 was directed to the server cabinet using a centrifugal pump wherein it evaporated, and subsequently, R744 returned to the condenser. Hinde et al. [5] examined nine low-temperature refrigeration systems using R744 in the USA and Canada in early 2008. In the study, R404A or R507 were used as the primary refrigerants; propylene glycol was used as the medium-temperature secondary refrigerant; and R744 was used as the low-temperature secondary refrigerant. The systems were installed at various locations, ranging from small stores to large supermarkets. Their refrigeration capacity was in the range of 22–160 kW. They investigated the secondary refrigerant system installed in the largest store in North America (total floor area: 11,000 m2). This system could reduce R507 refrigerant charging by up to 90%; that is, the refrigerant charge in the large store could be reduced from 1633 to 159 kg. Propylene glycol and R744 were used as the secondary refrigerants for the medium-temperature and low-temperature systems. The carbon emissions were reduced by 7%.
Kaga et al. [23] developed a compact refrigeration system with an inverter compressor that used R600a as the primary refrigerant and R744 as the secondary refrigerant; the refrigerant was circulated via the thermosiphon effect. The coefficient of performance (COP) of the system was in the range of 2.1–2.6. Its refrigeration capacity was in the range of 170–230 kW depending on the evaporating temperature (ET), and the energy consumption was less than 5% of that of a direct expansion system with R134a. Sawalha and Palm [24] examined direct expansion refrigeration systems with R404A, ammonia, and propane refrigerants (R404A-DX) and an R404A/R744 indirect expansion refrigeration system (hereafter referred to as R404A/R744-IX when the R744 refrigerant is used as the brine); they conducted theoretical and experimental investigations of the effects of direct and indirect expansion on the pressure and temperature drop in the suction tube and compared the results. They reported that the gas phase, which is a single phase, flowed in the suction tube of R404A-DX. The gas-phase pressure drop for R404 or R502 was 3 to 3.5 times higher than that for R744 because the gas-phase pressure drop is proportional to the boiling point and molecular weight of the refrigerant. They also examined the pressure drop and temperature distribution in the air cooler, suction pipe, and evaporator for R404A with respect to R404A-DX and R404A/R744-IX as well as the power consumption of the compressor (PCC). The power consumption of R404A/R744-IX was lower than that of R404A-DX.
Despite numerous studies on the IRS (Table 2), the IRS with R404A as the primary refrigerant and R744 as the secondary fluid has not been extensively investigated. In addition, in the few cases where an internal heat exchanger (IHX) has been applied, simple comparisons have been made between systems with and without an IHX, and no extensive studies have been conducted for different efficiencies of the IHX, which improves the performance of refrigeration systems. Moreover, to the best of our knowledge, analyses of exergy on the refrigeration system with an IHX are lacking. Therefore, in this study, exergy was analyzed according to the degree of subcooling (DSB) and degree of superheating (DSP) of the R404A cycle, DSP of the R744 cycle, condensing temperature (CT), cascade evaporating temperature (CET), and IHX efficiency under constant conditions to identify the exergy characteristics of a low-temperature (−35 to 5 °C) R404A IRS using an IHX and R744 as the secondary fluid. This study aims to provide basic data for the optimal design of a low-temperature (−35 to 5 °C) R404A IRS using an IHX and R744 as the secondary fluid.

2. Test Apparatus and Data Analysis
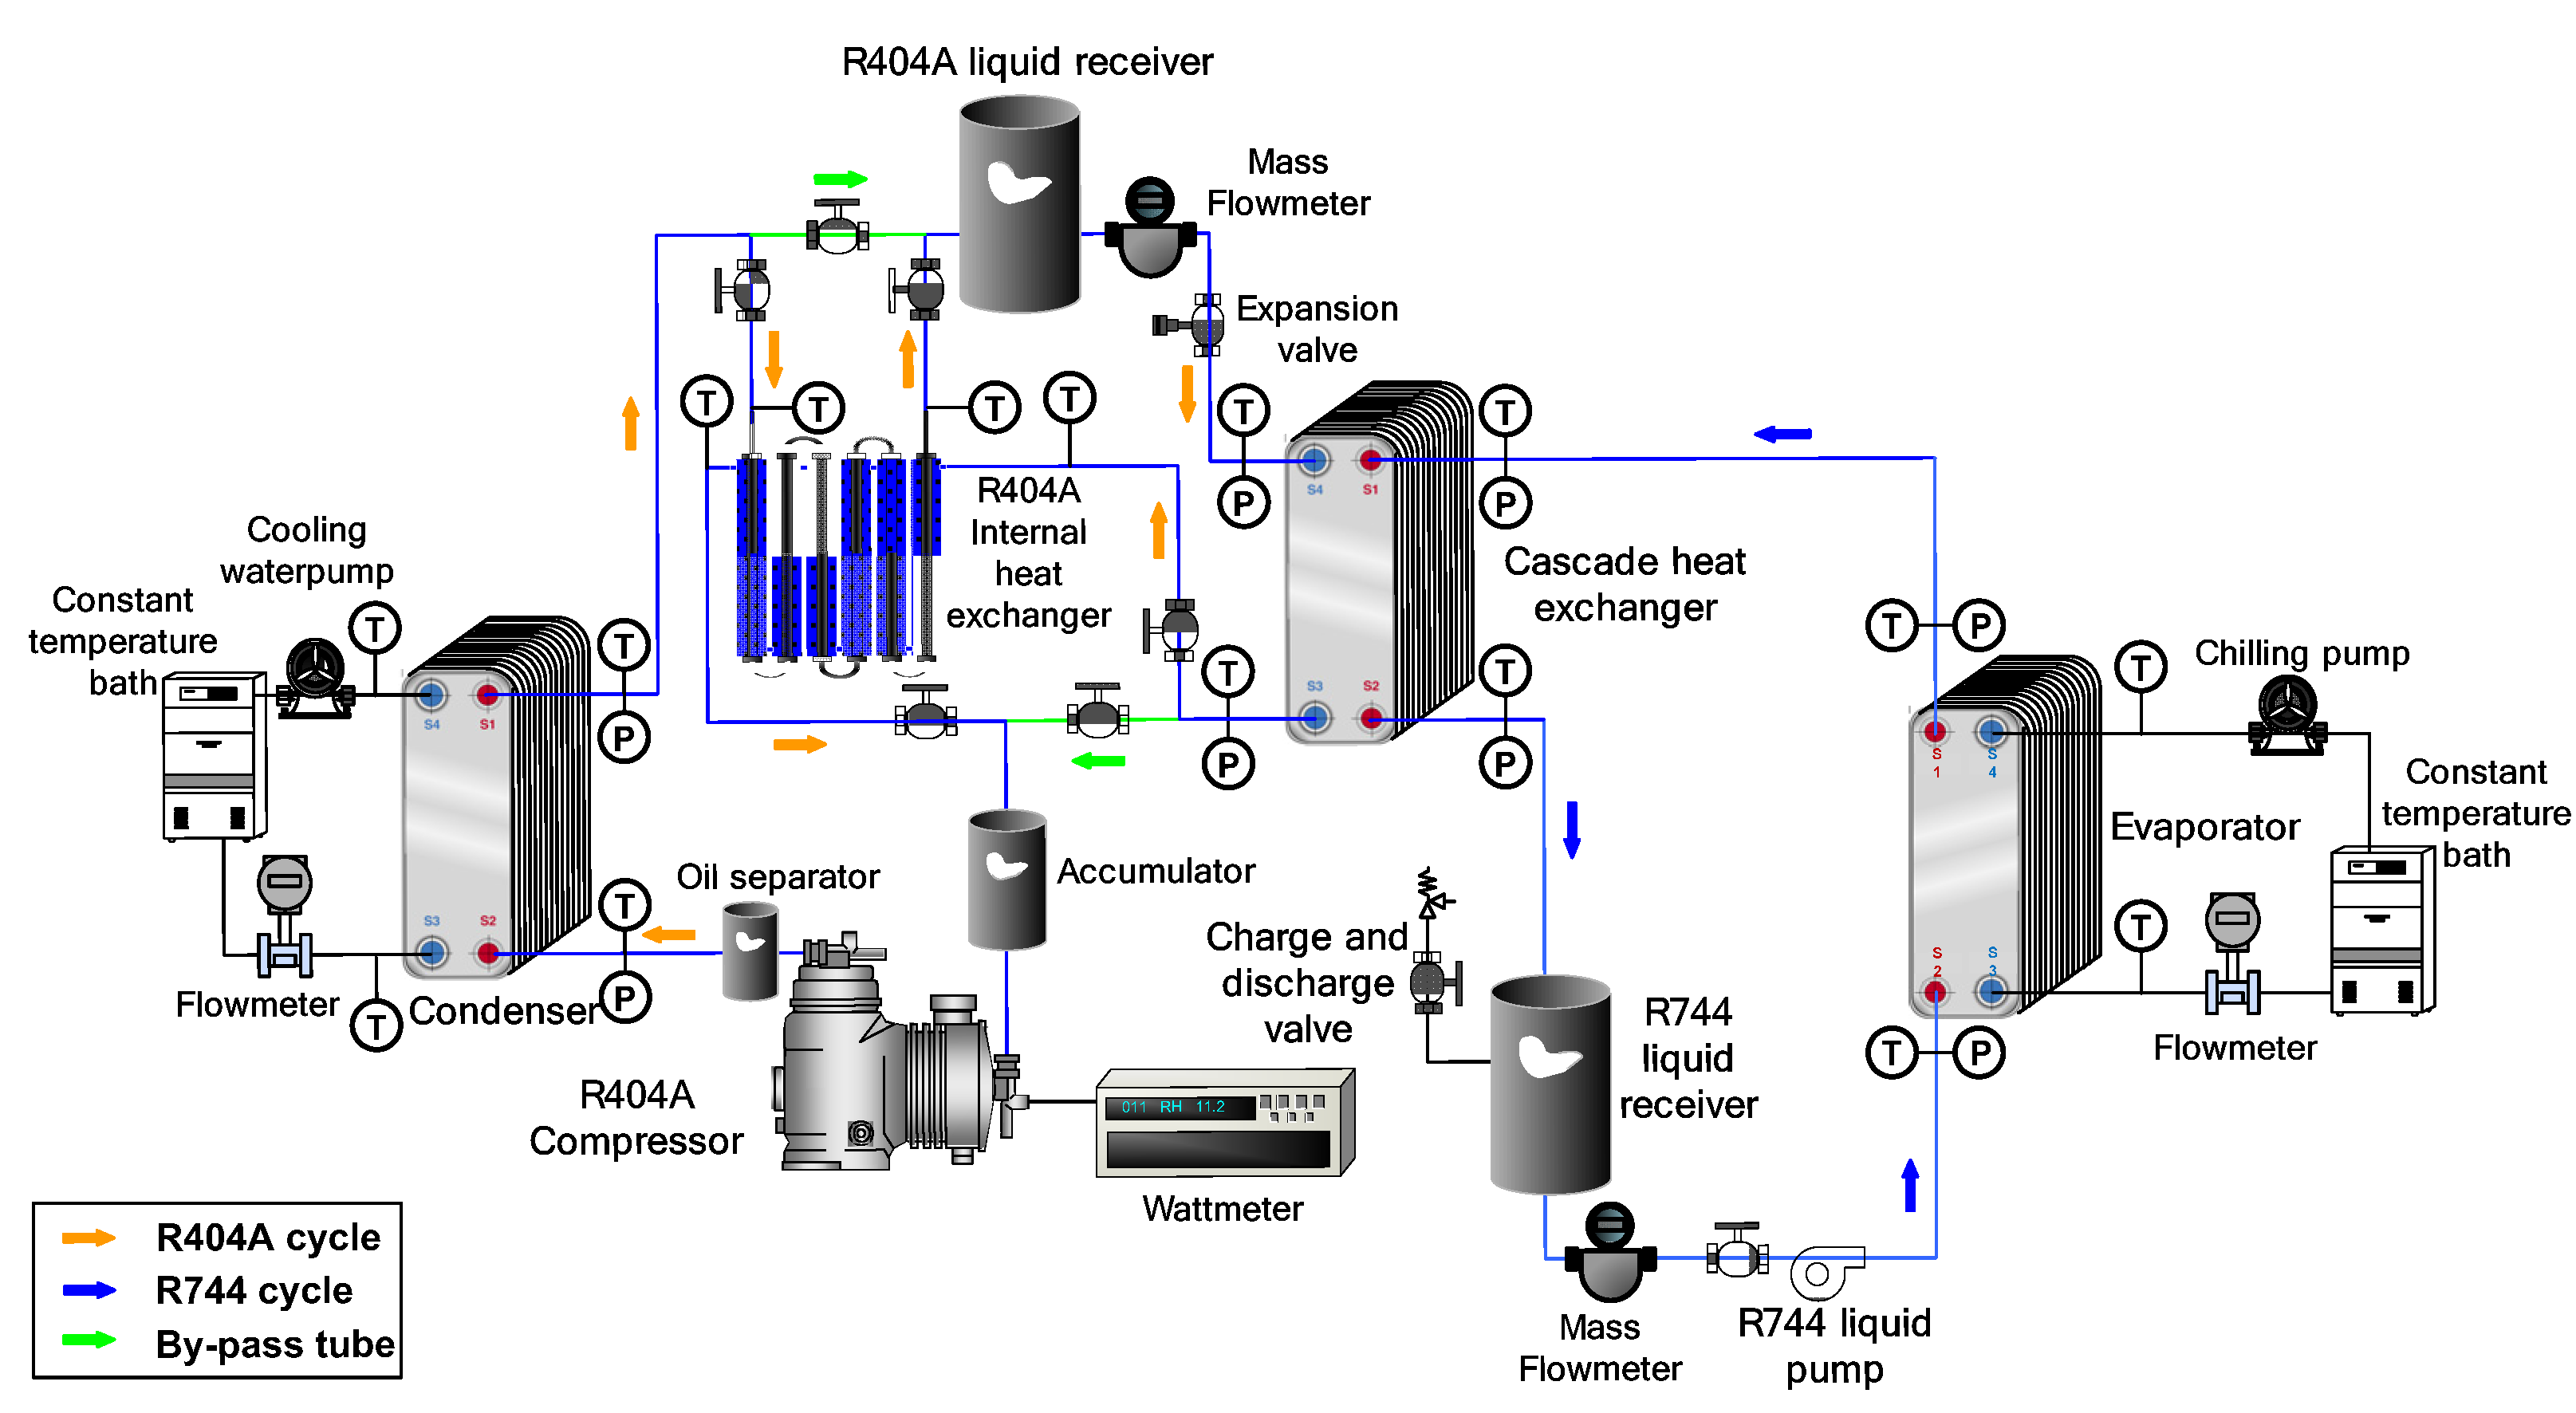
An R404A IRS with an IHX that uses R744 as the secondary fluid was constructed to achieve a low temperature of −35 to 5 °C. The factors (the CET ( T E , CAS ), DSB ( Δ T SUB , R 404 A ), DSP ( Δ T SUP , R 404 A , Δ T SUP , R 744 ), R404A IHX efficiency ( η IHX , R 404 A ), and CT of the R404A cycle ( T C )) affecting the R404A IRS were identified via experiments to analyze exergy.

2.1. Test Apparatus

Figure 1 shows a photograph of the constructed IRS using R744 as the secondary fluid. A schematic of the test apparatus [25], used to analyze the exergy characteristics of the R404A IRS, is shown in Figure 2. The refrigerant temperature, pressure, mass flow rate (MFR) at the inlet and outlet of each IRS component, and PCC were measured for exergy analysis. The test apparatus, conditions (summarized in Table 3), and procedure are identical to those reported in a previous study [25].
Table 4 summarizes the characteristics of the main components of the test apparatus.

2.2. Data Reduction

The thermal properties of R404A and R744 were calculated using REFPROP (version 8.01), which is a software program developed by the National Institute of Standards and Technology (NIST), Gaithersburg, MD, USA to examine refrigerant characteristics. The obtained thermal properties were used to investigate the COP of the system ( COP SYS ), MFR, and exergy characteristics of the R404A IRS with an IHX that uses R744 as the secondary fluid. The test data comprising COP SYS and exergy were analyzed in a manner identical to that reported in previous studies [25,26]. The exergy of the R404A IRS with an IHX was analyzed by calculating the exergy destruction rate ( Ex D , kW) of each component using the formulae listed in Table 5, and the total COP (COPSYS) of the system was calculated using Formula (1):
COP SYS = Q E W COM , R 404 A + W PUM , R 744
The mass flow ratio ( m ˙ RATIO ) of the CRS was calculated using Formula (2):
m ˙ RATIO = m ˙ R 404 A m ˙ R 744
Exergy can be obtained using the following formula under given temperature and pressure conditions [26].
Ex ˙ k = m ˙ h k h 0 T 0   s k s 0
Ex ˙ k Ex ˙ m = m ˙ h k h m T 0   s k s m
The exergy efficiency of the system was calculated using Formula (5) with reference to Sun et al. [26].
η Ex , SYS = Ex ˙ F , SYS Ex ˙ D , SYS Ex ˙ F , SYS
Here, Ex ˙ F , SYS is the sum of the power consumption of the compressor and the pump.
The formulae presented in previous papers [25,26] and Table 5 were used to compute the exergy destruction rate (EDR) of each component, EDR of the system ( Ex D , SYS ), and exergy efficiency of the system ( η Ex , SYS ) according to the CT, CET, IHX efficiency, DSP, and DSB of the R404A cycle and ET, DSP, and MFR of the R744 cycle. These factors affect the COP and exergy of the R404A IRS with R744. Figure 3 shows a conceptual diagram of the R404A IRS with an IHX that uses R744 as the secondary fluid.

2.3. Uncertainties

The test data used in engineering interpretation or design are not accurate. The uncertainties in the test results were estimated using the formulae proposed by Kline and McClintock [30] and Moffat [31] and are listed in Table 6.

3. Results

The exergy characteristics of the IRS with an IHX that uses R744 as the secondary refrigerant were analyzed to obtain basic design data. The EDR of each component, EDR of the system, and exergy efficiency of the system (EES) were examined according to the CT, R404A IHX efficiency, CET, DSB of the R404A cycle, and DSP of the R404A and R744 cycles.

3.1. Effect of the DSP

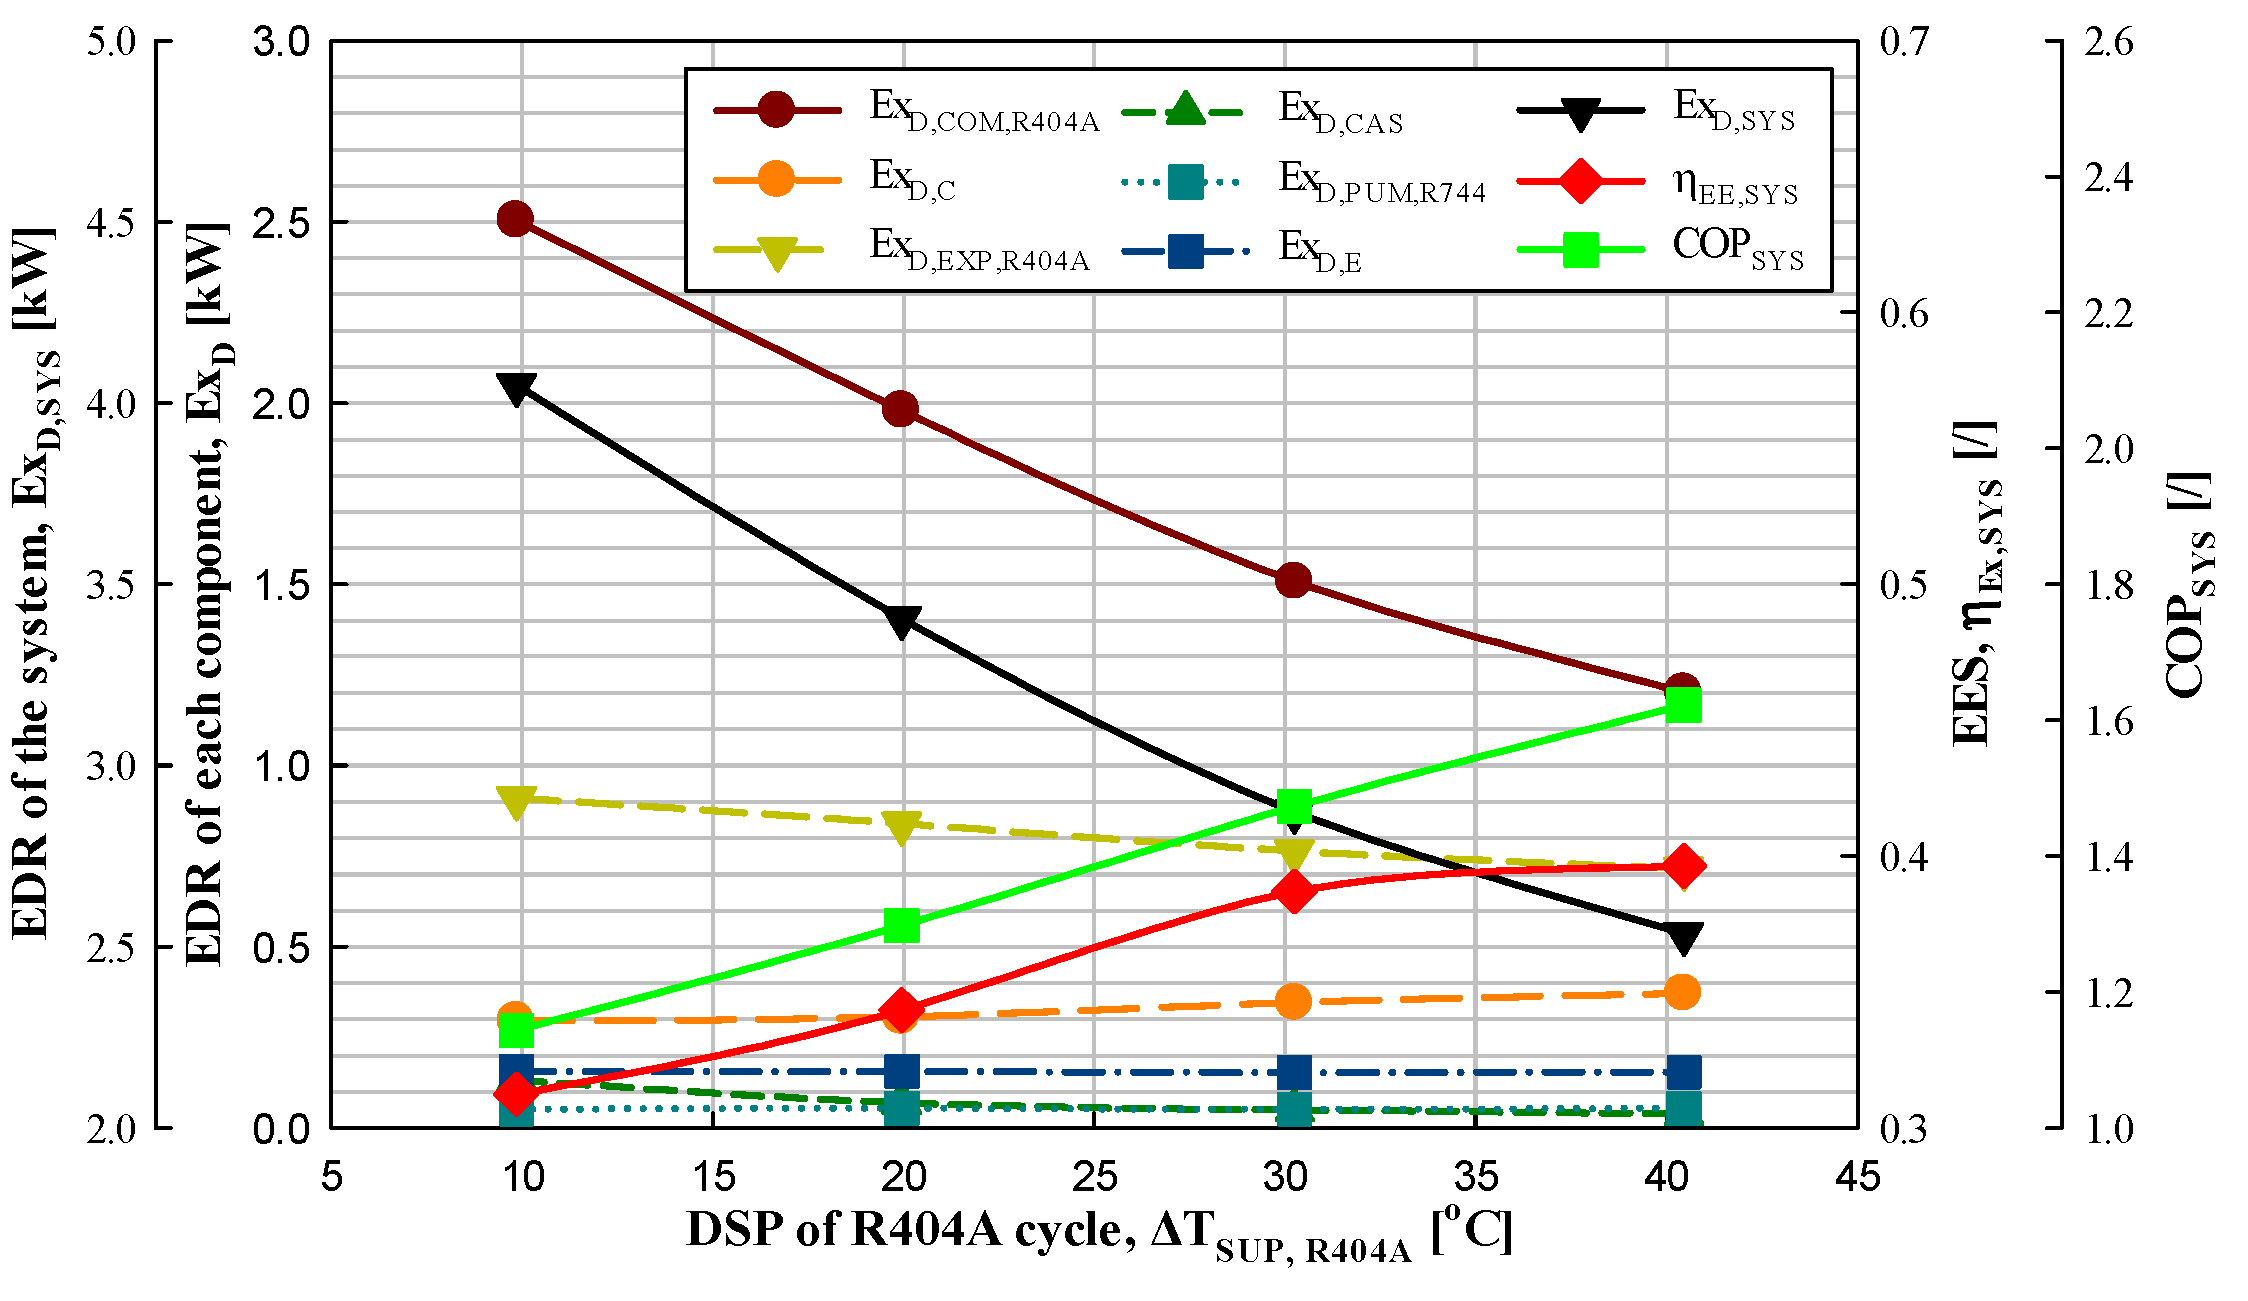
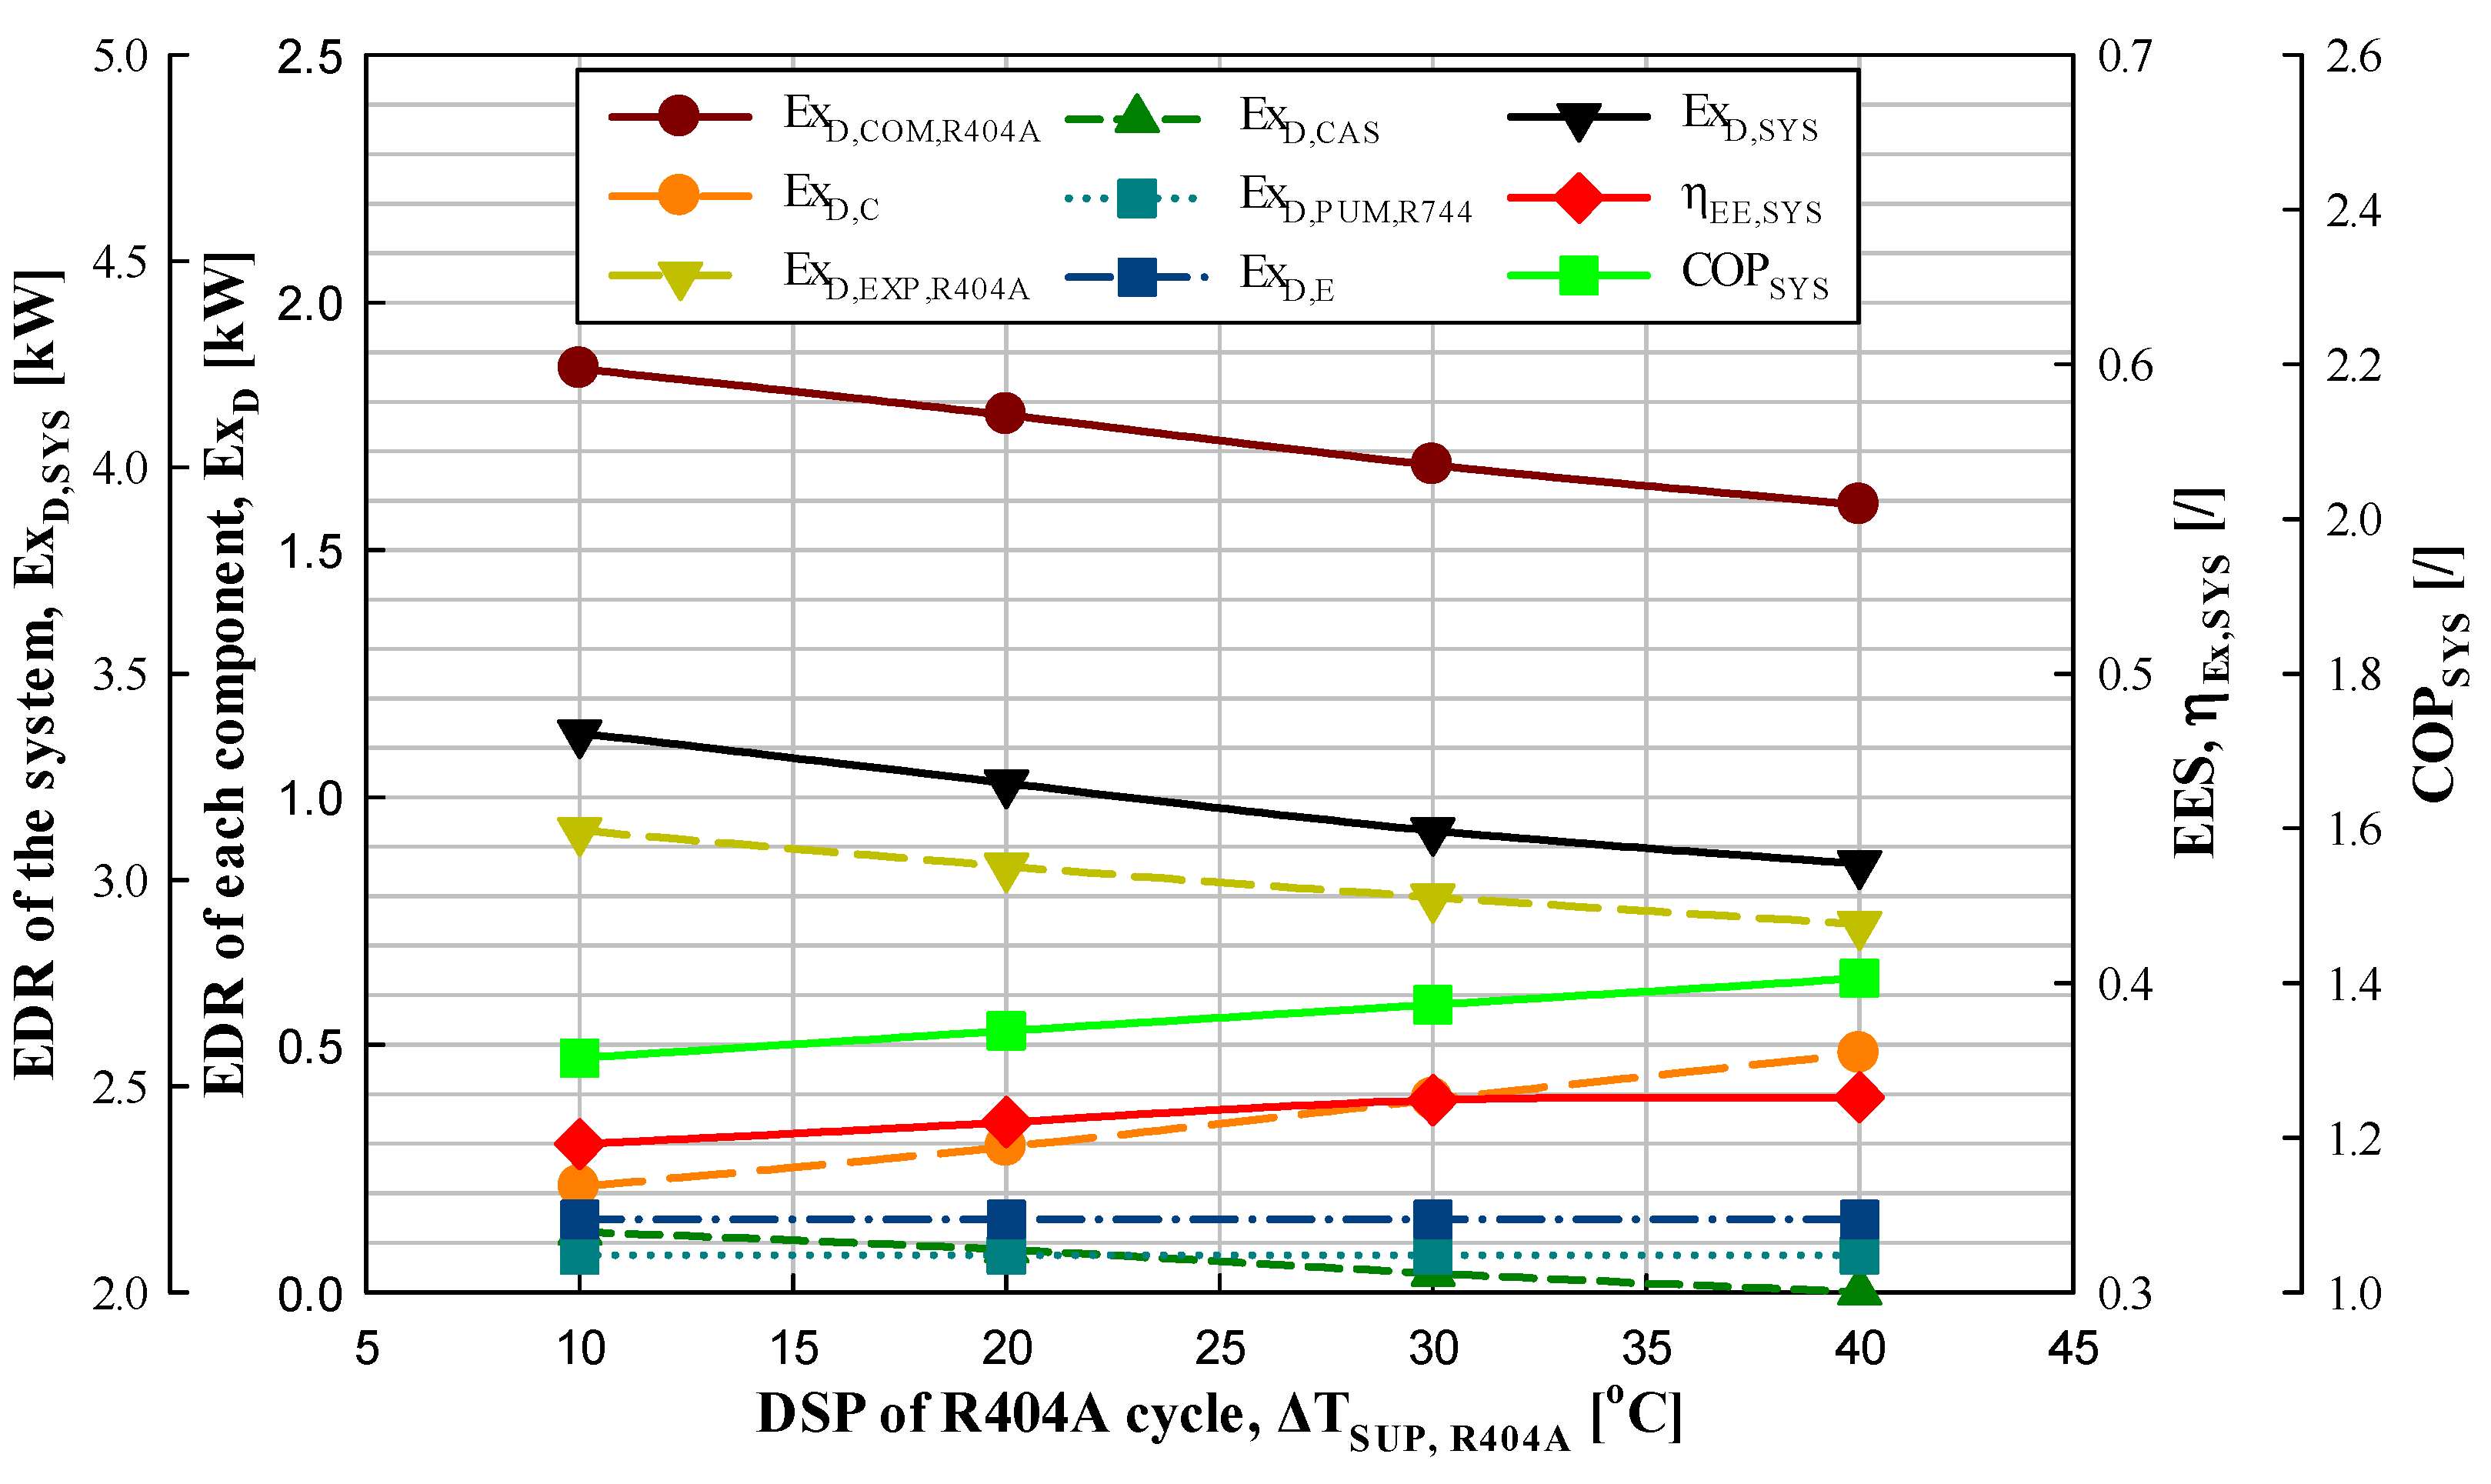
3.1.1. Effect of the DSP of the R404A Cycle

The changes in the EDR of each component, system EDR, and EES with an increase in the DSP of the R404A cycle were experimentally evaluated under constant conditions (QE = 6.73–6.82 kW; TE = −21.5–−21.3 °C; TCAS,E = −25.4–−24.9 °C; TC = 39.8–40.1 °C; ΔTSUB,R404A = 1.1–1.4 °C; ΔTSUP,R744 = 9.5–10.6 °C; ΔTSUB,R744 = 1.3–1.9 °C; ΔTCAS = 3.5–3.9 °C; and ηIHX,R404A = 0). The DSP was increased from 9.9 to 40.5 °C in approximately 10 °C increments. The observed trends are shown in Figure 4.
As the DSP of the R404A cycle in the IRS increased from 9.9 to 40.5 °C (in approximately 10 °C increments), the EDR of the system decreased by 11.7–15.9% and the EES increased by 2.4–12.7%. The variation in the COP of the system was similar to the variation in the EES. The changes in the EDRs of the pump (3.8–5.2% increase) and evaporator (0.1–2% decrease) of the R744 cycle were negligible. The EDR of the condenser of the R404A cycle increased by 4.1–12.6%, whereas those of the compressor, EV, and cascade heat exchanger (CHX) of the cycle decreased by 20.3–23.8%, 6.3–9.1%, and 22.3–47.5%, respectively.
The change in the EDR of the R744 cycle with an approximately 10 °C increase in the DSP of the R404A cycle was negligible because there was no change in the MFR or all the conditions in Table 5. In contrast, the EDRs of the compressor, EV, and CHX decreased in the R404A cycle because the MFR decreased by 6.3–7.7%. However, the EDR of the condenser (ExD,C) increased. The EDR of the condenser was calculated by adding the EDR of the inlet and outlet refrigerant (ExF,C: +) and the EDR due to condensation heat (ExP,C: −), as shown in Table 5. The EDR of the refrigerant (ExF,C) as well as the EDR due to condensation heat (ExP,C) decreased with a decrease in the refrigerant flow rate. However, the inlet entropy (IE) of the condenser (s2) increased despite minimal changes in the outlet entropy (OE) of the condenser (s4). Consequently, the reduction in the EDR by condensation heat (ExP,C) is significant due to the reduction in condensation heat, while the reduction in the EDR of the condenser inlet and outlet refrigerant (ExF,C) is insignificant. Hence, the EDR of the condenser (ExD,C) increased. Therefore, it can be concluded that the EDR of the system (ExD,SYS) decreases and the EES and COP of the system increase with an increase in the DSP of the R404A cycle. These results are in good agreement with the results reported by Yılmaz et al. [32].

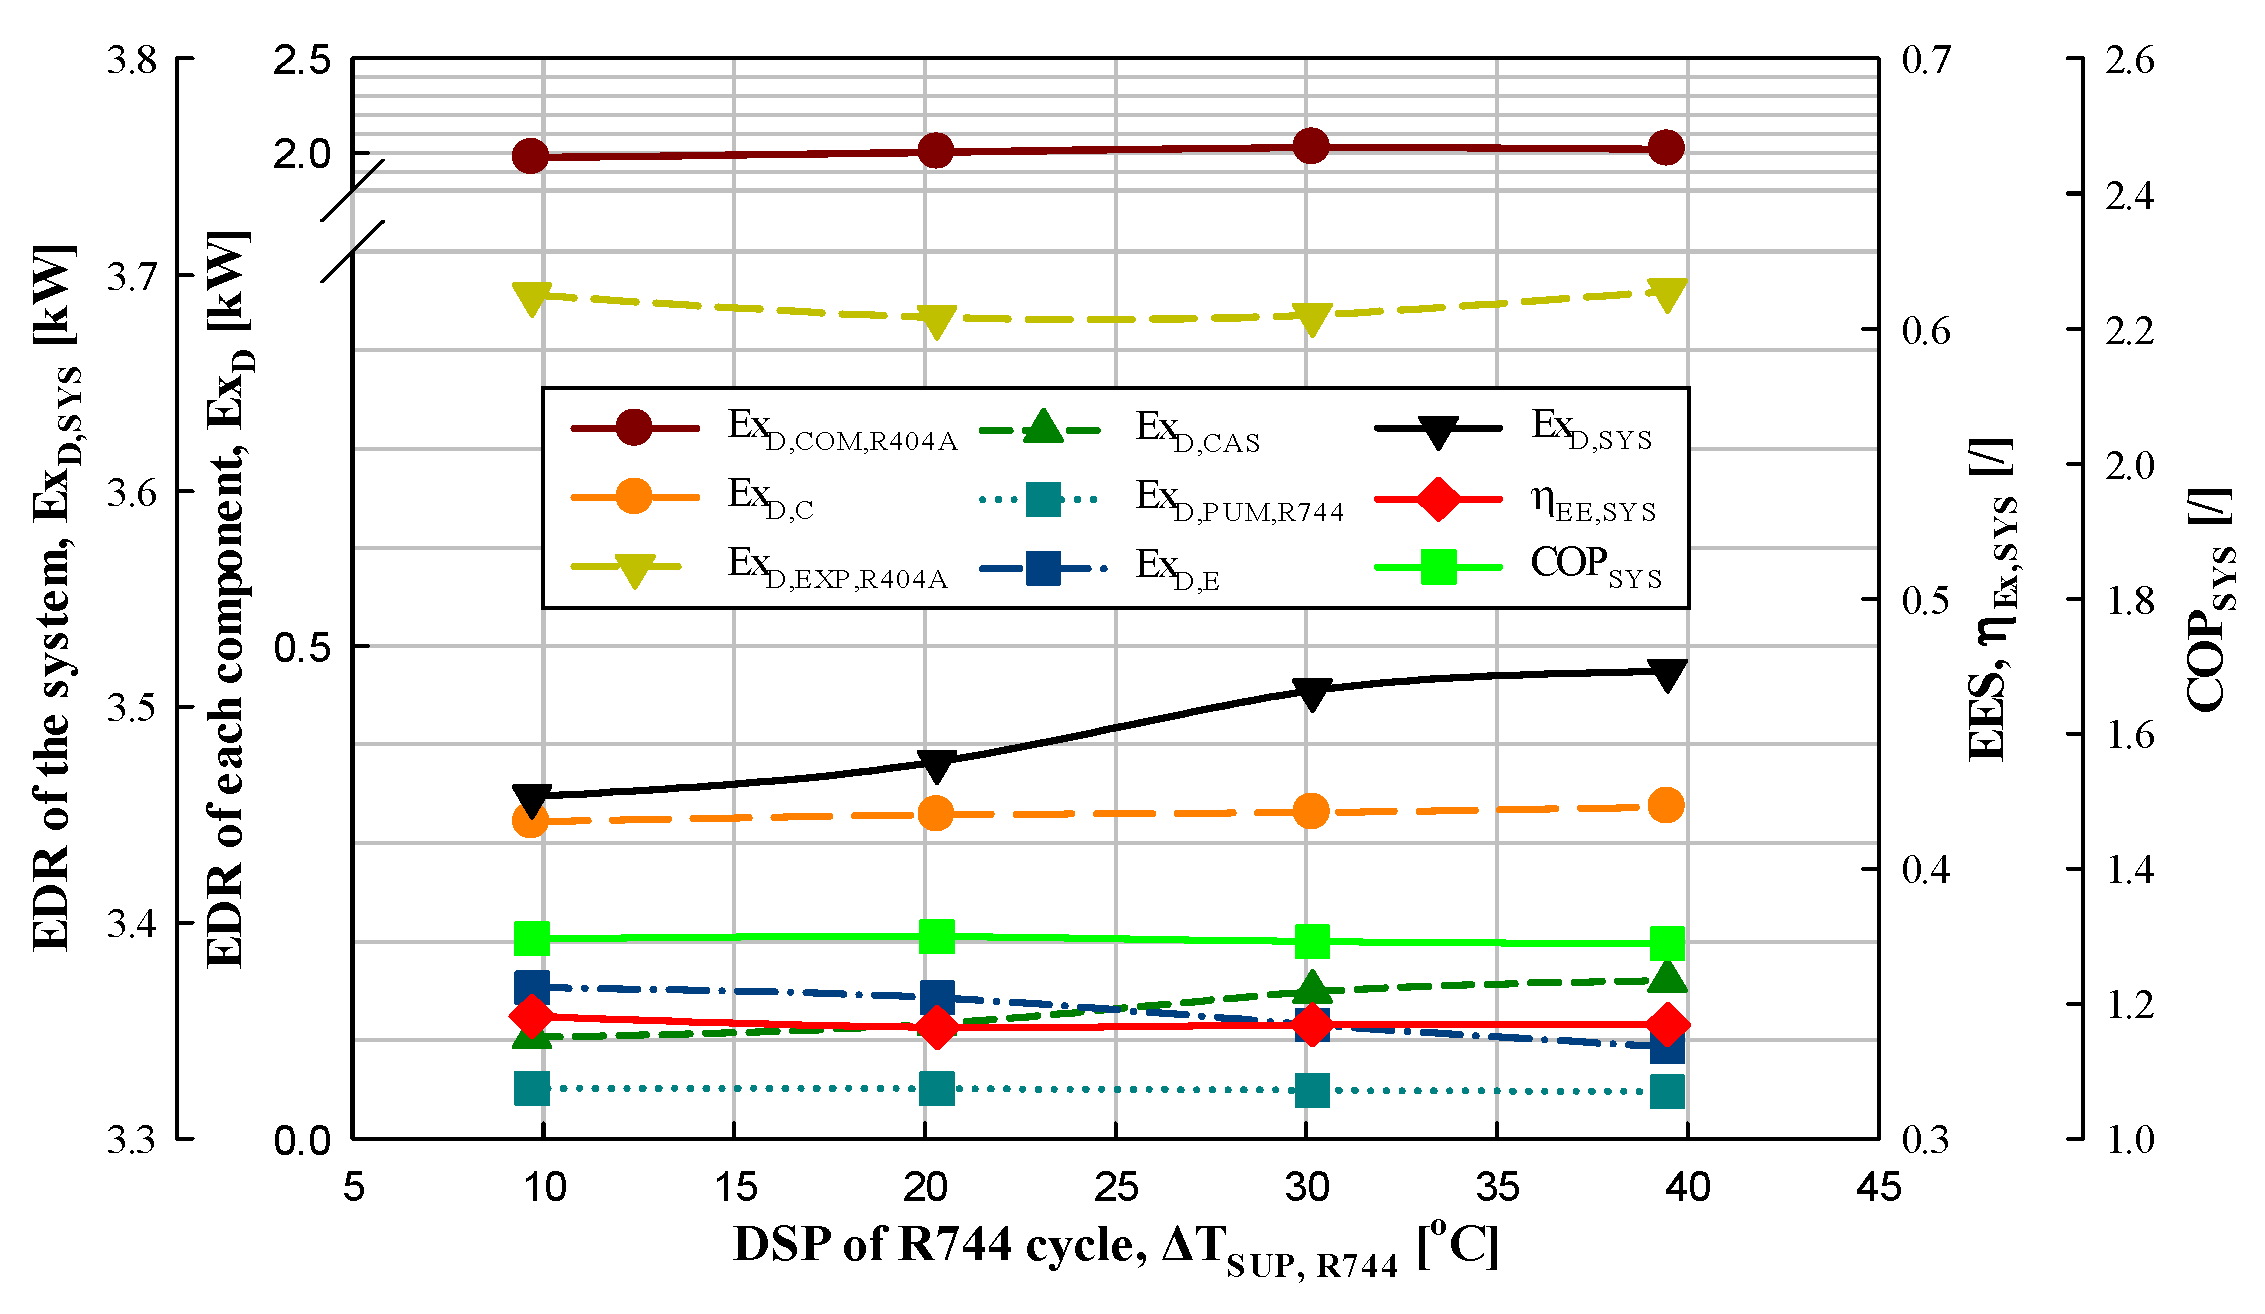
3.1.2. Effect of the DSP of the R744 Cycle

The variations in the EDR of each component, exergy efficiency, and EDR of the system with an increase in the DSP of the R404A cycle were experimentally evaluated under constant conditions (QE = 6.85–6.89 kW; TE = −21.3–−21.0 °C; TCAS,E = −25.4–−24.9 °C; TC = 39.8–40.1 °C; ΔTSUP,R404A = 19.7–20.1 °C; ΔTSUB,R404A = 1.1–1.3 °C; ΔTSUB,R744 = 1.1–1.6 °C; ΔTCAS = 3.4–3.9 °C; and ηIHX,R404A = 0). The DSP was increased from 9.7 to 39.5 °C in approximately 10 °C increments. The observed trends are shown in Figure 5.
As the DSP of the R744 cycle in the IRS increased from 9.7 to 39.5 °C, the EDR of the system increased by 0.3–1% and the EES decreased and then increased by 0.04–1.17%. The EDRs of the pump and the evaporator in the R744 cycle decreased by 1.1–3.2% and 6.8–19.4%, respectively. The EDRs of the compressor, condenser, and EV in the R404A cycle increased or decreased by 0.4–1.4%, 0.9–2%, and 0.3–2.9%, respectively, whereas that of the CHX increased by 8.1–27.5%. As the DSP of the R744 cycle increased by approximately 10 °C, the EDRs of the pump and evaporator in the R744 cycle decreased because the MFR in the cycle decreased by 3–3.7%; in contrast, the EDRs of the condenser, compressor, and EV in the R404A cycle remained largely constant because the MFR, DSP, and DSB were constant. The EDR of the CHX (ExD,CAS) was calculated as the sum of the EDRs of the cascade evaporator (CE) (ExD,E,CAS: +) and CC (ExD,C,CAS: −). The change in the EDR of the CE in the R404A cycle was negligible. In contrast, the EDR of the CC in the R744 cycle decreased as the R744 MFR decreased. The EDR of the CHX increased by 8.1–27.5%. The EDRs of the condenser, compressor, and EV in the R404A cycle did not change. The sum of the EDRs of the pump and evaporator in the R744 cycle decreased by 5.1–14.9%. Consequently, the EDR of the system increased.
In other similar studies [33] and theory, it was found that the EES decreases slightly as the DSP of the R744 cycle increases. However, the reason for the slight decrease and increase in the EES in the present experimental results is that the temperature and pressure were kept as constant as possible in the experiments, and the small differences in temperature and pressure are thought to be the cause of the error in the EES. The effect of increasing the DSP in the R744 cycle can be considered insignificant for the R404A IRS.

3.2. Effect of the DSB

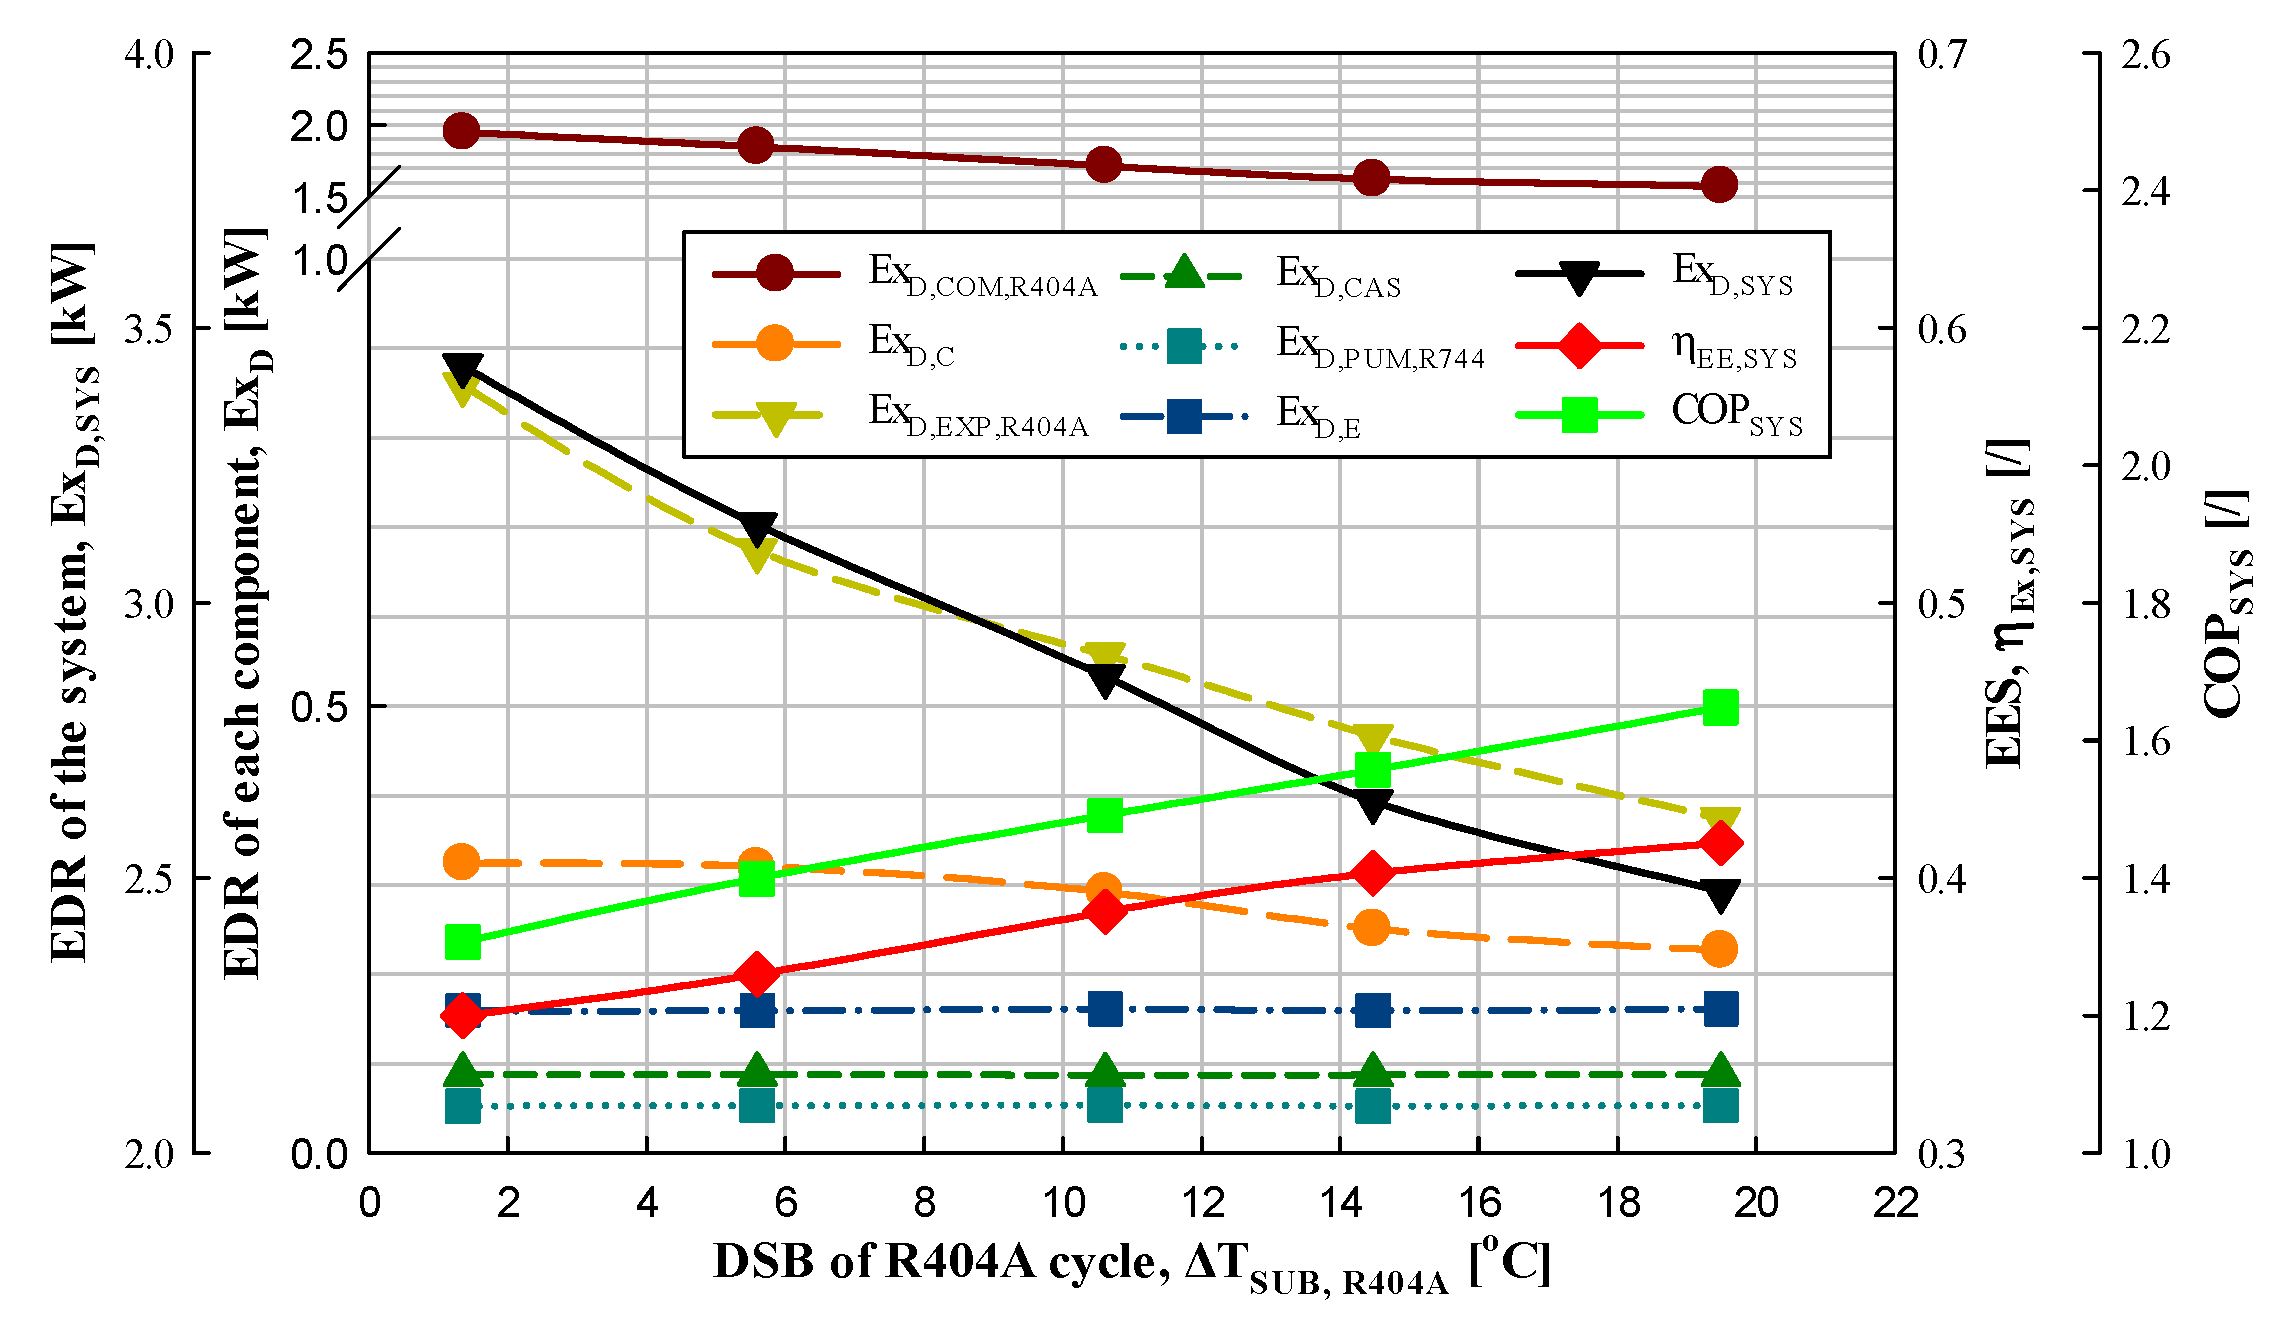
Effect of the DSB of the R404A Cycle

The changes in the EDR of each component, EDR of the system, and EES with an increase in the DSB of the R404A cycle were experimentally evaluated under constant conditions (QE = 6.87–6.95 kW; TE = −21.8–−21.4 °C; TCAS,E = −25.5–−24.7 °C; TC = 39.8–40.3 °C; ΔTSUP,R404A = 19.6–20.4 °C; ΔTSUP,R744 = 9.7–10.2 °C; ΔTSUB,R744 = 1.1–1.5 °C; ΔTCAS = 3.1–3.5 °C; and ηIHX,R404A = 0). The DSP was increased from 1.4 to 19.5 °C in approximately 4.5 °C increments. The observed trends are shown in Figure 6.
As the DSB of the R404A cycle in the IRS increased from 1.4 to 19.5 °C (in approximately 4.5 °C increments), the EDR of the system decreased by 6.1–8.8% and the EES increased by 2.7–6.2%. The increase in the EES was accompanied by an increase in the COP of the system. In addition, as the DSB of the R404A cycle increased from 1.4 to 19.5 °C, the EV, evaporator, and MFR of the R744 cycle, as well as the EDR of the CHX, hardly changed; in contrast, the EDRs of the condenser, compressor, and EV in the R404A cycle decreased by 3–7.2%, 1.3–14.1%, and 16.4–21.7%, respectively. The EDRs of the pump and evaporator in the R744 cycle did not change with an increase in the DSB of the R404A cycle because the MFR and other conditions in the R744 cycle did not change based on the formulae in Table 5. Moreover, the EDR of the CHX did not change because the increase in the ethalpy difference in the inlet and outlet of the CE (s8 − s6) due to the decrease in the IE of the CE (s6) caused by the increase in the DSB was offset by the reduction in the MFR caused by energy equilibrium even though there was no change in the EDR of the condenser in the R744 cycle and the evaporation heat capacity (EHC) in the R404A cycle. The EDR of the compressor in the R404A cycle decreased because the MFR decreased by 5.5–6%. The EDR of the condenser was calculated as the sum of the refrigerant EDR at the condenser inlet and outlet (ExF,C: +) and the EDR due to the condensation heat capacity (ExP,C: −), as shown in Table 5. With an increase in the DSB, the IE of the condenser (s2) remained constant, whereas the OE (s4) decreased, thereby increasing the entropy difference (s2 − s4) between the inlet and outlet of the condenser. However, the refrigerant EDR and the EDR due to condensation heat capacity decreased. The EDR of the condenser decreased because the decrease in the refrigerant EDR was large. The EDR of the EV was calculated as the sum of the EDR due to pressure drop (ExF,EXP,R404A or ExD,EXP,R404AM) and the EDR due to temperature drop (ExP,EXP,R404A or ExD,EXP,R404AT), as shown in Table 5. The EDR of the EV decreased because the EDR by pressure drop decreased under the dominant influence of the MFR reduction as the CT increased while the EDR by temperature drop increased due to the large temperature difference.
Thus, the EDR of the system decreases and the EES and COP of the system increase as the DSB of the R404A cycle increases. These results are in good agreement with the results reported by Yılmaz et al. [32].

3.3. Effect of CT

The changes in the EDR of each component, EDR of the system, and EES with an increase in the IRS CT were experimentally evaluated under constant conditions (QE = 6.81–6.88 kW; TE = −21.6–−21.3 °C; TCAS,E = −25.3–−24.4 °C; ΔTSUP,R404A = 19.5–20.5 °C; ΔTSUB,R404A = 1.0–1.5 °C; ΔTSUP,R744 = 9.8–10.7 °C; ΔTSUB,R744 = 1.2–1.4 °C; ΔTCAS = 2.8–3.5 °C; and ηIHX,R404A = 0). The CT was increased from 20.1 to 49.7 °C in approximately 10 °C increments. The observed trends are shown in Figure 7.
As the CT increased from 20.1 to 49.7 °C (in approximately 10 °C increments), the EDR of the system increased by 35–47%, whereas the EES decreased by 4–6.9%. The variation in the COP of the system was similar to that of the EES. The changes in the EDRs of the pump and evaporator in the R744 cycle were negligible because the MFR, ET, CT, DSP, and DSB of the cycle remained constant. The EDRs of the condenser, compressor, and EV in the R404A cycle increased by 39.8–47.8%, 23.9–56.3%, and 57.3–71.1%, respectively.
With an increase in the CT, the IE (s1) of the compressor in the R404A cycle remained constant, whereas the OE (s2) increased, thereby increasing the difference in the compressor IE and OE (s2 − s1). The EDR of the compressor was calculated as the sum of the PCC (ExF,COM,R404A: +) and the refrigerant EDR at the compressor inlet and outlet (ExP,COM,R404A: −). The PCC and the refrigerant EDR increased with increasing CT. The EDR of the compressor increased because the magnitude of the increase in the PCC (a positive value) was larger than the magnitude of the increase in the refrigerant EDR. The EDR of the condenser was calculated as the sum of the refrigerant EDR (ExF,C: +) at the condenser inlet and outlet and the EDR (ExP,C: −) due to the condensation heat capacity. Both the IE and OE of the condenser (s2 and s4) increased with increasing CT. The differences (s2 − s4) in the IE and OE of the condenser decreased because the magnitude of the increase in the OE (s4) of the condenser was larger than that at the IE (s2). The refrigerant EDR and the EDR due to the condensation heat capacity increased because the effect of the increase in the MFR was dominant. The EDR of the condenser increased because the magnitude of the increase in the refrigerant EDR was larger than the magnitude of the increase in the EDR due to the condensation heat capacity. The IE and OE of the EV (s4 and s6) increased with increasing CT; the differences in the IE and OE (s6 − s4) increased because the magnitude of the increase in the OE was larger. The EDR of the EV increased because the EDR increased due to a pressure drop and the EDR decreased due to a temperature drop. The EDR of the CHX was constant because the reduction in the enthapy difference in the inlet and outlet (s8 − s6) of the CE due to the increase in the CE inlet entropy (s6) and constant outlet entropy (s8) were offset by the rise in the MFR of the R404A cycle caused by an energy equilibrium even though the condensation heat capacity and MFR of the R744 cycle and the EHC of the R404A cycle were constant. Thus, the EDR of the system increases as the CT of the R404A cycle increases, thereby reducing the COP of the system and EES. These results are in good agreement with results reported by Hendri et al. [34], Parekh and Tailor [35], and Kilicarslan and Hosoz [36].

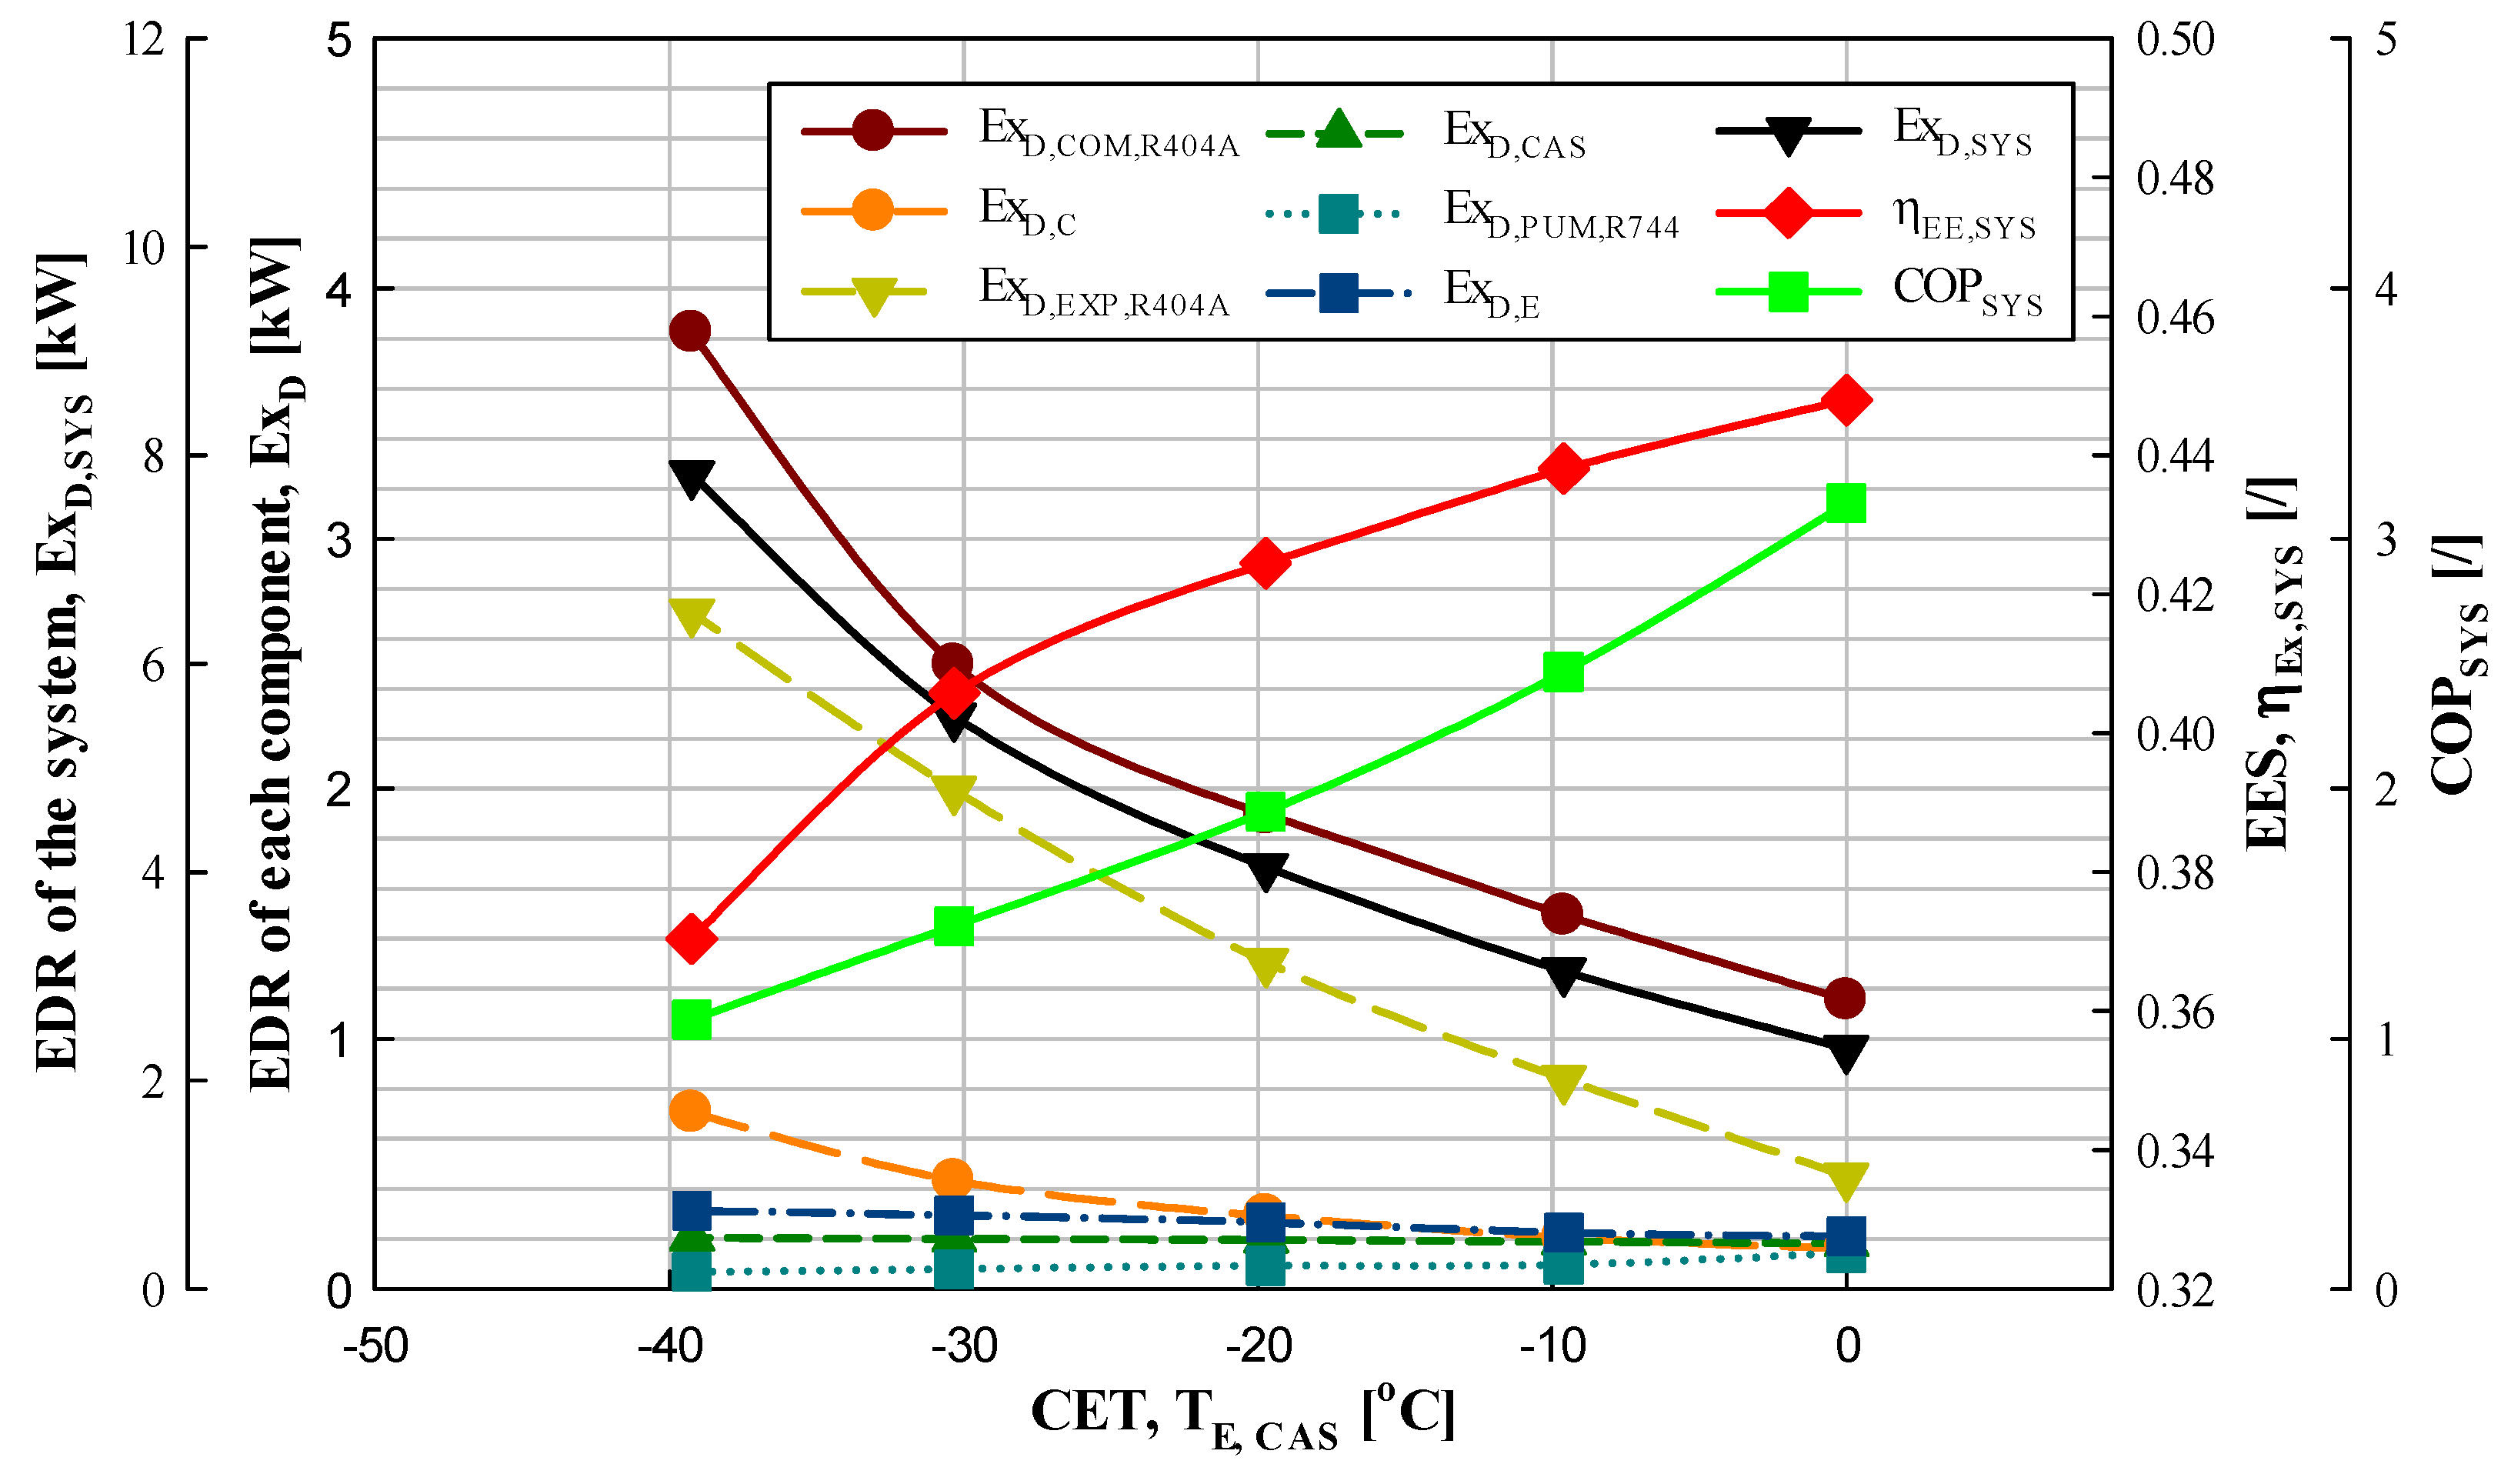
3.4. Effect of the CET

The variations in the EDR of each component, EDR of the system, and EES with an increase in the CET were experimentally evaluated under constant conditions (QE = 13.37–13.45 kW; TE = −35.5–3.5 °C; TC = 39.8–40.2 °C; ΔTSUP,R404A = 19.7–20.4 °C; ΔTSUB,R404A = 1.4–1.6 °C; ΔTSUP,R744 = 19.8–20.3 °C; ΔTSUB,R744 = 1.0–1.6 °C; ΔTCAS = 3.1–3.5 °C; and ηIHX,R404A = 0). The ET was increased from −39.2 to 0 °C in ~10 °C increments. The observed trends are shown in Figure 8.
As shown in Figure 8, the EDR of the system increased by 29.4–41.9% and the EES decreased by 2.2–8.7% as the CET increased from −39.2 to 0 °C. The variation in the COP of the system was similar to the variation in the EES. In the R744 cycle, the EDR of the pump decreased by 4.4–15%, whereas that of the evaporator increased by 6.3–18.1%. In the R404A cycle, the EDRs of the compressor, condenser, EV, and CE increased by 23.8–52.3%, 26.6–63.2%, 35.6–86.6%, and 1.9–3.9%, respectively. In the R744 cycle, only the EDR of the pump decreased as the CET increased. This can be attributed to the decrease in the MFR and PCC of the R744 cycle, with no change in the refrigerant EDR as the CET increased, based on the formulae in Table 5.
The EDR of the evaporator increased despite the reduction in the MFR of the R744 cycle. This is because the OE of the evaporator (s12) increased and the IE (s15) decreased, thereby leading to an increase in the difference in the evaporator IE and OE (s12 − s15). The EDR of the evaporator in the R744 cycle (ExD,E) was calculated as the sum of the refrigerant EDR at the evaporator inlet and outlet (ExF,E: +) and the EDR due to the EHC (ExP,E: −). Because the influence of the entropy difference is more dominant despite the reduction in the MFR, the refrigerant EDR and the EDR due to the EHC of the R744 cycle increased. The magnitude of the increase in the refrigerant EDR was larger than the magnitude of the increase in the EDR due to the EHC; hence, the EDR of the evaporator in the R744 cycle increased. The increases in the EDRs of the condenser, compressor, EV, and CE in the R404A cycle were attributed to the dominant effect of the increase in the MFR.
Thus, the EDR of the system decreases as the CET increases, thereby increasing the COP of the system and EES. These results are in good agreement with the results reported by Shilliday et al. [37] and Yi [38].

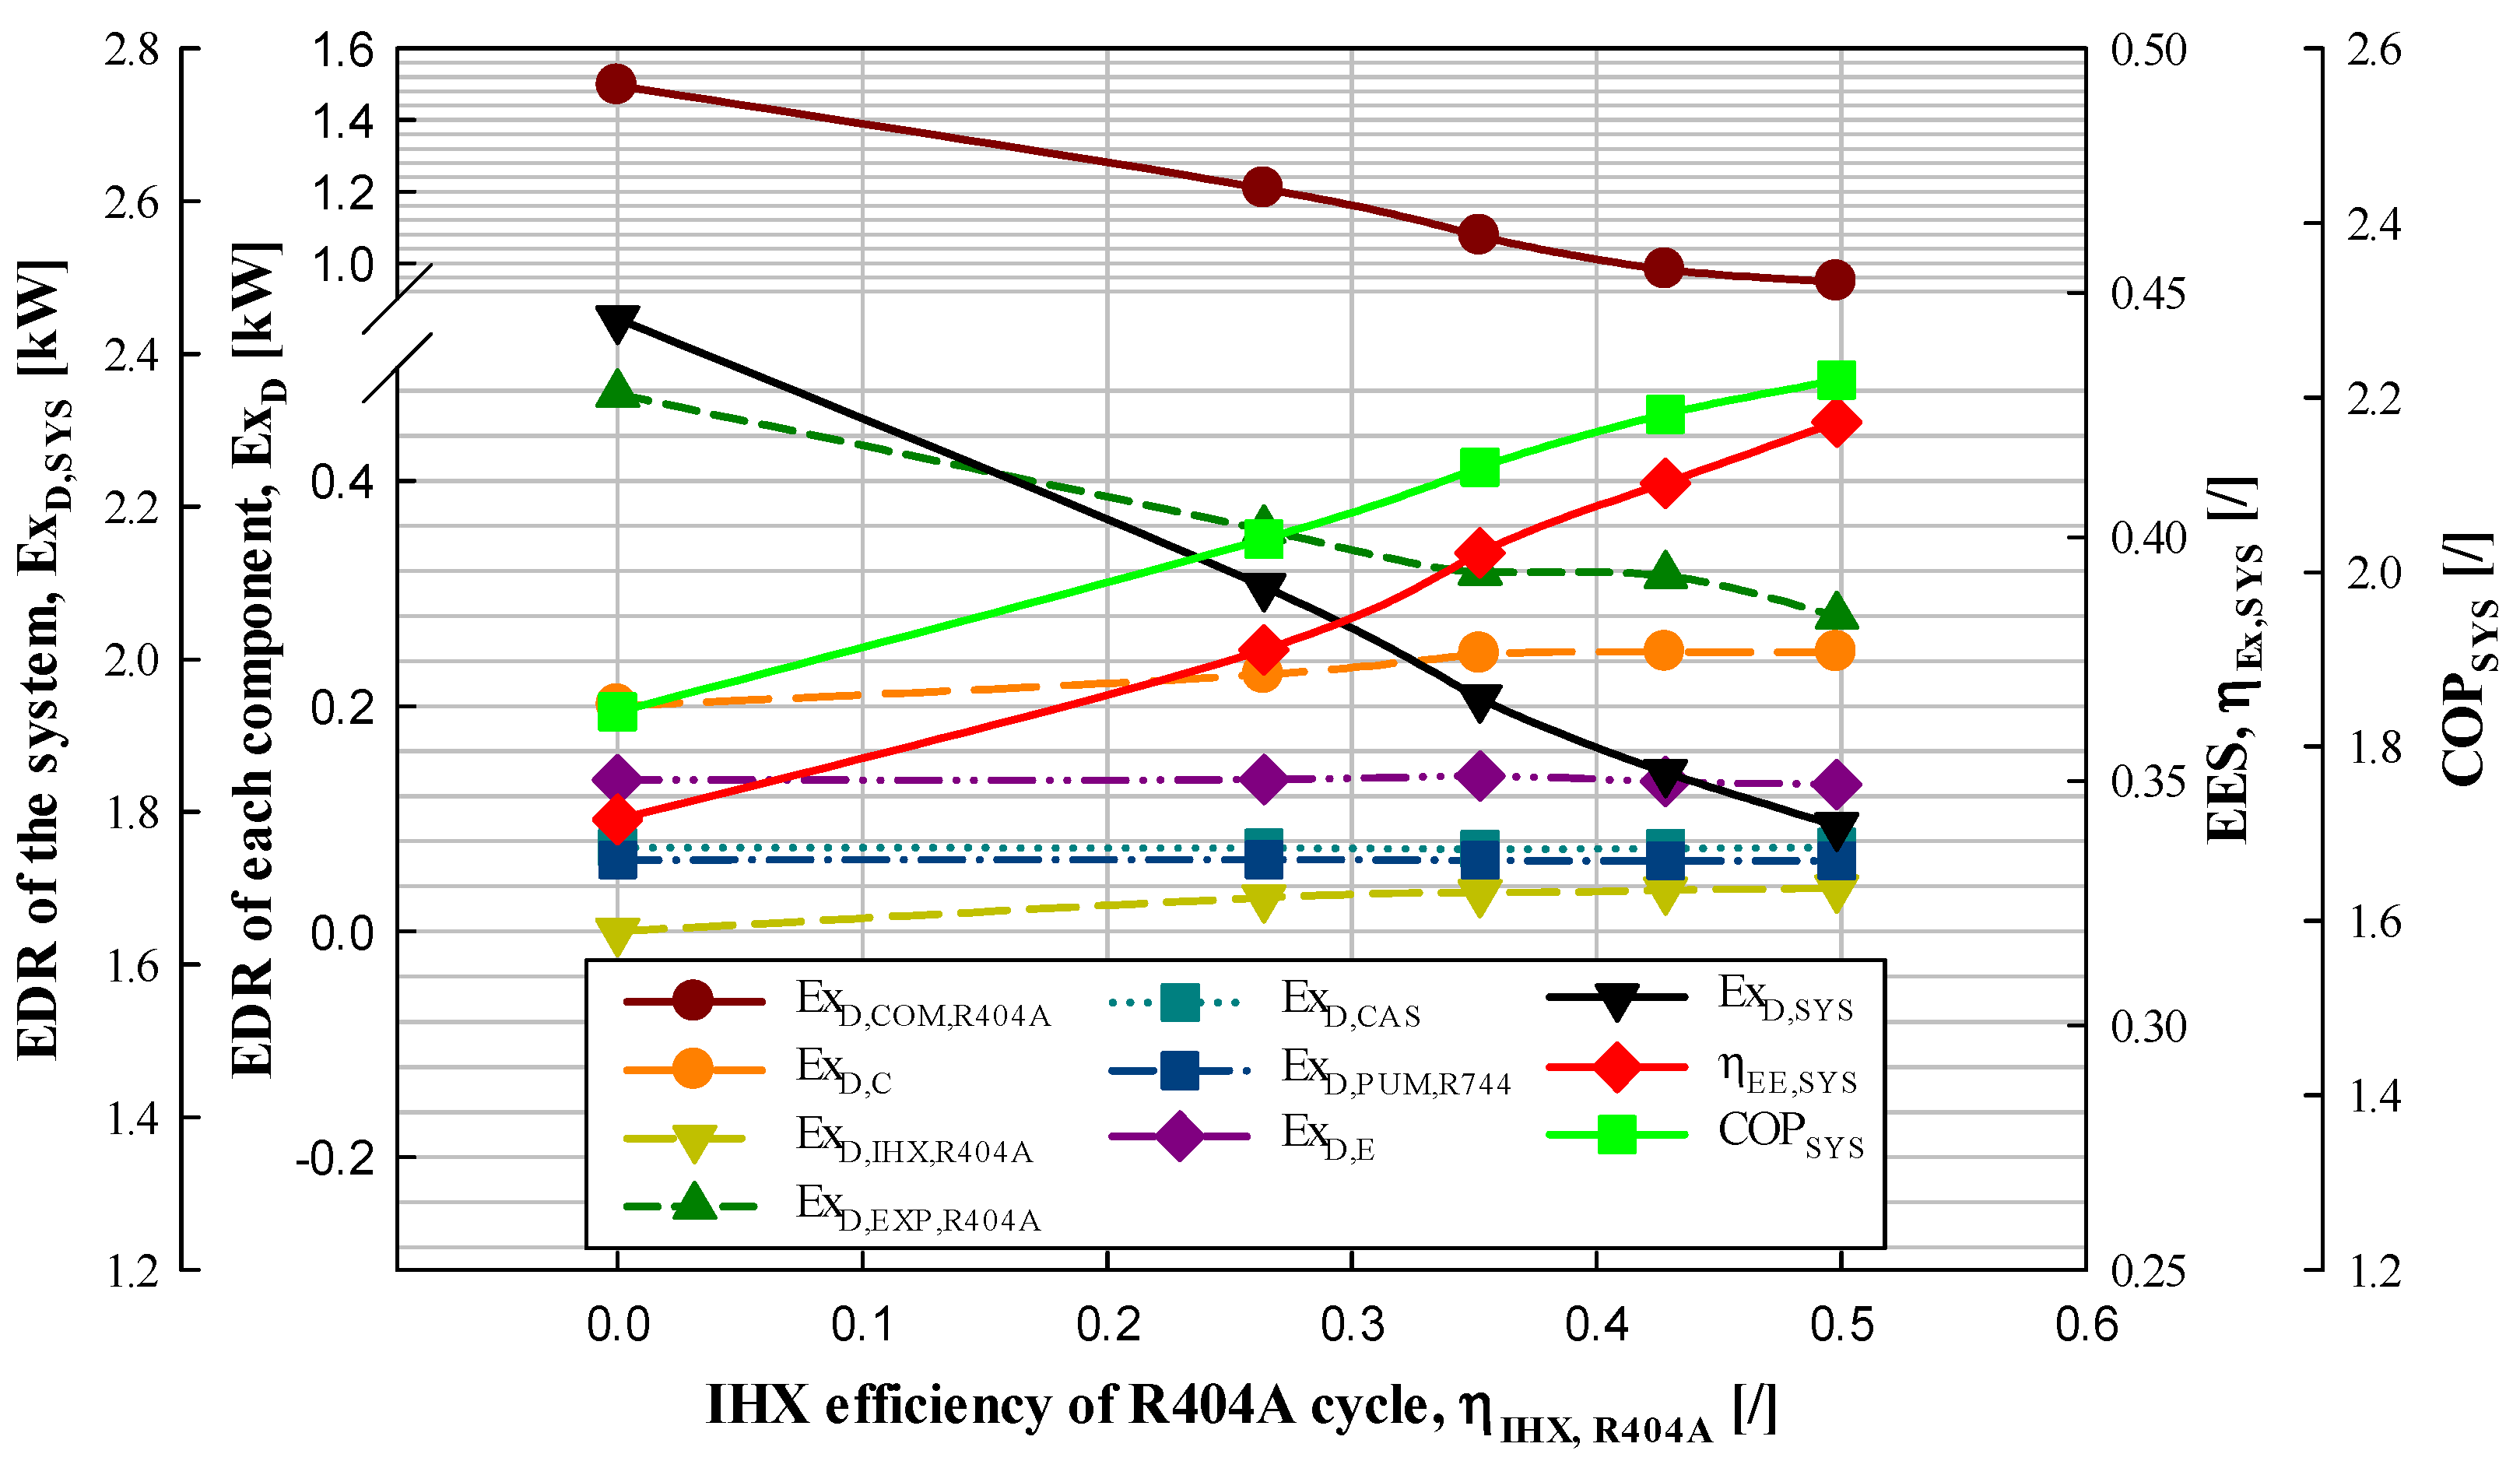
3.5. Effect of IHX Efficiency

The variations in the EDR of each component, EDR of the system, and EES with an increase in the number of IHX stages in the R404A cycle were experimentally evaluated under constant conditions (QE = 6.84–6.86 kW; TE = −6.5–−6.3 °C; TCAS,E = −10.3–−9.6 °C; TC = 39.8–40.3 °C; ΔTSUP,R404A = 19.4–20.3 °C; ΔTSUB,R404A = 1.1–1.5 °C; ΔTSUP,R744 = 9.8–10.5 °C; ΔTSUB,R744 = 1.0–1.5 °C; ΔTCAS = 3.1–3.6 °C; and ηIHX,R404A = 0). The number of IHX stages was increased from zero to four. The observed trends are shown in Figure 9.
As the number of IHX stages in the R404A cycle increased from zero to four, the IHX efficiency increased from zero to 26.4, 35.2, 42.8, and 49.8. The EDR of the system decreased by 3.8–14.3% whereas the EES increased by 3–10.2%. The EES increased with an increase in the COP of the system. The changes in the EDRs of the pump, evaporator in the R744 cycle, and CE were minimal. In the R404A cycle, the EDRs of the compressor and EV decreased by 3.5–19.3% and 0.97–25.2%, respectively, whereas those of the condenser and IHX increased by 0.8–13.8% and 5.5–14.6%, respectively. The change from stage zero to stage one was omitted because the efficiency of stage zero was zero.
As the number of IHX stages in the R404A cycle increased, the EDRs of the pump, evaporator in the R744 cycle, and CE remained constant because the MFR, ET, CT, DSP, and DSB of the R744 cycle were constant. The IE and OE (s1 and s2) at the compressor in the R404A cycle increased with an increase in the number of IHX stages. The entropy difference (s2 − s1) between the inlet and outlet decreased because the magnitude of the increase in the IE (s1) was larger than the magnitude of the increase in the OE (s2). Accordingly, both the PCC and the refrigerant EDR at the inlet and outlet of the compressor decreased. The decrease in the EDR of the compressor was attributed to the larger decrease in the PCC and the decrease in the MFR. The entropy difference (s8 − s6) between the inlet and outlet of the EV increased because the IE (s6) decreased and the OE (s8) remained constant. Hence, the EDR of the EV decreased with an increase in the number of IHX stages. Consequently, the EDR decreased due to a pressure drop, and the EDR increased due to a temperature drop.
The EDR of the condenser (ExD,C) was calculated as the sum of the EDR at the condenser inlet and outlet (ExF,C: +) and the EDR due to the condensation heat capacity (ExP,C: −). The differences in the IE and OE of the condenser (s2 − s4) increased with an increase in the number of IHX stages because the IE (s2) increased and the OE (s4) remained constant. Moreover, the MFR decreased. Consequently, both ExF,C and ExP,C decreased. However, ExD,C increased because the magnitude of the decrease in ExP,C was higher than the magnitude of the decrease in ExF,C.
The EDR of the IHX (ExD,IHX,R404A) was calculated as the sum of the EDR at the inlet (condenser outlet) and outlet (EV inlet) of the IHX on the high-pressure side (ExF,IHX,R404A: +) and the EDR at the inlet (evaporator outlet) and outlet (compressor inlet) of the IHX on the low-pressure side (ExP,IHX,R404A: −). ExF,IHX,R404A and ExP,IHX,R404A increased with an increase in the number of IHX stages in the R404A cycle. ExD,IHX,R404A increased because the rate of increase in ExP,IHX,R404A was lower than that of ExF,IHX,R404A. ExD,IHX,R404A increased despite a decrease in the MFR because the effect of the increase in ExP,IHX,R404A was dominant.
Therefore, high IHX efficiency in the R404A IRS can increase the COP and exergy of the system by decreasing the EDR of the system.
Figure 4, Figure 5, Figure 6, Figure 7, Figure 8 and Figure 9 show the relationships among the EDR, COP of the system, and EES of the IRS using R744 under different test conditions. The EDR of the system was inversely proportional to the COP, and the behaviors of the EES and COP of the system were similar. Therefore, the EDR of each component must be decreased to increase the COP of the system.

3.6. Comparison of Experimental and Performance Analysis Data

Figure 4 shows the experimental data on the EDR of each component, EDR of the system, EES, and COP of the system according to the DSP of the R404A cycle in the IRS. Figure 10 shows the results obtained via performance analysis.
The analysis conditions used to obtain the results shown in Figure 10 were as follows: QE = 6.71 kW, TE = −21 °C, TCAS,E = −24.9 °C, TC = 40.0 °C, ΔTSUB,R404A = 1.3 °C, ΔTSUP,R744 = 10 °C, ΔTSUB,R744 = 1.6 °C, ΔTCAS = 3.7 °C, ηIHX,R404A = 0, and ηCOM,R404A = 0.555.
The analysis conditions were matched with the test conditions to the best possible extent. Despite marginal variations in the conditions, the trends observed in the experiments were identical to the trends obtained via performance analysis. In addition, the experimental and performance analysis results were in good agreement for the EDR of each component (ExD), EDR of the system (ExD,SYS), EES ( η Ex,SYS), and COP of the system (COPSYS) according to the DSB of the R404A cycle, DSP of the R744 cycle, CT, CET, and IHX efficiency.

4. Conclusions

In this study, exergy characteristics were theoretically identified and factors affecting a low-temperature (−35 to 5 °C) R404A IRS using R744 as the secondary fluid were experimentally analyzed. This study aimed to provide basic data for the optimal design of the R404A IRS with an IHX that uses R744 as the secondary fluid. The results obtained in this study can help ensure energy efficiency and economic feasibility by optimizing the total exergy of the IRS and thereby promote eco-friendly IRS operation and maintenance. The conclusions of this study are as follows:
  • In order to lower the system EDR, the DSP, DSB, IHX efficiency and CET of the R404A cycle must be increased to the maximum, and the DSP of the R744 cycle and CT must be reduced to the minimum.
  • Under the given conditions, the smallest change in the system EDR according to the change in each parameter is the DSP of the R744 cycle (0.3–1%), followed by the DSB of the R404A cycle (6.1–8.8%), IHX efficiency of the R404A cycle (3.8–14.3%), DSP of the R404A cycle (11.7–15.9%), CET (29.4–41.9%), and CT (35–47%).
  • Also, in terms of the EES, the largest value obtained was the DSP of the R404A cycle (2.4–12.7%), followed by the IHX efficiency of the R404A cycle (3–10.2%), CET (2.2–8.7%), CT (4–6.9%), DSB of the R404A cycle (2.7–6.2%), and DSP of the R744 cycle (0.04–1.2%).
  • The DSP of the R744 cycle does not need to be considered when designing the R404A IRS using R744 as a secondary fluid because the changes in the EDR of the IRS and EES are insignificant, with ranges of 0.3–1% and 0.04–1.2%, respectively.
  • Among the EDRs of the components of the IRS, the largest one is the compressor, followed by the expansion valve, condenser, evaporator, CHX, pump, and IHX. Therefore, from energy and environmental aspects, great efforts must be made to reduce the EDR in the compressor and expansion valve when designing the R404A IRS using R744 as a secondary fluid.
  • The trend of the system EDR shows the exact opposite of that of the system exergy efficiency and COP. The EES and COP of the system increase with a decrease in the system EDR.
  • The EES can replace the COP of the system.
  • The position and size of energy inefficiency, which cannot be identified via COP analysis, can be identified by evaluating the EDR of each component, thereby making it possible to maximize energy efficiency.
  • Energy efficiency can be maximized via detailed, quantitative, and advanced exergy analysis. This may be considered in future work.
  • The R404A refrigerant is regulated in developed countries, including Europe. Therefore, novel alternatives such as R448A and R449A must be examined.

Author Contributions

Conceptualization, J.-H.L.; methodology, J.-H.L.; software, M.-J.J.; validation, J.-H.L. and M.-J.J.; formal analysis, M.-J.J.; investigation, J.-H.L.; resources, J.-H.L.; data curation, M.-J.J.; writing—original draft preparation, M.-J.J.; writing—review and editing, J.-H.L.; and visualization, M.-J.J. All authors have read and agreed to the published version of the manuscript.

Funding

This research received no external funding.

Institutional Review Board Statement

Not applicable.

Informed Consent Statement

Not applicable.

Data Availability Statement

The original contributions presented in the study are included in the article, further inquiries can be directed to the corresponding author.

Conflicts of Interest

The authors declare no conflicts of interest.

Nomenclature

ABBREVIATIONS
CCCascade condenser
CECascade evaporator
CETCascade evaporation temperature
CHXCascade heat exchanger
COPCoefficient of performance
CRSCascade refrigeration system
CTCondensation temperature
DSBDegree of subcooling
DSPDegree of superheating
DXDirect expansion
EDRExergy destruction rate
EESExergy efficiency of the system
EHCEvaporation heat capacity
ETEvaporation temperature
EVExpansion valve
IEInlet entropy
IHXInternal heat exchanger
IRSIndirect refrigeration system
IXIndirect expansion
MFRMass flow rate
OEOutlet entropy
PCCPower consumption of the compressor
PCPPower consumption of the pump
SYMBOLS
E x ˙ Exergy ratekW
QHeat capacitykW
TTemperature°C
WPower consumptionkW
SEntropykJ/(kg·K)
GREEK SYMBOLS
Δ Difference
η Efficiency
SUPERSCRIPTS
MMechanical
TThermal
SUBSCRIPTS
CCondensation or condenser
CASCascade heat exchanger
COMCompression
DDestruction
EEvaporation or evaporator
E x Exergy
E x ˙ Exergy ratekW
EXPExpansion valve
FFuel
IHXInternal heat exchanger
PProduct
PUMPump
R404AR404A cycle
R744R744 cycle
SUBDegree of subcooling
SUPDegree of superheating
SYSTotal indirect refrigeration system

References

  1. Cabello, R.; Andreu-Nácher, A.; Sánchez, D.; Llopis, R.; Vidan-Falomir, F. Energy comparison based on experimental results of a cascade refrigeration system pairing R744 with R134a, R1234ze(E) and the natural refrigerants R290, R1270, R600a. Int. J. Refrig. 2023, 148, 131–142. [Google Scholar] [CrossRef]
  2. Vaishak, S.; Singha, P.; Dasgupta, M.S.; Hafner, A.; Widell, K.; Bhattacharyya, S.; Saini, S.K.; Arun, B.S.; Samuel, M.P.; Ninan, G. Performance analysis of a CO2/NH3 cascade refrigeration system with subcooling for low temperature freezing applications. Int. J. Refrig. 2023, 153, 140–154. [Google Scholar] [CrossRef]
  3. Staubach, D.; Michel, B.; Revellin, R. Refrigerant selection from an economic and TEWI analysis of cascade refrigeration systems in Europe based on annual weather data. Appl. Therm. Eng. 2023, 230, 120747. [Google Scholar] [CrossRef]
  4. Shi, R.; Bai, T.; Wan, J. Performance analysis of a dual-ejector enhanced two-stage auto-cascade refrigeration cycle for ultra-low temperature refrigeration. Appl. Therm. Eng. 2024, 240, 122152. [Google Scholar] [CrossRef]
  5. Hinde, D.; Zha, S.; Lan, L. Carbon dioxide in north American supermarkets. ASHRAE J. 2009, 51, 18–26. [Google Scholar]
  6. Kruse, H. Refrigerant use in Europe. ASHRAE J. 2000, 42, 16–25. [Google Scholar]
  7. Birndt, R.; Riedel, R.; Schenk, J. Dichtheit von Gewerbekälteanlagen (Tightness of Commercial Refrigeration Systems). Die Kälte- Und Klimatech. 2000, 9, 56–63. (In German) [Google Scholar]
  8. Bivens, D.; Gage, C. Commercial Refrigeration Systems Emissions. In Proceedings of the 15th Annual Earth Technologies Forum, Washington, DC, USA, 13–15 April 2004. [Google Scholar]
  9. Haaf, S.; Heinbokel, B. Alternative Kaltemittel fur Supermarkt-Kalteanlagen (Alternative Refrigerants for Supermarket Refrigeration Installations). In Proceedings of the Deutsche Kälte-Klima-Tagung, Magdeburg, Germany, 21–22 November 2002; Deutscher Kälte- und Klimatechnischer Verein DKV: Stuttgart, Germany, 2002; pp. 29–42. (In German). [Google Scholar]
  10. van den Hoogen, B.; van der Ree, H. The Dutch Approach to Reduce Emissions of Fluorinated Greenhouse Gases. In Proceedings of the IIR Conference on “Zero Leakage—Minimum Charge. Efficient Systems for Refrigeration, Air Conditioning and Heat Pumps”, Stockholm, Seden, 26–28 August 2002; International Institute of Refrigeration (IIR/IIF): Paris, France, 2002. [Google Scholar]
  11. Pedersen, P.H. Evaluation of the Possibilities of Substituting Potent Greenhouse Gases (HFCs, PFCs and SF6); Environmental Project No. 771; Danish Environmental Protection Agency: Copenhagen, Denmark, 2003. [Google Scholar]
  12. Radford, P. The Benefits of Refrigerant Inventory Control. In Proceedings of the Institute of Refrigeration Conference: R22 Phase Out–Impact on End Users Today; Institute of Refrigeration: London, UK, 1998. [Google Scholar]
  13. IPCC/TEAP; Metz, B.; Kuijpers, L.; Solomon, S.; Andersen, S.O.; Davidson, O.; Pons, J.; de Jager, D.; Kestin, T.; Manning, M.; et al. (Eds.) Safeguarding the Ozone Layer and the Global Climate System; Cambridge University Press: Cambridge, UK, 2005; p. 478. [Google Scholar]
  14. Available online: https://e360blog.copeland.com/ten-tips-for-preventing-refrigerant-leaks-in-supermarket-systems/ (accessed on 12 August 2024).
  15. Available online: https://www.coolingpost.com/world-news/us-supermarket-to-pay-400k-for-refrigerant-leaks/ (accessed on 12 August 2024).
  16. Queiroz, M.V.A.; Panato, V.H.; Antunes, A.H.P.; Parise, J.A.R.; Filho, E.P.B. Experimental comparison of a cascade refrigeration system operating with R744/R134a and R744/R404A. In Proceedings of the International Refrigeration and Air-Conditioning Conference, West Lafayette, IN, USA, 11–13 July 2016; Paper 1785. pp. 1–10. Available online: http://docs.lib.purdue.edu/iracc/1785 (accessed on 19 September 2020).
  17. Wikipedia. List of Refrigerants. Available online: https://en.wikipedia.org/wiki/List_of_refrigerants#cite_note-ASHRAE2007-34m-v-10 (accessed on 25 July 2021).
  18. Pearson, S.F. Cooling Method and Apparatus. British Patent Number 2258298, January 1995. [Google Scholar]
  19. Pearson, A. Carbon dioxide—New uses for an old refrigerant. Int. J. Refrig. 2005, 28, 1140–1148. [Google Scholar] [CrossRef]
  20. Pachai, A.C. Experience with CO2 as refrigerant in supermarkets. In Proceedings of the Sixth IIR-Gustav Lorentzen Conference on Natural Working Fluids, Glasgow, UK, 29 August–1 September 2004. [Google Scholar]
  21. Nilsson, P.O.; Rogstam, J.; Sawalha, S.; Shahzad, K. Ice rink refrigeration system with carbon dioxide as secondary fluid in copper tubes. In Proceedings of the Seventh IIR-Gustav Lorentzen Conference on Natural Working Fluids, Trondheim, Norway, 29–31 May 2006. [Google Scholar]
  22. Jahn, K. Natural refrigerants in dairy processing, supermarket refrigeration and air conditioning. In GTZ Proklima: Natural Refrigerants-Sustainable Ozone-and Climate-Friendly Alternatives to HCFCs Eschborn Germany; Deutsche Gesellschaft fur Technische Zusammenarbeit (GTZ) GmbH, German Technical Cooperation—Programme Proklima: Eschborn, Germany, 2008; pp. 313–317. [Google Scholar]
  23. Kaga, S.; Nomura, T.; Seki, K.; Hirano, A. Development of compact inverter refrigerating system using R600a/CO2 by Thermo Siphon. In Proceedings of the Eighth IIR-Gustav Lorentzen Conference on Natural Working Fluids, Copenhagen, Denmark, 7–10 September 2008; pp. 1011–1018. [Google Scholar]
  24. Sawalha, S.; Palm, B. Energy comsumption evaluation of indirect systems with CO2 as secondary refrigerant in supermarket refrigeration. In Proceedings of the International Congress of Refrigeration, Washington, DC, USA, 17–22 August 2003. ICR0434. [Google Scholar]
  25. Jeon, M.J.; Lee, J.H. Experimental investigation of R404A indirect refrigeration system applied internal heat exchanger. Part 1—Coefficient of performance characteristics. Energies 2024, 17, 4127. [Google Scholar] [CrossRef]
  26. Jeon, M.J. Experimental Analysis of the R744/R404A Cascade Refrigeration System with Internal Heat Exchanger. Part 2: Exergy Characteristics. Energies 2022, 15, 1251. [Google Scholar] [CrossRef]
  27. Bai, T.; Yu, J.; Yan, G. Advanced exergy analysis on a modified auto-cascade freezer cycle with an ejector. Energy 2016, 113, 385–398. [Google Scholar] [CrossRef]
  28. Sun, Z.; Liang, Y.; Liu, S.; Ji, W.; Zang, R.; Liang, R.; Guo, Z. Comparative analysis of thermodynamic performance of a cascade refrigeration system for refrigerant couples R41/R404A and R23/R404A. Appl. Energy 2016, 184, 19–25. [Google Scholar] [CrossRef]
  29. Morosuk, T.; Tsatsaronis, G. Advanced exergetic evaluation of refrigeration machines using different working fluids. Energy 2009, 34, 2248–2258. [Google Scholar] [CrossRef]
  30. Kline, S.J.; McClintock, F.A. Describing Uncertainties in Single Sample Experiments. Mech. Eng. 1953, 75, 3–8. [Google Scholar]
  31. Moffat, R. Describing the uncertainties in experimental results. Exp. Therm. Fluid Sci. 1988, 1, 3–17. [Google Scholar] [CrossRef]
  32. Yılmaz, D.; Sınar, Ü.; Özyurt, A.; Barış, Y.; Mancuhan, E. Ultra Düşük Sıcaklıklarda Çalışan İki Kademeli Bir Soğutma Sisteminde Aşırı Soğutma ve Isıtmanın Performansa Etkilerinin Sayısal İncelenmesi. AKU J. Sci. Eng. 2017, 17, 1172–1180. [Google Scholar] [CrossRef]
  33. Mosaffa, A.H.; Farshi, L.G.; Ferreira, C.A.I.; Rosen, M.A. Exergoeconomic and environmental analyses of CO2/NH3 cascade refrigeration systems equipped with different types of flash tank intercoolers. Energy Convers. Manag. 2016, 117, 442–453. [Google Scholar] [CrossRef]
  34. Nurhasanah, H.R.; Suhengki, P. Energy and Exergy Analysis of Cascade Refrigeration System Using MC22 and MC134 on HTC, R404A and R502 on LTC. J. Adv. Res. Fluid Mech. Therm. Sci. 2021, 80, 73–83. [Google Scholar] [CrossRef]
  35. Parekh, A.D.; Tailor, P.R. Thermodynamic analysis of cascade refrigeration, system using R12-R13, 290-R23 and R404A-R23. Int. J. Mech. Mechatron. Eng. 2014, 8, 1351–1356. [Google Scholar]
  36. Kilicarslan, A.; Hosoz, M. Energy and irreversibility analysis of a cascade refrigeration system for various refrigerant couples. Energy Convers. Manag. 2010, 51, 2947–2954. [Google Scholar] [CrossRef]
  37. Shilliday, J.A.; Tassou, S.A.; Shilliday, N. Comparative energy and exergy analysis of R744, R404A and R290 refrigeration cycles. Int. J. Low-Carbon Technol. 2009, 4, 104–111. [Google Scholar] [CrossRef]
  38. Yi, W.B. An Experimental Analysis on the Performance of Indirect Refrigeration System Using CO2 as a Secondary Refrigerant. Master’s Thesis, Pukyong National University, Busan, Republic of Korea, 2014. [Google Scholar]
Figure 1. Photograph of the test apparatus: the R404A IRS using R744 as the secondary fluid.
Energies 17 04143 g001
Figure 2. Schematic of the test apparatus: the R404A IRS using R744 as the secondary fluid [25].
Energies 17 04143 g002
Figure 3. Conceptual diagram of the R404A IRS, using R744 as the secondary fluid.
Energies 17 04143 g003
Figure 4. COP, EDR, and EES of the IRS according to the DSP of the R404A cycle.
Energies 17 04143 g004
Figure 5. COP, EDR, and EES of the IRS according to the DSP of the R744 cycle.
Energies 17 04143 g005
Figure 6. COP, EDR, and EES of the IRS according to the DSB of the R404A cycle.
Energies 17 04143 g006
Figure 7. COP, EDR, and EES of the IRS with respect to the CT of the R404A cycle.
Energies 17 04143 g007
Figure 8. COP, EDR, and EES of the IRS according to the CET.
Energies 17 04143 g008
Figure 9. COP, EDR, and EES of the IRS according to the IHX efficiency of the R404A cycle.
Energies 17 04143 g009
Figure 10. Performance analysis results according to the DSP of the R404A cycle in the IRS.
Energies 17 04143 g010
Table 1. Leakage rates of refrigerants from supermarket refrigeration systems [13,14,15].
CountryYear(s)Annual Refrigerant LossReferences
The Netherlands19993.2%Hoogen et al., 2002 [10]
Germany2000–20005–10%Birndt et al., 2000 [7];
Haaf and Heinbokel, 2002 [9]
Denmark200310%Pedersen, 2003 [11]
Norway2002–200314%Bivens and Gage, 2004 [8]
Sweden1993
1998
2001
14%
12.5%
10.4%
Bivens and Gage, 2004 [8]
United Kingdom199814.4%Radford, 1998 [12]
USA2000–200213% and 18%,
19% and 22%
Bivens and Gage, 2004 [8]
USA202025%[14]
USA2019–202140%, 59%, and 46%[15]
Table 2. Studies on the IRS with R744 as the secondary fluid.
AuthorsYearPrimary FluidSecondary FluidAnalysis Method
Sawalha and Palm [24]2003R404AR744Experiment and Simulation
Pachai [20]2004R290 + R170R744, PGExperiment
Pearson [19]2005-R744Review
Nilsson et al. [21]2006 R744Experiment
Jahn [22]2008-R744Experiment
Hinde et al. [5]2008R404A, R507R744, PGExperiment
Kaga et al. [23]2008R600aR744Experiment
Table 3. Test conditions: the R404A IRS using R744 as the secondary fluid [25].
CycleComponentRangeUnit
R404A cycleCT20, 30, 40 *, 50°C
IHX efficiency0 *, 1, 2, 3, 4stage
DSB0 *, 5, 10, 15, 20°C
DSP10, 20 *, 30, 40°C
CET−40, −30, −25 *, −20, −10, 0°C
Temperature difference of the cascade heat exchanger5 *°C
R744 cycle
ET and cascade CT−35, −25, −20 *, −15, −5, 5°C
DSB1 *°C
DSP10 *, 20, 30, 40°C
* Standard conditions.
Table 4. Main components of the test apparatus: the R404A IRS, using R744 as the secondary fluid [25].
ComponentCharacteristics
R404A
compressor
Bock; model: HGX34P/380-4S. Displacement with 1450 min−1:33.1 m3 h−1. Number of cylinders: 4. Weight: 96 kg. Max. power consumption: 11.1 kW
R744 magnetic
drive gear pump
Micropump; model: Series 5000. Flow range: 0–13.5 L/min. Maximum system pressure: 103 bar (1500 psi). Temperature range: −46 to 121 °C
EvaporatorCustom-built; type: horizontal double tube. Material: copper tube. Internal diameter of the inner tube: 11.46 mm. Internal diameter of the outer tube: 33.27 mm. Length of the evaporator: 8000 mm
CondenserAlfa Laval; model: ACH-70X-50H-F. Heat exchanged: 38.44 kW.
Heat transfer area: 2.45 m2
Cascade
heat exchanger
Alfa Laval; model: ACH-70X-50H-F. Heat exchanged: 10.86 kW.
Heat transfer area: 2.45 m2
Table 5. Entropy and exergy balance formula for each component in the R404A IRS, using R744 as the secondary fluid [26,27,28,29].
CycleComponent E x ˙ F , k , kW E x ˙ P , k , kW E x ˙ D , k , kW
R404A cycleCompressor (1→2) W COM , R 404 A Ex ˙ 2 Ex ˙ 1 W COM , R 404 A ( Ex ˙ 2 - Ex ˙ 1 )
Condenser (2→4) Ex ˙ 2 Ex ˙ 4 Q c 1 T 0 T C ( Ex ` 2 Ex ` 4 ) Q c 1 T 0 T C
IHX (4→5, 8→1) Ex ˙ 4 Ex ˙ 5 Ex ˙ 8 Ex ˙ 1 ( Ex ˙ 4 Ex ˙ 5 ) Ex ˙ 8 Ex ˙ 1
EV (5→6) Ex ˙ 5 M Ex ˙ 6 M Ex ˙ 6 T Ex ˙ 5 T ( Ex ˙ 5 M Ex ˙ 6 M ) ( Ex ˙ 6 T Ex ˙ 5 T )
Cascade heat exchanger
(6→8, 12→14)
Ex ˙ 6 Ex ˙ 8 Ex ˙ 14 Ex ˙ 12 ( Ex ˙ 6 Ex ˙ 8 ) ( Ex ˙ 14 Ex ˙ 12 )
R744 cycle
Pump (14→15) W PUM , R 744 Ex ˙ 15 Ex ˙ 14 W PUM , R 744 ( Ex ˙ 15 Ex ˙ 14 )
Evaporator (15→12) Ex ˙ 15 Ex ˙ 12 Q E T 0 T E + Δ T E 1 ( Ex ˙ 15 Ex ˙ 12 ) Q E T 0 T E + Δ T E 1
Table 6. Parameters and estimated uncertainties.
ParameterUnitUncertainty
MFR[kg/min] ± 0.0100
PCC[kW] ± 0.0350
PCP[W] ± 0.2350
COP of the total IRS[/] ± 0.0135
EDR of the system[kW] ± 0.0175
Temperature[°C] ± 0.2000
Δ T CAS [°C] ± 0.4000
Pressure[kPa] ± 5.2700
Δ P (Pressure drop)[kPa] ± 0.0100
MFR of coolant[kg/h] ± 7.5300
Disclaimer/Publisher’s Note: The statements, opinions and data contained in all publications are solely those of the individual author(s) and contributor(s) and not of MDPI and/or the editor(s). MDPI and/or the editor(s) disclaim responsibility for any injury to people or property resulting from any ideas, methods, instructions or products referred to in the content.

