Article

Dual Effect of Hydrothermal Fluid on Shale Oil Reservoir in Gulong Sag, Songliao Basin: Constrained by C-O Isotope and Geochemistry

1
Exploration and Development Research Institute of Daqing Oilfield Company Ltd., Daqing 163712, China
2
National Key Laboratory of Green Exploitation of Continental Shale Oil with Multi-Resource Collaboration, Daqing 163002, China
3
Geoscience College, Northeast Petroleum University, Daqing 163318, China
4
College of Earth Sciences, Jilin University, Changchun 130061, China
*
Authors to whom correspondence should be addressed.
Energies 2024, 17(16), 4159; https://doi.org/10.3390/en17164159
Submission received: 20 June 2024 / Revised: 12 August 2024 / Accepted: 19 August 2024 / Published: 21 August 2024
(This article belongs to the Section J: Thermal Management)

Abstract

:
Hydrothermal activity is widespread in sedimentary basins, but its dual effects (chemistry and temperature) on shale reservoirs are rarely discussed. In this research, we systematically collected 33 well core samples from Q1 to Q9 units in Gulong Sag, Songliao Basin, and analyzed them using a variety of analytical techniques, including a field emission scanning electron microscopy (FE-SEM), an energy-dispersive spectrometer (EDS), X-ray diffraction (XRD), and stable C-O isotopes. Combined with the collected vitrinite reflectance (Ro), total organic carbon (TOC), and soluble hydrocarbon content data, which is the sum of free oil (pyrolysis S1) and sorb oil content (pyrolysis S2), the results show that (1) Q4 and Q8 units have large amounts of hydrothermal minerals, and its C-O isotope obviously shifts to negative, which implied those units are the main hydrothermal fluid influence area; (2) the hydrothermal activity occurred in the late depositional period of Q1–Q9 units such that its geochemistry has little effect on the proliferation of algae blooms, but its high temperature calculated by δ18O temperature formulas (around 208 °C) promoted the organic matter maturation process around Q4 and Q8; and (3) the overpressure caused by hydrothermal activity protected the shale reservoir and minimized the decrease in mineral reservoir brittleness index caused by hydrothermal fluid influence. We suggest that the shale reservoir affected by hydrothermal fluid will become a good geology “dessert”, and its upper and/or lower bounds can form an engineering “dessert” due to the precipitation of large amounts of brittle carbonate minerals.

1. Introduction

Shale oil and gas is an important unconventional energy source; the law of organic matter enrichment and the characteristics of reservoir brittleness are the key tasks of its engineering and geology “dessert” prediction [1,2,3,4]. The “dessert” distribution is considered to be the combined effects of characteristics of organic matter development, sedimentary cycles, and the subsequent diagenesis process [5,6,7]. Recent studies revealed that volcanic eruptions and/or hydrothermal activity also controlled the “dessert” distribution character, which process formed a hydrothermal sedimentary rock by the precipitation of hydrothermal fluid mixed with water and altered the organic matter evolution and the mineral composition character [5,7]. For example, the middle Permian lacustrine shale reservoir character of the Junggar Basin is thought to be controlled by paleoenvironments and hydrothermal activity [8]. Furthermore, the enrichment of Chang 7 shale oil in the Triassic Yanchang Formation in the Ordos Basin was considered to be related to hydrothermal fluid [9].
Hydrothermal activity is generally developed in the marine and terrestrial sedimentary basins, which are always accompanied by overpressure in the strata [10,11]. And its fluids mainly include deep CO2, H2S, H2 N2 fluids, magmatic water, metamorphic water, and other high-heat fluids in the deep crust and upper mantle with high temperatures [11,12,13]. After migration from deep to shallow through a fault, it will change shale reservoir characteristics by its dual effect: (1) abnormal fluid chemistry and (2) high temperature [10,14]. Through study of hydrothermal fluid activity in modern continental lakes [15,16] and subsurface core from basin area in geological history [9,17], numerous identification marks of hydrothermal sedimentary were established, including mineral assemblage (fluorapatite, barite, chalcopyrite, chromium sulfide, and so on) [10,11,18,19], abnormal method of temperature sensing parameters (such as C-O isotope, TOC, S1 + S2 and Ro [10,11], geochemical character of wall rocks (e.g., ratio of (Fe + Mn)/Ti and Al/(Al + Fe + Mn)) [20]; and fracture fill [21]. Based on those identification methods, the laws of organic matter enrichment were elaborated under the influence of hydrothermal fluid in shale reservoirs [8,9]. But the main consideration is the effect of the hydrothermal fluid’s geochemistry, and the influence of temperature is less studied. Additionally, hydrothermal activity is also associated with the brittleness of reservoirs, meaning that the injection of hydrothermal fluids will change the diagenesis environment and alter the mineral composition because of its abnormal fluid chemistry and high temperature [5]. Thus, the dual effect of hydrothermal activity on shale reservoirs needs further study.
Shale oil was found in the Qingshankou Formation of the Upper Cretaceous in the Gulong sag of the Songliao Basin, with a total of 151 billion tons of oil. Its organic matter is most abundant in the Q1 to Q9 units of the third and second sections of the Qingshankou Formation (Figure 1) [5,6,7]. The shale oil is a typical continental deposit with saltwater/semi-deep freshwater lake facies, and the distribution characteristics of organic matter and lithology are obviously controlled by two tertiary sedimentary cycles [5,6]. Previous studies have discussed the factors controlling organic matter enrichment in the Qingshankou Formation, and found the elements inputted by hydrothermal activity have a great promotion for organic matter enrichment, which is similar to Chang 7 shale oil in the Ordos Basin and Jiyang depression of the Bohai Bay Basin [20,22]. In addition, studies also emphasized the identification marks of hydrothermal activity in the Qingshankou Formation and expounded on its effect on the clay mineral transformation process [5,10]. However, there has been no study regarding the dual effect of hydrothermal activity on the shale reservoir in the Songliao Basin, especially for the rock’s brittleness transformation process, as those studies mainly focus on the physical properties of shale rock [23,24].
This study systematically collected 33 shale core samples from the Q1 to Q9 units in the G8 well, Gulong Sag, Songliao Basin. And its mineral composition by FE-SEM and EDS, whole rock and clay minerals by XRD, and stable C-O isotope character were analyzed. In addition, the Ro, TOC, and S1 + S2 data were also collected. On this basis, (1) hydrothermal activity marks were identified from Q1 to Q9 units, the range affected by hydrothermal fluids were assessed, and the dual effect of hydrothermal fluids on (2) organic matter and (3) brittleness transformation processes were discussed.

2. Geological Setting

Gulong Sag is located in a central depression, which is one of the six first-order tectonic zones on the western slope of the Songliao Basin (Figure 1). Two large lake flooding events occurred in the Songliao Basin; the sedimentary period of the Qingshankou Formation is the most important one, and its sedimentation center just developed in the central depression [25]. During this period, there were two tertiary cycles, which consisted of 13 quasi-sequence groups (Q1–Q13 unit) with a 170 kyr deposition time [6]. The Q1 to Q9 units belong to the bottom nine quasi-sequence groups, and they are also the main shale oil production horizon [5]. The nine units are mainly deposits of mudstone and shale with a thickness of around 200–500 m, in addition, there are locally developed ostracoids and dolomite interlayers (Figure 1) [10]. The organic matter type is I to II1, with a Ro around 1.2–1.67%. Its TOC is greater than 1% and its hydrogen index is generally between 600 to 800 mg/g. These characteristics show that the shale here has great hydrocarbon generation potential [5]. The Songliao Basin has been continuously volcanized from Shahezi Formation to Nenjiang Formation, and there are 3–5 layers of tuff in the Qingshankou Formation [10,26,27]. Hydrothermal minerals, such as chalcopyrite, sphalerite, and chromium sulfide, are also found in the Q1–Q9 units, with a homogenization temperature of fluid inclusion between 100–167 °C [28]. The two normal faults developed on both sides of Gulong Sag are large in scale and cut through the entire sedimentary cover to the deep magmatic rocks. In recent years, the discovery of a high electric conductor zone 25 km below the Songliao Basin provides strong evidence for the activity of magmatic hydrothermal solution [29].

3. Materials and Methods

3.1. Samples

There about 135.6 m of cores from the Q1 to Q9 units in well G8 that can be used, with a lithology of mainly laminated shale and contains a small amount of lamellar calcium shale and massive carbonate rock. From every unit, we took 3–4 core samples and total of 33 core samples. The sample detail character can be seen in Table 1. The top and bottom of each unit are sampled, and the rest are distributed inside the unit. Then, for each sample, XRD, FE-SEM, EDS, and C-O isotope were analyzed. Except C-O, tested at Jilin University, all samples were tested at the Northeast Petroleum University shale oil testing center. In addition, the data of Ro, TOC, S1, and S2 were collected from the Daqing oil field.

3.2. Experiments

  • FE-SEM and EDS
After cutting samples into pieces and polishing them using an argon ion mill, the FE-SEM (Quanta 250 FEG, manufactured by Thermo Fisher Scientific, Waltham, MA, USA) with an EDS was used for observations and analyses of mineral character in the ESEM™ vacuum environment, with a temperature of around 21 ± 4 °C and a humidity of less than 65% RH. The resolution of the electronic image and the back-scattered electronic image is 1.0 nm and 2.5 nm, respectively.
2.
C-O isotope
The carbon (δ13C) and oxygen (δ18O) isotopes are a result of the total carbonate in the shale. The detailed sample preparation process can be seen in Gazdewich et al. (2024) [30]. The CO2 released from carbonate was detected with a high-energy focused laser beam by the Isoprime100 isotope mass spectrometer for the carbon and oxygen isotope values. And the analytical uncertainty of each isotope is less than 0.2‰. Oxygen and carbon isotope data are all reported in ‰ with respect to the PDB standard, which is based on arrow-like stone in the Cretaceous Pitty Formation, South Carolina, United States.
3.
XRD
For XRD, the samples were crushed less than 40 μm for total rock and clay mineral contents analysis by a BRUKER-AXS D8 ADVANCE instrument with a CuKα radiation at 40 kV and 20 mA, and the angular accuracy of the equipment is better than 0.02 degrees. Additionally, the result of different minerals’ diffraction peak intensity was expressed by the integral strength following subtraction of the background.

4. Results

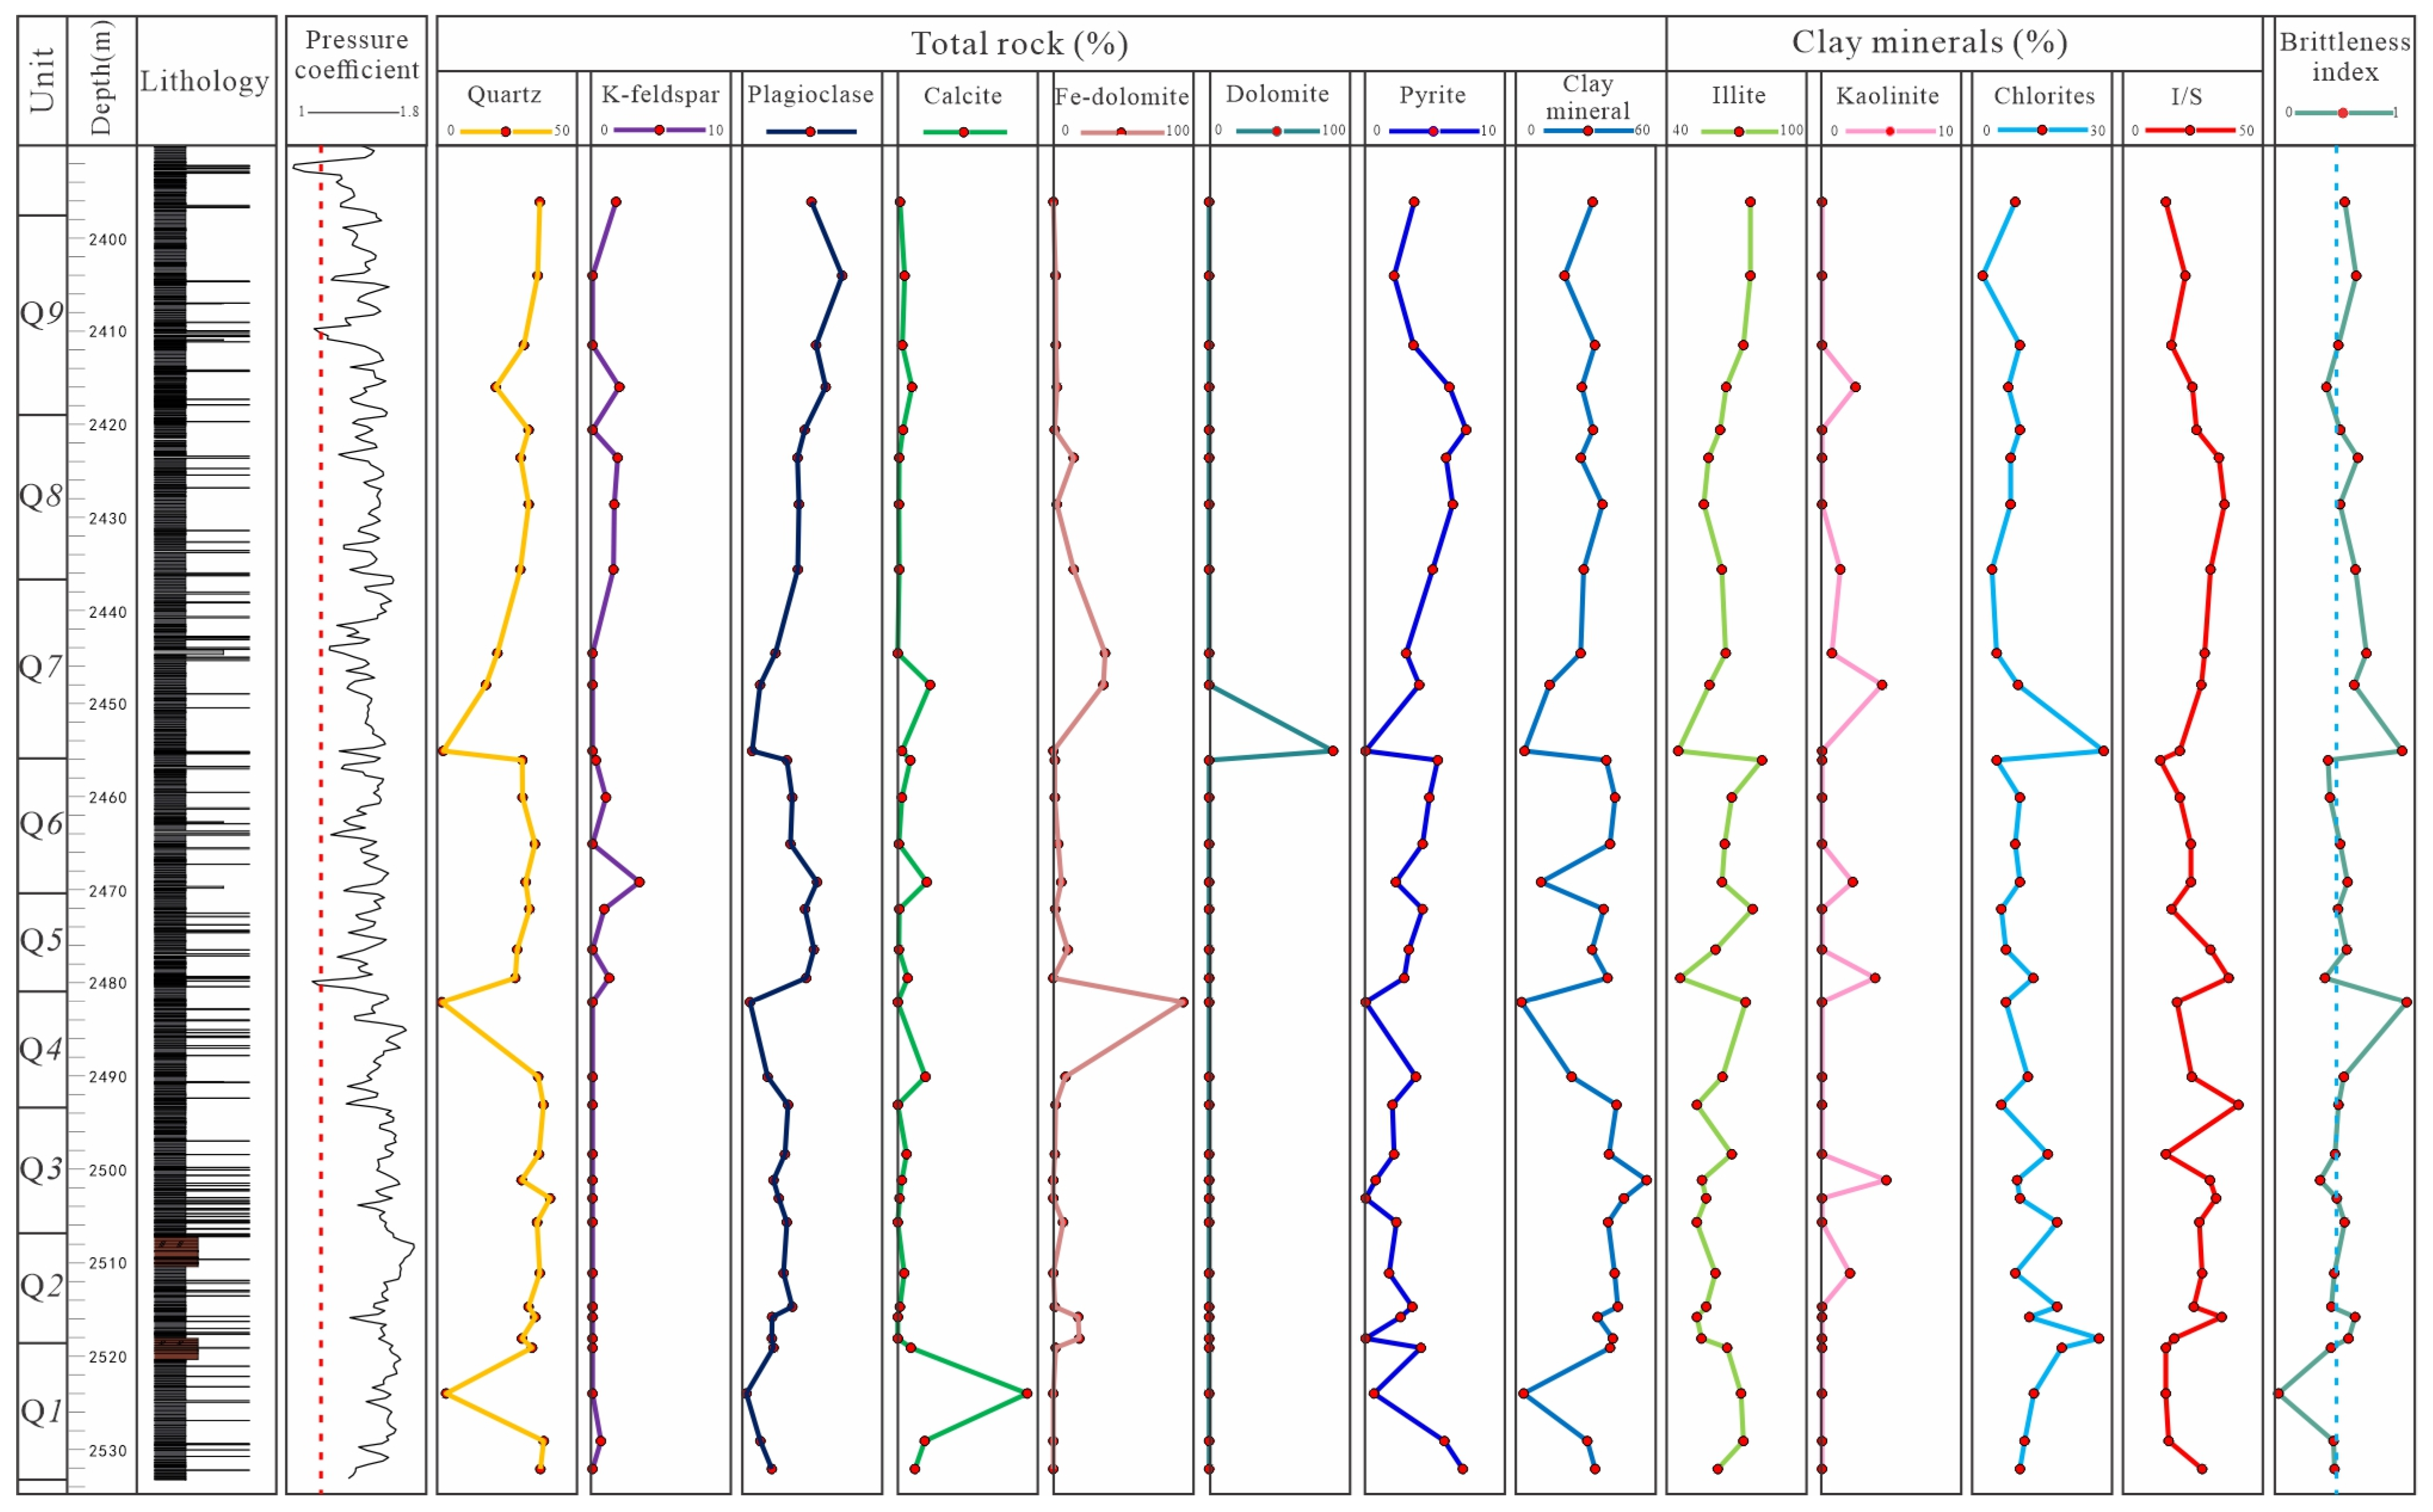
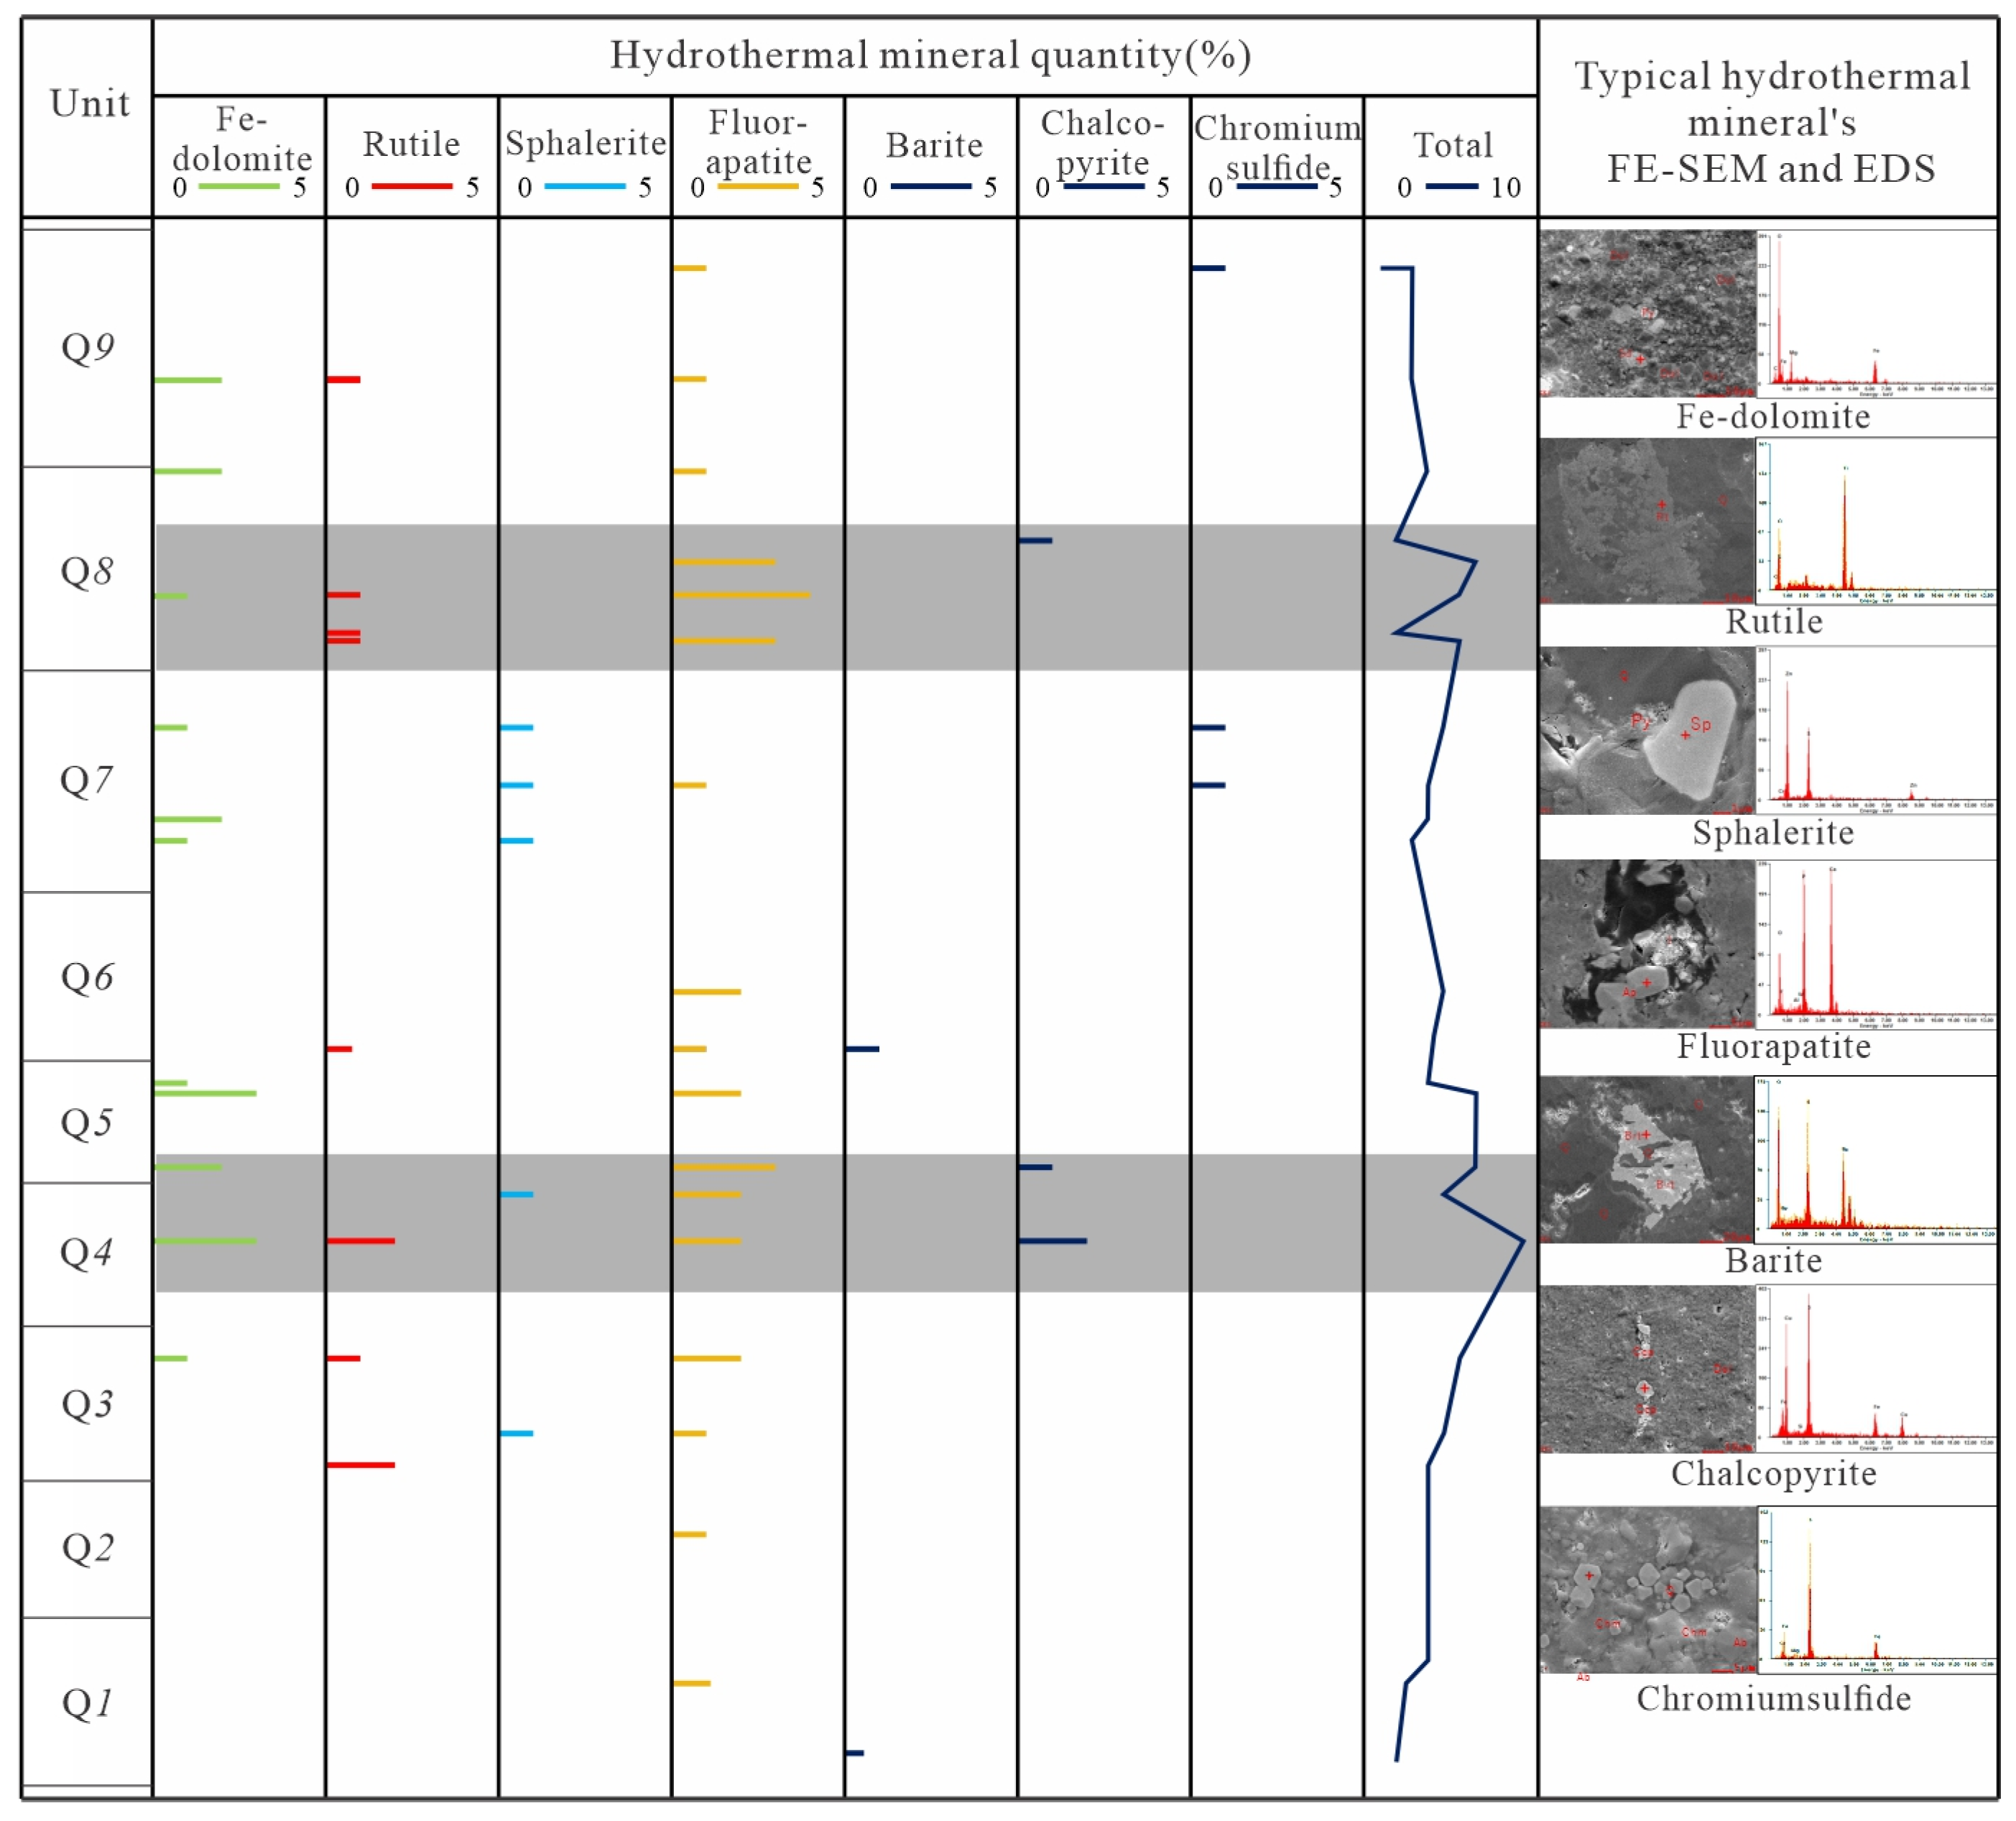
4.1. Petrological and Mineral Characteristics

The sedimentary period of the Qingshankou Formation was dominated by semi-deep lacustrine facies and characterized by large sets of laminated shales in core scale, locally containing siltstone and carbonate interlayers (Figure 2a). Specially, carbonate intercalations and their veins are relatively developed, which include calcite, dolomite, and Fe-dolomite, shown int he microscope scale, and the roundness of these minerals was low but with slight orientation (Figure 2b). On the FE-SEM scale, the Fe-dolomite is cemented around the dolomite, with a high Fe and Mg content (Figure 2c). Additionally, we also found quartz minerals with a hemidiomorphic to idiomorphic character that have the characteristic of directional arrangement (Figure 2d). Typical hydrothermal minerals, such as fluoropapatite, siderite, pyrite, barite, rutile, and copper sulfate, are also found under FE-SEM (Figure 2e).

4.2. Geochemical Characteristics

The TOC of the Q1–Q9 reservoir in well G8 ranges from 0.66% to 3.52%, with an average value of 2.06. TOC content in the bottom (Q2–Q4) is higher than that in the overlying oil layer, which corresponds to the late phase of the water entry system domain and the early phase of the water withdrawal system domain in the first tertiary cycle (Figure 1). The values of S1 and S2 range from 0.78 to 8.23 mg/g (average 3.61 mg/g) and 1.23 to 15.92 mg/g (average 7.18 mg/g), respectively.
The carbon isotope analysis of Qingshankou Formation in well G8 shows high values, ranging from 4.5‰ to 16.2‰, which is appreciably heavier than in marine limestones [31], with an average of 10.27‰, and show the lowest value at Q4 and Q8 units. The value of δ18O shows a progressive depletion character, ranging from −17.70‰ to −5.80‰ with an average of −9.94‰, and has the highest value at Q4 and Q8 units (Table 1).

4.3. Brittleness Characteristics

The main mineral composition of shale from Q1 to Q9 units is quartz and clay minerals, with average contents of 32.28% and 34.5%, respectively (Table 2). Feldspar content is between 10% and 27% and is mainly plagioclase (average content 19.12%), containing a small amount of potassium feldspar. In addition, the average content of calcite is 3.7%, the average content of iron dolomite is about 6.7%, and the average content of pyrite is 3.66%. The clay minerals are mainly illite (I), with an average content of 64.32%, followed by an aemon-mixed layer and chlorite, with an average content of 26.35% and 8.97%, respectively. Notably, the smectite (S) has completely disappeared in all units of the G8 well (Table 2).
There are many factors that affect the brittleness of rocks, such as bedding, mineral composition, and the internal structure of the rocks [32]. This study mainly discusses the hydrothermal activity on brittleness, which alters the mineral composition, thus, we focus on the characteristics of brittleness index changes influenced by mineral changes. Here we apply the following formula of brittleness index proposed by Wang (2009) [33], which considered the quartz (si), carbonate, dolomite, clay, and TOC character:
B = W s i + W d o l o m i t e W s i + W c a r b o n a t e   +   W c l a y + W d o l o m i t e + T O C
where B represents the brittleness index, the W represents mineral content in %, and the subscript represent corresponds to the mineral. The result of B is a range from 0.03 to 0.95, with an average of 0.48 in Q1–Q9 unit (Table 2). With the exception of one abnormally high value, which related to the dolomite interlayer at the Q7 unit, there are two high brittleness index areas at the Q4–Q5 and Q7–Q8 units compared to other units (Figure 3).

5. Discussions

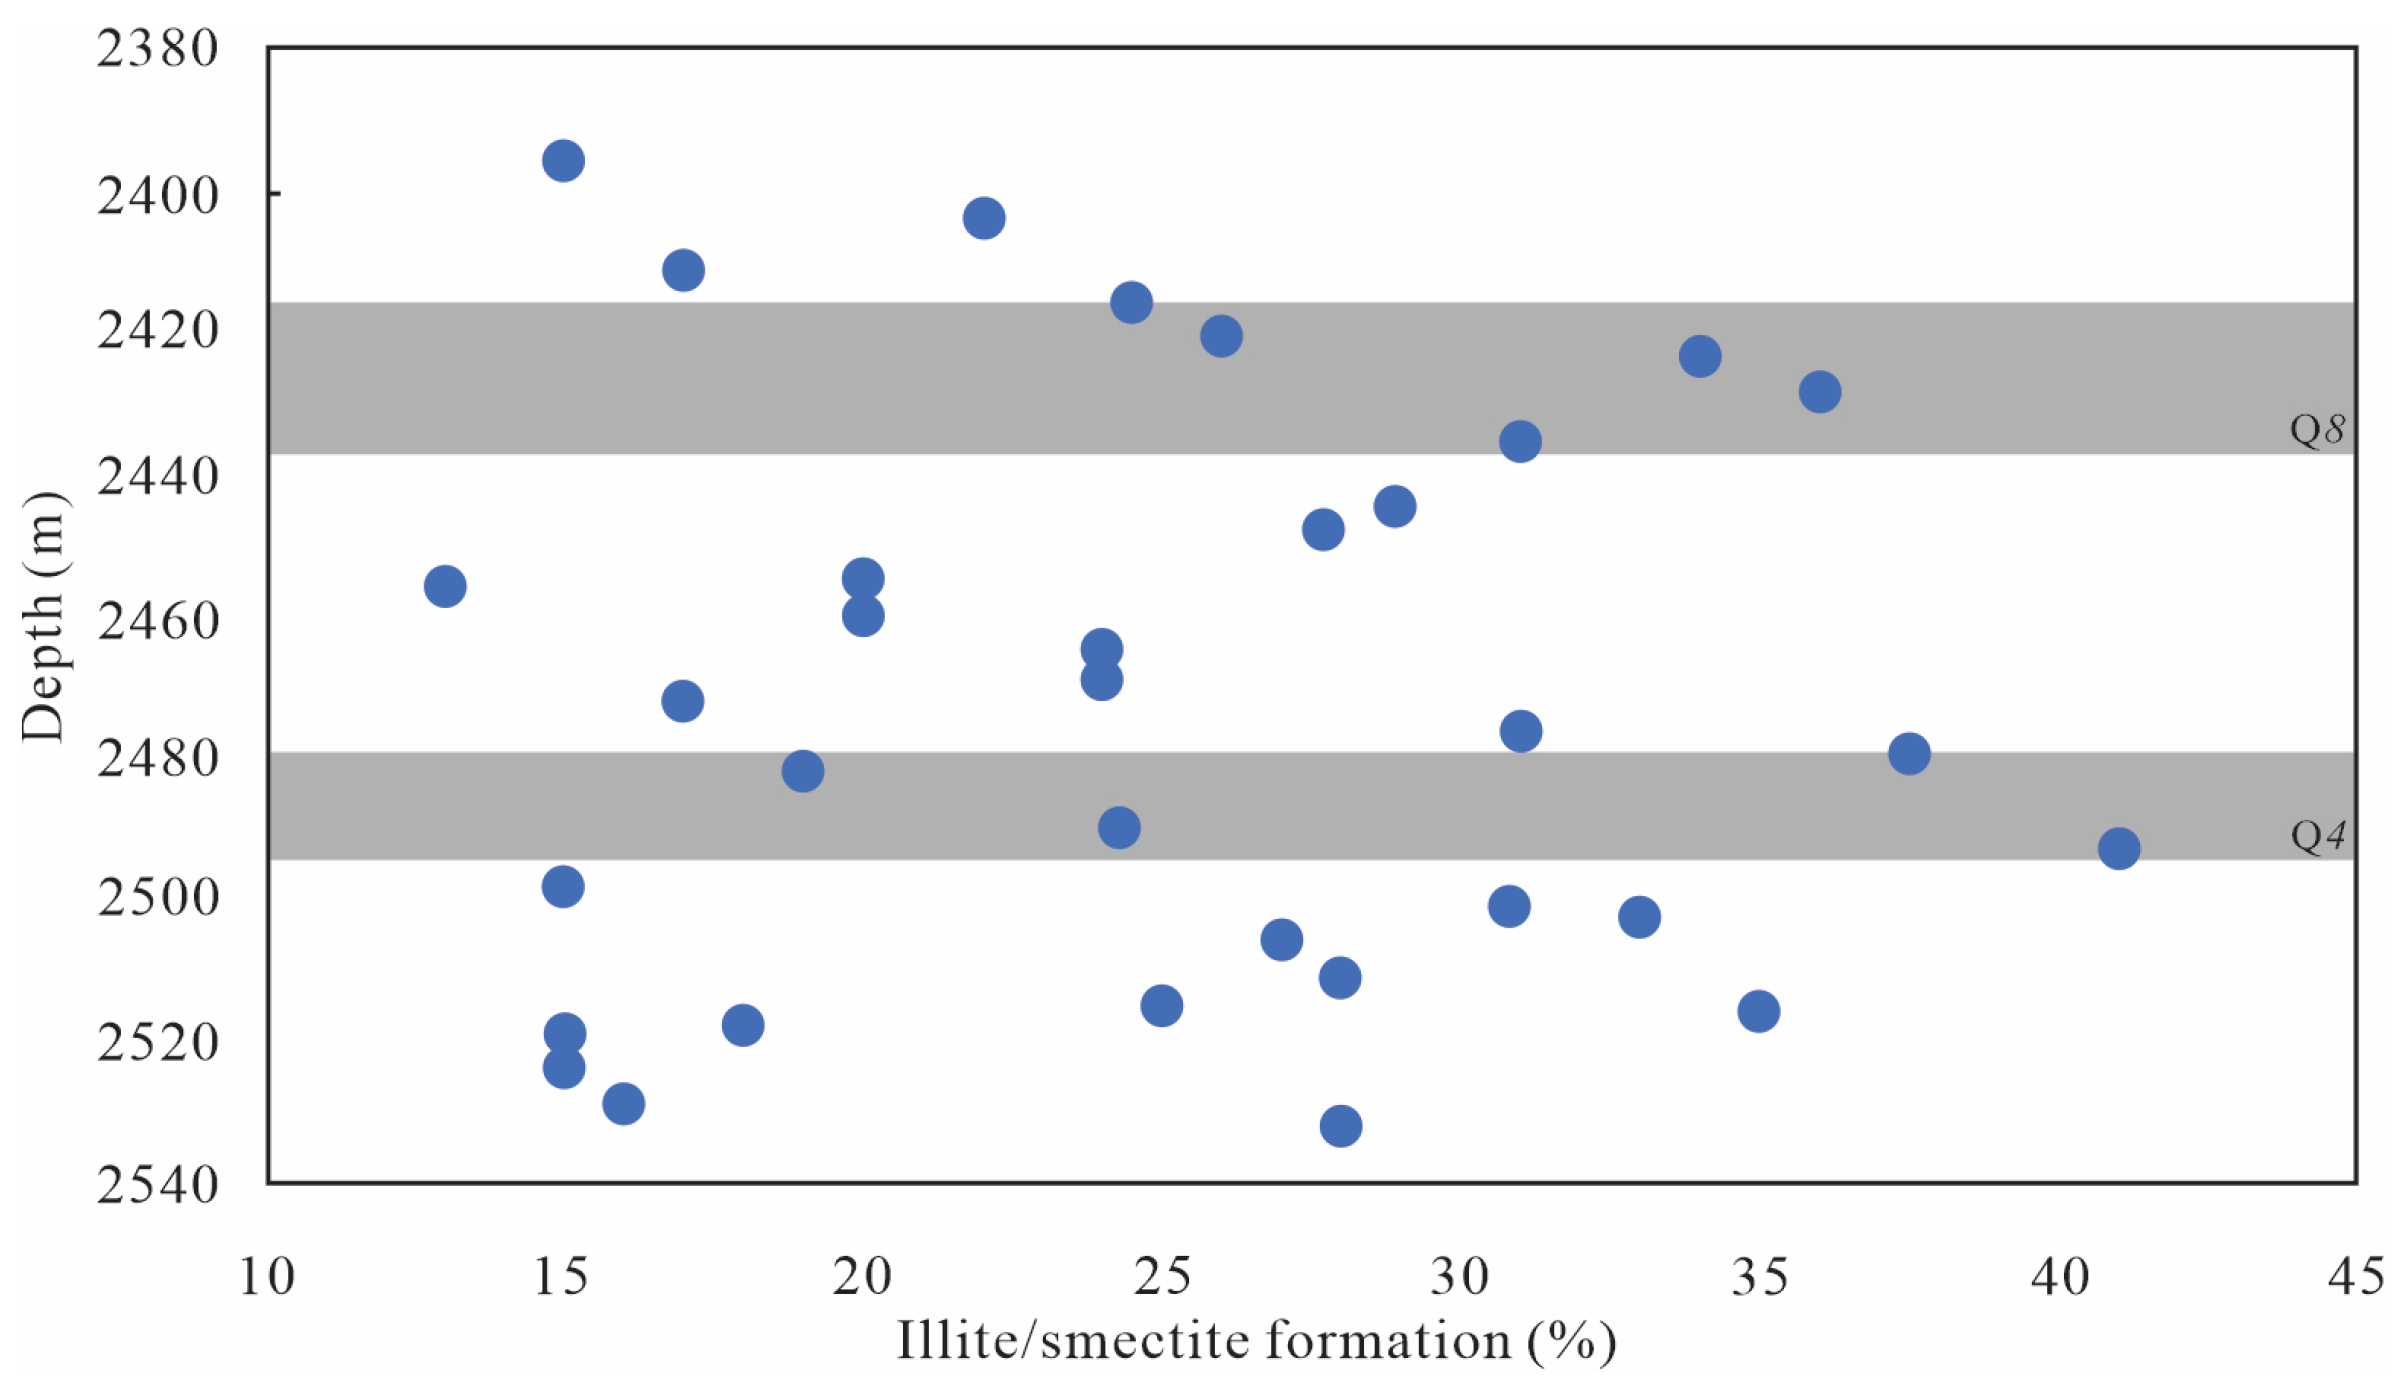
5.1. The Range Affected by Hydrothermal Fluids

5.1.1. Minerals Character

The injection of hydrothermal fluids will alter the temperature and pressure environment and speed up the water–rock interaction due to its abnormal temperature and element composition [34]. After hydrothermal fluid upwells from the deep to shallow reservoir, it always forms some typical hydrothermal mineral associations, such as rutile, sphalerite, fluorapatite, barite, chalcopyrite, chromium sulfide, or other minerals, which can be identified as authigenic minerals according to their orientation and occurrence state [10]. The formation temperature of the above minerals is higher than the present maximum formation temperature at the same depth [28]; therefore, based on FE-SEM images and EDS, we counted how many of these minerals were present in thin sheets from the Q1 to Q9 units (Figure 4). From this figure, we found that, except for the Q6 and Q1 units, these minerals are present in all units and their abundance reaches its maximum at Q4 and Q8 (Figure 4). Thus, the Q4 and Q8 units may be the primary influenced units by hydrothermal fluid.

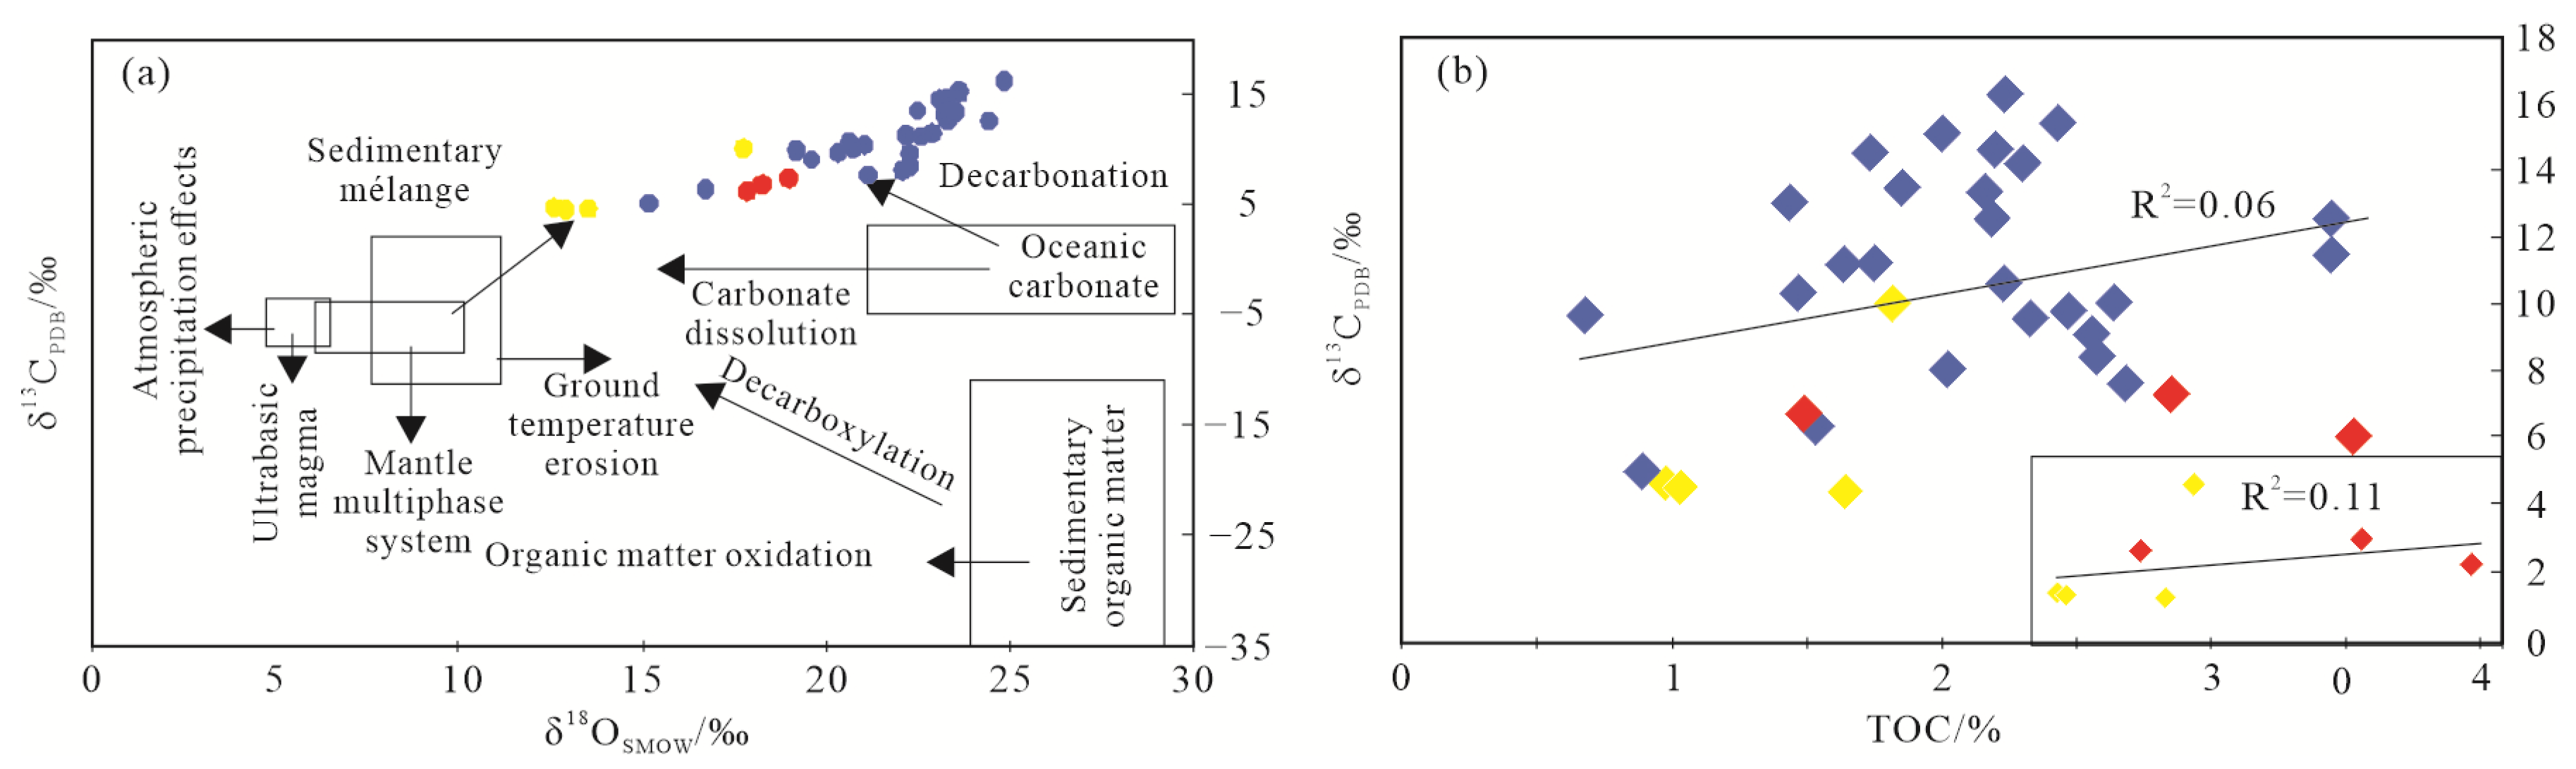
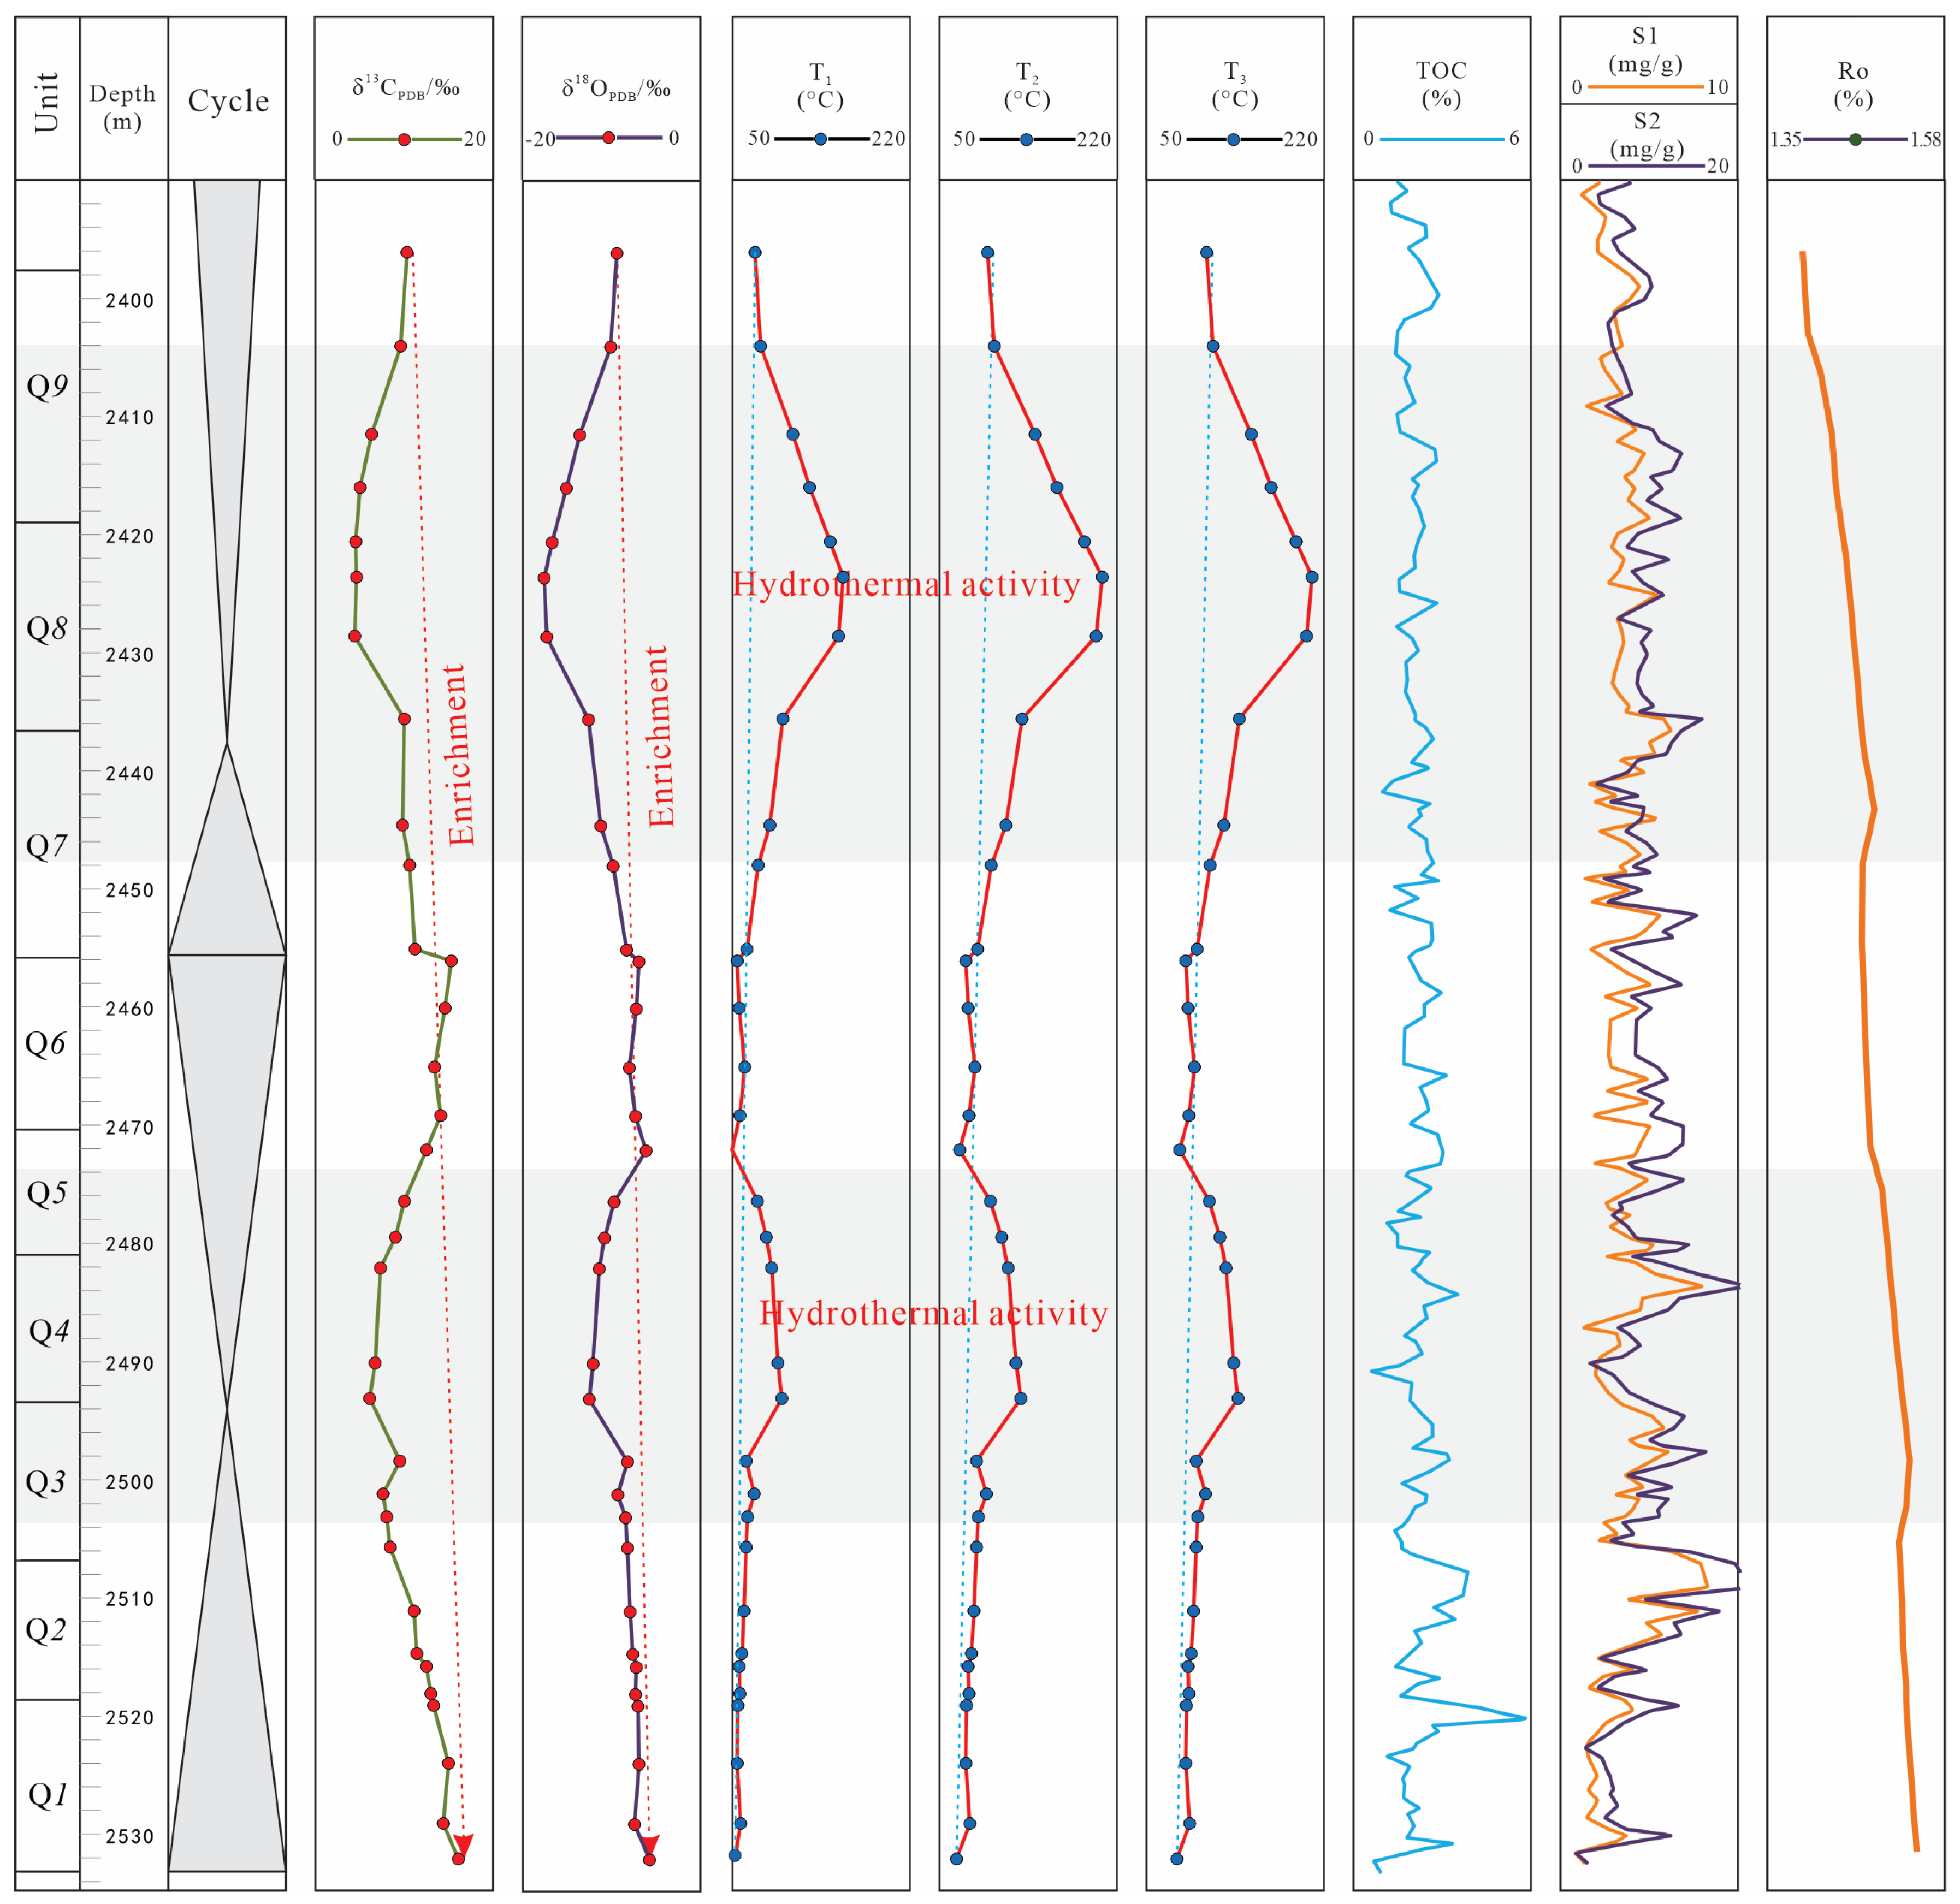
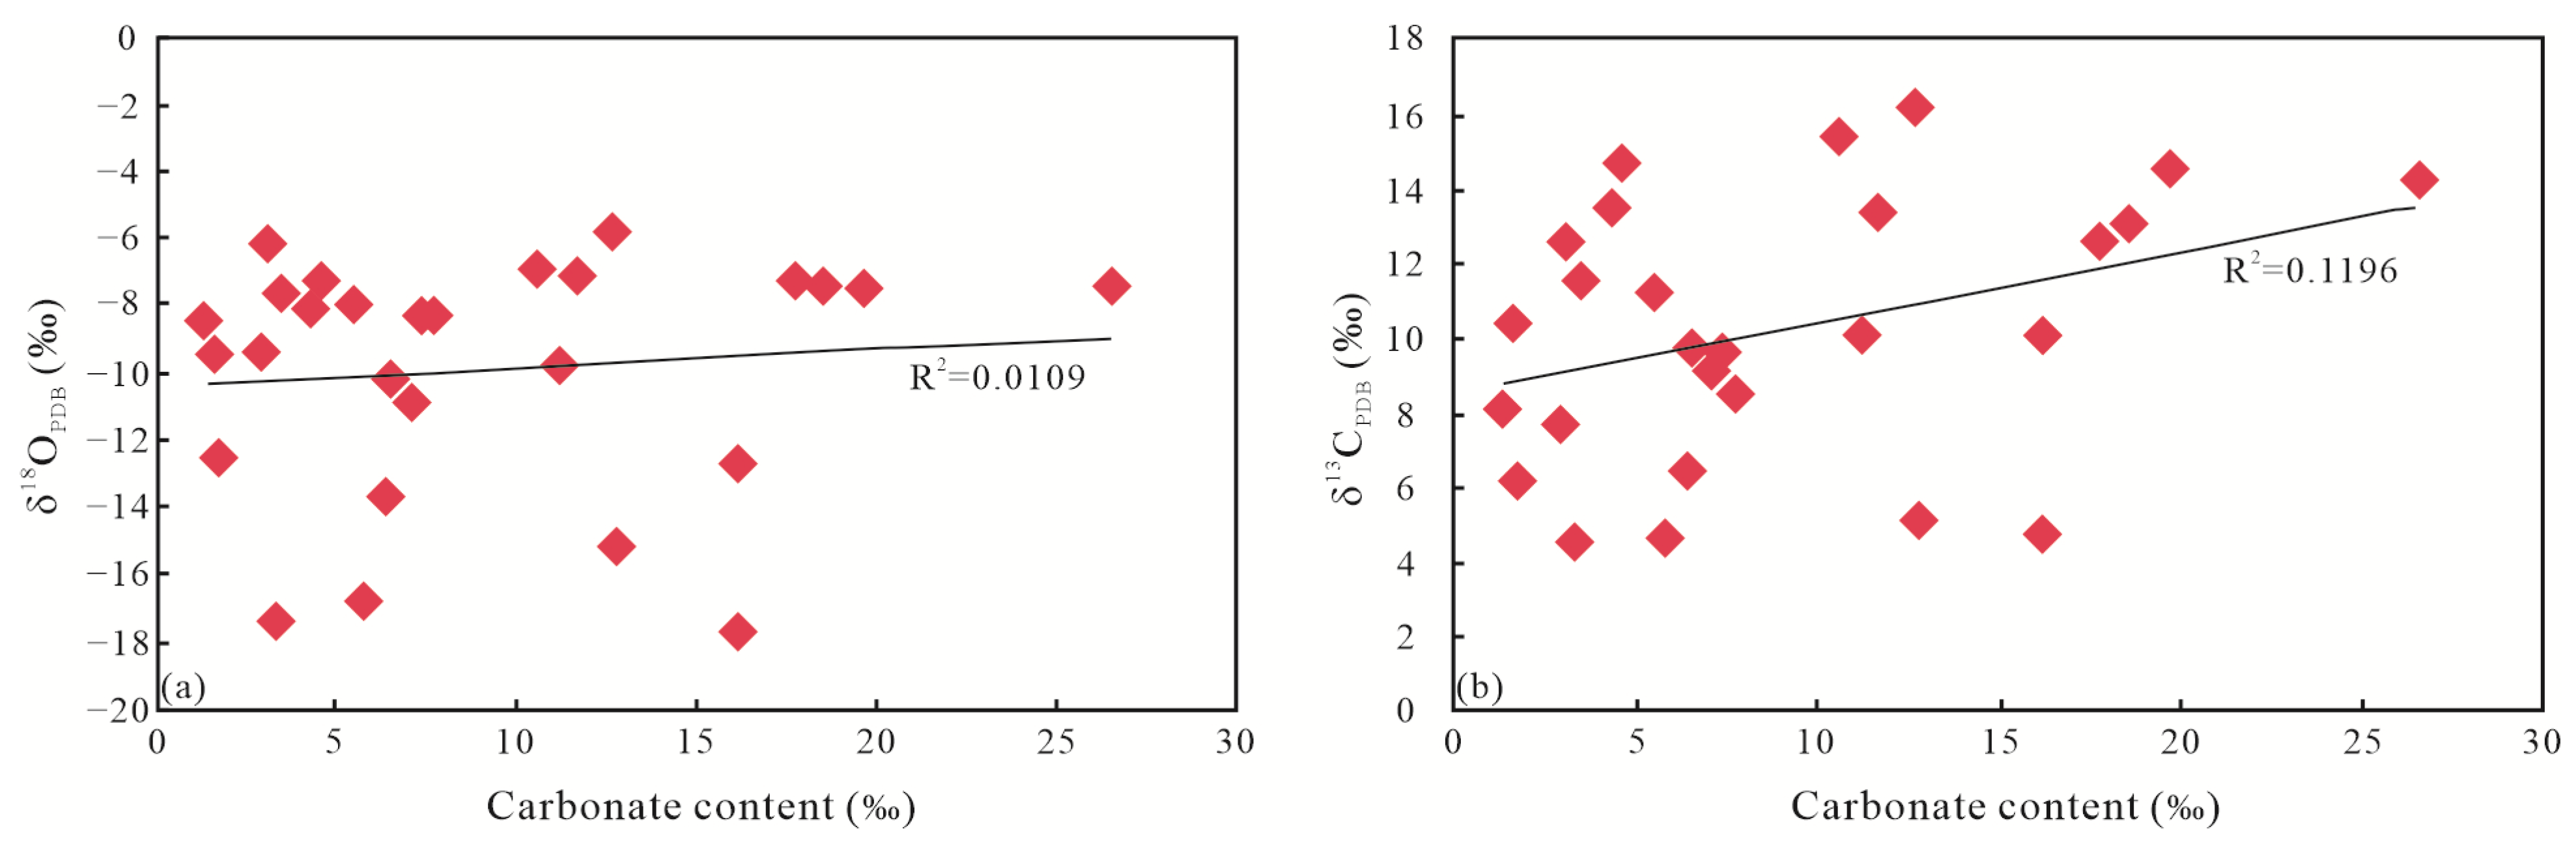
5.1.2. C-O Isotope Character

The fluid–rock interaction by hydrothermal fluid will reset the C-O isotope of carbonate cements, as they have different δ13C and δ18O value [35,36,37]. Thus, the C-O isotope plot becomes the most popular way to identify the source of fluids (Figure 5a) [38]. From this plot map we found that the δ13C value of Gulong Sag’s carbonate has an extreme enrichment of δ13C values beyond the recognition range of common fluids and shows a decarbonation character [10]. A similar character also has been found in Precambrian carbonates [30,39]. Initially they attributed the unusually high δ13C values to high rates of organic carbon burial and associated oxygen flux to the ocean–atmosphere system [40], but it cannot explain the high δ13C values in the reducing environment [41]. Thus, a new authigenic carbonate model was proposed by Higgins et al. (2009) [42], which states that carbonate minerals precipitated within the pore spaces during early diagenesis and high burial fluxes of those authigenic carbonate would have high δ13C values [30]. There is a high TOC value from Q1 to Q9 which enriched in a reducing environment based on geochemical data [5,6], which further implies this new model also fits for Gulong Sag.
There are two main ways to deplete δ13C values: decarboxylation of organic matter and injection of hydrothermal fluids [22,34,43]. The former is more common, which can be identified by the negative relationship between δ13C values and TOC [37]. Thus, we analyzed their correlation (0.06), and found that all samples show a positive correlation, and the correlation was stronger when only Q4 and Q8 were analyzed (0.11; Figure 5b). This bad positive correlation character between δ13C values and TOC implies that the effluence of organic matter is not the main reason for the δ13C value depletion in this study. Additionally, δ18O value of carbonates can also be used in the hydrothermal alteration of carbonate minerals that, if an isotopic rest process is not experienced during later depositional, the δ18O value of carbonates will not lower more than 20‰ [44] or 18‰ [45,46]. The δ18O value of this study ranges from −17.70‰ to −5.80‰, all below 18‰, which implies the carbonate from the Q1 to Q9 units were all more or less affected by the hydrothermal solution, especially for the Q4 and Q8 units (Table 1). Thus, combining the C-O isotope character and hydrothermal mineral distribution character, we conclude that the Q4 and Q8 units are the main hydrothermal fluid-influenced areas, and in the Q2, Q3, Q5, Q7 and Q9 units, its effect becomes weaker.

5.2. The Effect of Hydrothermal Fluid on Organic Matter Enrichment

The hydrothermal activity has a great influence on the abundance of nutrient elements (P, Si, Fe, and Zn) and high temperatures, but the relationship between when it happened and when the shale reservoir formed is more important [11,28]. Previous studies show that the nutrient elements inputted by hydrothermal activity will increase the production of algae blooms, especially diatoms [47,48], but its process needs to happen in the syn-depositional period, not in the late depositional period. There were several volcanic events that occurred during the sedimentary period of the Qingshankou Formation, but they all happened during the late deposition period (the first section of Qingshan Formation), which was verified based on the identification of three volcanic ash strata in the core in K1qn3 [5,6]. However, the high TOC value is mainly distributed at the Q2–Q4 and Q7–Q8 units of the third and second section of the Qingshan Formation (K1qn1; Figure 1); thus, the high TOC value cannot be explained by the proliferation of algae blooms resulting from hydrothermal activity, which may be related to the sedimentary cycle process [6].
Temperature is one important factor in magmatic hydrothermal activity [28], but it is often ignored. The δ18O value may be altered by surface water (like meteoric and sea water) and diagenetic fluid (like petroleum and hydrothermal fluid) [10], and due to the long water–rock interaction time in the reservoir, the δ18O value of carbonated rock will approach the interaction fluids [30]. The δ18O value of sea water estimated based on the Cretaceous marine carbonate is 2.0‰ Vienna Standard Mean Ocean Water (VSMOW) [49,50], and assuming the difference between sea water and meteoric water’s δ18O value was similar to present day (~4‰) [51], the δ18O value of meteoric water at Cretaceous can be estimated as −2.0‰ VSMOW, those values are significantly different to our results (12.6~24.9‰ VSMOW; estimated based on function δ18OVSMOW = 1.03086 × δ18OPDB + 30.86) [52]; This thus implies that the shale reservoir is in a closed environment [53], and the effect by surface water is limited. And this was also consistent with the relationship between δ18O and δ13C, which has a good correlation (R2 = 0.77; Figure 6) implied by a diagenetic influence process [37].
The δ18O value of precipitated carbonate is a function of the temperature after long time water–rock interaction, thus we can roughly calculate the precipitation temperature based on temperature calculation formulas [54,55,56,57,58]. Due to the calcite, iron dolomite, and dolomite all found in Q1 to Q9 units, the formulas of each mineral all applied in this study (Figure 7). The results implied that the precipitation temperature was between 78.8 °C to 208.7 °C but the temperatures did not increase with depth such that the highest temperature achieved was at the Q8 and Q4 units (Figure 7). This value was also higher than the latter diagenetic stage B (140–170 °C). This character further verified the hydrothermal activity influence. In particular, these unusually high temperatures form premature shale (Ro abnormal increase) and a large amount of S1 is formed in the reservoir (Figure 7) [14]. This influence character can also be found in the Yinggehai Basin and Jeanne d’Arc Basin [10,43]. Additionally, the abnormal temperature is higher in Q8 than Q4, which led the S1 in Q8 to be higher than Q4, but the opposite is true in Figure 7. This contradiction may be attributed to the higher Ro in Q4 than Q8. As the S1 represents the free oil of shale, during the main hydrocarbon generation stage, the higher Ro will pyrolysize a larger S1 [59,60]. The Ro is the result of both time and temperature, though the Ro in the Q4 and Q8 is obviously higher than normal strata, but in Q4 it is still higher than in Q8 (Figure 7), and this character may be the reason that limits the application of conventional geochemistry in identifying the strength of hydrothermal influence. Thus, the hydrothermal activity that happened after the sedimentary period mainly affected the formation process of oil and gas in the form of temperature, rather than affecting the productivity of algae blooms, according to the difference between TOC and S1 distribution character. Additionally, the active alkali metal element (e.g., Fe) carried by hydrothermal fluid can also promote the organic matter maturation process that acts as a catalyst [54].

5.3. The Dual Effect of Hydrothermal Fluid on Brittleness

The hydrothermal activity not only promoted the maturation process, but also altered the mineral transformation process by its abnormal temperature and element of the upward fluid from depth [10]. In the thermal activity area, the high temperature will further accelerate the process of reservoir diagenesis (e.g., the pressure dissolution between minerals), especially at temperatures above 100 °C [61], which makes the contact between the minerals closer and the density greater. This process will lead shale rock to become more brittle [32]. The content of I/S is always used to indicate the diagenetic evolution process of reservoir; the lower the value, the higher the diagenetic evolution stage [61]. From Figure 8 we found that around 2430 m (Q4 unit) and 2490 m (Q8 unit) have an abnormal high I/S content, which does not follow the pattern of decreasing with increasing depth [62]. This also contradicts the fact that the higher the temperature, the stronger the diagenesis [61]. This character has also been found in many areas, like Yinggehai Basin, which contributes to its influence of overpressure caused by hydrothermal activity [10]. From the Q1–Q9 units, we found obvious overpressure characteristics, with an overpressure coefficient greater than 1.2, especially in Q2–Q4 and the middle of Q9 to the middle of Q7 (Figure 3), which further implied the reservoir had a closed environment according to the δ18O value (Figure 7). And this means that the overpressure acts as protection for the shale reservoir, and its influence on reservoir is more important than temperature caused by hydrothermal activity [10]. This protection can also be seen from the relationship between the C-O isotope and the carbonate, which reveals that the depletion in C-O isotope results in a low carbonate content (Figure 9), which may be due to the acidity of the hydrothermal fluid. This process can reduce the content of a brittle mineral (e.g., carbonate) [63].
The elements afforded by acid hydrothermal fluid will alter the mineral transfer mechanism and change the rock’s brittleness [6,10]. Acid hydrothermal fluid injection changes the fluid environment from alkaline to acidic, and make the chlorite unstable and begin to transform into kaolinite (Fe3.5Mg3.5Al6Si6O20(OH)16 (chlorite) + 14H+→3Al2Si2O5(OH)4 (kaolinite) + 3.5Fe2+ + 3.5Mg2+ + 9H2O) [64]. This character can be seen from the clay mineral distributed from the Q1–Q9 units (Figure 3), from which the kaolinite only around the Q4 and Q8 can be detected. In addition, during the conversion of clay minerals and hydrothermal fluid injection, a large number of Na+, Ca2+, Mg2+, Fe3+, and Si4+ are discharged, which provide material sources for brittle minerals, like albitization and Fe-dolomite (Figure 3) [22]. Although those process will form brittle minerals, the decrease of carbonate minerals becomes more obvious through the removal of CO2 and the formation of new carbonates in the upper and/or lower reservoirs, increasing its brittleness index (e.g., Q7 and Q5; Figure 3 and Figure 9) [65,66]. This character can also be seen from the carbonate content. The calcite content is primarily higher in other transition units, while the Fe-dolomite is mainly in the Q4 and Q8 units, whose formation is related to hydrothermal activity (Figure 3; [5]). In total, the dual effect of hydrothermal activity on the shale reservoir was mainly a decrease in the rock’s brittle minerals and a decrease in the brittleness index around the Q4 and Q8 units (Figure 3). In addition, the overpressure induced by hydrothermal activity reveals a protection over the shale reservoir, but it has a certain consistent effect on the formation of brittle minerals.

6. Conclusions

In our study we discussed the dual effect of hydrothermal activity on shale reservoir of Gulong Sag, Songliao Bsin, based on C-O isotope and geochemistry data. Follow conclusions can be obtained:
(1)
Typical hydrothermal mineral identification (such as rutile, sphalerite, fluorapatite, barite, chalcopyrite, chromium sulfide) and shift to negative of C-O isotope character from Q1 to Q9 implied Q4 and Q8 unit are the main hydrothermal fluid influence area, and its effect become weaker in other units.
(2)
The Ro, TOC and S1 + S2 evolution character, accompany with the volcanic ash strata distribution character, implied that the hydrothermal activity cannot proliferation of algae blooms by nutrient elements input, but its high temperature (around 208 °C), calculated by δ18O temperature calculation formulas, promote the organic matter mature process around Q4 and Q8.
(3)
The high temperature and element from hydrothermal fluid changed the minerals composition and decreased the brittleness index based on XRD, though the overpressure caused by this process has a protection for the shale reservoir, but it also has a certain consistent effect on the formation of brittle minerals.

Author Contributions

Methodology, X.F.; Investigation, Y.B. and H.Z.; Writing—original draft, J.L.; Writing—review & editing, Z.L. and R.Z. All authors have read and agreed to the published version of the manuscript.

Funding

This research was funded by the PetroChina Oil & Gas and New Energy Company technology project [2023YQX10109], the National Natural Science Foundation [42002153, 42102173 and 42172161], Heilongjiang Philosophy and Social Science Foundation [22EDE389], the China Postdoctoral Science Foundation [2021M691193], and the Jilin Province People’s Government Department of Education [JJKH20211111KJ].

Data Availability Statement

The data used in this study all can be seen in this paper.

Conflicts of Interest

Authors Junhui Li, Xiuli Fu, Yue Bai were employed by the company Exploration and Development Research Institute of Daqing Oilfield Company Ltd. The remaining authors declare that the research was conducted in the absence of any commercial or financial relationships that could be construed as a potential conflict of interest.

References

  1. Liu, B.; Bai, L.; Chi, Y.; Jia, R.; Fu, X.; Yang, L. Geochemical characterization and quantitative evaluation of shale oil reservoir by two-dimensional nuclear magnetic resonance and quantitative grain fluorescence on extract: A case study from the Qingshankou Formation in Southern Songliao Basin, northeast China. Mar. Pet. Geol. 2019, 109, 561–573. [Google Scholar] [CrossRef]
  2. Liu, B.; Wang, H.; Fu, X.; Bai, Y.; Bai, L.; Jia, M.; He, B. Lithofacies and depositional setting of a highly prospective lacustrine shale oil succession from the Upper Cretaceous Qingshankou Formation in the Gulong sag, northern Songliao Basin, northeast China. AAPG Bull. 2019, 103, 405–432. [Google Scholar] [CrossRef]
  3. Zhao, Z.; Littke, R.; Zieger, L.; Hou, D.; Froidl, F. Depositional environment, thermal maturity and shale oil potential of the Cretaceous Qingshankou Formation in the eastern Changling Sag, Songliao Basin, China: An integrated organic and inorganic geochemistry approach. Int. J. Coal Geol. 2020, 232, 103621. [Google Scholar] [CrossRef]
  4. Zhao, R.; Jiang, H.; Ren, L.; Deng, S.; Liu, Z. Carbon isotope fractionation characteristics during the oil shale water extraction process and its implications. Energy Fuels 2022, 36, 2993–3002. [Google Scholar] [CrossRef]
  5. He, W.; Zhu, R.; Cui, B.; Zhang, S.; Meng, Q.; Bai, B.; Feng, Z.; Lei, Z.; Wu, S.; He, K.; et al. The Geoscience Frontier of Gulong Shale Oil: Revealing the Role of Continental Shale from Oil Generation to Production. Engineering 2023, 28, 79–92. [Google Scholar] [CrossRef]
  6. Zhang, T.; Zhu, R.; Cai, Y.; Wang, H.; Lv, D.; Zou, H.; Fu, X.; Liu, C.; Cui, K.; Zhang, S.; et al. Distribution of organic matter in the Qingshankou Formation Shale, Gulong Sag, Songliao Basin observed within an isochronous sequence stratigraphic framework. Oil Gas Geol. 2023, 44, 869–886. (In Chinese) [Google Scholar]
  7. Fu, X.; Shi, H.; Meng, Q.; Liu, B.; Liang, J.; He, J.; Ran, Q.; Gong, L.; Jia, R. Controlling effects of the structure and deposition on the shale oil enrichment: Taking Formation qn1 in the Central Depression of Songliao Basin as an instance. Pet. Geol. Oilfield Dev. Daqing 2020, 39, 56–71. (In Chinese) [Google Scholar]
  8. Tao, H.; Qiu, Z.; Qu, Y.; Liu, J.; Qin, Z.; Xie, Z.; Qiu, J.; Liu, B. Geochemistry of Middle Permian lacustrine shales in the Jimusar Sag, Junggar Basin, NW China: Implications for hydrothermal activity and organic matter enrichment. J. Asian Earth Sci. 2022, 232, 505267. [Google Scholar] [CrossRef]
  9. You, J.; Liu, Y.; Li, Y.; Zhou, D.; Zheng, Q.; Yang, Y.; Shi, J.; Gao, H. Influencing factor of Chang 7 oil shale of Triassic Yanchang Formation in Ordos Basin: Constraint from hydrothermal fluid. J. Pet. Sci. Eng. 2021, 201, 108532. [Google Scholar] [CrossRef]
  10. Cao, J.; Luo, J.; Fan, C.; Li, S.; Wu, S.; Fu, Y.; Shi, X.; Dai, L.; Hou, J. Deep thermal fluid activity and its influence on the diagenesis and pore evolution of reservoirs: A case study from the Miocene Huangliu Formation reservoir in the LDX area, Yinggehai Basin, northern South China Sea. Earth Sci. Front. 2022, 29, 412–429. (In Chinese) [Google Scholar]
  11. Zhang, L.; Zhang, F.; Zhao, Z.; Gao, J.; Li, C.; Wang, Q.; Zhu, Z. Research progress on identification methods and geological significance for oil and gas of hydrothermal fluid activity. Mar. Pet. Geol. 2023, 28, 225–238. (In Chinese) [Google Scholar]
  12. Liu, J.; Liu, W.; Wang, C. Hydrothermal Fluids Flow Types in Sedimentary Basins and Its Significance of Petroleum Geology. Offshore Oil 2004, 24, 8–13. (In Chinese) [Google Scholar]
  13. Chen, Z.; Meng, X.; Song, X.; Long, K. Analysis of sequences and sources of diagenetic fluid in Leikoupo Formation, Western Sichuan Basin. Pet. Geol. Recovery Effic. 2021, 28, 33–40. (In Chinese) [Google Scholar]
  14. Xie, X.; Cheng, J.; Meng, Y. Basin fluid flow and associated diagenetic processes. Acta Sedmentological Sin. 2009, 27, 863–871. (In Chinese) [Google Scholar]
  15. Crerar, D.; Namson, J.; Chyi, M.; Williams, L.; Feigenson, M. Manganiferous cherts of the Franciscan assemblage. 1. General geology, ancient and modern analogs, and implications for hydrothermal convection at oceanic spreading centers. Econ. Geol. 1982, 77, 519–540. [Google Scholar] [CrossRef]
  16. Tiercelin, J.; Pflumio, C.; Castrec, M.; Boulégue, J.; Gente, P.; Rolet, J.; Coussement, C.; Stetter, K.; Huber, R.; Buku, S.; et al. Hydrothermal vents in Lake Tanganyika, East African Rift system. Geology 1993, 21, 499–502. [Google Scholar] [CrossRef]
  17. Zhong, D.; Jiang, Z.; Guo, Q.; Sun, H. A review about research history, situation and prospects of hydrothermal sedimentation. J. Palaeogeogr. 2015, 17, 285–296. [Google Scholar]
  18. He, C.; Ji, L.; Su, A.; Liu, Y.; Li, J.; Wu, Y.; Zhang, M. Relationship between hydrothermal sedimentation process and source rock development in the Yanchang Formation in southern Ordos Basin. Earth Sci. Front. 2017, 24, 277–285. [Google Scholar]
  19. Karl, D.; Wirsen, C.; Jannasch, H. Deep-sea primary production at the Galapagos hydrothermal vents. Science 1980, 2017, 1345–1347. [Google Scholar] [CrossRef]
  20. You, J.; Liu, Y.; Zhou, D.; Zheng, Q.; Vasichenko, K.; Chen, Z. Activity of hydrothermal fluid at the bottom of a lake and its influence on the development of high-quality source rocks: Triassic Yanchang Formation, southern Ordos Basin, China. Aust. J. Earth Sci. 2020, 67, 115–128. [Google Scholar] [CrossRef]
  21. Sun, B.; Yang, W. Folded calcite cracks in noncalcareous shales: A window into shale diagenesis and hydrothermal influence. J. Sediment. Res. 2023, 93, 875–894. [Google Scholar] [CrossRef]
  22. Xiong, Z.; Cao, Y.; Liang, C. Characteristics and origin of crystalline dolomite: A case from Paleogene lacustrine fine-grained rocks in Jiyang depression, Bohai Bay Basin, China. Mar. Pet. Geol. 2024, 162, 106694. [Google Scholar] [CrossRef]
  23. Li, D.; Huang, Y.; Cheng, H.; Wang, E.; Huang, Q.; Wang, H.; Wang, W.; Duan, C. Brittleness Estimation from Late Permian Mud Shale Well-Log Data at Songliao Basin Applying Rock Physical Simulation. Pure Appl. Geophys. 2023, 180, 3919–3945. [Google Scholar] [CrossRef]
  24. Liu, Y.; Duo, Y.; Zhang, M.; Meng, S.; Wang, S.; Su, Y.; Xu, L. Application of nano-scratch technology to identify continental shale mineral composition and distribution length of bedding interfacial transition zone—A case study of Cretaceous Qingshankou formation in Gulong Depression, Songliao Basin, NE China. Geoenergy Sci. Eng. 2024, 234, 212674. [Google Scholar]
  25. Liu, C.; Wang, Z.; Guo, Z.; Hong, W.; Dun, C.; Zhang, X.; Li, B.; Wu, L. Enrichment and distribution of shale oil in the Cretaceous Qingshankou Formation, Songliao Basin, Northeast China. Mar. Pet. Geol. 2017, 86, 751–770. [Google Scholar] [CrossRef]
  26. Chen, R.; Shang, F.; Cao, Y.; Song, L.; Li, Z. A comparative study of oil shale deposition in the Upper Cretaceous Nenjiang Formation, NE China: Evidence from petrographic and geochemical analyses. J. Pet. Sci. Eng. 2022, 219, 111130. [Google Scholar] [CrossRef]
  27. Li, Y.; Xu, X.; Zhang, J.; Chen, S.; Bai, J.; Liu, W.; Wang, Q. Hybrid Sedimentary Conditions of Organic-Rich Shales in Faulted Lacustrine Basin during Volcanic Eruption Episode: A Case Study of Shahezi Formation (K1sh Fm.), Lishu Faulted Depression, South Songliao Basin. J. China Univ. Geosci. 2022, 47, 1728–1747. [Google Scholar]
  28. Yuan, J.; Zhou, T.; Zhao, G. Identification marks of deep thermal fluid activity and its effect on reservoir transformation. Acta Geol. Sin. 2023, 97, 2067–2083. (In Chinese) [Google Scholar]
  29. Niu, P.; Han, J.; Zeng, Z.; Hou, H.; Liu, L.; Ma, G.; Guan, Y. Deep controlling factor of the geothermal field in the Songliao basin derived from magnetotelluric survey. Chin. J. Geophys. 2021, 64, 4060–4074. (In Chinese) [Google Scholar]
  30. Gazdewich, S.; Hauck, T.; Husson, J. Authigenic Carbonate Burial within the Late Devonian Western Canada Sedimentary Basin and Its Impact on the Global Carbon Cycle. Geochem. Geophys. Geosyst. 2024, 25, e2023GC011376. [Google Scholar] [CrossRef]
  31. Zhao, R.; Shan, X.; Yi, J.; Du, X.; Liang, Y.; Zhang, Y. Geochemistry of HCO3-Na thermal water from the Gudian slope: Insights into fluid origin, formation mechanism and circulation in the Yitong Basin, Northeast. Appl. Geochem. 2018, 91, 185–196. [Google Scholar] [CrossRef]
  32. Lawa, L.; Mahmoud, M.; Adebayo, A.; Sultan, A. Brittleness and microcracks: A new approach of brittleness characterization for shale fracking. J. Nat. Gas Sci. Eng. 2021, 87, 103793. [Google Scholar]
  33. Wang, K. Exploration and development prospects of unconventional oil and gas resources in China. Pet. Petrochem. Co. 2009, 17, 24–27. (In Chinese) [Google Scholar]
  34. Yang, X.; Yan, D.; Zhang, B.; Zhang, L.; Wei, X.; Li, T.; Zhang, J.; She, X. The impact of volcanic activity on the deposition of organic-rich shales: Evidence from carbon isotope and geochemical compositions. Mar. Pet. Geol. 2021, 128, 105010. [Google Scholar] [CrossRef]
  35. Zhao, R.; Shan, X.; Wu, C.; Yi, J.; Hao, G.; Wang, P. Formation and evolution of the Changbaishan volcanic geothermal system in a convergent plate boundary back-arc region constrained by boron isotope and gas data. J. Hydrol. 2019, 569, 188–202. [Google Scholar] [CrossRef]
  36. Lan, C.; Long, X. Redox-stratified seawater during the GOE: Evidences from rare earth elemental and C-O isotopic compositions of Paleoproterozoic BIF and carbonate rocks from the Taihua Group, North China Craton. Ore Geol. Rev. 2023, 157, 105424. [Google Scholar] [CrossRef]
  37. Makhnacha, A.; Pokrovskyb, B.; Murashkoa, O.; Petrov, O. Carbon and Oxygen Isotopes and Formation Conditions of the Upper Famennian Shale-Bearing Rocks in the Pripyat Trough, Southern Belarus. Lithol. Miner. Resour. 2020, 55, 24–35. [Google Scholar] [CrossRef]
  38. Hu, X.; Müller, I.; Zhao, A.; Ziegler, M.; Chen, Q.; Han, L.; Shi, Z. Clumped isotope thermometry reveals diagenetic origin of the dolomite layer within late Ordovician black shale of the Guanyinqiao Bed (SW China). Chem. Geol. 2022, 588, 120641. [Google Scholar] [CrossRef]
  39. Johnston, D.; Macdonald, F.; Gill, B.; Hoffman, P.; Schrag, D. Uncovering the Neoproterozoic carbon cycle. Nature 2012, 483, 320–323. [Google Scholar] [CrossRef]
  40. Kump, L.; Garrels, R. Modeling atmospheric O2 in the global sedimentary redox cycle. Am. J. Sci. 1986, 286, 337–360. [Google Scholar] [CrossRef]
  41. Derry, L. Causes and consequences of mid-Proterozoic anoxia. Geophys. Res. Lett. 2015, 42, 8538–8546. [Google Scholar] [CrossRef]
  42. Higgins, J.; Fischer, W.; Schrag, D. Oxygenation of the ocean and sediments: Consequences for the seafloor carbonate factory. Earth Planet. Sci. Lett. 2009, 284, 25–33. [Google Scholar] [CrossRef]
  43. Luan, G.; Azmy, K.; Meyer, R.; Olanipekun, B.; Dong, C. Origin of carbonate cements in Ben Nevis sandstones of Jeanne d’Arc Basin: Insights from geochemistry. Mar. Pet. Geol. 2023, 148, 106033. [Google Scholar] [CrossRef]
  44. Melezhik, V.; Fallick, A.; Pokrovsky, B. Enigmatic nature of thick sedimentary carbonates depleted in 13C beyond the canonicalmantle value: The challenges to our understanding of the terrestrial carbon cycle. Precambr. Res. 2005, 137, 131–165. [Google Scholar] [CrossRef]
  45. Feng, W.; Zheng, Y.; Zhou, J. Carbon and oxygen isotope Geochemistry of marbles from the Dabie-Sulu orogenic belt. Acta Petrol. Sin. 2003, 19, 468–478. (In Chinese) [Google Scholar]
  46. Aharon, P. Redox stratification and anoxia of the early Precambrian oceans: Implications for carbon isotope excursions and oxidation events. Precambr. Res. 2005, 137, 207–222. [Google Scholar] [CrossRef]
  47. Watson, A.; Bakker, D.; Ridgwell, A.; Boyd, P.; Law, C. Effect of iron supply on Southern Ocean CO2 glacial atmospheric CO2 uptake and implications for. Nature 2000, 407, 730–733. [Google Scholar] [CrossRef] [PubMed]
  48. Tagliabue, A.; Bowie, A.; Boyd, P.; Buck, K.; Johnson, K.; Saito, M. The integral role of iron in ocean biogeochemistry. Nature 2017, 543, 51–59. [Google Scholar] [CrossRef]
  49. Garzanti, E. Petrographic classification of sand and sandstone. Earth Sci. Rev. 2018, 192, 545–563. [Google Scholar] [CrossRef]
  50. Isson, T.; Rauzi, S. Oxygen isotope ensemble reveals Earth’s seawater, temperature, and carbon cycle history. Science 2024, 383, 666–670. [Google Scholar] [CrossRef]
  51. Clark, I.; Fritz, P. Environmental Isotopes in Hydrogeology; Lewis: New York, NY, USA, 1997. [Google Scholar]
  52. Qiang, Z. Carbonate Reservoir Geology; University of Petroleum Press: Beijing, China, 2007. [Google Scholar]
  53. Shangola, S.; Al-Jaleel, H.; Tobia, F. Stable isotopes and rare-earth elements of carbonate rocks, Paleocene–Eocene Kolosh Formation, High Folded Zone, NE Iraq: Implication for depositional environment and Diagenesis. Carbonates Evaporites 2023, 38, 77. [Google Scholar] [CrossRef]
  54. Kang, S.; Sun, Y.; Qiao, M.; Li, S.; Deng, S.; Guo, W.; Li, J.; He, W. The enhancement on oil shale extraction of FeCl3 catalyst in subcritical water. Energy 2022, 238, 121763. [Google Scholar] [CrossRef]
  55. Friedman, I.; O’Neil, J. Compilation of stable isotopic fractionation factors of geochemical interest. In Data of Geochemistry; Fleischer, M., Ed.; U.S. Geological Survey Professional Paper 440-KK; U.S. Department of the Interior: Washington, DC, USA, 1977. [Google Scholar]
  56. Narthrop, D.; Clayton, R. Oxygen isotope fractionation in systems containing dolomite. J. Geol. 1966, 74, 174–196. [Google Scholar] [CrossRef]
  57. Fisher, S.; Land, L. Diagenetic history of the Eocene Wilcox sandstones and associated formation waters, south-Central Texas. Geochim. Cosmochim. Acta 1986, 60, 551–562. [Google Scholar] [CrossRef]
  58. Yang, T.; Cao, Y.; Friis, H.; Wang, Y.; Zhou, L. Diagenetic evolution and chemical changes of deep-water mudstones of Shahejie Formation in the Dongying Sag, Jiyang Depression, Eastern China. Mar. Petrol. Geol. 2018, 93, 14–32. [Google Scholar] [CrossRef]
  59. Shao, X.; Pang, X.; Li, M.; Qian, M.; Hu, T.; Li, Z.; Zhang, H.; Xu, Y. Hydrocarbon retention in lacustrine shales during thermal maturation: Insights from semi-open system pyrolysis. J. Pet. Sci. Eng. 2020, 184, 106480. [Google Scholar] [CrossRef]
  60. Zhao, R.; Ren, Q.; Deng, S.; Sun, Y.; Chang, Z. Constrain on Oil recovery stage during oil shale subcritical water extraction process based on carbon isotope fractionation character. Energies 2021, 14, 7839. [Google Scholar] [CrossRef]
  61. Lin, C.; Wang, W.; Dong, C.; Zhang, X.; Ren, L.; Lin, J. Status Quo of Sandstone Compaction Research and Its Advancement. Acta Sedimentol. Sin. 2020, 38, 538–553. (In Chinese) [Google Scholar]
  62. Zhao, R.; Shan, X.; Yi, J.; Liang, Y.; Li, C.; Qiu, C. Understanding fluid behavior through ion and isotope data from the Yitong Basin, Northeast China. Can. J. Earth Sci. 2018, 55, 308–320. [Google Scholar] [CrossRef]
  63. Shen, Y.; Neuweiler, F.; Immenhauser, A. Ordovician carbonate factory turnover tracked by its depositional, diagenetic, and carbon and oxygen isotope record. Palaeogeogr. Palaeoclimatol. Palaeoecol. 2023, 621, 111570. [Google Scholar] [CrossRef]
  64. Hart, B.; Schieber, J.; Kalinec, J. Clay diagenesis and overpressure development in Upper Cretaceous and Tertiary shales of South Texas. Mar. Pet. Geol. 2023, 147, 105978. [Google Scholar] [CrossRef]
  65. Dunn, S. Stable isotopes in contact metamorphism of carbonate rocks. In Proceedings of the Teaching Petrology Workshop, Bozeman, MT, USA, 9–15 July 2003. [Google Scholar]
  66. Valley, J. Stable isotope geochemistry of metamorphic rocks. Rev. Mineral. Geochem. 1986, 16, 443–481. [Google Scholar]
Figure 1. The location and lithological profile of well G8. (a) The map of China showing the location of the Songliao Basin. (b): first-order tectonic zone division map in the Songliao Basin and the location of the Gulong Sag. (c): the location of well G8 in the %Ro contour map of Gulong Sag. (d): lithology profile of Well G8.
Energies 17 04159 g001
Figure 2. Petrological and mineral character of Q1–Q9 units in Gulong Sag, Songliao Basin. (a) The shale rock in well core scale. (b) The carbonate minerals character in microscope scale. (c) The carbonate minerals and its elements character in FE-SEM scale. (d) Quartz mineral character. (e) Typical hydrothermal minerals character. The Q represent quartz; Cal is calcite; Dol is dolomite; Fe-Dol is Fe-dolomite; Py is pyrite; Ap is apatite; Rt is rutile; Brt is barite; and Sp is sphalerite.
Energies 17 04159 g002
Figure 3. The minerals composition evolution character with depth. The red dashed line represents overpressure line (1.2) and the blue dashed line represents the baseline of brittleness.
Energies 17 04159 g003
Figure 4. Statistical map of hydrothermal mineral identification results based on FE-SEM and EDS of Gulong Sag, Songliao Basin. The shadow implies the main hydrothermal activity influence area.
Energies 17 04159 g004
Figure 5. The plot of (a) δ13C vs. δ18O and (b) δ13C vs. TOC of Gulong Sag, Songliao Basin. Red represents Q4, yellow represents Q8, and blue represents other units’ samples.
Energies 17 04159 g005
Figure 6. The relationship between δ18OPDB and δ13CPDB of carbonate minerals of Gulong Sag, Songliao Basin. The red represents sea water during the Cretaceous. The blue represents our samples.
Energies 17 04159 g006
Figure 7. The evolution character of δ13C, δ18O and its calculated temperature based on temperature calculation formulas of δ18O. The T1 calculated from formulas: 1000lnαcalcite-water = 2.78 × 10⁶/T2 − 2.89 [55]; The T2 calculated from the following formula: 1000lnαdolomite-water = 3.20 × 10⁶/T2 − 1.50 [56]. The T3 calculated from the following formula: 1000lnαFe-dolomite-water = 2.78 × 10⁶/T + 0.11 [57], where αx-water = (1 + (δ18O/1000))/(1 + (δ18Owater/1000)); the X represent minerals of calcite, dolomite, and Fe-dolomite, and for the δ18Owater, we use 0.25‰ SMOW according to Yang et al., 2018 [58]. The red dash line implied the increase of isotope, and the blue dash line represents base line of temperature. The shadow implies the main hydrothermal activity influence area.
Energies 17 04159 g007
Figure 8. The evolution of I/S content with depth increase in Gulong Sag, Songliao Basin. The blue dots represent our samples, and the shadow implies the main hydrothermal activity influence area.
Energies 17 04159 g008
Figure 9. Correlation diagrams (a) δ13C vs. carbonate content and (b) δ18O vs. carbonate content. Specially, in those diagrams, the exact high carbonate content values were deleted, which were related to the dolomite interlayer. The red boxes represent our samples.
Energies 17 04159 g009
Table 1. Sample location and its character description of G8 in Gulong Sag, Songliao Basin.
NO.Sample NO.UnitDepth/mδ13C/PDB/‰δ18O/PDB/‰Lithology Description
1G8-9-1Q92396.110.4−9.5laminated shale
2G8-9-2Q92404.09.7−10.2laminated shale
3G8-9-3Q92411.56.4−13.7laminated shale
4G8-9-5Q92416.05.1−15.2laminated shale
5G8-8-1Q82420.64.6−16.8laminated shale
6G8-8-2Q82423.64.7−17.7laminated shale
7G8-8-3Q82428.64.5−17.4laminated shale
8G8-8-5Q82435.610.1−12.7laminated shale
9G8-7-2Q72444.69.9−11.3Dolomite-bearing banded lamellar shale
10G8-7-3Q72448.010.7−9.9laminated shale
11G8-7-5Q72455.111.3−8.4laminated shale
12G8-6-1Q62456.115.4−7.0laminated shale
13G8-6-2Q62460.114.7−7.3laminated shale
14G8-6-3Q62465.113.5−8.1laminated shale
15G8-6-5Q62469.214.2−7.4Dolomite-bearing banded lamellar shale
16G8-5-2Q52472.112.6−6.2Dolomite-bearing banded lamellar shale
17G8-5-3Q52476.510.1−9.8Dolomite-bearing banded lamellar shale
18G8-5-4Q52479.59.1−10.9laminated shale
19G8-4-1Q42482.17.4−11.5laminated shale
20G8-4-3Q42490.16.8−12.2laminated shale
21G8-4-4Q42493.16.2−12.6Dolomite-bearing banded lamellar shale
22G8-3-2Q32498.49.6−8.3laminated shale
23G8-3-3Q32501.27.7−9.4laminated shale
24G8-3-4Q32503.18.1−8.5Dolomite-bearing banded lamellar shale
25G8-3-5Q32505.78.5−8.3laminated shale
26G8-2-2Q22511.111.2−8.0laminated shale
27G8-2-3Q22514.711.5−7.7Dolomite-bearing banded lamellar shale
28G8-2-4Q22515.812.6−7.3Dolomite-bearing banded lamellar shale
29G8-2-5Q22518.113.1−7.4Dolomite-bearing banded lamellar shale
30G8-1-1Q12519.113.4−7.1laminated shale
31G8-1-3Q12524.015.1−7.0laminated shale
32G8-1-5Q12529.114.5−7.5laminated shale
33G8-1-6Q12532.116.2−5.8laminated shale
Table 2. Minerals composition character of G8 in Gulong Sag, Songliao Basin.
NO.Sample NO.UnitQuartz
/%
K-Feldspar
/%
Plagioclase
/%
Calcite
/%
Fe-Dolomite
/%
Siderite
/%
Pyrite
/%
Clay Mineral/%Illite
/%
Kaolinite
/%
Chlorites
/%
I/S
/%
Brittleness
1G8-9-1Q936.61.723.81.60.00.03.532.876.00.09.015.00.50
2G8-9-2Q935.80.034.84.91.60.02.020.876.00.02.022.00.59
3G8-9-3Q930.90.025.43.31.81.343.433.873.00.010.017.00.46
4G8-9-5Q920.81.928.910.22.60.06.028.265.62.47.524.50.37
5G8-8-1Q832.60.021.43.71.01.17.233.063.00.010.026.00.47
6G8-8-2Q829.71.818.81.014.60.65.827.758.00.08.034.00.605
7G8-8-3Q832.61.5619.30.82.50.06.237.156.00.08.036.00.47
8G8-8-5Q829.61.518.91.014.60.64.829.063.71.34.031.00.58
9G8-7-2Q721.40.010.90.037.10.02.927.765.40.75.028.90.66
10G8-7-3Q717.30.05.423.235.90.03.814.458.44.39.627.70.57
11G8-7-5Q72.00.02.63.0(88.8)0.00.03.645.00.028.020.00.92
12G8-6-1Q630.30.2415.09.01.10.55.238.781.00.05.013.00.39
13G8-6-2Q630.40.9616.92.91.10.64.642.568.00.010.020.00.40
14G8-6-3Q634.90.016.30.83.50.04.140.365.00.09.024.00.47
15G8-6-5Q631.53.3625.820.85.80.02.210.963.82.210.024.00.52
16G8-5-2Q532.90.8421.51.11.40.64.137.677.00.06.017.00.46
17G8-5-3Q528.50.024.70.810.40.03.132.661.00.07.031.00.52
18G8-5-4Q527.81.221.97.10.00.02.839.245.83.812.937.50.36
19G8-4-1Q41.50.01.80.093.01.40.02.374.00.07.019.00.95
20G8-4-3Q436.00.08.119.88.70.03.623.864.00.011.724.30.50
21G8-4-4Q437.90.015.40.01.70.01.943.153.00.06.041.00.46
22G8-3-2Q336.30.014.36.31.10.02.039.968.00.016.015.00.44
23G8-3-3Q330.10.010.22.90.00.00.756.155.24.69.430.80.33
24G8-3-4Q340.30.012.11.30.00.00.046.357.00.010330.45
25G8-3-5Q335.60.015.00.07.00.72.239.553.00.018270.50
26G8-2-2Q236.60.013.84.60.00.91.742.361.02.09.0280.43
27G8-2-3Q232.580.016.91.61.10.83.343.757.00.018250.41
28G8-2-4Q2350.09.70.017.80.02.53553.00.012350.58
29G8-2-5Q230.20.09.60.018.60.00.041.555.00.027180.53
30G8-1-1Q133.80.010.29.41.70.64.040.366.00.019150.41
31G8-1-3Q13.00.00.592.70.00.00.63.272.00.013150.03
32G8-1-5Q1380.65.519.30.00.45.630.673.00.011160.42
33G8-1-6Q136.80.09.612.30.00.47.033.962.00.010280.43
Disclaimer/Publisher’s Note: The statements, opinions and data contained in all publications are solely those of the individual author(s) and contributor(s) and not of MDPI and/or the editor(s). MDPI and/or the editor(s) disclaim responsibility for any injury to people or property resulting from any ideas, methods, instructions or products referred to in the content.

