
Research on the Characteristics of Oscillation Combustion Pulsation in Swirl Combustor

Abstract
:1. Introduction
2. Introduction to the Experimental System
2.1. Centrally Swirler Stage Combustor
2.1.1. Experimental Research Object
2.1.2. Layout of Experimental System
2.1.3. Operating Conditions
2.2. Swirl Model Combustor
2.2.1. Experimental Research Object
2.2.2. Layout of Experimental System
2.2.3. Operating Conditions
3. Numerical Framework
3.1. Centrally Swirler Stage Combustor
3.2. Swirl Model Combustor
4. Data Processing Methods
4.1. Signal Processing Method
4.2. Image Processing Method
5. Results and Discussion
5.1. Analysis of Experimental Results of Centrally Swirler Stage Combustor
5.1.1. Heat Release Rate Analysis
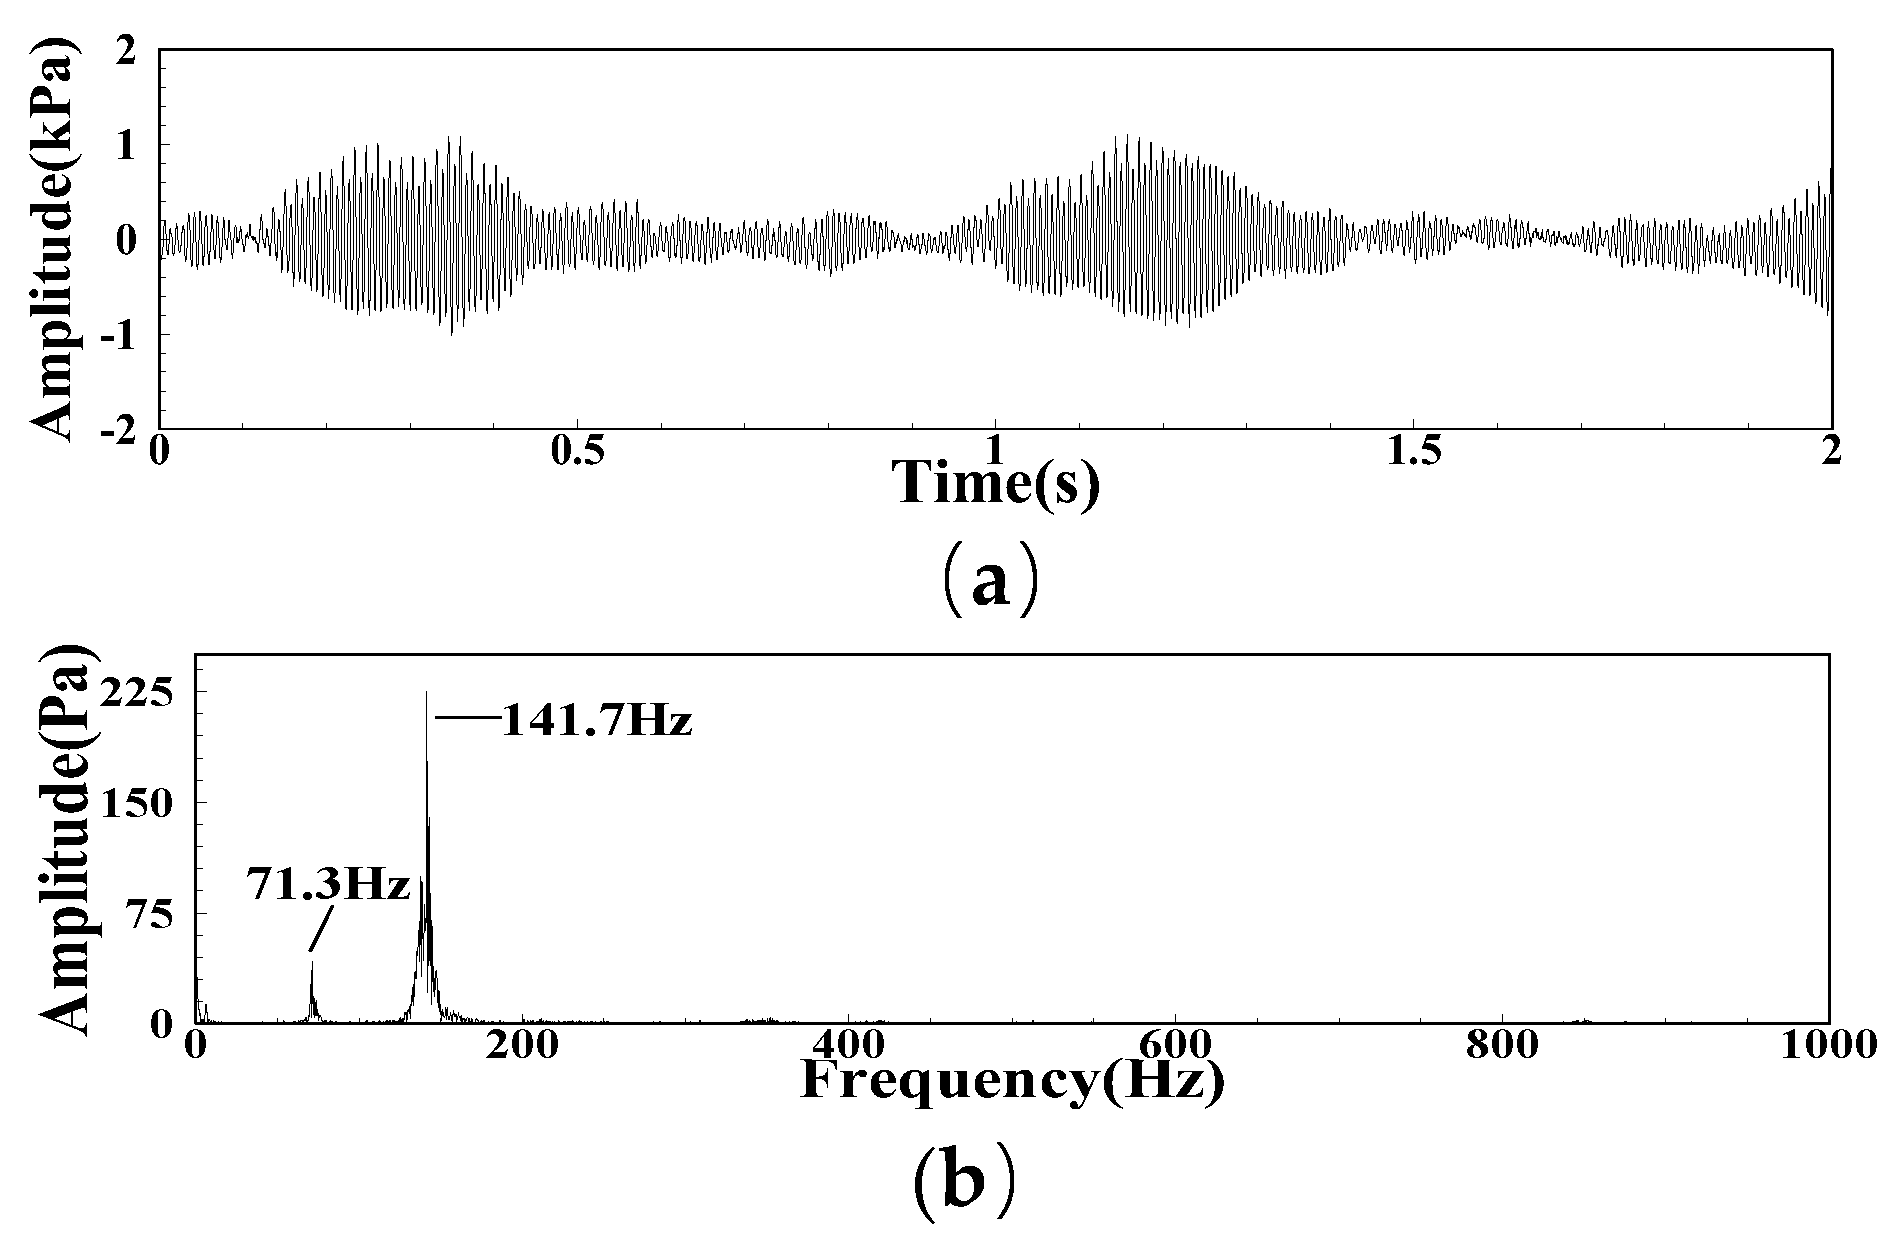
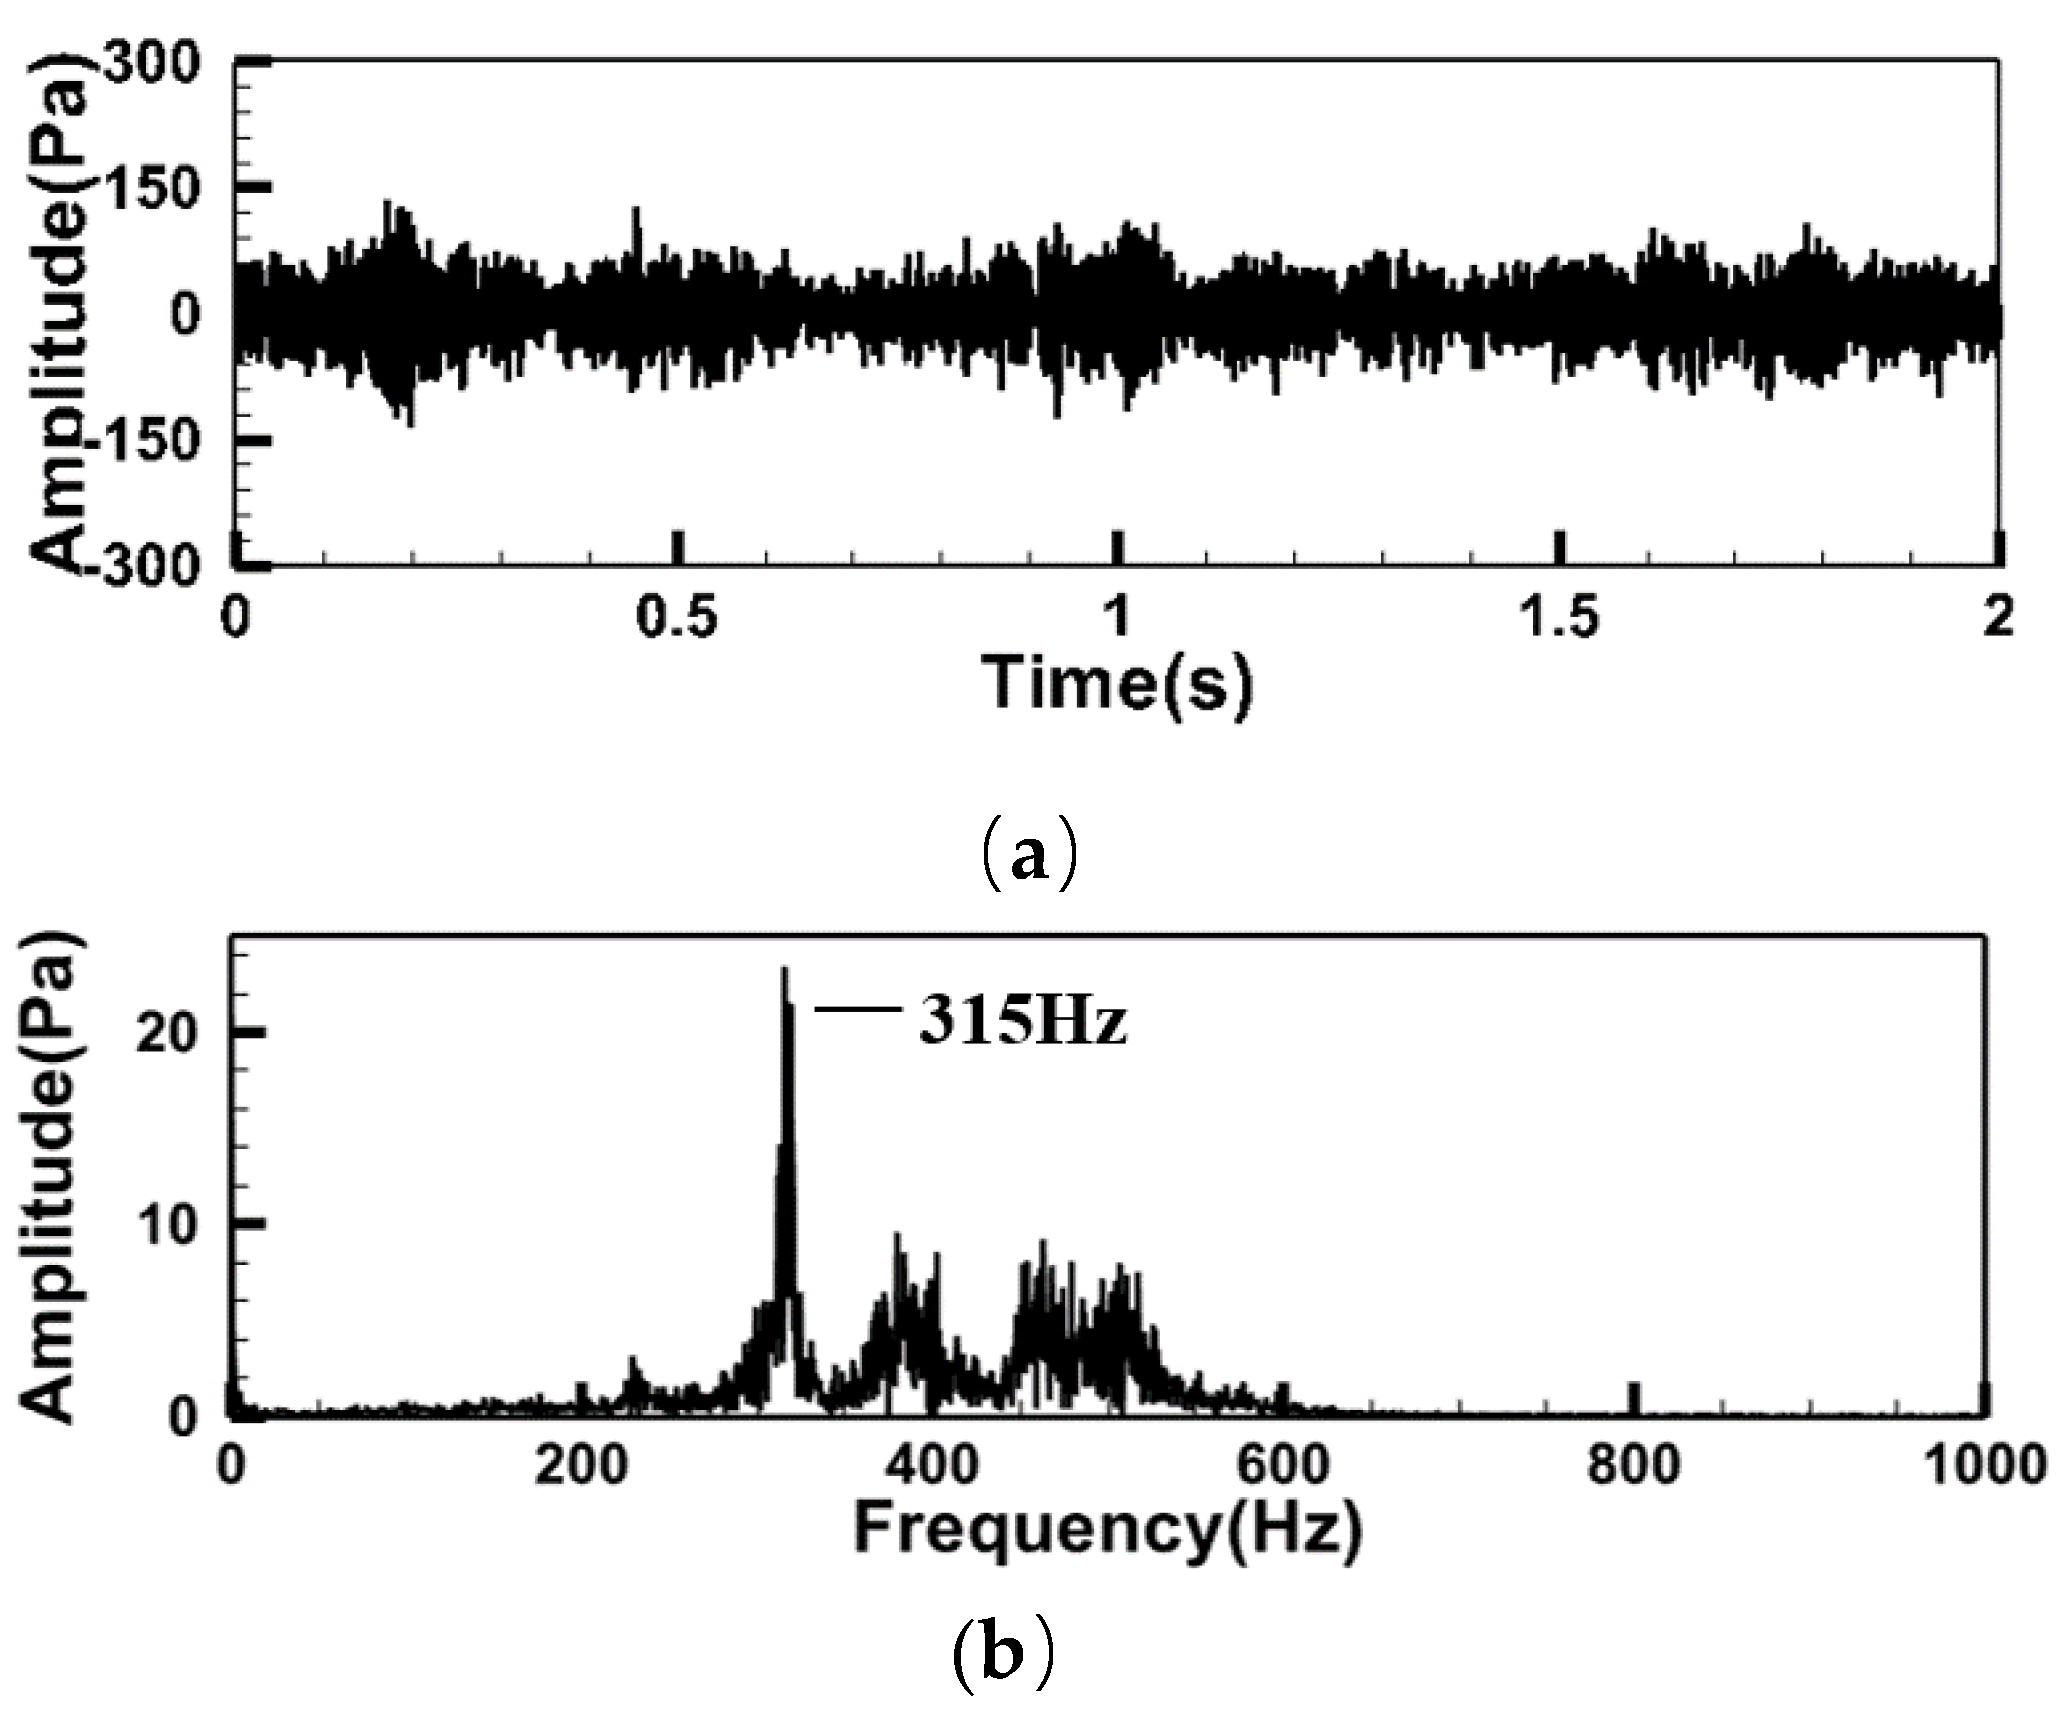
5.1.2. Cold State Pressure Signal Analysis
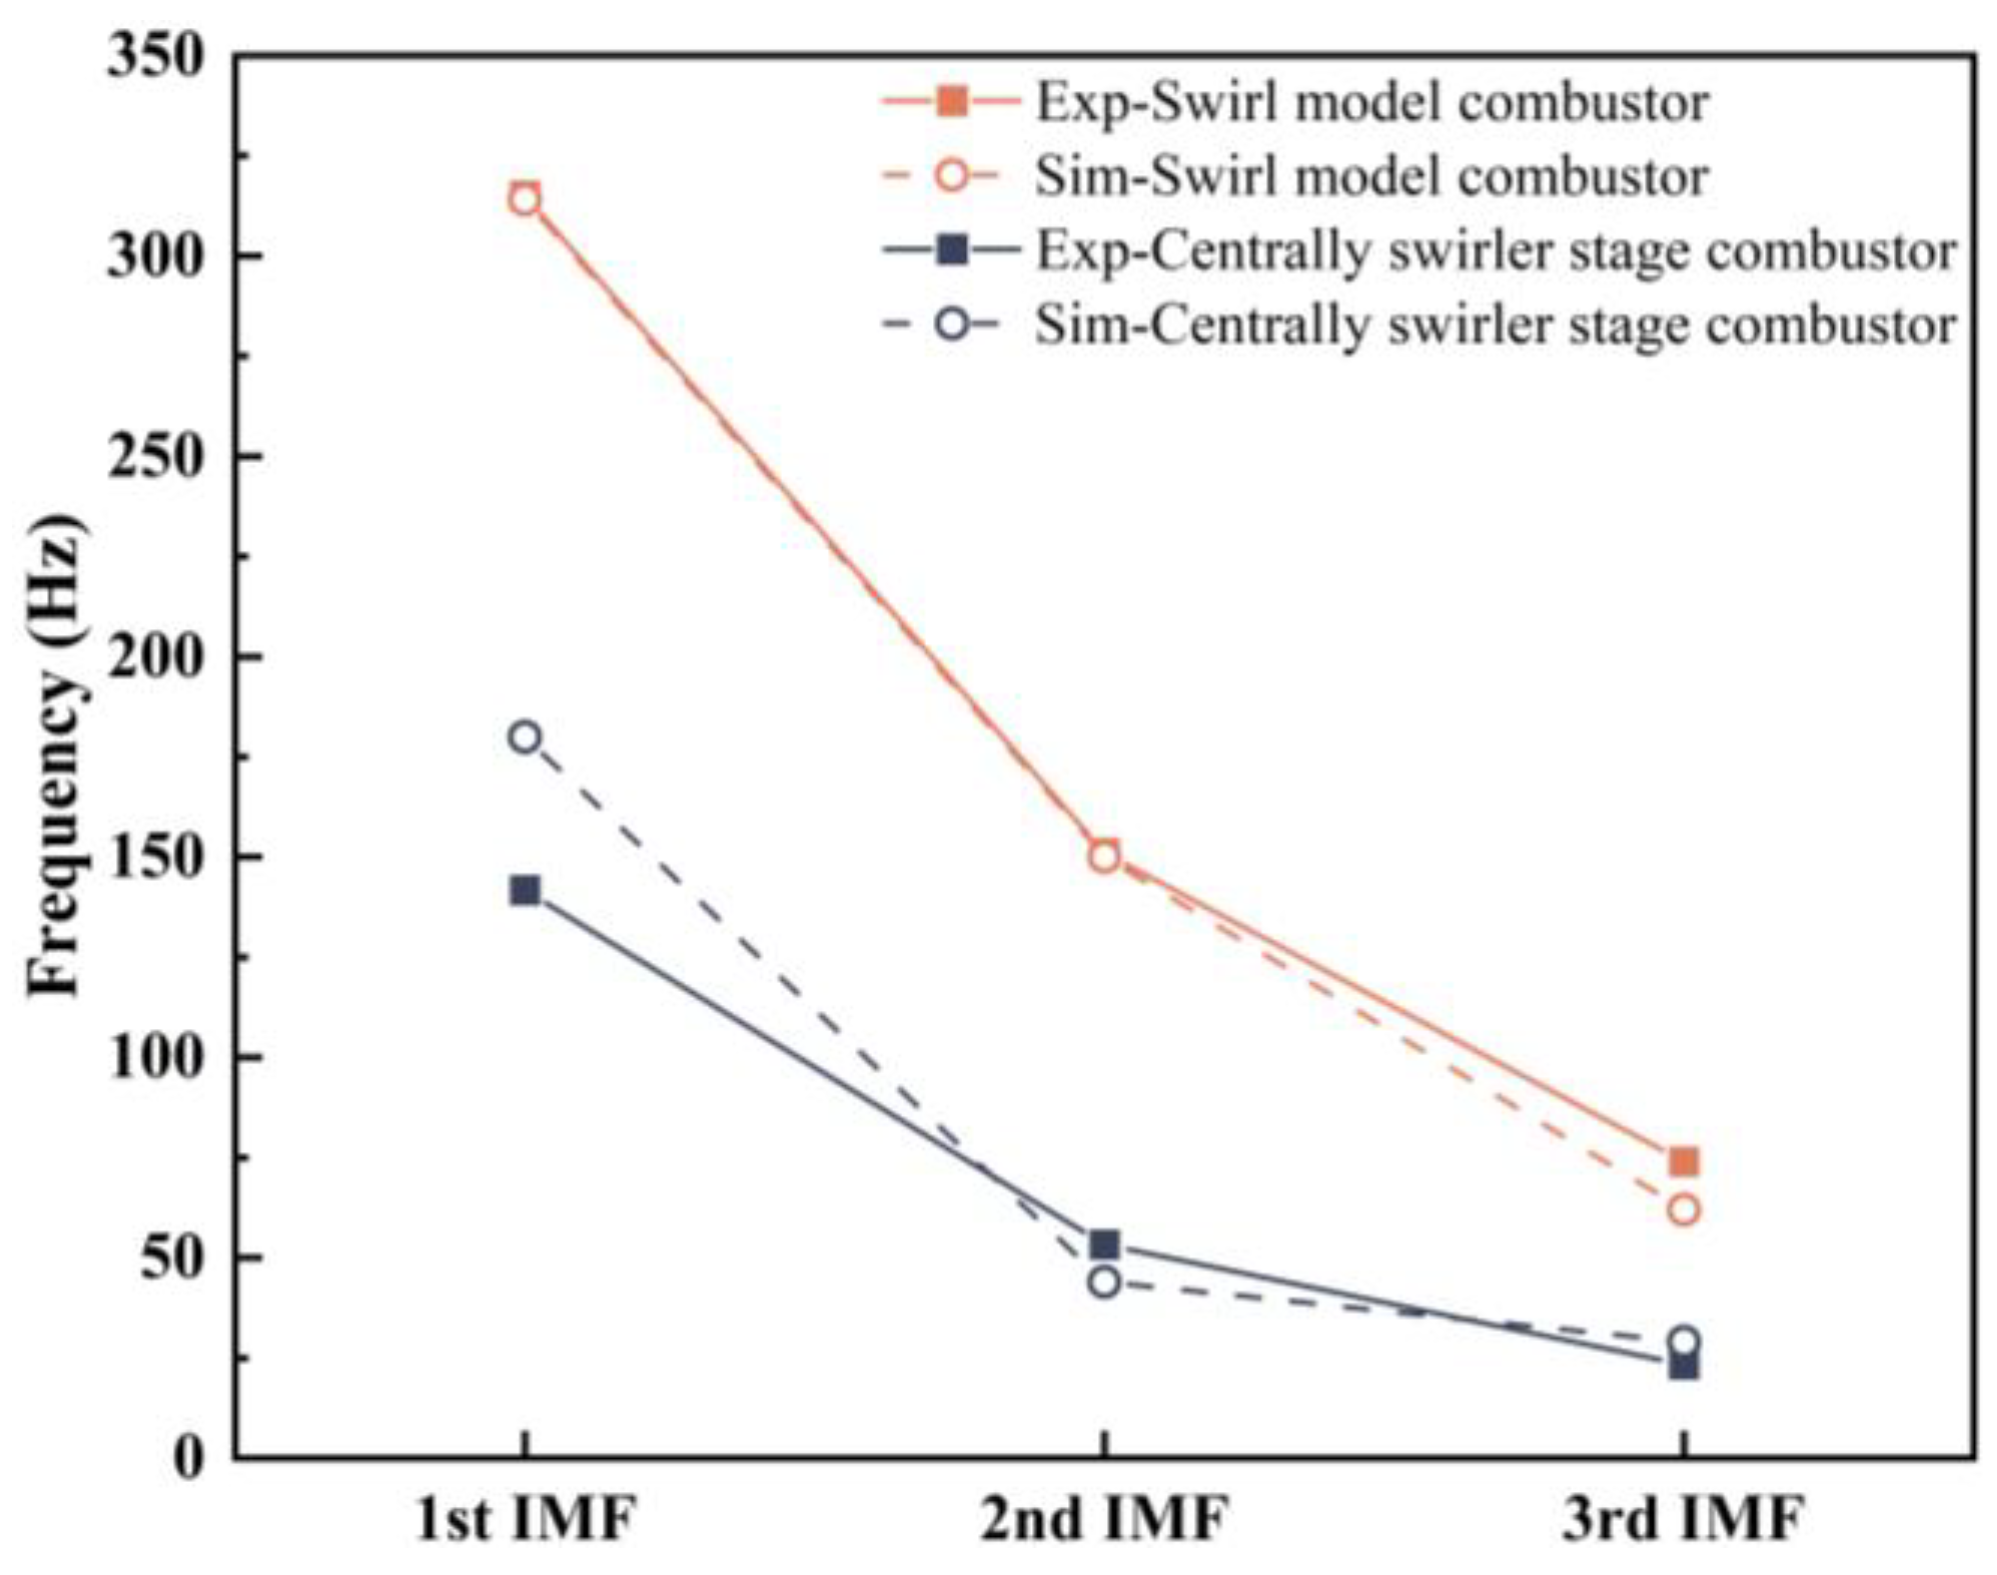
5.1.3. Fire Frequency Analysis
5.2. Analysis of Numerical Simulation Results for Centrally Swirler Stage Combustor
5.2.1. Analysis of Heat Release Rate Characteristics
5.2.2. Analysis of Flame Detachment Characteristics
5.2.3. Cold State Characteristic Analysis
5.3. Experimental and Simulation Results Verification of Swirl Model Combustor
5.3.1. Analysis of Experimental Results
5.3.2. Analysis of Numerical Calculation Results
6. Conclusions
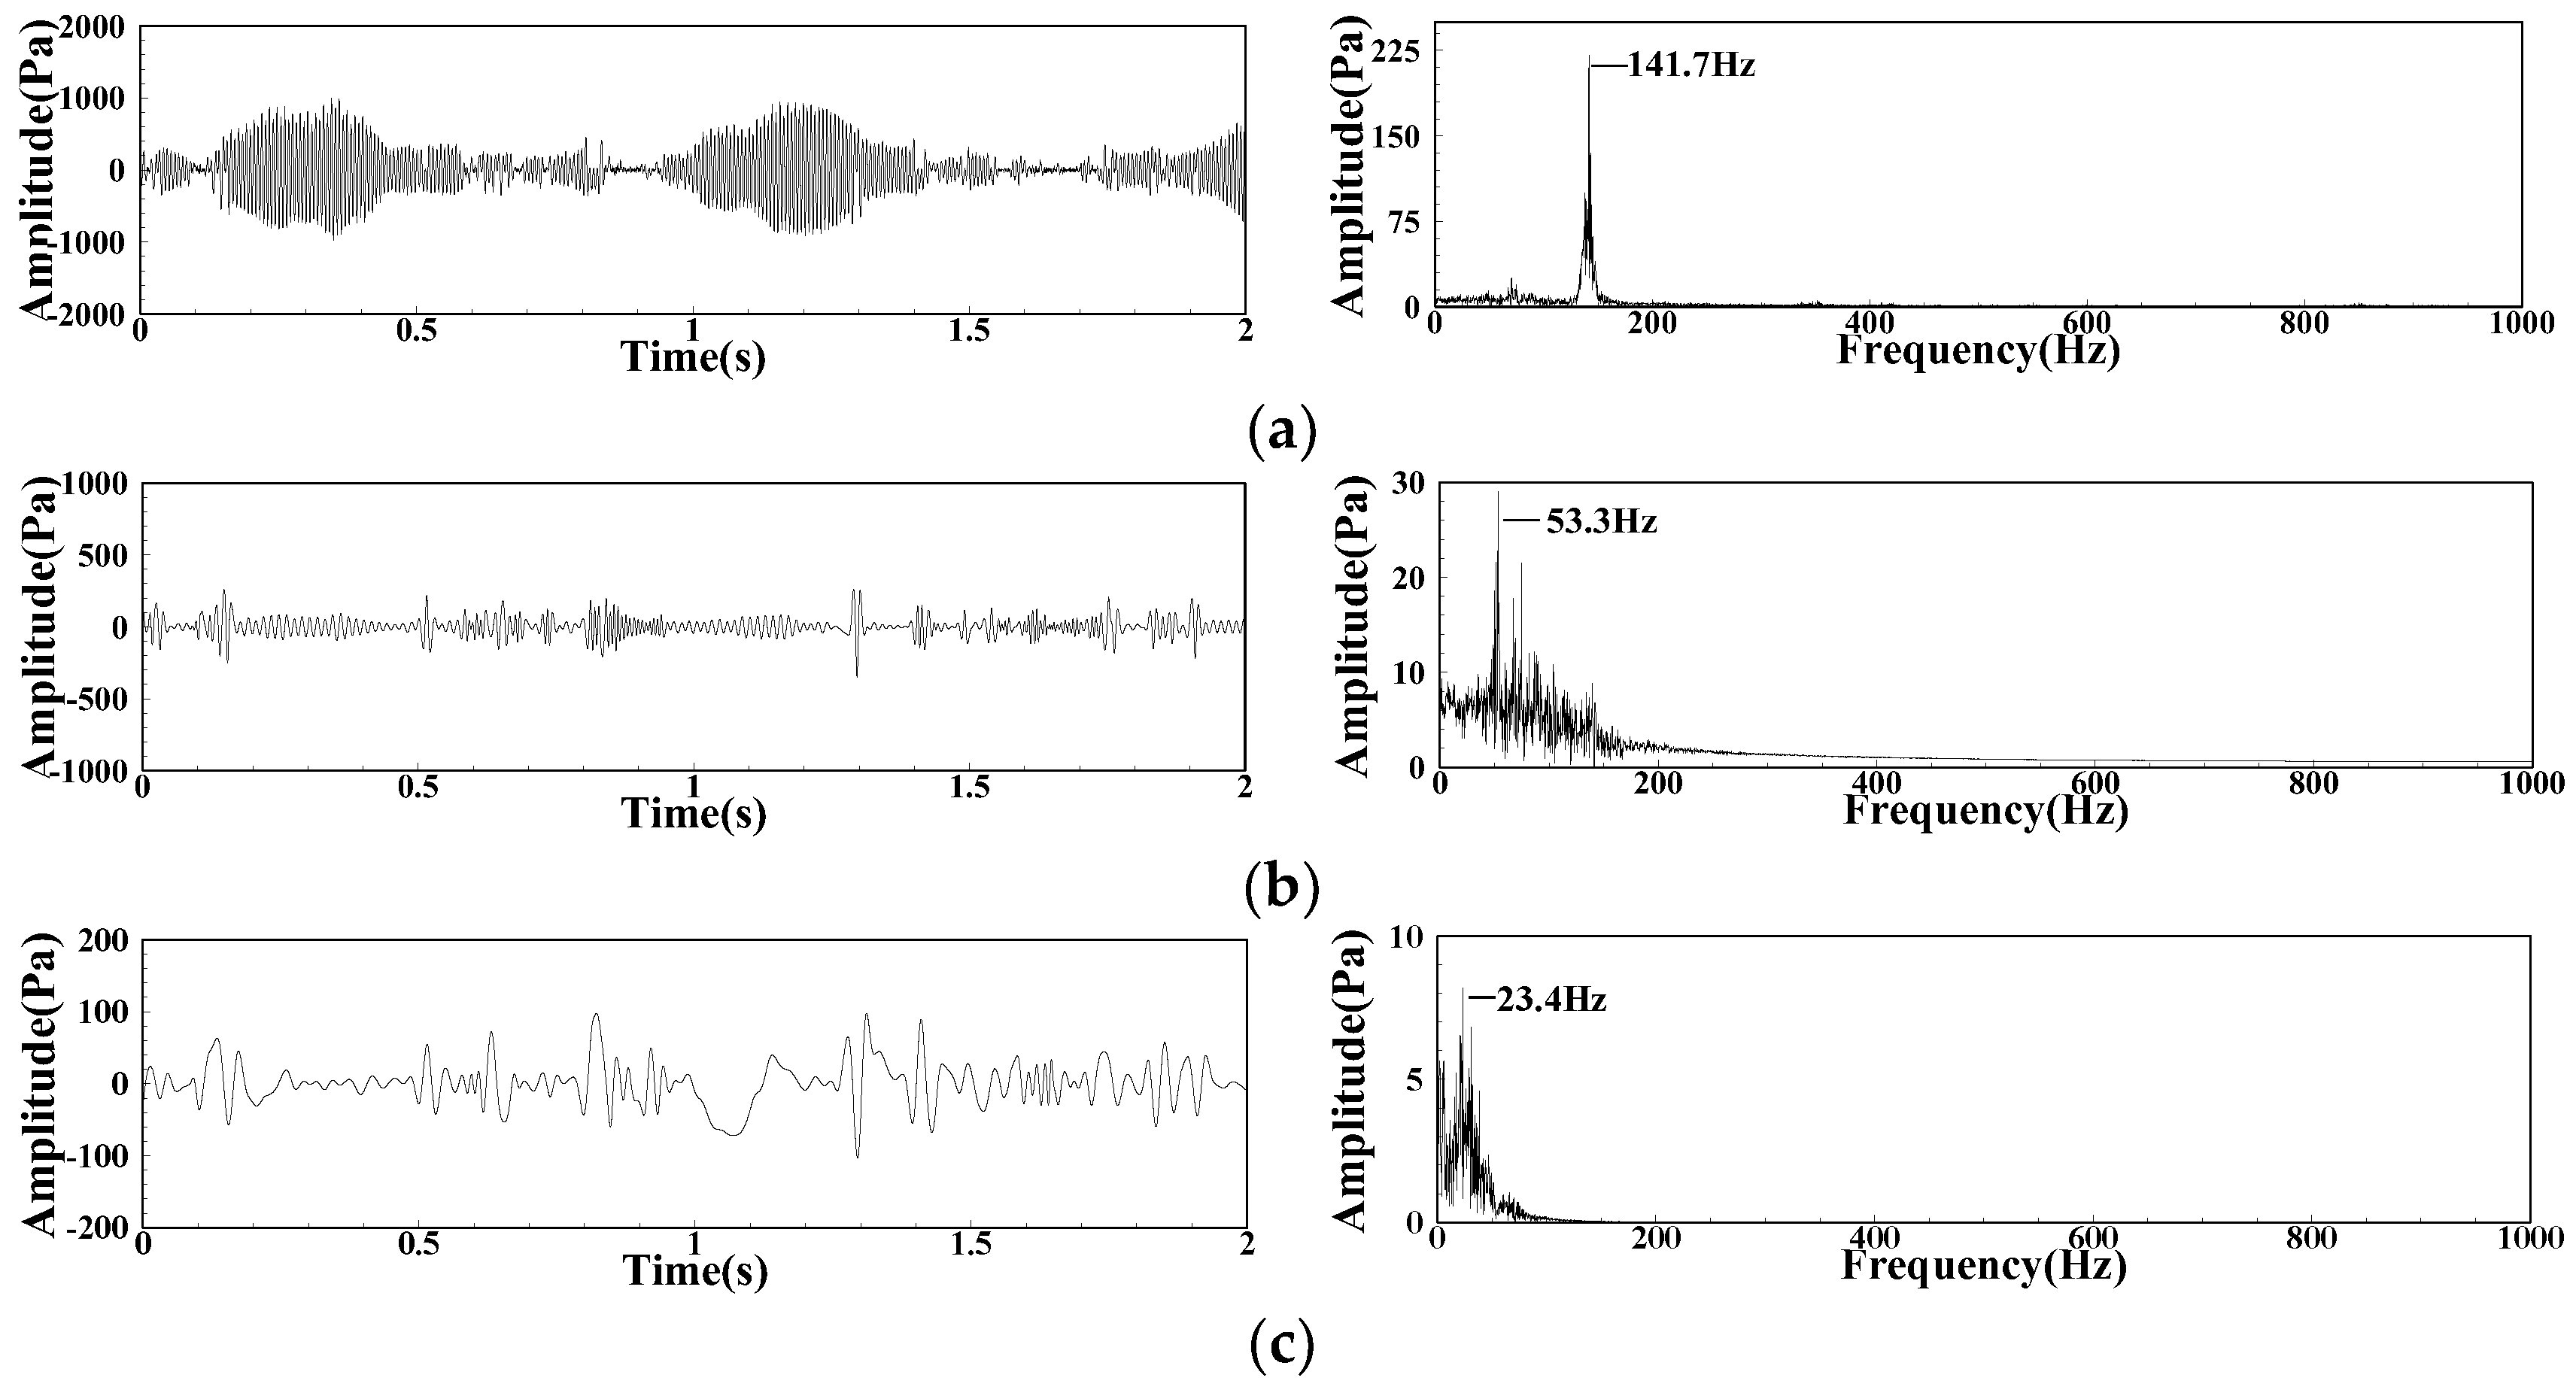
- (1)
- The 1st IMF can represent the pulsation characteristics of the heat release rate, mainly reflected in the flame shear zone of the heat release rate field in numerical calculations;
- (2)
- The 2nd IMF can represent the pulsation characteristics of airflow swirl, primarily manifested in the swirl vortex structure region of the vorticity field;
- (3)
- The 3rd IMF can represent the pulsation characteristics of flame detachment, mainly evident in the flame detachment zone of the heat release rate field.
Author Contributions
Funding
Data Availability Statement
Conflicts of Interest
References
- Zhao, J. Pollutant Emission and Development of Low-Emission Combustion Technology for Civil Aero Engine. J. Aerosp. Power 2008, 23, 986–996. (In Chinese) [Google Scholar]
- Zhang, C. The Mechanism and Control for Combustion Instabilities of Aeroengine Afterburner. Ph.D. Thesis, Beijing University of Aeronautics and Astronautics, Beijing, China, 2010. (In Chinese). [Google Scholar]
- Huang, L. Investigation on the Mechanism of Combustion Oscillation in a LPP Combustor. Master’s Thesis, Nanjing University of Aeronautics and Astronautics, Nanjing, China, 2017. (In Chinese). [Google Scholar]
- Yan, H.; Zhang, S.; Yu, X.; Li, F.; Lin, X. Flame Structure and Dynamics Characters Investigation by OH and CH2O Planar Laser-Induced Fluorescence in the Swirl Combustor. J. Aerosp. Power 2019, 34, 894–907. (In Chinese) [Google Scholar]
- Liu, T. Numerical Simulation Study on Performances of Swirl Burners in Aero-engine Combustors. Master’s Thesis, Tianjin University, Tianjin, China, 2017. (In Chinese). [Google Scholar]
- He, Z.; Wang, P.; Murugesan, M.; Ferrante, A.; Li, W.; Jiang, L. Experimental Investigation on Thermoacoustic Oscillation of a New Dual-Swirl Combustor. J. Exp. Fluid Mech. 2021, 35, 44–52. (In Chinese) [Google Scholar]
- Lieuwen, T.C.; Yang, V. Combustion Instabilities in Gas Turbine Engines: Operational Experience, Fundamental Mechanisms, and Modeling; American Institute of Aeronautics and Astronautics: Reston, VA, USA, 2005. [Google Scholar]
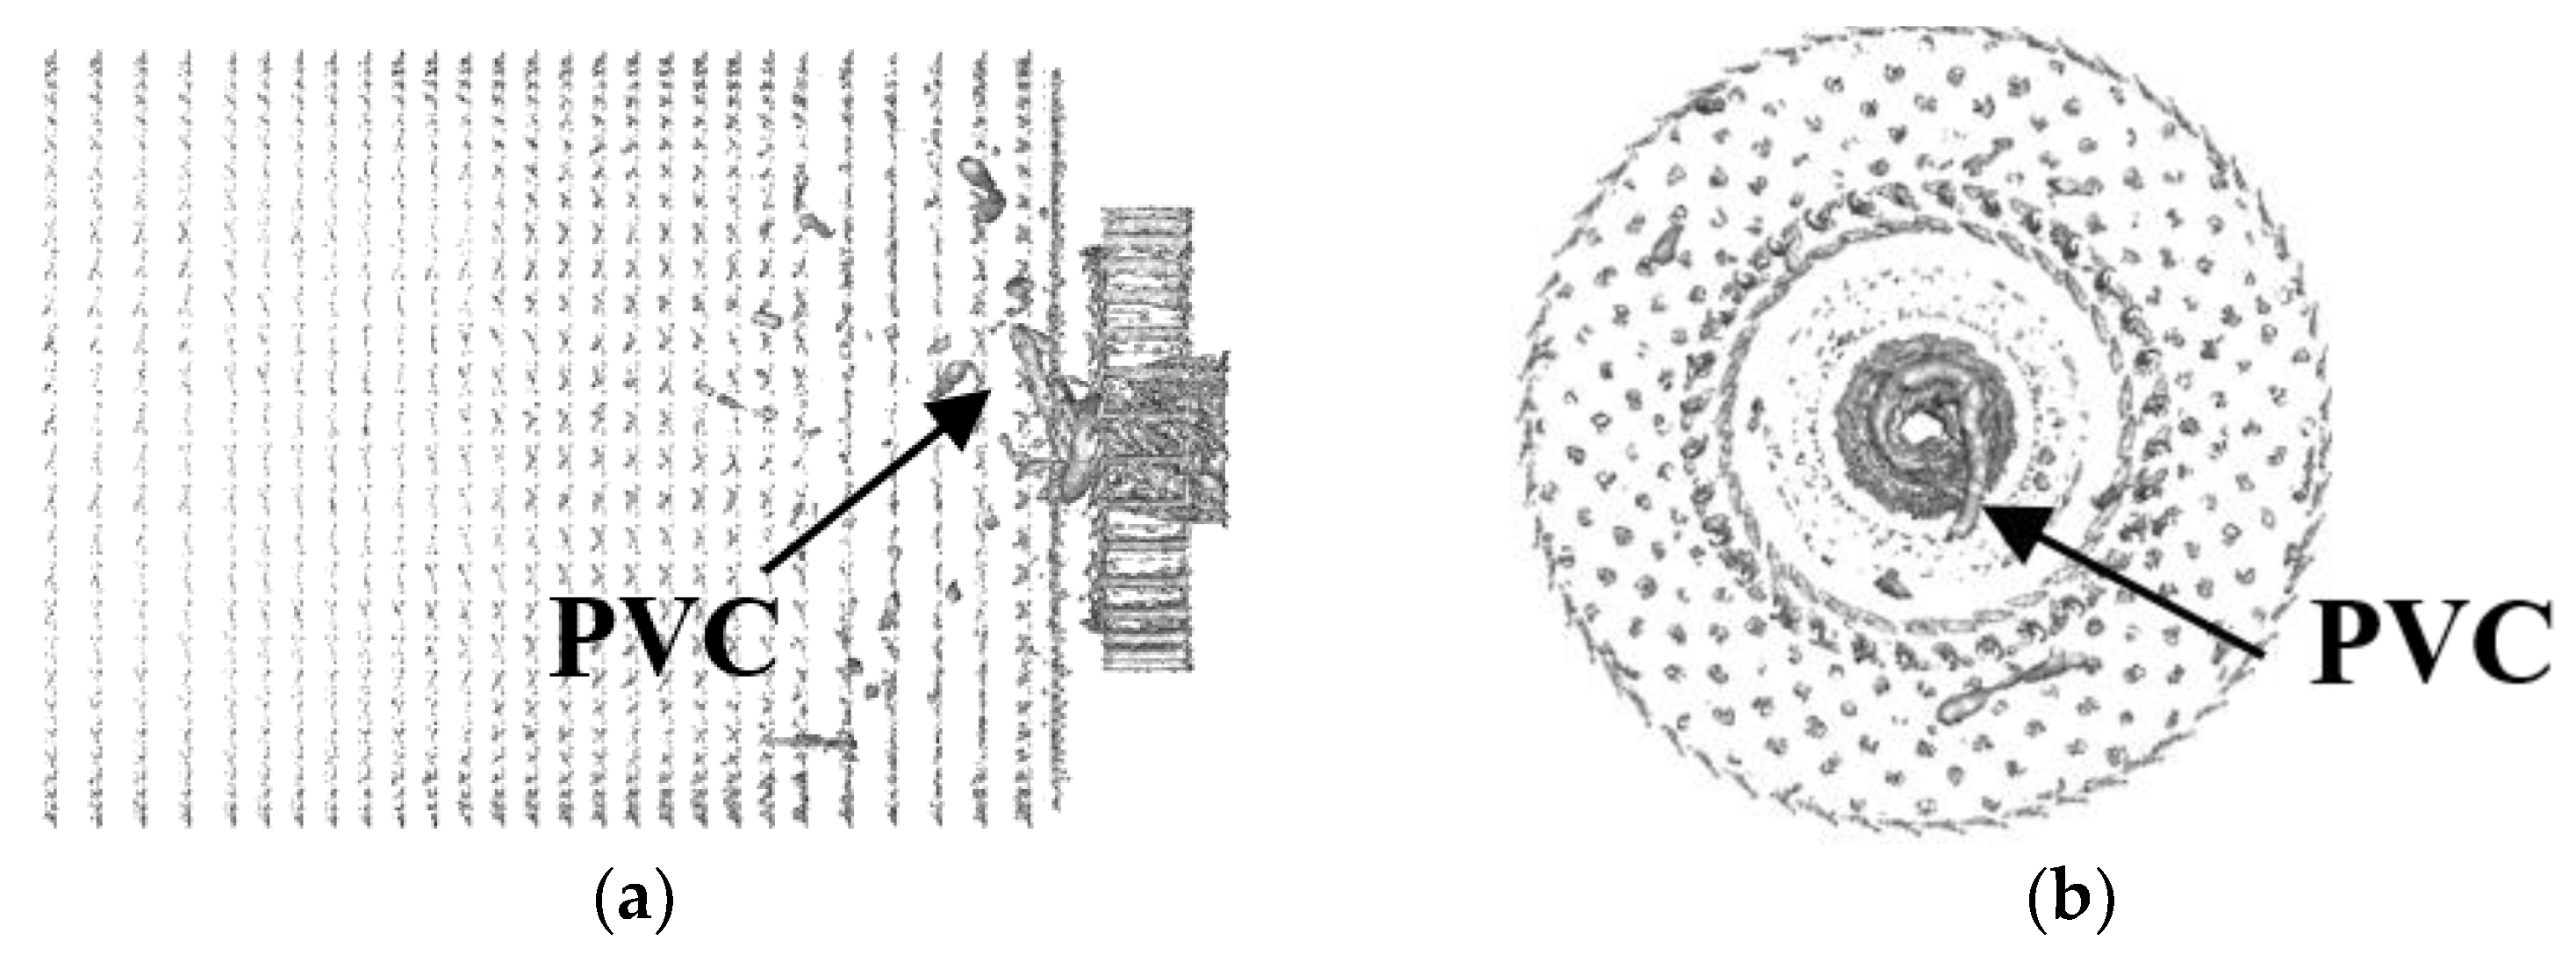
- Syred, N. A Review of Oscillation Mechanisms and the Role of the Precessing Vortex Core (PVC) in Swirl Combustion Systems. Prog. Energy Combust. Sci. 2006, 32, 93–161. [Google Scholar] [CrossRef]
- Renard, P.H.; Thévenin, D.; Rolon, J.C.; Candel, S. Dynamics of Flame/Vortex Interactions. Prog. Energy Combust. Sci. 2000, 26, 225–282. [Google Scholar] [CrossRef]
- Candel, S.; Durox, D.; Schuller, T.; Bourgouin, J.F.; Moeck, J.P. Dynamics of Swirling Flames. Annu. Rev. Fluid Mech. 2013, 46, 147–161. [Google Scholar] [CrossRef]
- Lucca-Negro, O.; O’Doherty, T. Vortex Breakdown: A Review. Prog. Energy Combust. Sci. 2001, 27, 431–481. [Google Scholar] [CrossRef]
- Hall, M.G. Vortex Breakdown. Annu. Rev. Fluid Mech. 1972, 4, 195–218. [Google Scholar] [CrossRef]
- Billant, P.; Chomaz, J.M.; Huerre, P. Experimental Study of Vortex Breakdown in Swirling Jets. J. Fluid Mech. 1998, 376, 183–219. [Google Scholar] [CrossRef]
- Shtork, S.I.; Cala, C.E.; Fernandes, E.C.; Heitor, M.V. Coherent Helical Structures in Swirl Flows. Tech. Phys. Lett. 2005, 31, 660–662. [Google Scholar] [CrossRef]
- Buschhagen, T.; Gejji, R.; Philo, J.; Tran, L.; Enrique Portillo Bilbao, J.; Slabaugh, C.D. Experimental Investigation of Self-Excited Combustion Instabilities in a Lean, Premixed, Gas Turbine Combustor at High Pressure. J. Eng. Gas Turbines Power 2018, 140, 111503. [Google Scholar] [CrossRef]
- Worth, N.A.; Dawson, J.R. Effect of Equivalence Ratio on the Modal Dynamics of Azimuthal Combustion Instabilities. Proc. Combust. Inst. 2017, 36, 3743–3751. [Google Scholar] [CrossRef]
- Khalil, A.E.E.; Gupta, A.K. Acoustic and Heat Release Signatures for Swirl Assisted Distributed Combustion. Appl. Energy 2017, 193, 125–138. [Google Scholar] [CrossRef]
- Matsuura, K.; Eguchi, T.; Oide, S.; Yamada, H.; Kurosawa, Y.; Yamamoto, T.; Hayashi, S. Simultaneous Kerosene/OH LIF Visualization Inside the Pre-Mixing Duct and Combustion Chamber of a Lean Staged Aero-Engine Combustor under Combustion Oscillations at Elevated Pressure and Temperature. In Proceedings of the 51st AIAA/SAE/ASEE Joint Propulsion Conference, Orlando, FL, USA, 27–29 July 2015. [Google Scholar]
- Wang, X.; Liu, Y.; Zhang, X.; Yang, C.; Li, H. Characteristic analysis of dynamic pressure signal of unstable combustion in central staged swirl combustor. J. Aerosp. Power 2023, 38, 2883–2894. (In Chinese) [Google Scholar]
- Nori, V.N.; Seitzman, J.M. CH∗ Chemiluminescence Modeling for Combustion Diagnostics. Proc. Combust. Inst. 2009, 32, 895–903. [Google Scholar] [CrossRef]
- Yang, C.; Liu, Y.; Zhang, X.; Li, H.; Ge, X.; Jin, F.; Liu, C. Experimental Study on Flame Response Characteristics of a Non-Premixed Swirl Model Combustor. Energies 2023, 16, 6834. [Google Scholar] [CrossRef]
- Li, D.; Xia, G.; Sankaran, V.; Merkle, C. Computational Framework for Complex Fluids Applications. In Proceedings of the 3rd International Conference on Computational Fluid Dynamics, Berlin, Germany, 12–16 July 2004. [Google Scholar]
- Oijen, J.A.V.; Goey, L.P.H.D. Modelling of Premixed Laminar Flames using Flamelet-Generated Manifolds. Combust. Seience Technol. 2000, 161, 113–137. [Google Scholar] [CrossRef]
- Huang, N.E.; Shen, Z.; Long, S.R.; Wu, M.C.; Shih, H.H.; Zheng, Q.; Yen, N.; Tung, C.; Liu, H.H. The Empirical Mode Decomposition and the Hilbert Spectrum for Nonlinear and Non-Stationary Time Series Analysis. Proc. R. Soc. London. Ser. A Math. Phys. Eng. Sci. 1998, 454, 903–995. [Google Scholar] [CrossRef]
- Du, J. Hilbert Huang Transform and lts Application in Feature Extraction. Ph.D. Thesis, University of Science and Technology Beijing, Beijing, China, 2017. (In Chinese). [Google Scholar]
- Ge, X.; Hu, J.; Ning, J.; Zhou, H.; Wang, S. Diagnostic Model Based on EMD-HMM and Its Application. Math. Pract. Theory 2012, 42, 138–144. (In Chinese) [Google Scholar]
- Shen, Y.; Zhang, X.; Wang, Z. Spacecraft fault diagnosis based on empirical mode decomposition and directed factor graph. J. Harbin Inst. Technol. 2013, 45, 19–24. (In Chinese) [Google Scholar]
- Wang, X.; Han, X.; Sung, C. Transitions of thermoacoustic modesandflamedynamicsina centrally-staged swirl combustor. Energy 2023, 263, 125813. [Google Scholar] [CrossRef]
- Fu, P.; Wen, Q.; Hou, L.; Li, J.; Ma, H. Interaction among flame structures and thermoacoustic instabilities in a centrally staged combustor. Appl. Therm. Eng. 2024, 254, 123862. [Google Scholar] [CrossRef]
- Liu, Y.; Li, J.; Han, Q.; Yan, Y. Study of combustion oscillation mechanism and flame image processing. AIAA J./AIAA J. Disc. 2019, 57, 824–835. [Google Scholar] [CrossRef]
- Higham, J.; Brevis, W.; Keylock, C. Implications of the selection of a particular modal decomposition technique for the analysis of shallow flows. J. Hydraul. Res. 2018, 56, 796–805. [Google Scholar] [CrossRef]
- Lai, A.; Liu, Y.; Fu, Y.; Yan, Y. Image Processing of Combustion Oscillating Flame. J. Combust. Sci. Technol. 2020, 26, 10–17. (In Chinese) [Google Scholar]
- Selle, L.; Benoit, L.; Poinsot, T.; Nicoud, F.; Krebs, W. Joint Use of Compressible Large-Eddy Simulation and Helmholtz Solvers for the Analysis of Rotating Modes in an Industrial Swirled Burner. Combust. Flame 2006, 145, 194–205. [Google Scholar] [CrossRef]


| Test Number | Air Intake Flow Rate/(g/s) | Intake Air Temperature/K | Imported Re | FAR |
|---|---|---|---|---|
| A01 | 100.2 | 426 | 40,400 | 0.063 |
| A02 | 100.2 | 426 | 40,400 | 0.057 |
| A03 | 100.2 | 426 | 40,400 | 0.050 |
| A04 | 100.2 | 426 | 40,400 | 0.046 |
| A05 | 100.2 | 426 | 40,400 | 0.038 |
| A06 | 100.2 | 426 | 40,400 | 0.033 |
| B01 | 130.1 | 423.4 | 52,000 | 0.054 |
| B02 | 130.1 | 423.4 | 52,000 | 0.052 |
| B03 | 130.1 | 423.4 | 52,000 | 0.048 |
| B04 | 130.1 | 423.4 | 52,000 | 0.046 |
| B05 | 130.1 | 423.4 | 52,000 | 0.044 |
| B06 | 130.1 | 423.4 | 52,000 | 0.038 |
| C01 | 140.0 | 434 | 56,800 | 0.050 |
| C02 | 140.0 | 434 | 56,800 | 0.048 |
| C03 | 140.0 | 434 | 56,800 | 0.045 |
| C04 | 140.0 | 434 | 56,800 | 0.044 |
| C05 | 140.0 | 434 | 56,800 | 0.040 |
| C06 | 140.0 | 434 | 56,800 | 0.038 |
Disclaimer/Publisher’s Note: The statements, opinions and data contained in all publications are solely those of the individual author(s) and contributor(s) and not of MDPI and/or the editor(s). MDPI and/or the editor(s) disclaim responsibility for any injury to people or property resulting from any ideas, methods, instructions or products referred to in the content. |
© 2024 by the authors. Licensee MDPI, Basel, Switzerland. This article is an open access article distributed under the terms and conditions of the Creative Commons Attribution (CC BY) license (https://creativecommons.org/licenses/by/4.0/).
Share and Cite
Liu, C.; Ge, X.; Zhang, X.; Yang, C.; Liu, Y. Research on the Characteristics of Oscillation Combustion Pulsation in Swirl Combustor. Energies 2024, 17, 4164. https://doi.org/10.3390/en17164164
Liu C, Ge X, Zhang X, Yang C, Liu Y. Research on the Characteristics of Oscillation Combustion Pulsation in Swirl Combustor. Energies. 2024; 17(16):4164. https://doi.org/10.3390/en17164164
Chicago/Turabian StyleLiu, Chongyang, Xinkun Ge, Xiang Zhang, Chen Yang, and Yong Liu. 2024. "Research on the Characteristics of Oscillation Combustion Pulsation in Swirl Combustor" Energies 17, no. 16: 4164. https://doi.org/10.3390/en17164164