Article

Fluid Flow Behavior in Nanometer-Scale Pores and Its Impact on Shale Oil Recovery Efficiency

1
School of Petroleum and Natural Gas Engineering, Changzhou University, Changzhou 213164, China
2
Research Institute of Petroleum Exploration & Development, PetroChina Company Limited, Beijing 100083, China
*
Author to whom correspondence should be addressed.
Energies 2024, 17(18), 4677; https://doi.org/10.3390/en17184677
Submission received: 16 August 2024 / Revised: 9 September 2024 / Accepted: 15 September 2024 / Published: 20 September 2024

Abstract

:
Shale oil reservoirs, as an unconventional hydrocarbon resource, have the potential to substitute conventional hydrocarbon resources and alleviate energy shortages, making their exploration and development critically significant. However, due to the low permeability and the development of nanopores in shale reservoirs, shale oil production is challenging and recovery efficiency is low. During the imbibition stage, fracturing fluid displaces the oil in the pores primarily under capillary forces, but the complex pore structure of shale reservoirs makes the imbibition mechanism unclear. This research studies the imbibition flow mechanism in nanopores based on the capillary force model and two-phase flow theory, coupled with numerical simulation methods. The results indicated that within a nanopore diameter range of 10–20 nm, increasing the pore diameter leads to a higher imbibition displacement volume. Increased pressure can enhance the imbibition displacement, but the effect diminishes gradually. Under the water-wet conditions, the imbibition displacement volume increases as the contact angle decreases. When the oil phase viscosity decreases from 10 mPa·s to 1 mPa·s, the imbibition displacement rate can increase by 72%. Moreover, merely increasing the water phase viscosity results in only a 5% increase in the imbibition displacement rate. The results provide new insights into the imbibition flow mechanism in nanopores within shale oil reservoirs and offer a theoretical foundation and technical support for efficient shale oil development.

1. Introduction

As conventional oil and gas resources diminish and global oil demand increases, the focus has shifted to developing unconventional hydrocarbon resources. Shale oil, as one such resource, offers the potential to alleviate oil shortages through intensified exploration and development efforts. In China, shale oil resources are widely distributed, with estimated reserves exceeding 100 billion tons, indicating significant exploration and development potential [1]. However, shale oil reservoirs exhibit strong heterogeneity, with storage spaces primarily comprising micro- and nanopores, which complicates production and results in low recovery rates [2]. Imbibition displacement is a key technology for efficient development of such low-grade oil reservoirs. Moreover, the imbibition mechanism between fracturing fluid and crude oil remains unclear. Hence, understanding fluid flow in nanopores is crucial for enhancing shale oil recovery [3,4,5,6].
Shale oil reservoirs contain significant organic matter, and most shale pores are nanopores within this organic matrix. Compared to conventional reservoirs, the micro- and nanoscale effects in shale oil reservoirs are particularly pronounced. Molecular simulation methods, especially molecular dynamics (MD), have become essential for studying flow behavior in nanopores. Molecular simulations can be applied at both macroscopic and microscopic scales, suitable for gases, liquids, and solids. Their accuracy and simplicity make them an effective tool for studying nanopore flow.
Numerous studies have focused on the flow behavior in nanopores under various conditions. Nagayama et al. (2004) used MD to simulate the effect of interface wettability on relative flow in nanopores, and found no interface slip on water-wet walls in 8.22 nm pores [7]. Under the pressure-driven conditions, the interfacial resistance in oil-wet conditions was lower than in water-wet conditions. Coasne B et al. (2006) used MD to study argon adsorption in nanopores, showing stronger fluid–wall interactions in graphene nanopores than in porous media [8]. Chen et al. (2008) utilized non-equilibrium MD to investigate water flow in carbon nanopores, revealing that shear stress between nanopores and water molecules is decisive for nanopore flow, with viscosity decreasing as pore radius decreases or flow rate increases [9]. Kucaba et al. (2009) employed MD to study water flow in nanopores of varying sizes and materials, demonstrating that wall interactions significantly influence flow slip, with slip length decreasing as pore size increases [10]. Falk et al. (2015) used MD to investigate hydrocarbon adsorption and flow in nanopores, showing that flow is significantly affected by wall friction, exhibiting non-Darcy flow characteristics [11]. In sub-nanopores, strong wall adsorption makes intercomponent and intermolecular friction negligible, with hydrocarbon mobility in nanopores related to carbon chain length.
There are also many studies that used MD to simulate the fluid behavior characteristics in nano slits [12,13,14,15,16,17]. In summary, MD can effectively simulate and analyze nanoscale flow. While the research has advanced the understanding of nanopore flow, most studies focus on shale gas and gas–liquid two-phase flow, which is often considered a single factor. Hence, the mechanism of oil–water two-phase flow in nanopores was investigated. The effects of single and multiple factors on flow are identified. In addition, the results are visualized by the numerical simulation method, and the functional relationship between the influencing factors and the flow is clarified. The research will provide theoretical and technical support for efficient shale oil development.

2. Nanopore Flow Model Construction

At the nanoscale, the flow behavior of fluids is significantly influenced by surface effects and geometric constraints. To gain a deeper understanding of the flow characteristics of fluids at the nanoscale, it is crucial to study the imbibition flow laws in nanopores. In shale oil reservoirs, due to the nanoscale characteristics of the pore structure, factors such as pore size, fluid properties, and wettability have a particularly complex impact on fluid movement. The traditional Hagen–Poiseuille equation is no longer sufficient to accurately describe fluid motion at this scale.
Therefore, there is a need to construct a nanoscale capillary force model through simulation results, which combines computational fluid dynamics and phase field methods (Figure 1). The model aims to describe the flow characteristics of fluids within nanopores in shale oil reservoirs under the influence of various factors. With this model, we can more accurately capture and predict the dynamic behavior of fluids at the nanoscale, providing theoretical support and practical guidance for fluid management in shale reservoirs.

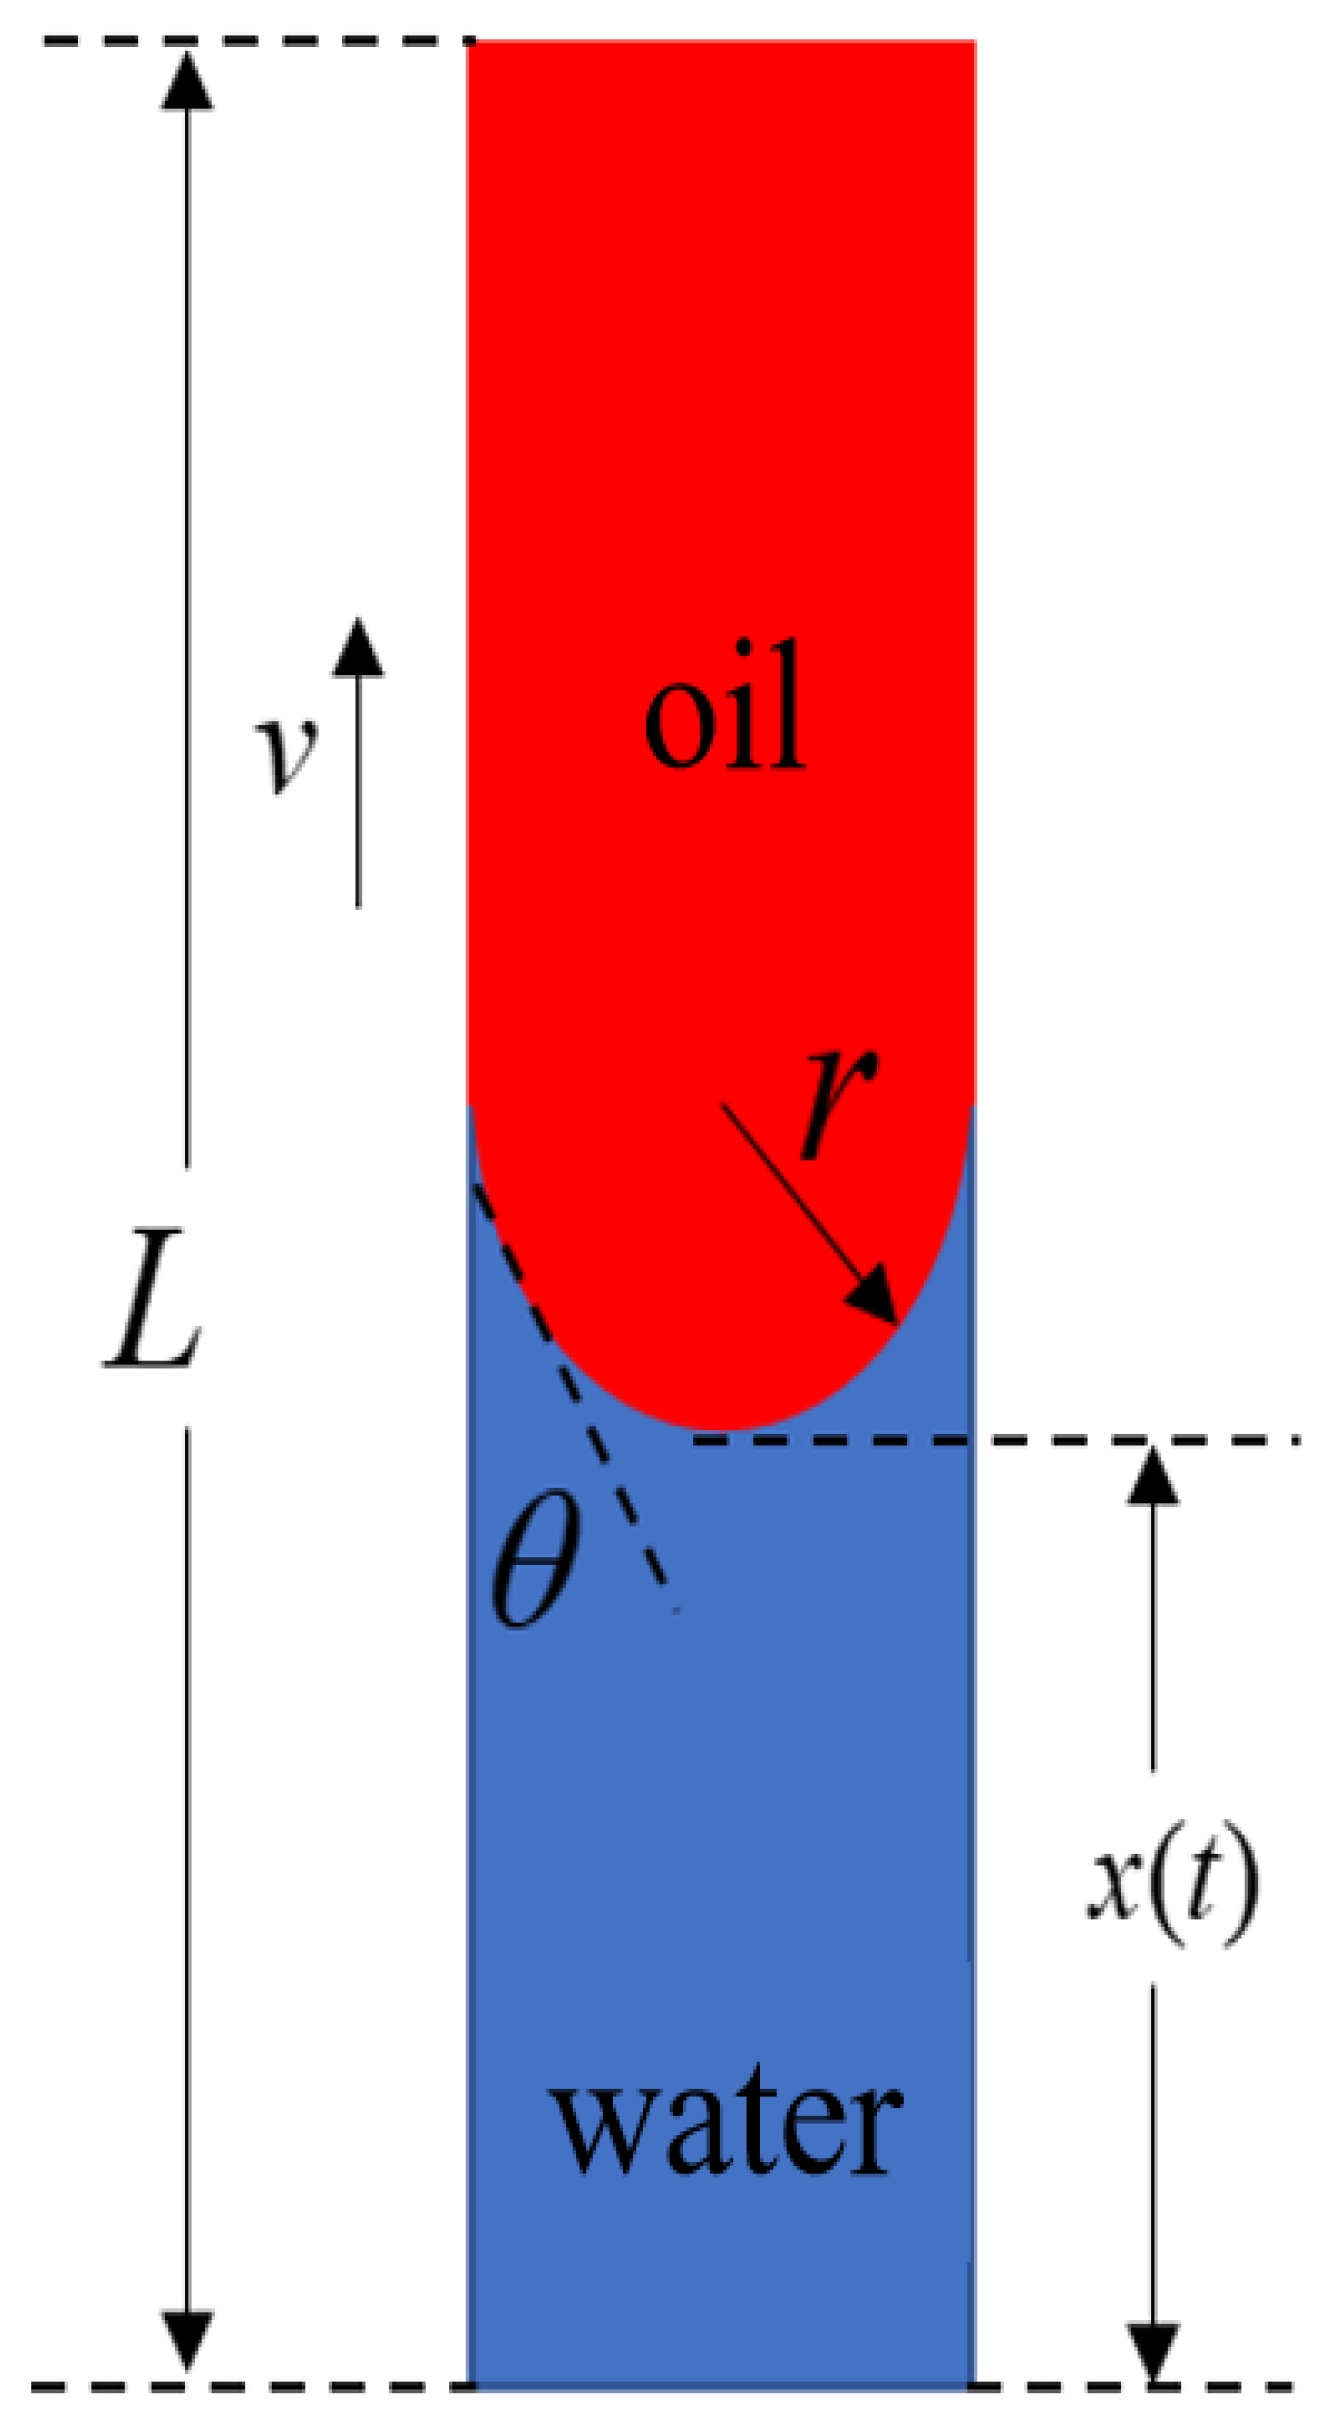
2.1. Nanopore Capillary Imbibition Model

In the realm of multiphase flow research, the flow characteristics between two phases are typically defined by their respective pressures and saturations. From a macroscopic perspective, when considering the flow of two different fluid phases, the pressure difference between them can be interpreted as capillary pressure. When investigating the permeability characteristics of porous media, conducting fundamental research on the imbibition flow in single nanopores is of paramount importance. To construct a model that describes capillary permeation, we have established the following assumptions:
The capillary pores are considered to be wetted by water, which serves as the wetting medium within the pore structures.
The impact of the flow inlet and any associated flow losses are disregarded, allowing for a more focused analysis on the intrinsic flow dynamics within the capillary system.
Inertial forces and the effects of osmotic pressure are omitted from the considerations, as they are of minor significance at the nanoscale and under the specific conditions of this study.
The capillary force is assumed to be constant, and a fixed static contact angle is utilized to characterize the wetting properties of the fluid within the nanopores.
The distribution of water and oil inside the capillary in the model is shown in Figure 2. Here, L represents the length of the capillary, in m; v denotes the seepage velocity, in m/s; θ represents the contact angle, in °; r denotes the radius of the capillary, in m; and x denotes the distance of oil–water flow and seepage, in m.
The capillary rise phenomenon can be described using Newton’s law:
F c F v F g = m a
In the given equation, F c represents the capillary force, in N; F v is the dynamic viscosity, in N; F g is the gravity, in N; m denotes the mass of the fluid (oil or water) in the capillary, in kg; and a is the acceleration, in m/s2.
The capillary pressure p c can be expressed according to the Young–Laplace Equation:
p c = 2 σ cos θ r
In the equation, σ represents the interfacial tension, in N/m. The capillary force F c is represented as follows:
F c = π r 2 p c = 2 π r σ cos θ
The shear force τ v on the nanotube wall can be determined by Newton’s law of fluid friction for laminar flow:
τ v = 2 μ v r v max
In the equation, μ v is the dynamic viscosity of the fluid, in Pa·s; v max is the maximum imbibition velocity on the nanoscale pore wall, in m/s. The imbibition flow process involves the slow flow of incompressible Newtonian fluid in nanoscale pores, tending towards steady Poiseuille flow. Therefore, the flow resistance follows the Hagen–Poiseuille equation. The relationship between the maximum imbibition velocity v max and the average flow velocity can be expressed as follows:
v max = 2 v ¯
The expression for viscous force can be derived as follows:
F v = F v w + F v o = 2 π r x τ v w + L x τ v o = 8 π μ w x + μ o L x d x d t
F v w is the dynamic viscosity of the water phase, in N; F v o is the dynamic viscosity of the oil phase, in N; τ v w is the shear force of the water phase, in N/m2; τ v o is the shear force of the oil phase, in N/m2; μ w is the viscosity force of the water phase, in Pa·s; μ o is the viscosity force of the oil phase, in Pa·s; and d x d t is the imbibition velocity, in m/s. The imbibition velocity can be expressed as follows:
d x d t = r 4 τ v w x + τ v o L x μ w x + μ o L x
The total mass of oil and water in nanoscale pores can be expressed as follows:
m = π r 2 ρ w x + π r 2 ρ o L x
where gravity can be expressed as follows:
F g = m g = π r 2 ρ w g x + π r 2 ρ o g L x
In the equation, ρ w and ρ o represent the fluid density of the water phase and oil phase, respectively, in kg/m3.
Substituting the above equation into Equation (1), differentiation yields can be obtained as follows:
2 π r σ cos θ 8 π x μ w + L x μ o d x d t π r 2 ρ w g x + π r 2 ρ o g L x = π r 2 ρ w x + ρ o L x d 2 x d t 2
Flow in nanoscale pores is steady, neglecting inertial forces; the above equation simplifies as follows:
2 r σ cos θ 8 x μ w + L x μ o d x d t r 2 ρ w g x + r 2 ρ o g L x = 0
Integrating the above equation yields the analytical expression for capillary imbibition flow:
t p = 8 L μ o A ln A x B + 1 8 μ o μ w A 2 A x + B ln B A x + B
where A = ρ o ρ w r 2 g ; B = 2 r σ cos θ r 2 ρ o g L . When dt is sufficiently small, the error influence can be neglected. After differencing and integrating Equation (11), the numerical solution for spontaneous imbibition in the capillary tube, x p i , can be expressed as follows:
x pi = L μ o L μ o 2 2 μ o μ w 1 2 μ w x pi 1 2 +   L μ o x pi 1 1 2 μ o x pi 1 2 + r 2 8 2 σ cos θ r g ρ w x pi 1 + L x pi 1 ρ o t pi t pi 1 1 / 2 / ( μ o μ w )
The imbibition volume of the i-th nanopore can be expressed as follows:
q p i = π r 2 x p i

2.2. Slip Length and Boundary Conditions

The slip length is defined as the virtual distance between the fluid and solid surface where the fluid velocity hypothetically drops to zero (Figure 3). It serves as an indicator of slip phenomenon intensity in nanochannels. In conventional sandstone reservoirs, where pore scales are typically at the micrometer level, the impact of slip is often negligible relative to pore geometry. However, in shale oil reservoirs, widespread nanometer-scale pores enable slip effects on fluid molecules at pore walls, significantly enhancing fluid mobility. Therefore, the slip length in nanometer-scale pores must be considered for shale oil reservoirs.
In nanochannels, under the influence of pressure differential, the developed flow characteristics of two-phase fluids exhibit a parabolic velocity distribution. In such cases, the shear rate of the oil film at the wall is low and uniformly distributed along the wall, making it suitable to employ the Navier slip model [18]. This model assumes that the slip velocity is proportional to the viscosity shear rate and the slip coefficient. Other nanochannel boundary models include nonlinear slip models, non-local slip models, and hybrid boundary slip models, which describe the sliding behavior of liquids on solid interfaces. Navier proposed a simple first-order boundary slip model, which indicates that liquid slip occurs when fluids flow near solid boundaries, and the magnitude of slip velocity is proportional to the local strain rate. It is written as follows:
u s = b ( u n ) W
where W represents the wall boundary; b is the slip parameter on the wall, reflecting material property parameters.
Introducing the nanoscale slip length shifts the velocity profile uniformly downwards, replacing the classical no-slip boundary condition with a slip boundary condition in nanoscale pores as follows:
y = h / 2
u s = b d u d y
y = 0
d u d y = 0

3. Single-Factor Nanopore Flow Analysis

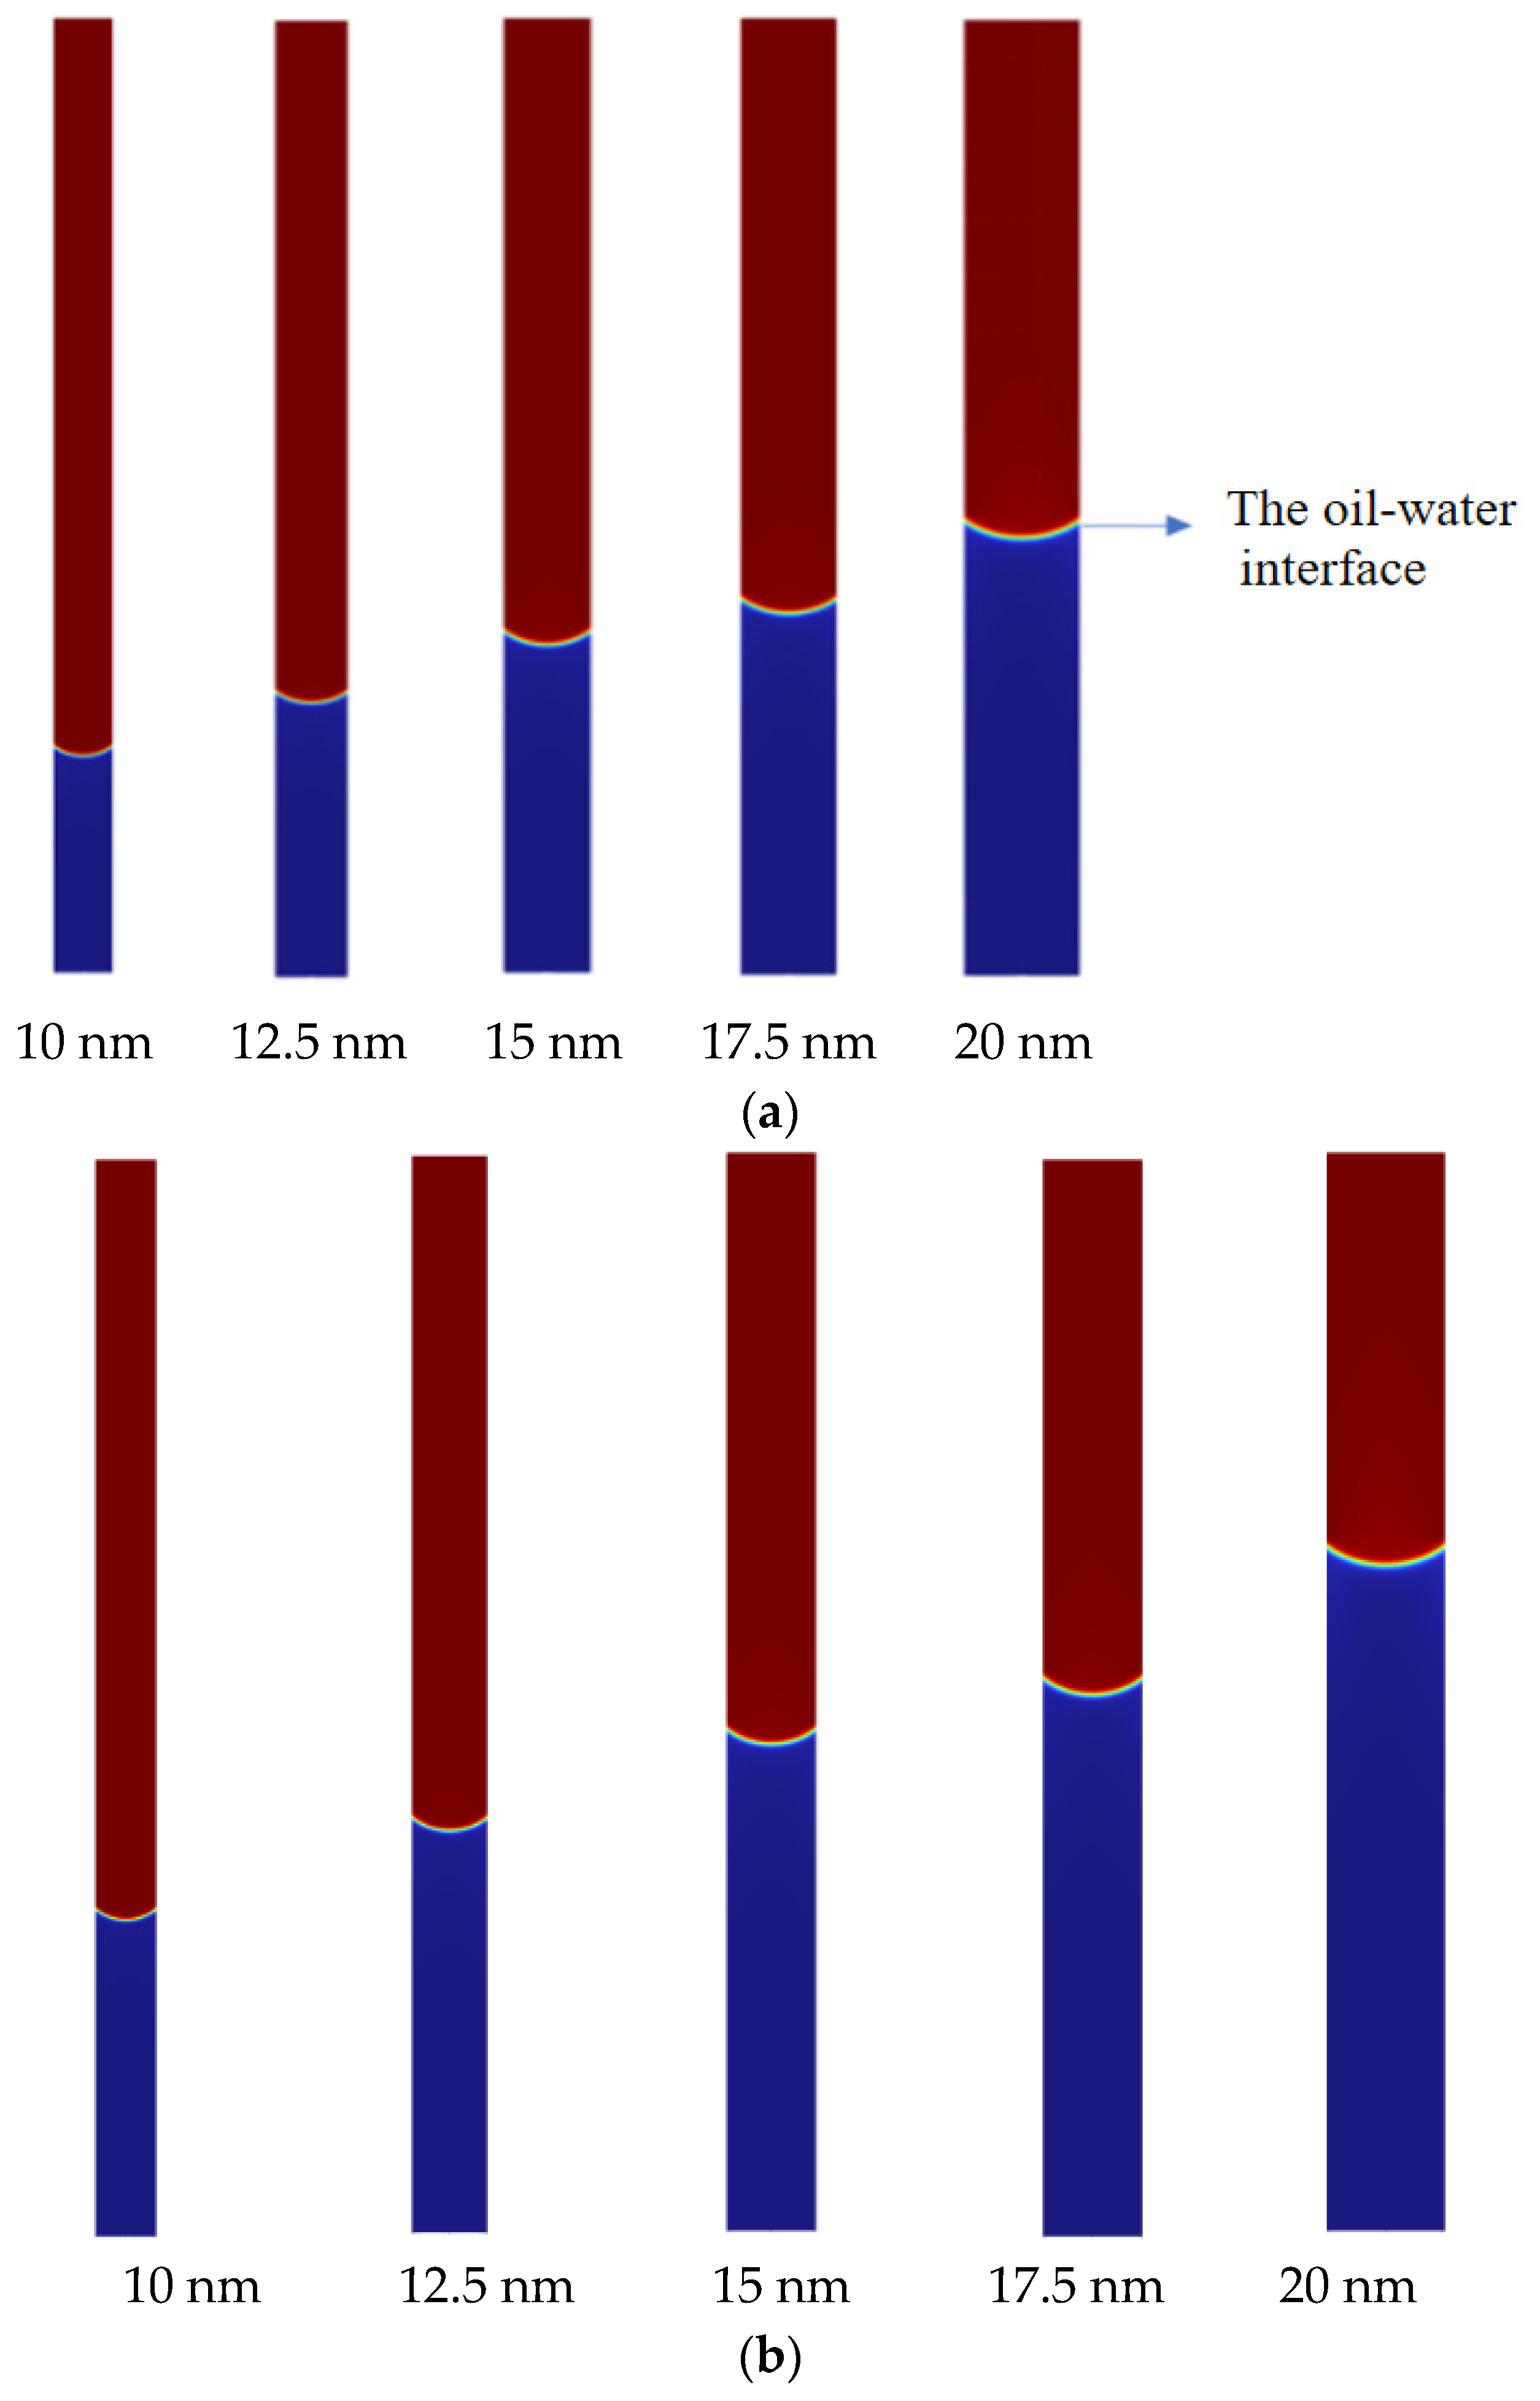
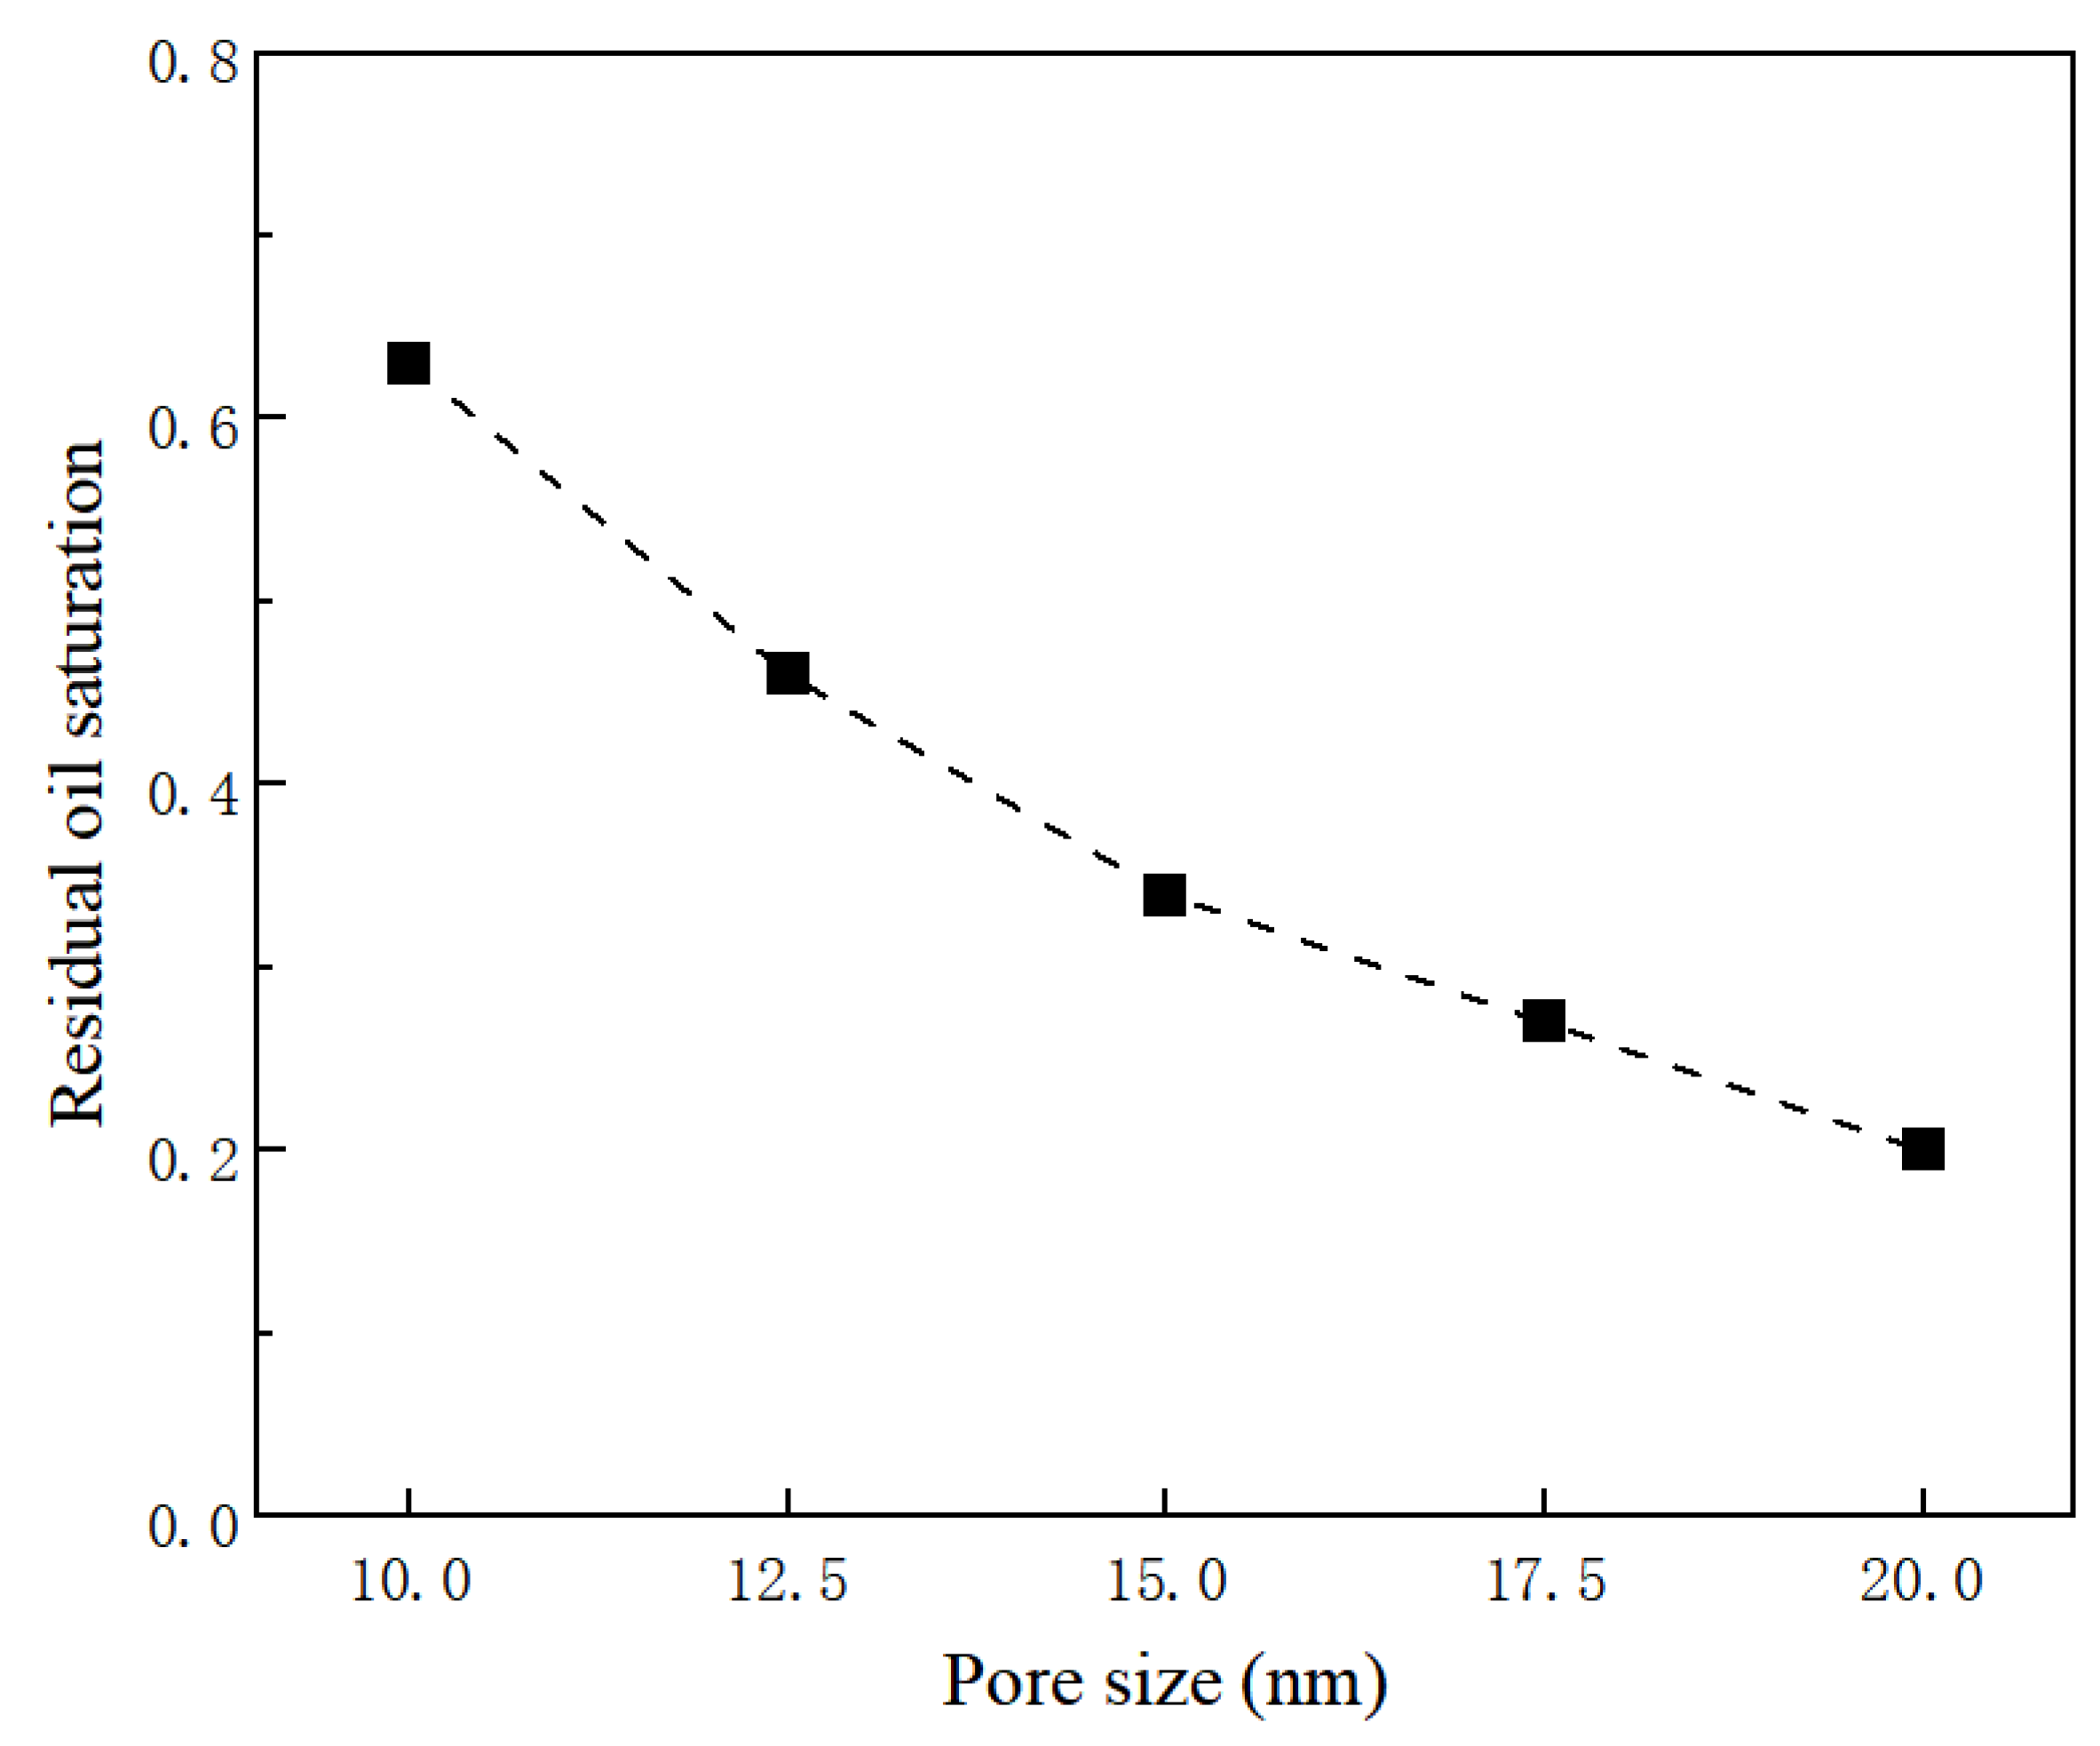
3.1. Pore Size Impact on Nanopore Flow

In shale oil reservoirs, there are widespread nano-scale pores, and the dimensions of these tiny pores significantly affect the reservoir’s permeability. This study aims to investigate the permeation behavior of shale oil and fracturing fluid by varying pore diameters (10, 12.5, 15, 17.5, and 20 nm), as shown in Figure 4. Using the graphical methods, it illustrates changes in residual oil content under different pore sizes, further exploring the specific impact of pore size on imbibition during well shut-in processes.
From Figure 5, it is observed that the displacement efficiency varies with time, increasing with increasing pore diameter. Larger pore diameters lead to faster displacement rates. Particularly, when the pore diameter reaches 17.5 nm, the displacement efficiency curve approaches that of 15 nm, indicating that the increasing trend of displacement efficiency with pore diameter in reservoirs is not strictly linear. There exists a degree of similarity in changes due to similar pore diameters.
The displacement efficiency varies over time under different pore diameter conditions, showing distinct trends, as shown in Figure 6. Smaller pore diameters result in longer imbibition displacement reaction times, whereas larger pore diameters can reduce this time. Considering pore diameter alone at the same time point, larger diameters exhibit more significant imbibition displacement effects. The imbibition displacement efficiency in a 20 nm pore is 46% higher than that in a 10 nm pore. In nanoscale pores where dimensions approach the average free path of fluid molecules, interactions between fluid molecules and pore walls are significantly enhanced, affecting fluid flow capability. Moreover, as pore diameter increases, flow velocity at the interface of the two phases also increases (Figure 7). The flow velocity variation over time in a 20 nm pore can increase by 1.4 m/s. In smaller pores, the non-wetting phase (oil phase) experiences increased flow resistance due to capillary forces, while the increased surface area per unit volume in smaller pores enhances the adsorption of fluid molecules on pore walls, further affecting flow velocity. Therefore, pore diameter significantly influences the two-phase flow patterns in single nanoscale pores.

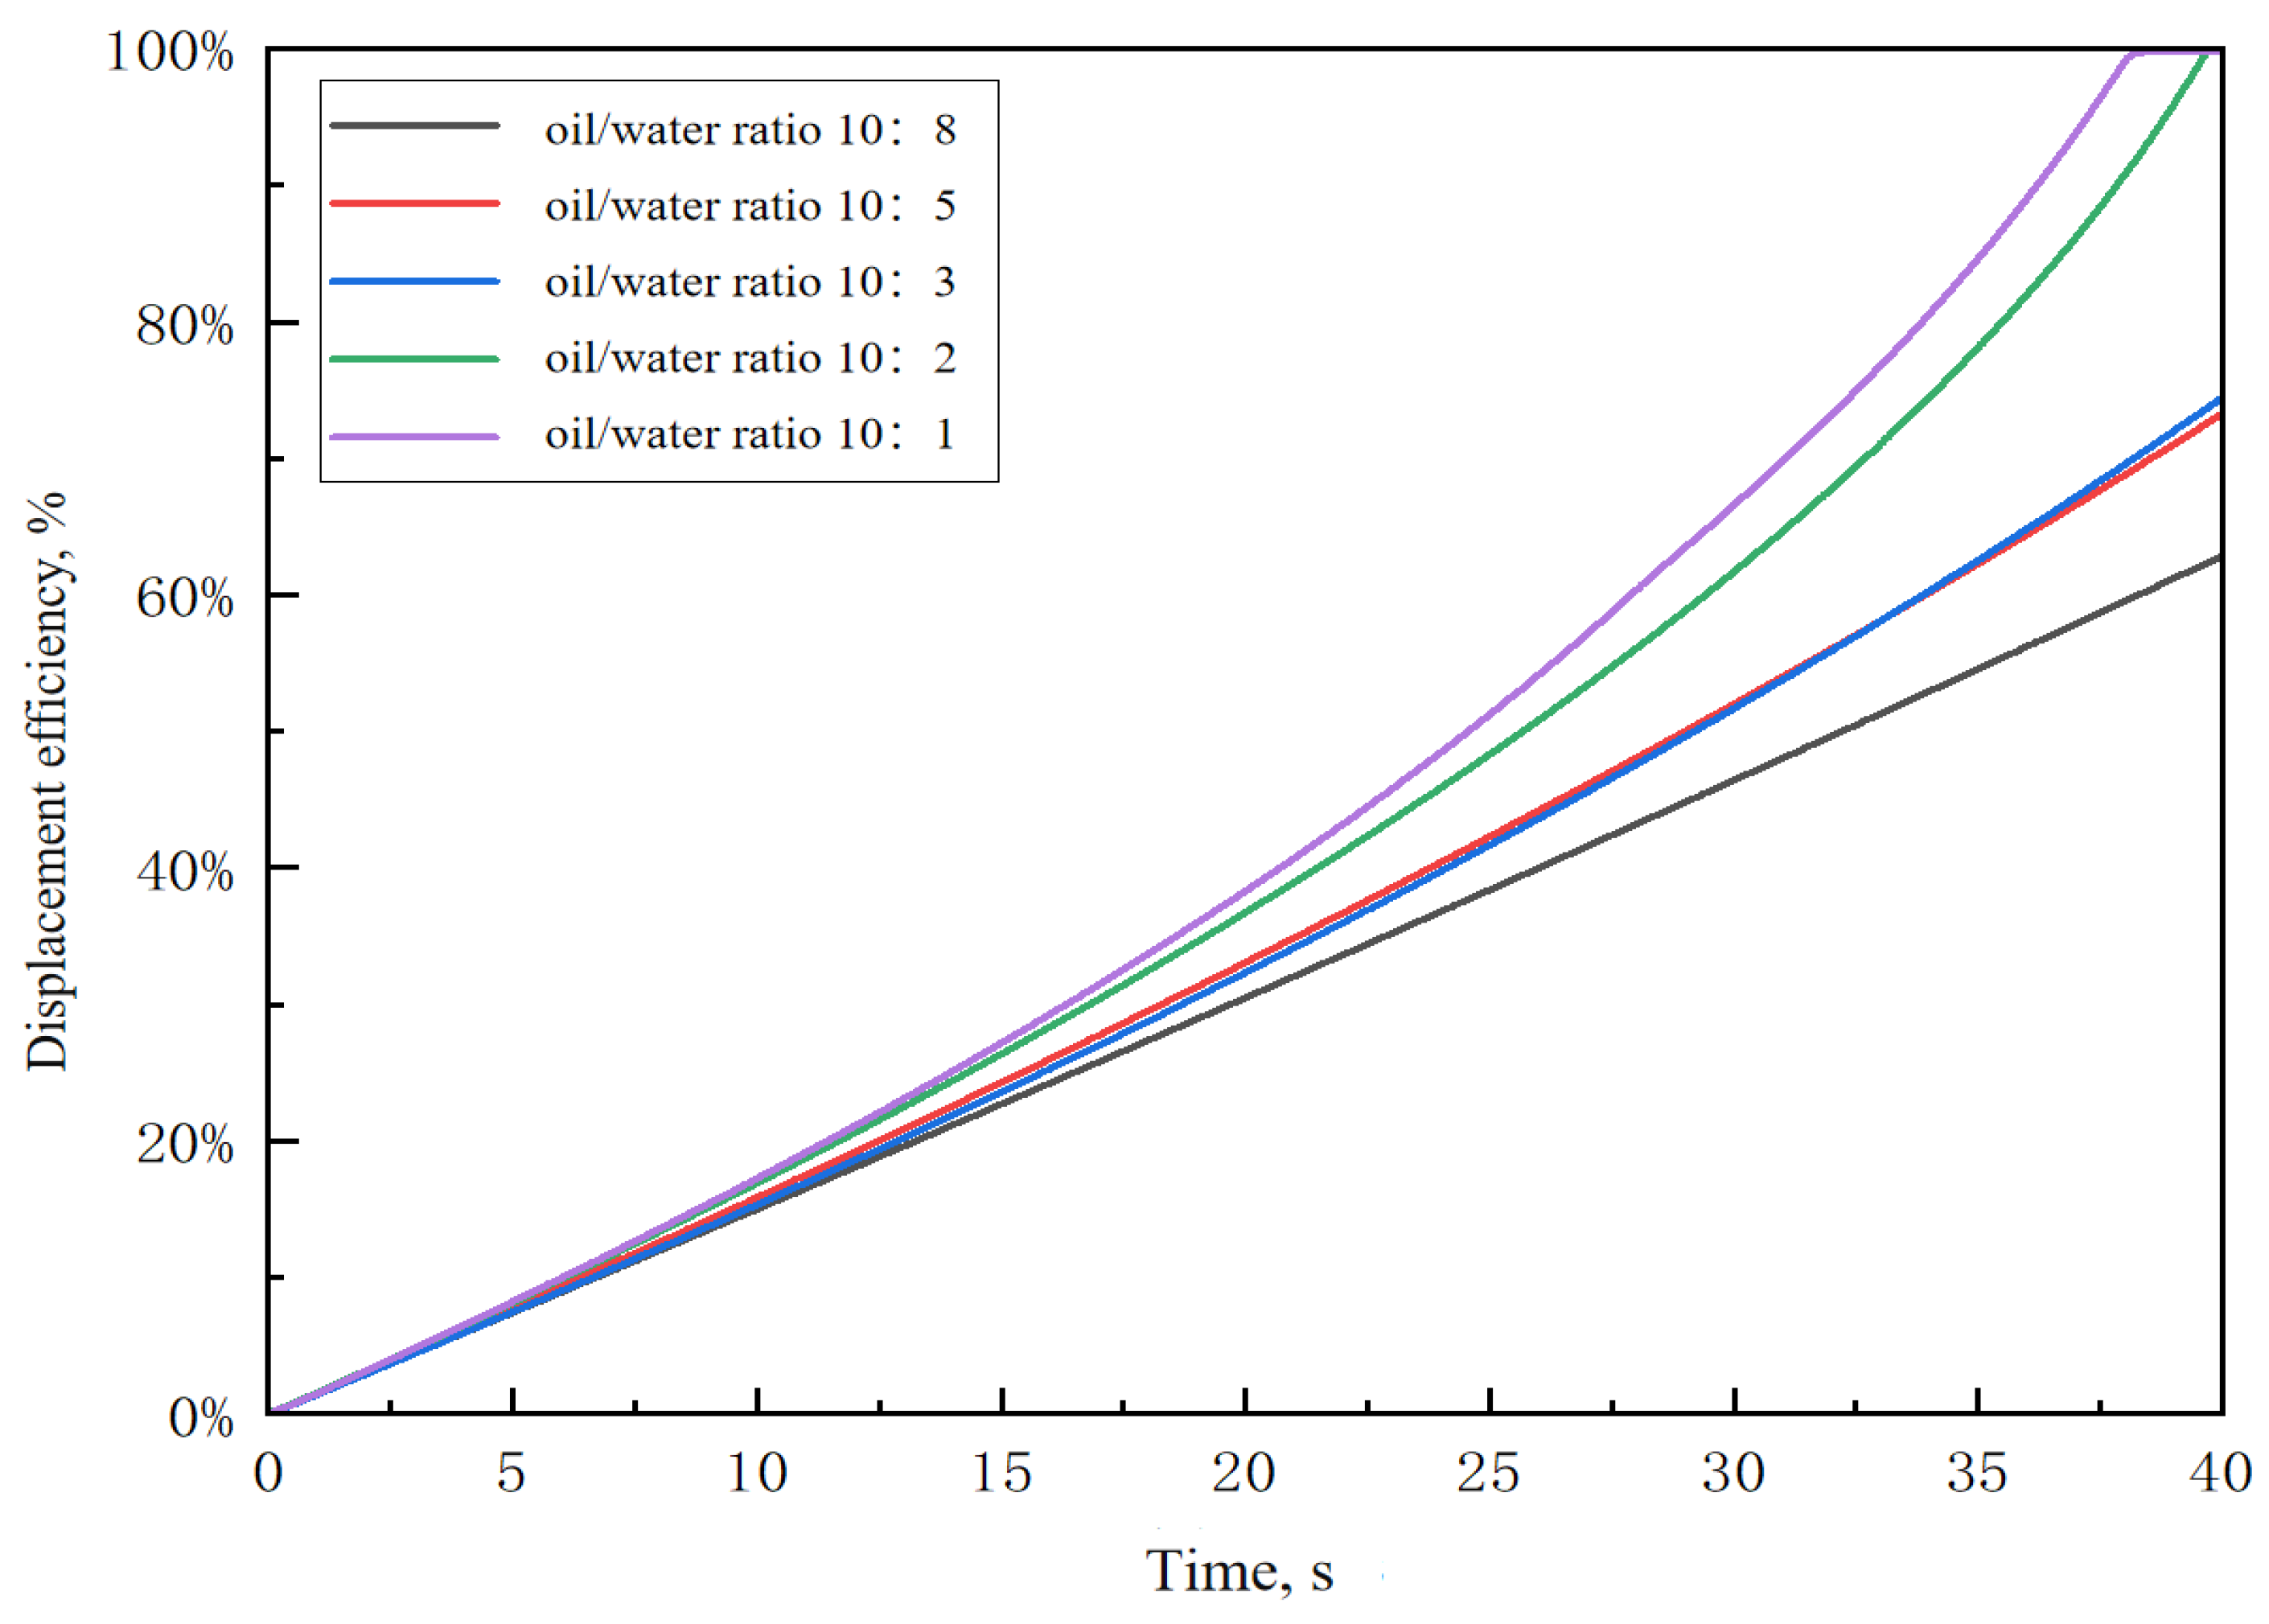
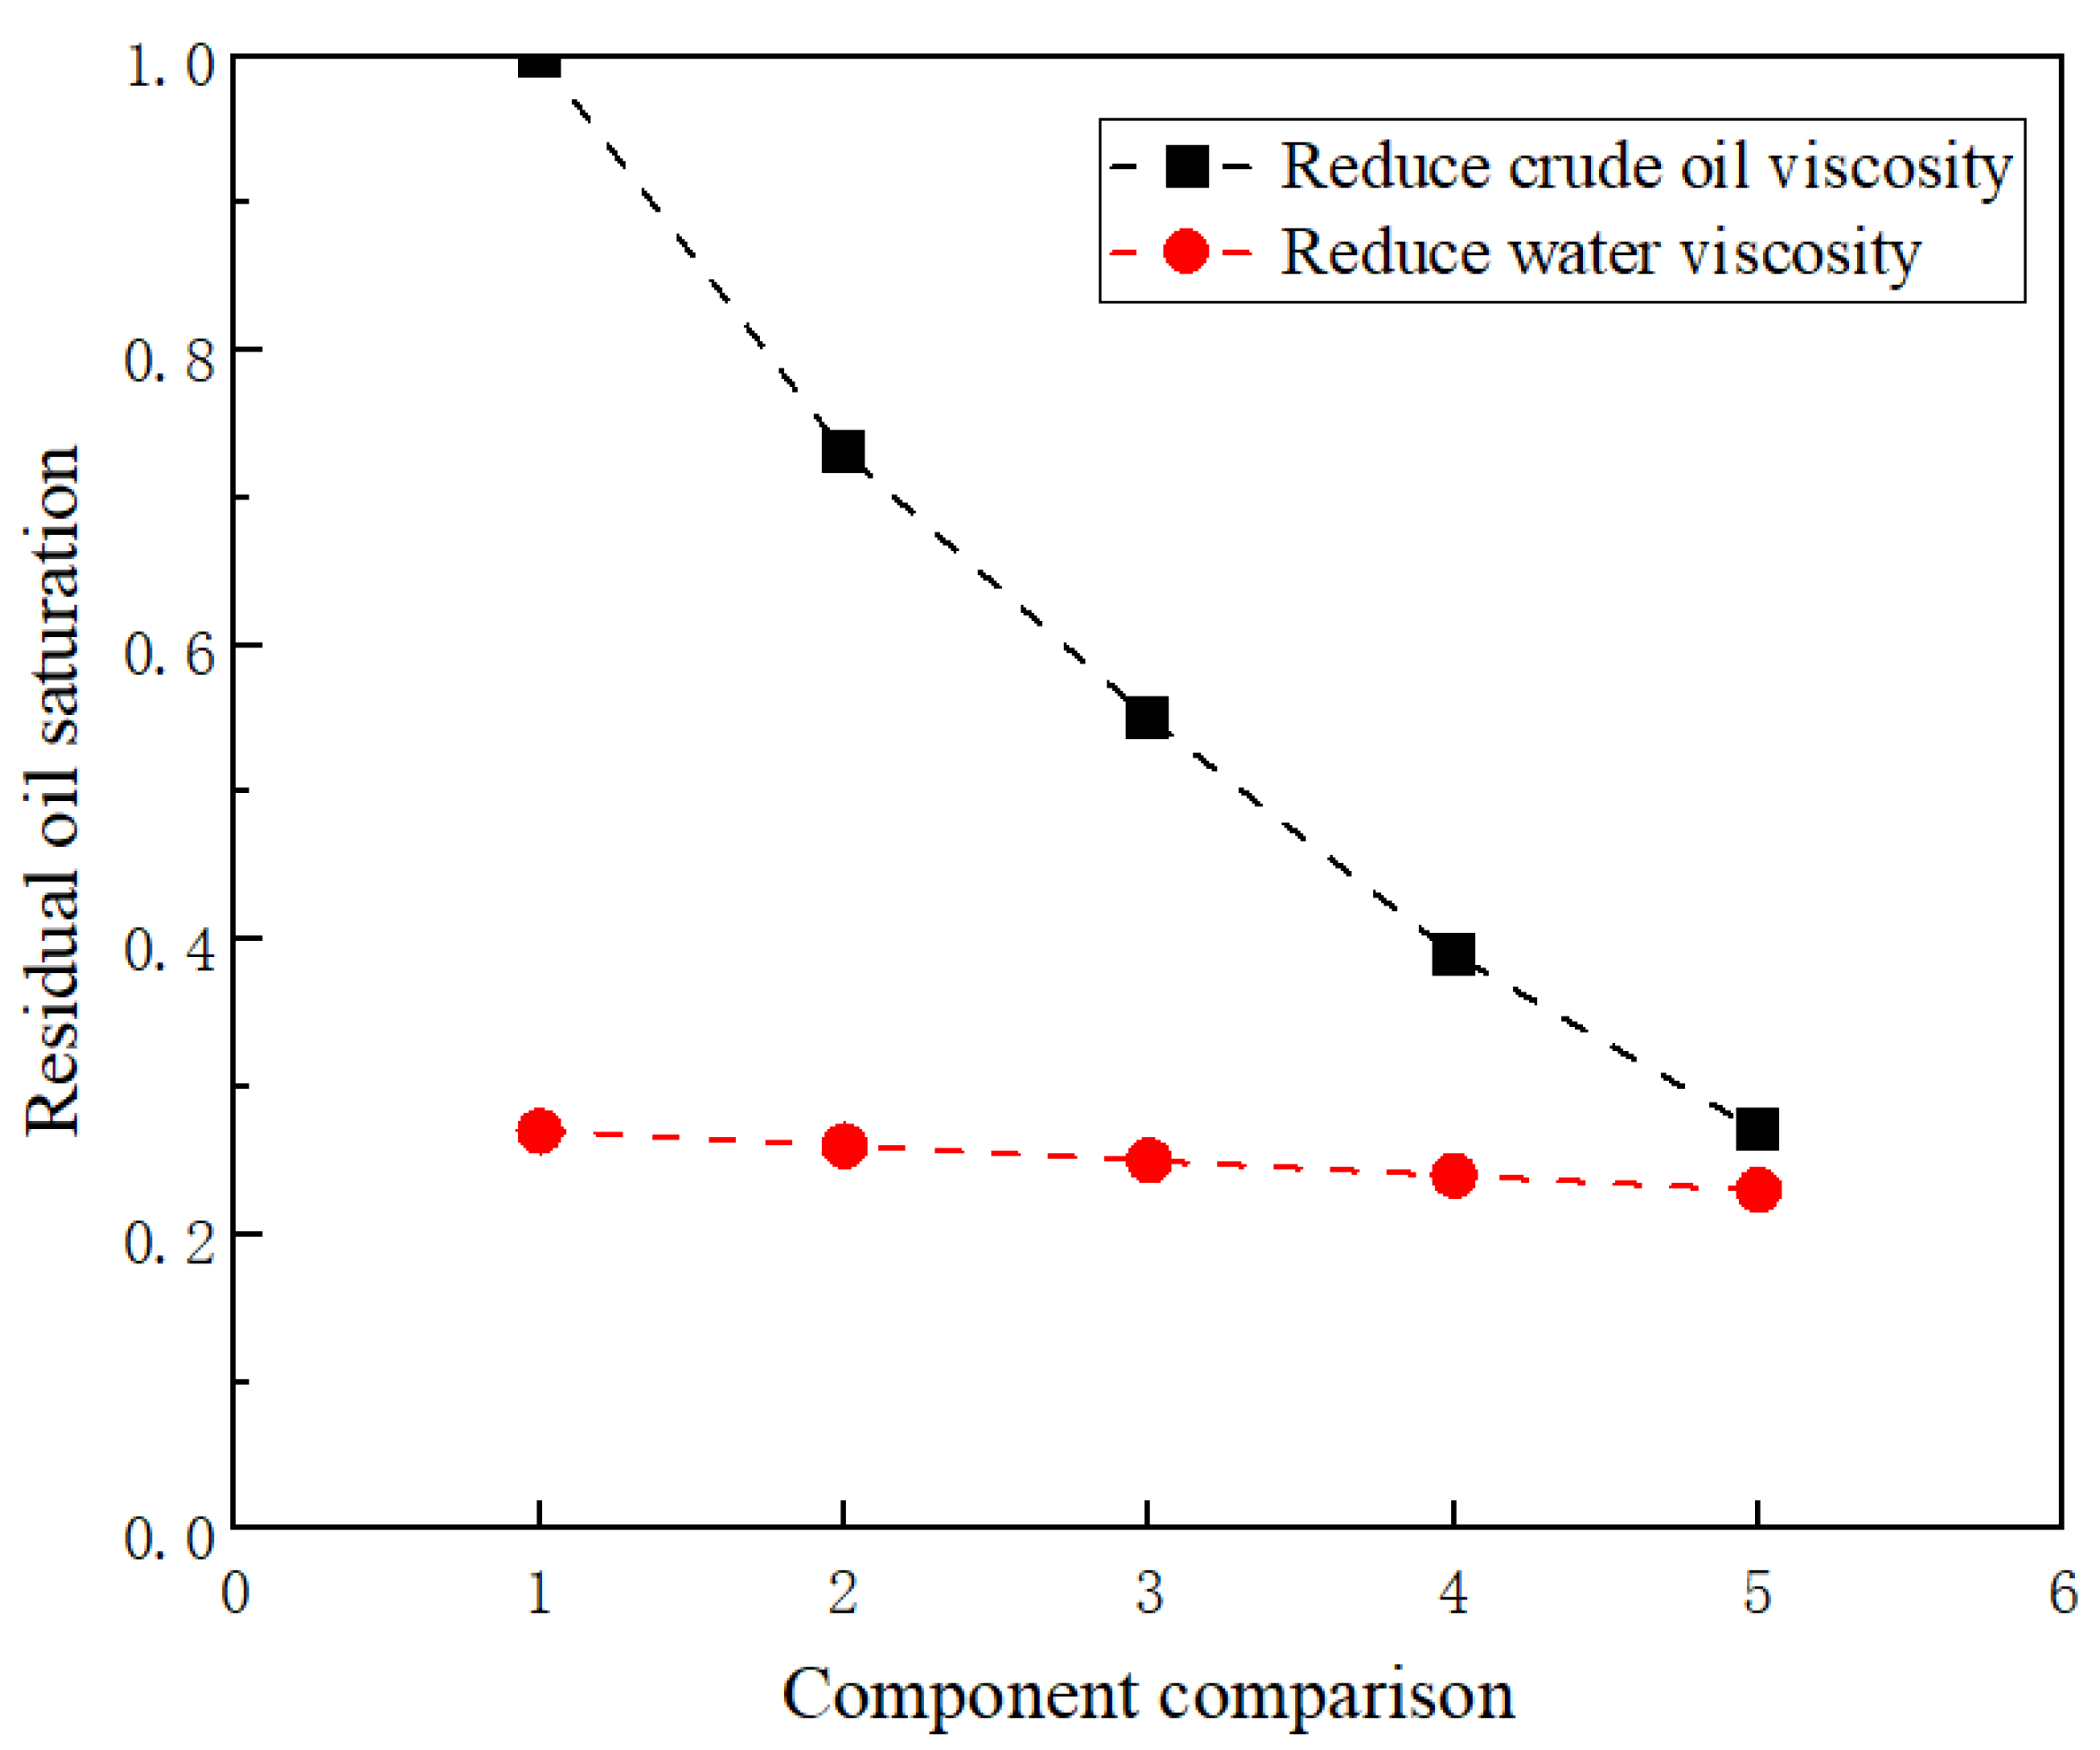
3.2. Viscosity Ratio Impact on Nanopore Flow

In single nanoscale pores, the viscosity ratio between oil and water significantly impacts flow performance. By varying the viscosities of crude oil and water, one can investigate this influence. Assuming a pore diameter of 15 nm (Figure 8), water-wet wall conditions, and static pressure, experiments can be conducted to study the flow patterns of oil and water phases in single nanoscale pores. Adjusting the viscosities of crude oil and water allows for the modulation of phase composition parameters, further exploring their effects on the flow behavior in single nanoscale pores (Table 1).
Changing the viscosity of the water phase significantly affects the variation of displacement efficiency over time. As the viscosity ratio decreases, the displacement efficiency also decreases (Figure 9). For instance, at 30 s, when the viscosity ratio is 10, the displacement efficiency reaches 62%; when the viscosity ratio decreases to 2, the displacement efficiency drops to 45%. Therefore, variations in the dynamic viscosity of the water phase have a significant impact on the flow of oil and water phases in single nanoscale pores. When the viscosity ratio is 10:3 and 10:2, the displacement efficiency curves are close, indicating that within these viscosity ratio ranges, the viscosity of the water phase has a relatively minor effect on imbibition displacement.
It can be seen from Figure 10 and Figure 11, when reducing the viscosity of crude oil from 10 mPa·s to 2 mPa·s, an observation at 15 s shows that the residual volume of crude oil decreases from 98% to 27%, indicating a 71% improvement in displacement efficiency. This demonstrates that reducing the viscosity of crude oil significantly enhances displacement efficiency. The viscosity ratio between the oil and water phases has a significant impact on flow performance, especially when the viscosity of the oil phase is significantly higher than that of the water phase, restricting the flow of the oil phase in nanoscale pores. Conversely, increasing the viscosity of water from 1 mPa·s to 8 mPa·s results in only a 5% increase in displacement efficiency at 15 s. Therefore, variations in component viscosities affect the flow behavior of oil and water phases in nanoscale pores. At the nanoscale, viscosity ratios simultaneously influence the flow characteristics of both phases, with lower viscosity fluids exhibiting higher mobility in nanoscale pores. Thus, in wellbore or chemical flooding processes, reducing the viscosity of crude oil through methods such as injecting viscosity reducers can enhance oil flowability, contributing to increased recovery rates and operational efficiency.

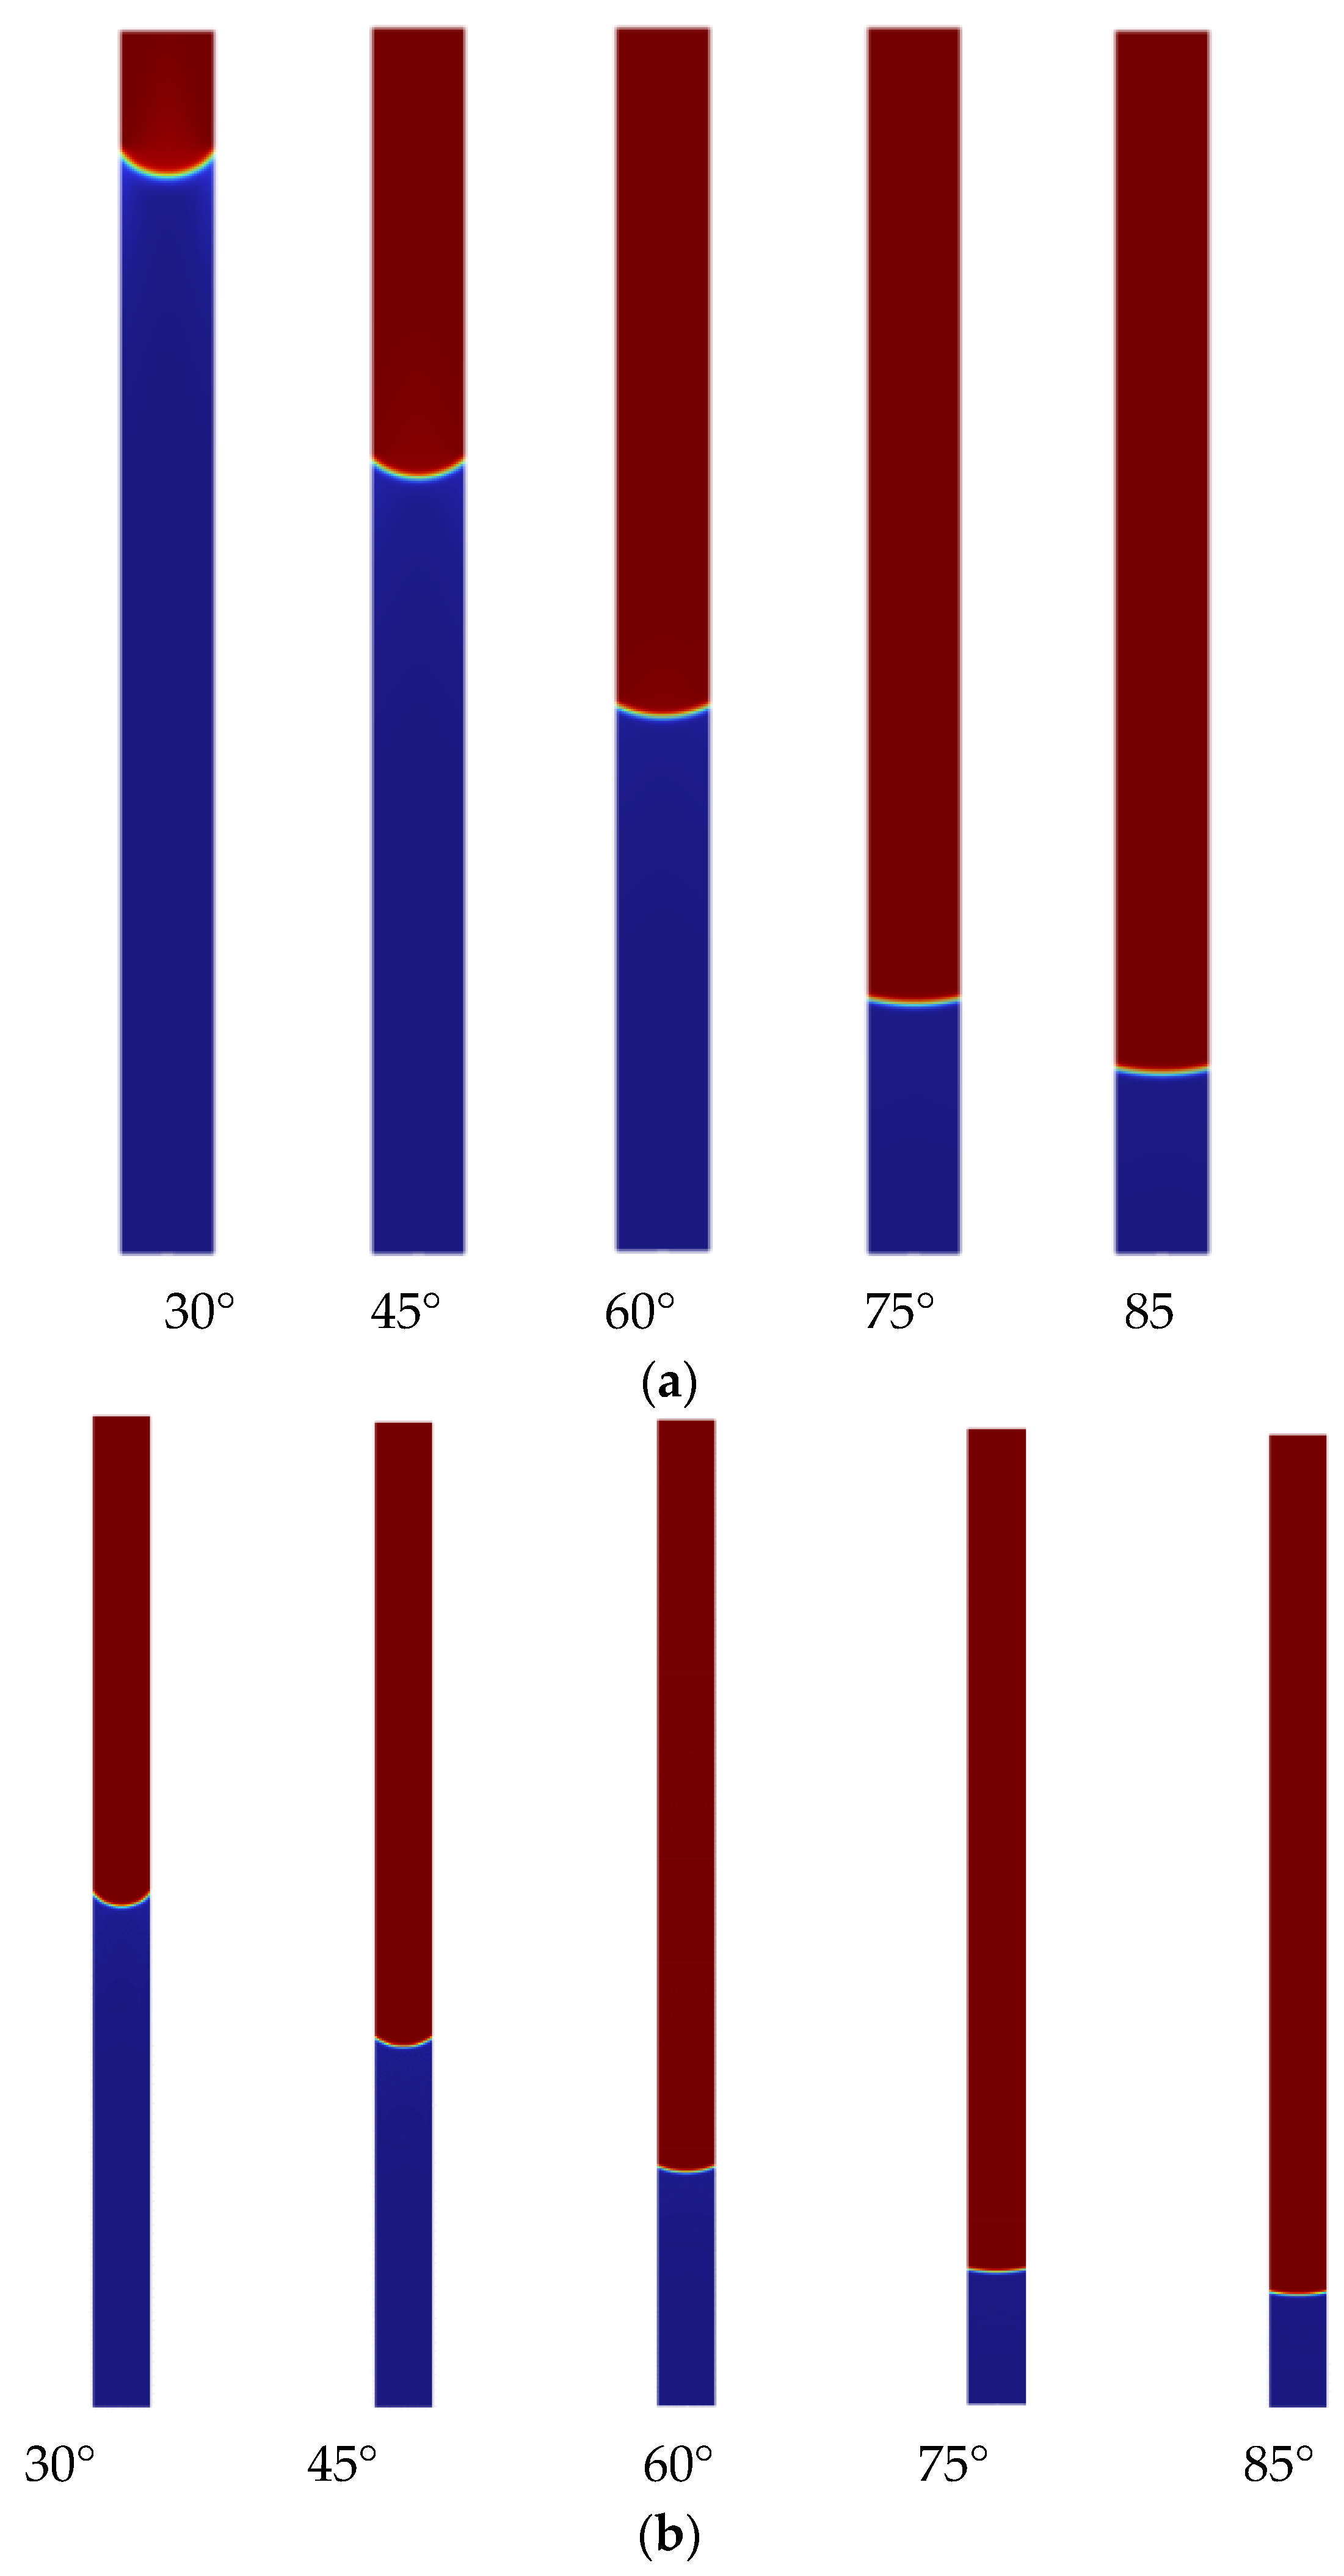
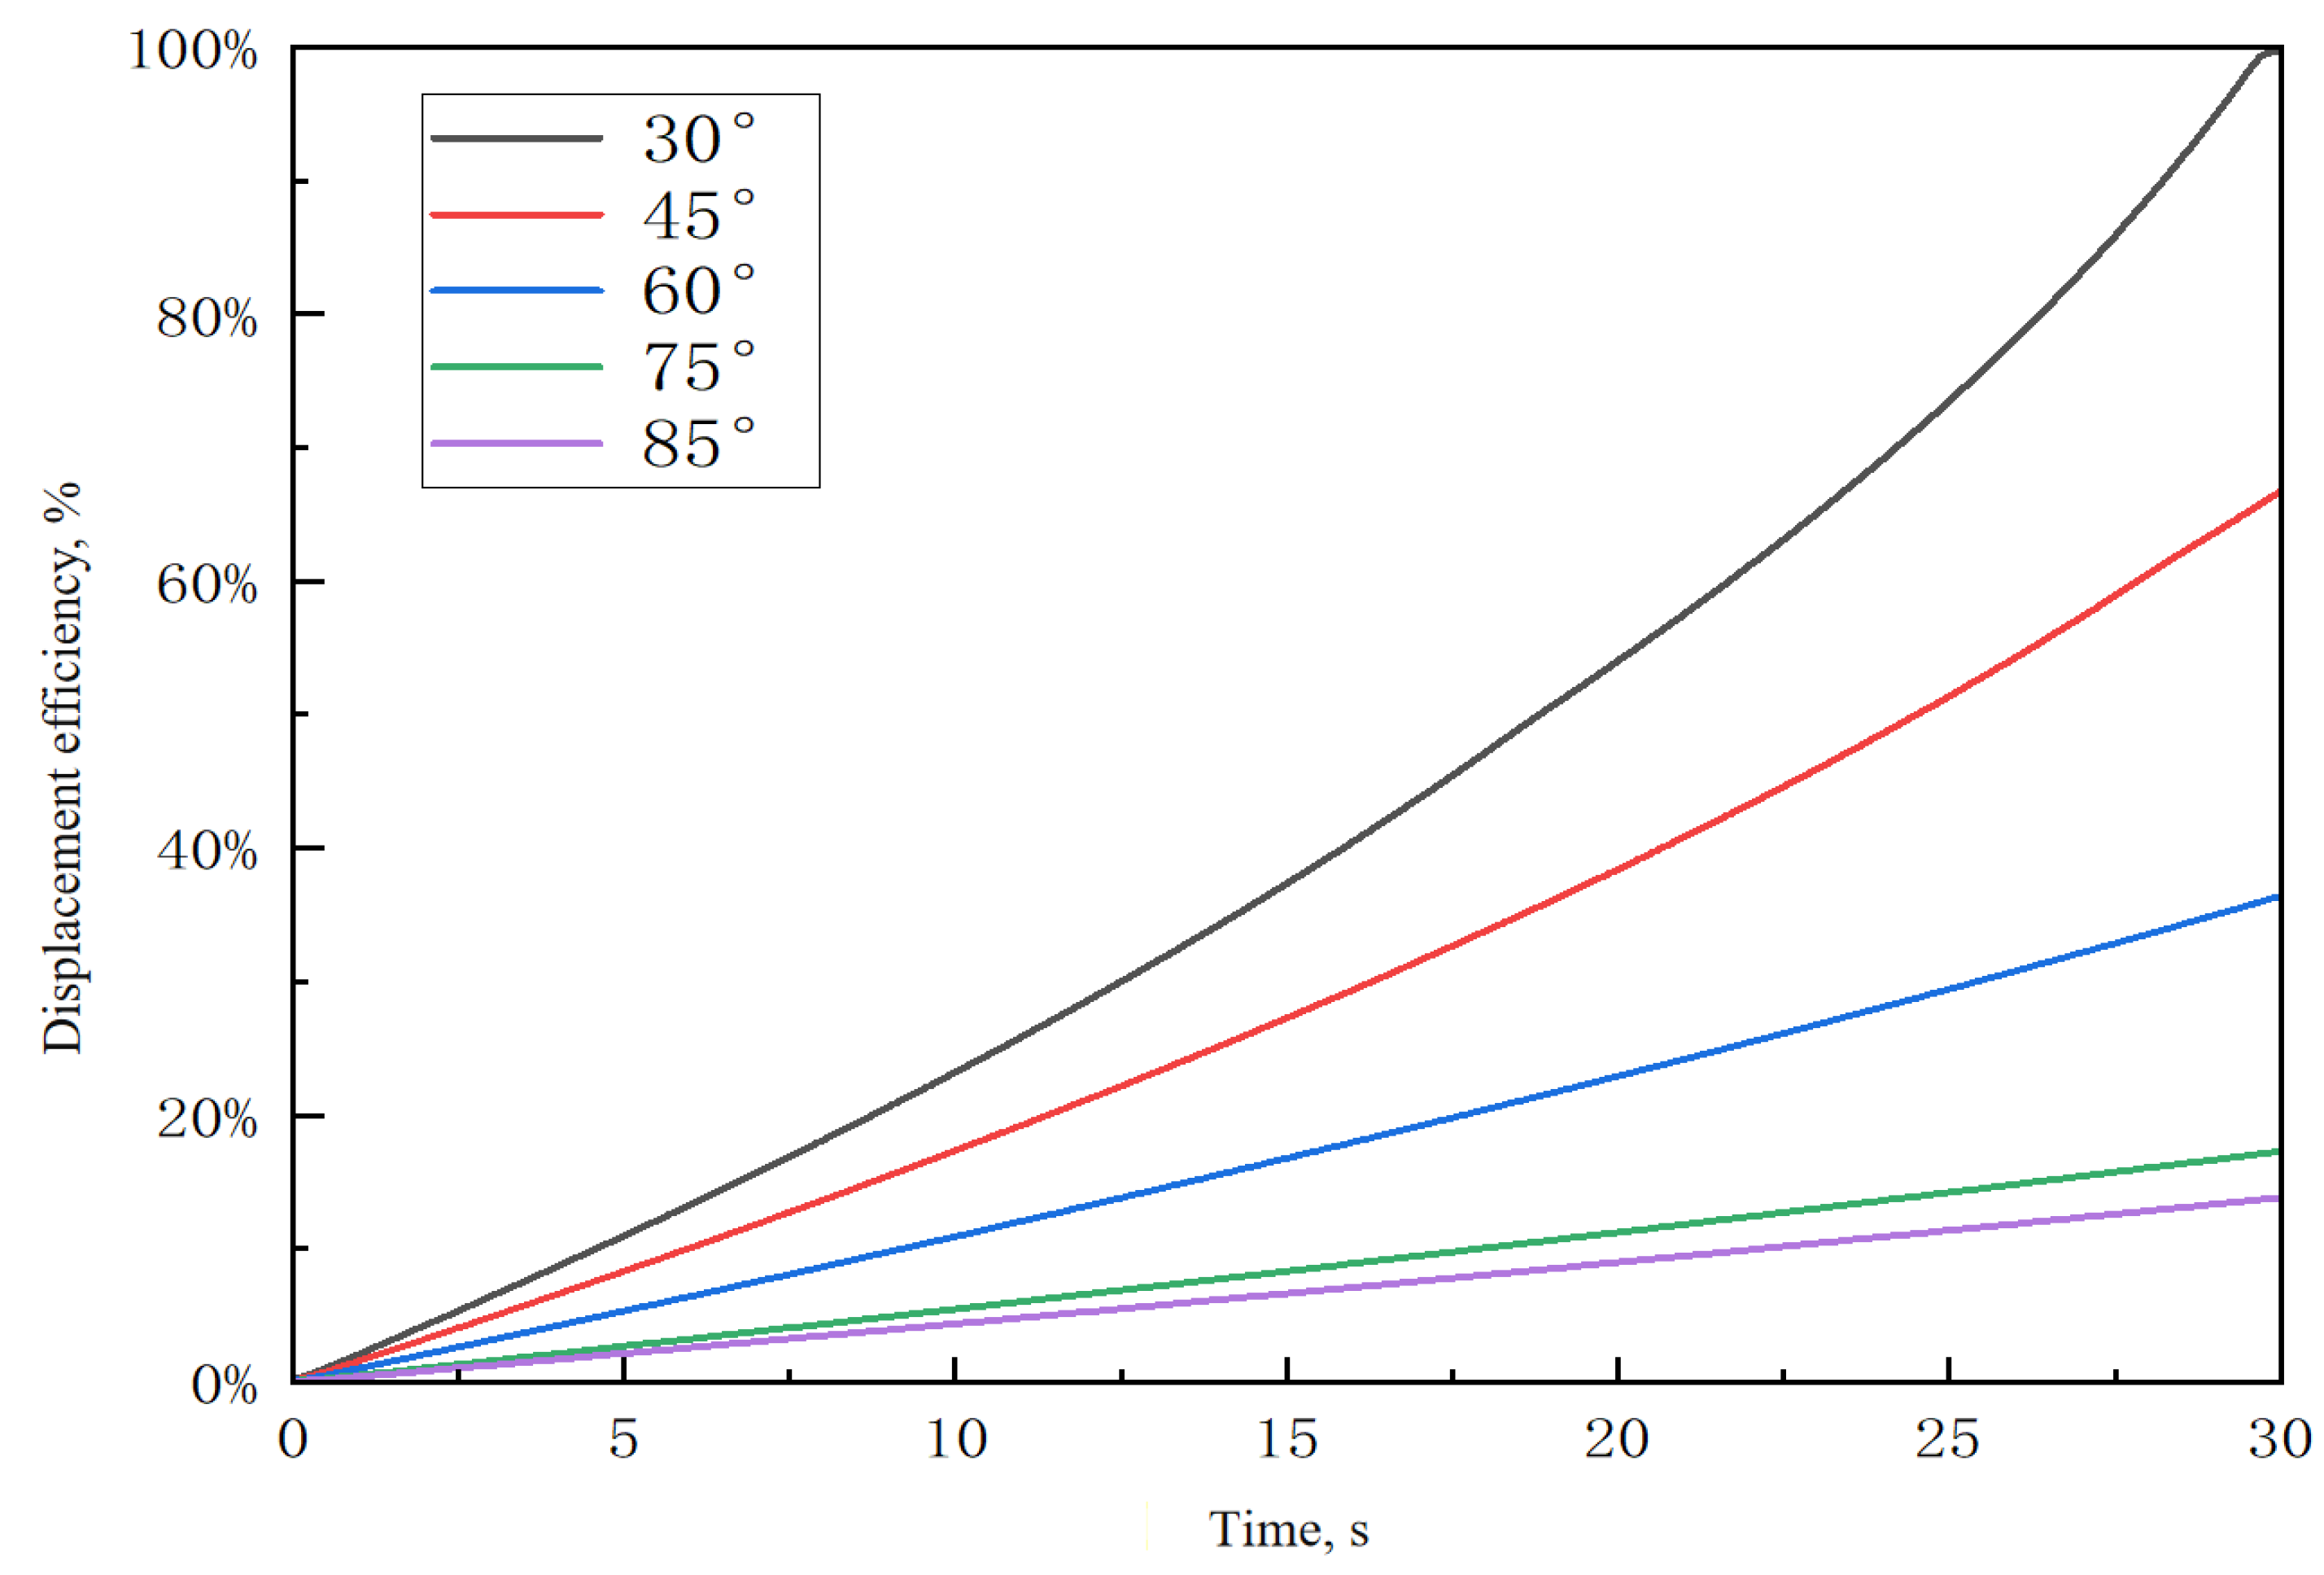
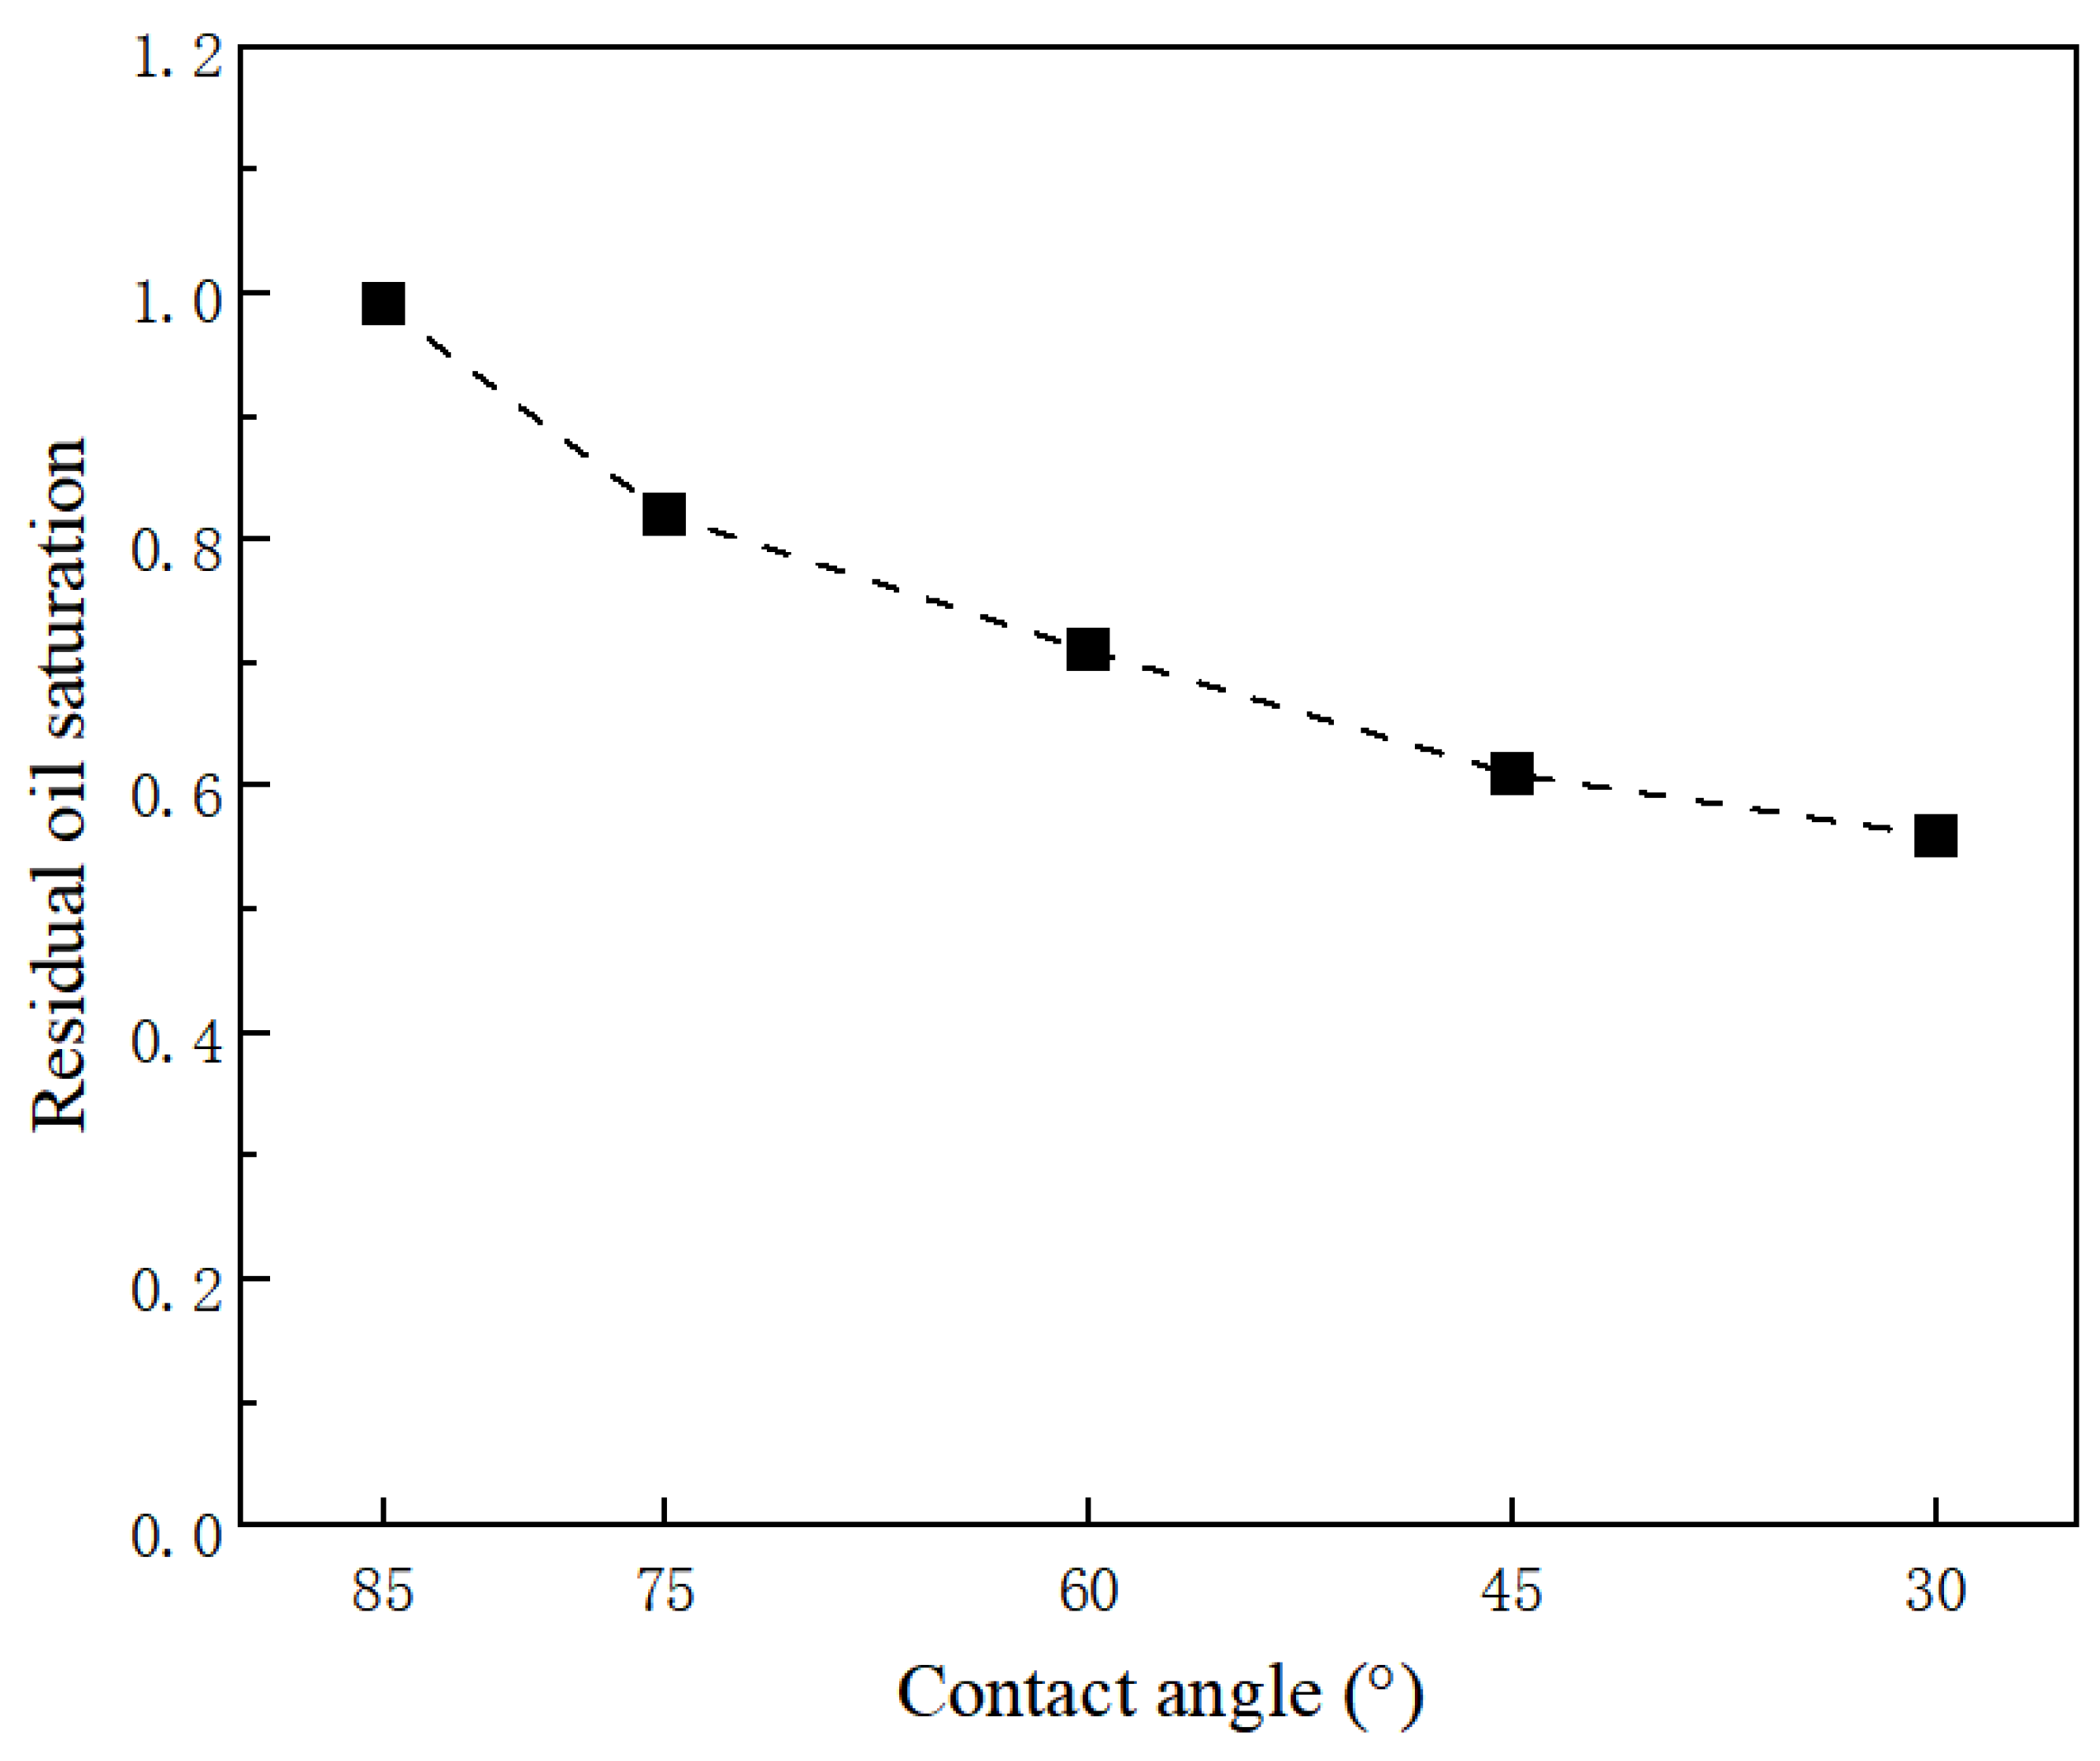
3.3. Wettability Impact on Nanopore Flow

The wettability directly influences the distribution, flow, and interactions of fluids in nanoscale pores, thereby affecting flow performance and the recovery efficiency of oil and gas. In investigating the imbibition process in single nanoscale pores, the wettability plays a crucial role. By altering the contact angle, the imbibition behavior of shale oil and fracturing fluid under different wetting conditions can be studied. Curves depicting displacement efficiency over time under various conditions can be plotted to delve deeper into the impact of wettability on two-phase flow. The model is initially set with a pore diameter of 15 nm, inlet pressure under static conditions, and water-wet pore walls (Figure 12).
The displacement efficiency varies significantly over time under different wettability conditions (Figure 13 and Figure 14). Smaller contact angles correspond to shorter imbibition displacement reaction times. Under the water-wet conditions, smaller contact angles in nanoscale pores result in greater pressure gradients and differentials between oil and water phases, facilitating easier water entry into the nanoscale pores and promoting fluid flow and slip along the pore walls. However, increasing the static contact angle prolongs the imbibition time for oil recovery. At 20 s, the displacement efficiency is 55% when the contact angle is 30°, whereas it decreases to 23% when the contact angle is 60°, representing a 32% reduction in displacement efficiency. Therefore, reducing wettability under the water-wet conditions enhances the flow rate of crude oil, demonstrating a linear decrease trend in displacement efficiency.

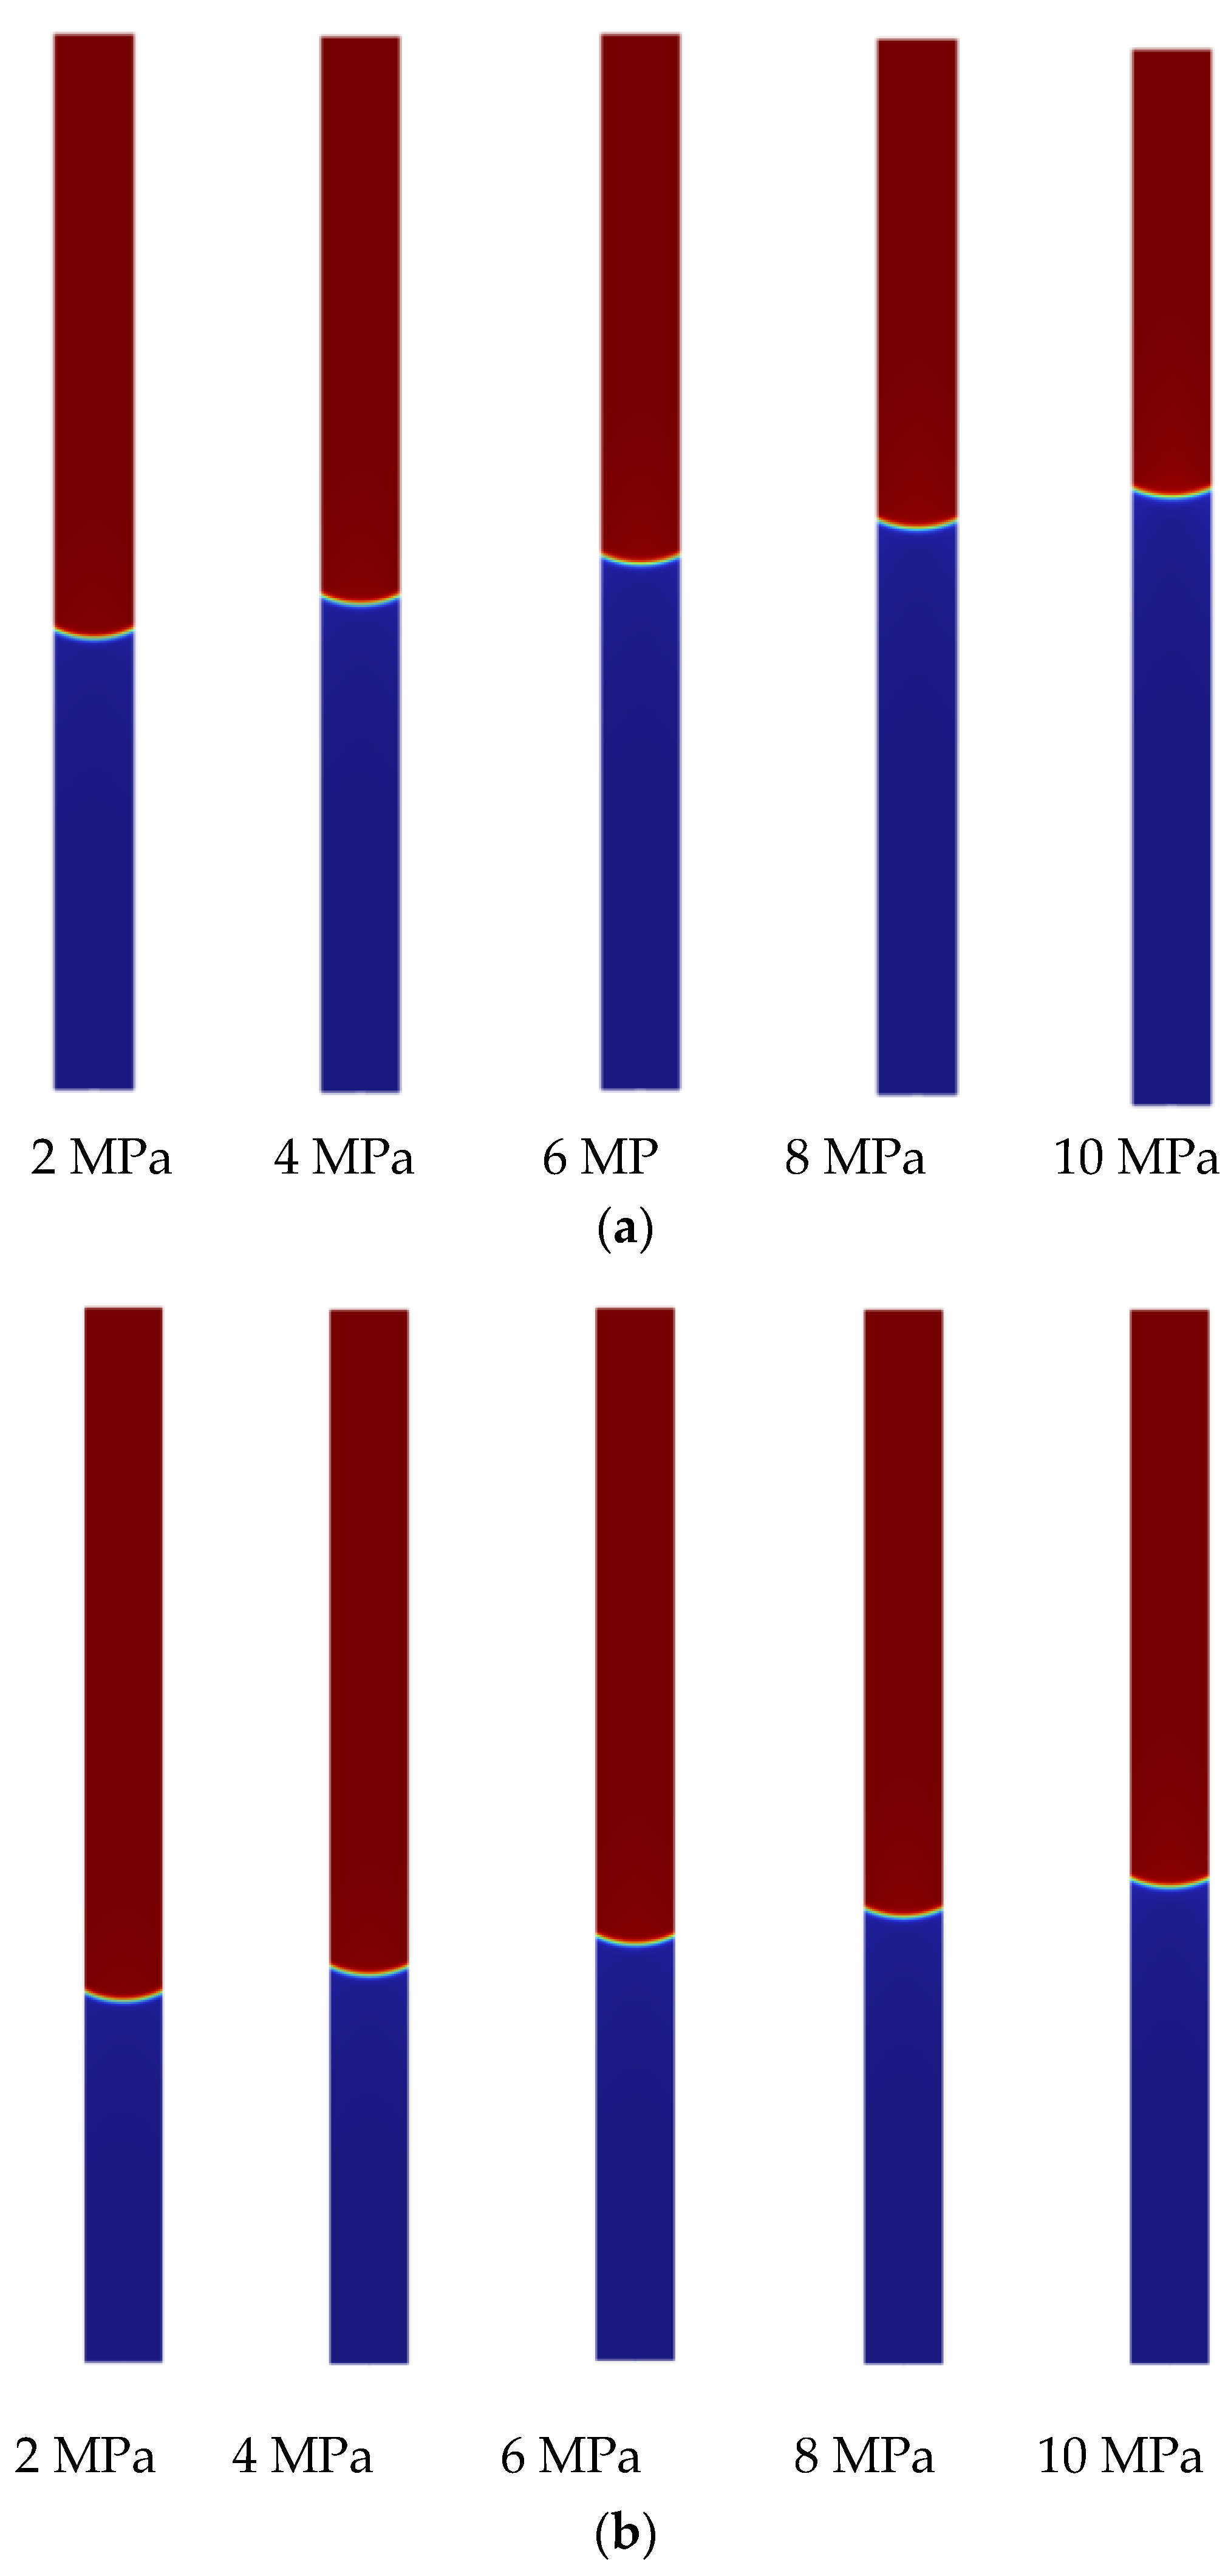
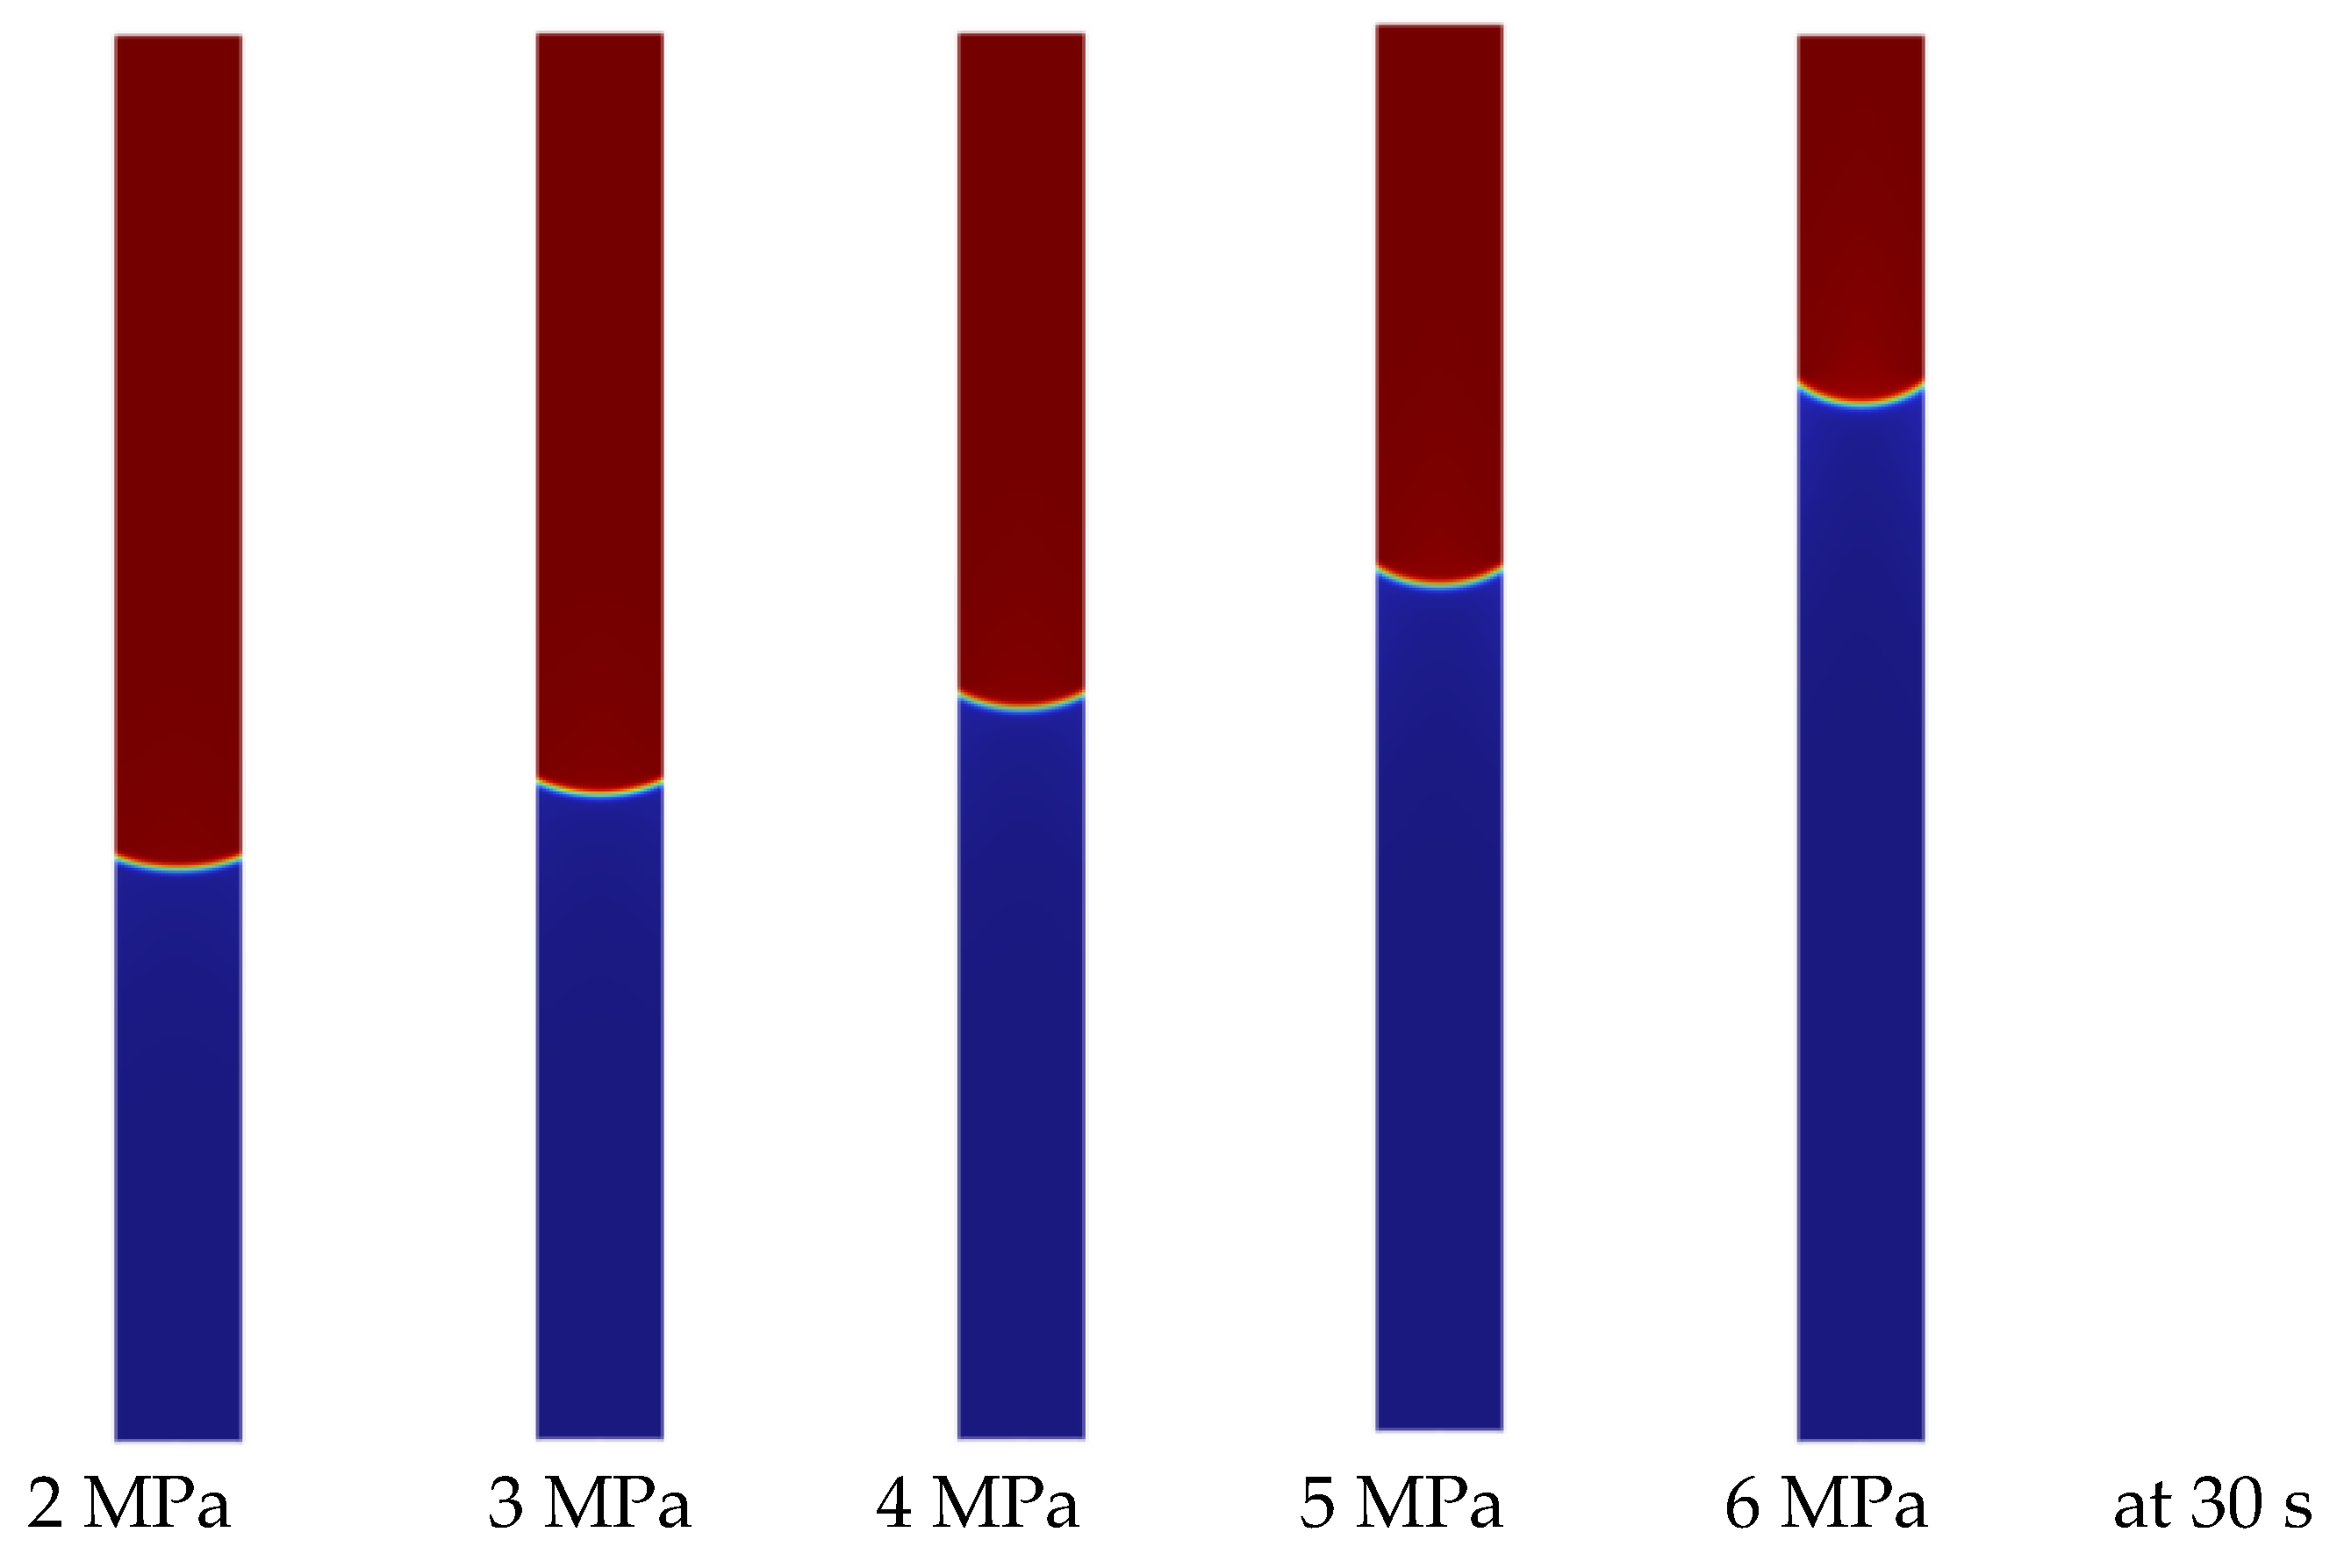
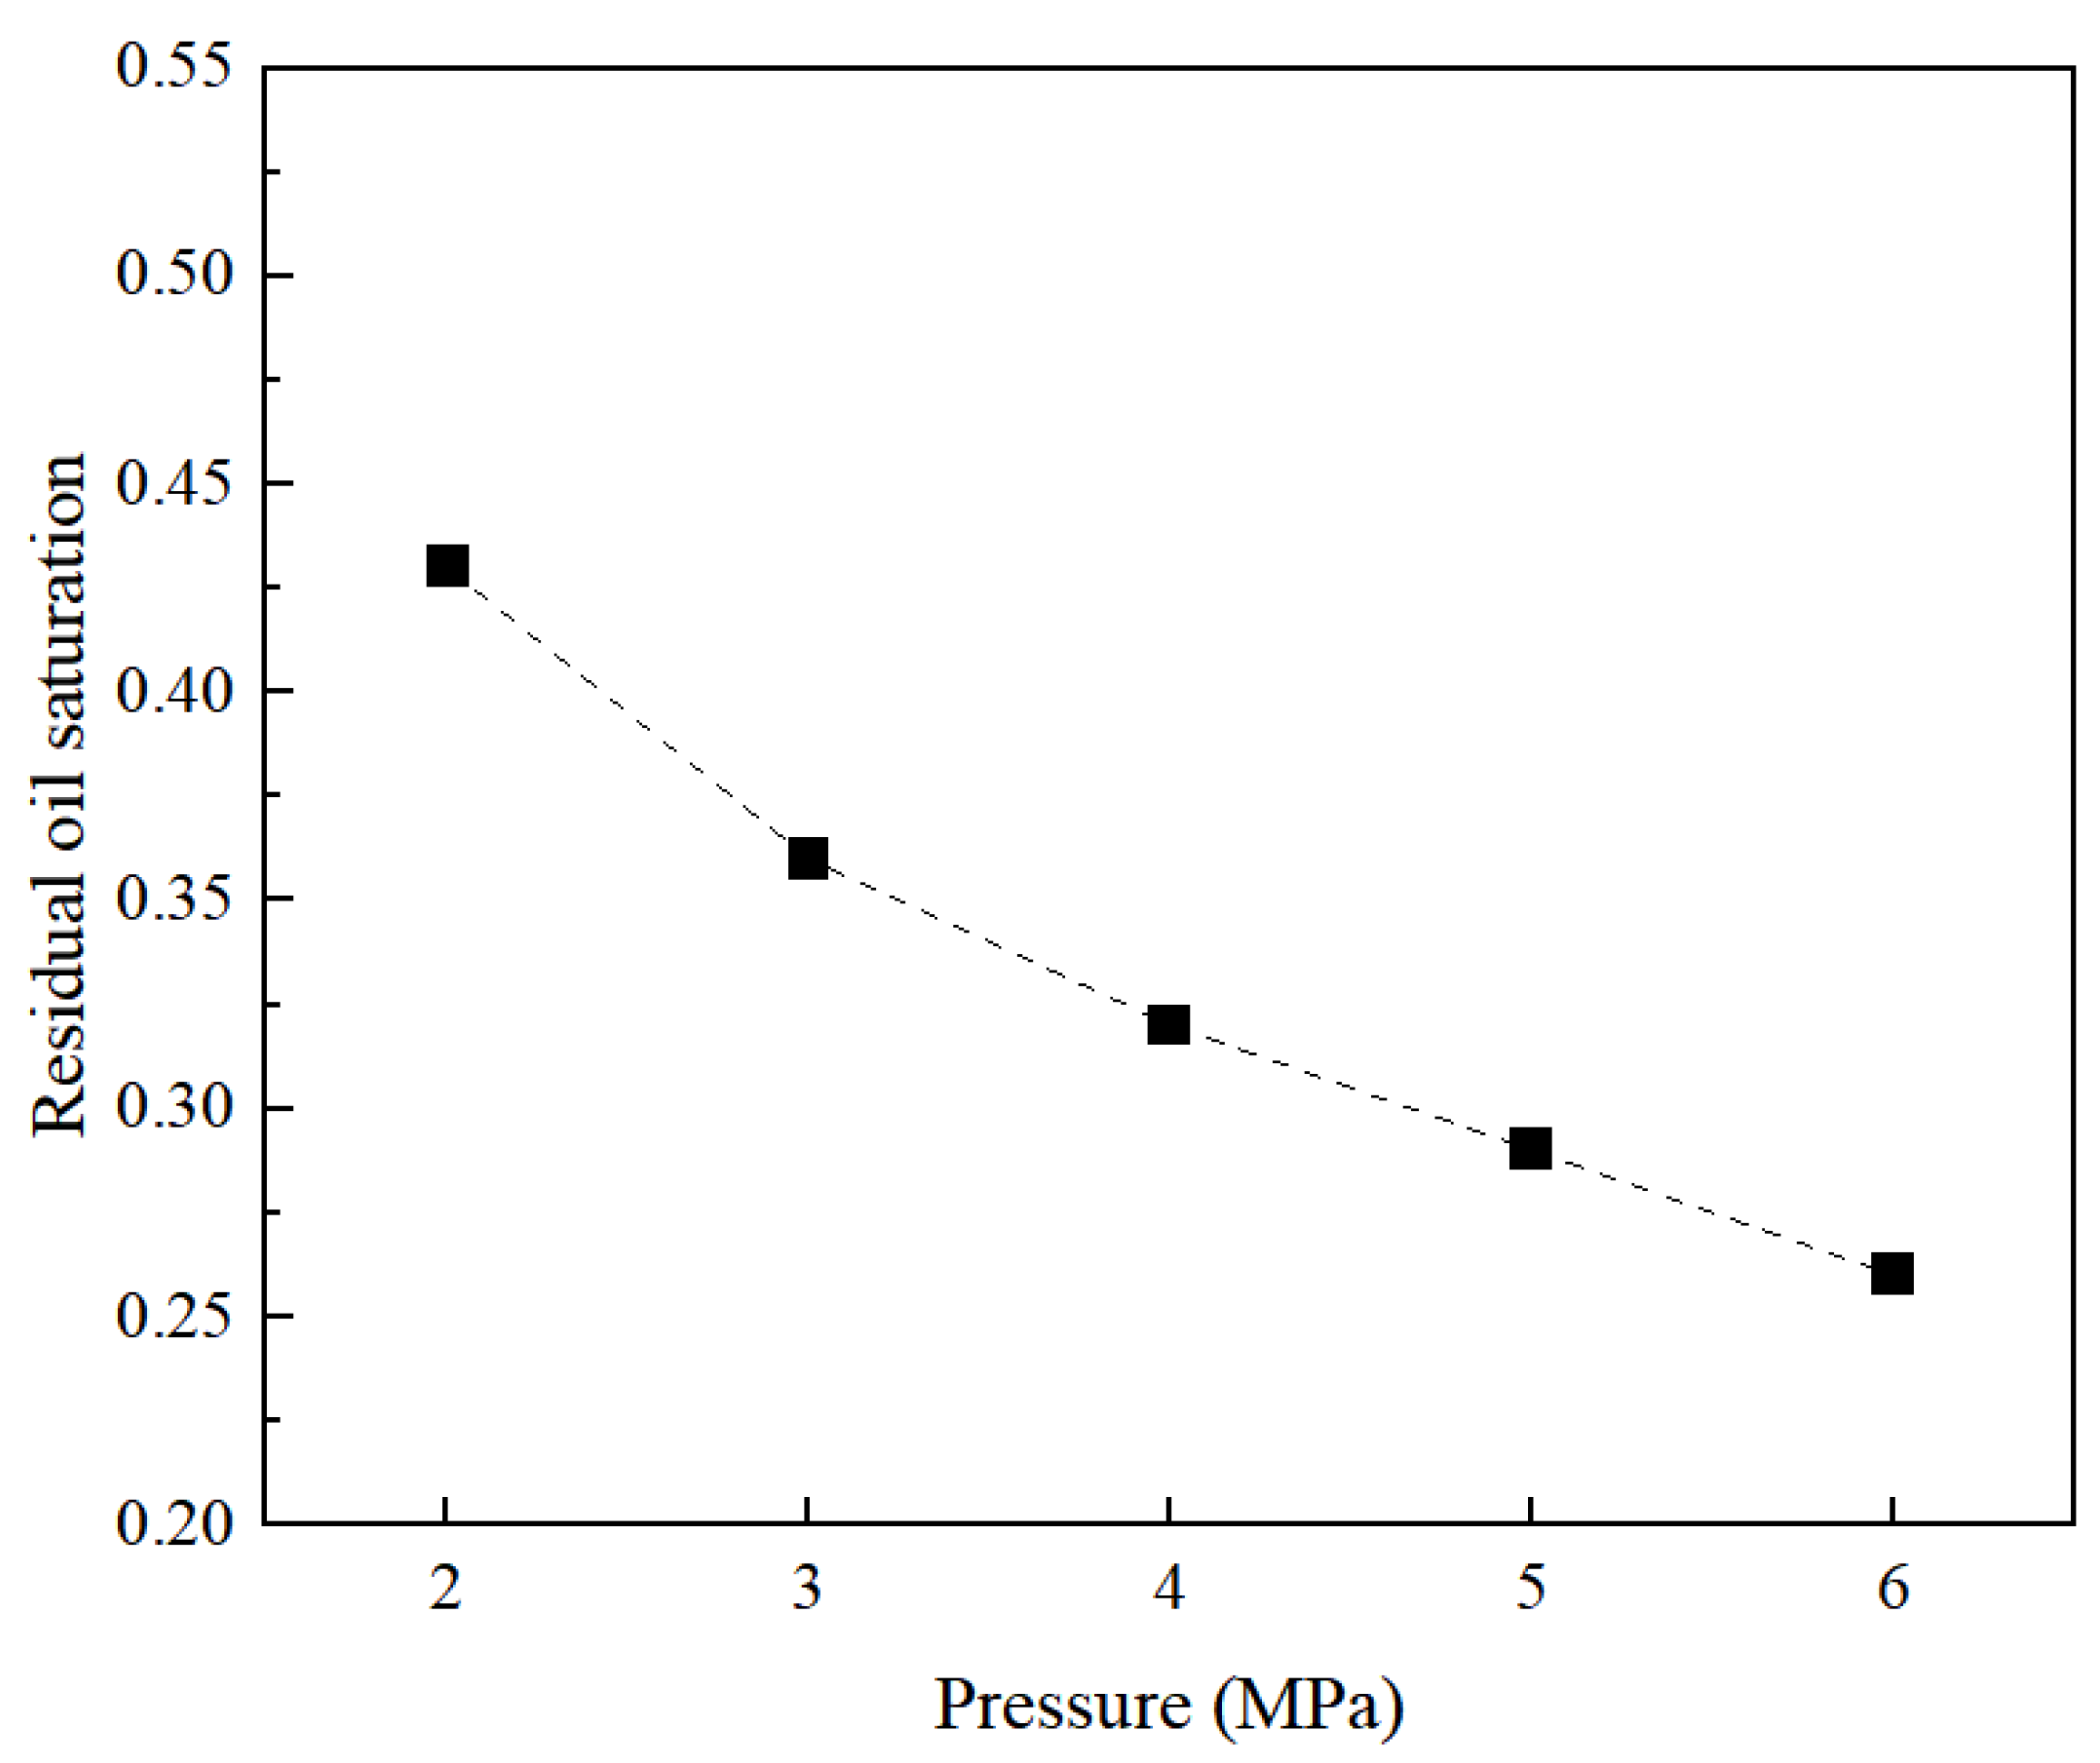
3.4. Pressure Impact on Nanopore Flow

In the flow of single nanoscale pores, pressure inevitably affects two-phase flow. It directly influences the physical properties of fluids, interactions between phases, and flow patterns. We studied a single nanoscale pore with a diameter of 15 nm and a contact angle of 60°. We then investigated the impact of different inlet pressure conditions (2 MPa, 4 MPa, 6 MPa, 8 MPa, and 10 MPa) on the flow patterns of two phases (Figure 15).
In the flow of single nanoscale pores under pressure, higher pressures lead to increased displacement efficiency of crude oil, showing a proportional relationship with pressure increase and a consistent trend (Figure 16). As pressure increases, the residual volume of crude oil decreases, demonstrating an exponential relationship with the displacement efficiency (Figure 17). When pressure increases from 2 MPa to 10 MPa, the displacement efficiency decreases from 66% to 55%, a reduction of 11%. Pressure variations affect the interfacial tension between phases within the pore, thereby altering capillary pressures. Increased pressure enhances both capillary forces influenced by pressure and gravitational effects. Therefore, the influence of pressure on flow in single nanoscale pores is relatively more significant compared to other factors.

4. Multi-Factor Nanopore Flow Analysis

4.1. Pore Size and Contact Angle Synergy

In shale oil reservoirs, the widespread distribution of nanopores endows capillary forces with a vital role. The contact angle within these nanopores is not static. It undergoes dynamic adjustments in response to subtle changes in pore structure and precise control of pressure. Taking into account the interplay of these factors, the research has unveiled a precise quantitative relationship between the contact angle and the pore radius at the nanoscale, which is quantitatively described by the following equation:
θ = θ i + 13.115 ln r r i
where θ is the contact angle at a constant pore radius; r i is the initial pore radius, taken as 15 nm, and θ i is the initial contact angle, taken as 45° under initial conditions.
According to the quantitative relationship, an increase in pore size leads to an enlargement of the contact angle in single nanopores (Figure 18). The model results indicate that as the pore radius increases, the rise in contact angle results in a reduction in the residual oil volume, which exhibits a logarithmic relationship (Figure 19). In the nanoscale pore environment, a smaller pore size implies a stronger capillary force on the fluid, and a smaller contact angle means that the two-phase fluid is more likely to flow under the influence of capillary forces. When the ratio of the pore radius to the initial pore radius increases from 2 to 6, the residual oil volume decreases from 57% to 31%, and the flow efficiency is reduced by 26%. The synergistic effect of pore size and contact angle determines the phase distribution of fluids within nanopores. In an oil–water two-phase systems, different pore sizes and surface wettability conditions lead to variations in the distribution of water and oil phases within the pores. Smaller pore sizes and hydrophilic surfaces favor the distribution of the water phase in the pores, while larger pore sizes and hydrophobic surfaces may cause the oil phase to preferentially occupy the pores.

4.2. Pressure and Contact Angle Synergy

The interaction between pressure and contact angle profoundly influences the laws of fluid motion, which is particularly crucial in practical applications such as oil and gas production, energy storage, and filtration technology. As the pore size continuously varies, the interfacial tension between the oil and water also exhibits dynamic characteristics. Through extensive experimental research, it has been found that the wetting angle and interfacial tension change with variations in pressure, enabling the derivation of a mathematical correlation equation between the wetting angle under specific pressure conditions and the initial wetting angle.
θ = θ i p p i τ
where τ represents the wetting modulus, a dimensionless constant typically ranging from 0.2 to 0.3, (here taken as 0.25); θ i is the initial contact angle, taken as 45° under initial conditions; and p i is the initial inlet pressure, taken as 2 MPa.
The pressure and contact angle synergistic flow behavior at 30 s can be shown in Figure 20. Increasing pressure can alter the interaction between fluids and solid surfaces, thereby affecting the contact angle. Under the specific conditions, as pressure increases, the wettability of the fluid on the solid surface may enhance, leading to an increase in the contact angle. It can be seen from Figure 21, when the pressure and contact angle jointly influence flow in single nanometer-sized pores, the residual volume of crude oil shows an exponential relationship with pressure. As the pressure increases, the contact angle within a single nanometer-sized pore also increases, thereby influencing the two-phase flow within the pore. When the pressure increases from 2 MPa to 6 MPa, the flow efficiency decreases by 21%. Considering the synergistic effect of the pressure and contact angle, this may lead to a transition in the two-phase flow patterns. Under the high-pressure conditions, the capillary-driven water flooding process in single nanometer-sized pores may transition to pressure-driven flow. Hence, the two-phase flow in single nanometer-sized pores exhibits complex exponential relationship variations under the high-pressure conditions.

4.3. Pressure, Pore Size, and Contact Angle Synergy

The contact angle and interfacial tension are influenced by pore diameter and pore pressure, where changes in the pore diameter are a result of variations in the pore pressure. The interactions between phases within nanoscale pores are typically complex, necessitating consideration of how pore deformation and pressure changes affect them. To establish a mathematical model of phase interactions in a dynamic pressure field, it is essential to integrate the synergistic effects of pressure and pore diameter(Table 2). The mathematical model for contact angle variation under the synergistic action of pressure and pore diameter can be expressed as follows:
θ = θ i + 13.115 ln 1 1 + ϕ + 1 ϕ υ p e f f E 1 ϕ p p i τ
Pressure, pore diameter, and contact angle simultaneously influence flow in nanoscale pores. As the pressure decreases, the dimensionless contact angle decreases, while interfacial tension increases, leading to an increase in capillary forces (Figure 22). When considering the synergistic effects of pore diameter and pressure variations, the contact angle increases, with the increase in interfacial tension being less significant. Dynamic capillary forces become prominent, thereby restricting crude oil flow (Figure 23). The residual volume of crude oil decreases from 42% to 26%, a reduction of 16%. When considering the combined influence of pressure, pore diameter, and contact angle, the impact of pressure on crude oil flow efficiency is relatively minor compared to considering only two of these factors.

5. Conclusions

Firstly, this study focuses on the imbibition flow laws of single nanopores. Moreover, the imbibition flow in single nanopores is a complex phenomenon occurring at the nanoscale, influenced by the various factors, including pore size, pressure, viscosity ratio, wettability, and the coupled effects of these factors. In the imbibition process, the size of the nanopore is a critical factor in determining the efficiency of imbibition. Specifically, smaller pore sizes can enhance capillary forces, thereby facilitating the adsorption and flow of liquids within the pores, effectively increasing the rate of imbibition. In contrast, larger pore sizes will reduce capillary forces, thereby decreasing the rate of imbibition. The intentional conclusions are as follows:
1. Pressure is a significant factor affecting the flow of liquid in pores, influencing not only the velocity of liquid flow but also altering the interactive forces within the pores. Higher pressure levels can enhance capillary forces, propelling the liquid towards the central region of the pores, thereby facilitating the imbibition process. Conversely, lower pressure levels weaken capillary forces, restricting the movement of the liquid and leading to a decrease in the rate of imbibition.
2. The viscosity ratio also significantly impacts the imbibition flow in single nanopores. A lower viscosity ratio implies that the fluid flows more smoothly through the pores, leading to higher imbibition rates. Conversely, a higher viscosity ratio can impede fluid flow, thereby reducing the imbibition rate. Changes in the viscosity ratio between oil and water phases directly affect the relative permeability. When the viscosity of the oil phase is significantly higher than that of the water phase, the flow of oil in nanopores is restricted.
3. Wettability is another critical factor influencing the interaction between liquids and pore walls. When the pore walls exhibit hydrophilicity, liquids are more readily adsorbed onto the pore walls and more easily propelled into the pores, which facilitates the imbibition reaction. Conversely, if the pore walls exhibit hydrophobicity, the adsorption and imbibition rates of the liquid will decrease, leading to a reduction in imbibition efficiency. This illustrates the significant role that wettability plays in controlling the dynamic behavior of liquids within the pores.

Author Contributions

Conceptualization, X.D. and M.Q.; methodology, X.D.; software, M.Q.; validation, X.D., M.Q. and X.Z.; formal analysis, A.W.; investigation, Z.L.; resources, X.D.; data curation, M.Q.; writing—original draft preparation, X.D., X.Z., E.G. and Y.C.; writing—review and editing, X.D. and X.Z.; funding acquisition, X.D. All authors have read and agreed to the published version of the manuscript.

Funding

This work is supported by the Natural Science Foundation of Jiangsu Province (BK20241945) and CNPC-CZU innovation alliance.

Data Availability Statement

The data that support the findings of this study are available from the corresponding author upon reasonable request.

Acknowledgments

This work is supported by the Natural Science Foundation of Jiangsu Province (BK20241945) and CNPC-CZU innovation alliance.

Conflicts of Interest

Authors Zhengdong Lei and Erpeng Guo were employed by the company PetroChina Company Limited. The remaining authors declare that the research was conducted in the absence of any commercial or financial relationships that could be construed as a potential conflict of interest.

References

  1. Zang, X.; Pang, J.; Ma, L.; Zhu, Z. Exploration of the Exploitation Potential of Continental Shale Oil in China. Chem. Ind. Manag. 2024, 5, 77–79. [Google Scholar]
  2. Li, Y.; Zhao, Q.; Lu, Q.; Xue, Z.; Cao, X.; Liu, Z. Evaluation Techniques and Practices for the Development of Continental Shale Oil in China. Pet. Explor. Dev. 2022, 49, 955–964. [Google Scholar] [CrossRef]
  3. Liu, D. Study on the Mechanism of Micro-Imbibition of Fracturing Fluid and “Soaking Well” for Enhanced Production; China University of Petroleum: Beijing, China, 2017; p. 109. [Google Scholar]
  4. Sun, Q.; Wang, W.; Su, Y.; Xun, J.; Guo, X.; Li, G. Characteristics of Microscopic Pore Oil Mobilization during the Imbibition of Fracturing Fluid in Shale Reservoirs. J. Cent. South Univ. (Nat. Sci. Ed.) 2022, 53, 3311–3322. [Google Scholar]
  5. Wang, Q.; Zhao, J.; Hu, Y.; Ren, L.; Zhao, C. Optimization Method for Shut-In Time after Hydraulic Fracturing in Shale Oil Reservoirs. Pet. Explor. Dev. 2022, 49, 586–596. [Google Scholar] [CrossRef]
  6. Wang, X. Optimization of Shut-In Time after Fracturing Based on Imbibition Experiments in Tight Reservoirs; Northeast Petroleum University: Daqing, China, 2022; p. 71. [Google Scholar]
  7. Nagayama, G.; Cheng, P. Effects of interface wettability on microscale flow by molecular dynamics simulation. Int. J. Heat Mass Transf. 2003, 47, 501–513. [Google Scholar] [CrossRef]
  8. Coasne, B.; Jain, S.K.; Gubbins, K.E. Adsorption, structure and dynamics of fluids in ordered and disordered models of porous carbons. Mol. Phys. 2006, 104, 3491–3499. [Google Scholar] [CrossRef]
  9. Chen, X.; Cao, G.; Han, A.; Punyamurtula, V.K.; Liu, L.; Culligan, P.J.; Kim, T.; Qiao, Y. Nanoscale Fluid Transport: Size and Rate Effects. Nano Lett. 2008, 8, 2988–2992. [Google Scholar] [CrossRef] [PubMed]
  10. Kucaba-Pietal, A.; Kordos, A. Water nanovortices formation in 2D open type long nanocavities. Molecular dynamics study. J. Mol. Liq. 2018, 249, 160–168. [Google Scholar] [CrossRef]
  11. Falk, K.; Coasne, B.; Pellenq, R.; Ulm, F.-J.; Bocquet, L. Subcontinuum mass transport of condensed hydrocarbons in nanoporous media. Nat. Commun. 2015, 6, 6949. [Google Scholar] [CrossRef] [PubMed]
  12. Jin, B.; Bi, R.; Nasrabadi, H. Molecular simulation of the pore size distribution effect on phase behavior of methane confined in nanopores. Fluid Phase Equilibria 2017, 452, 94–102. [Google Scholar] [CrossRef]
  13. Liu, B.; Qi, C.; Zhao, X.; Teng, G.; Zhao, L.; Zheng, H.; Zhan, K.; Shi, J. Nanoscale Two-Phase Flow of Methane and Water in Shale Inorganic Matrix. J. Phys. Chem. C 2018, 122, 26671–26679. [Google Scholar] [CrossRef]
  14. Yang, Q.; Jin, B.; Banerjee, D.; Nasrabadi, H. Direct visualization and molecular simulation of dewpoint pressure of a confined fluid in sub-10 nm slit pores. Fuel 2019, 235, 1216–1223. [Google Scholar] [CrossRef]
  15. Fang, T. Molecular Simulation Study of the Microscopic Mechanism of CO₂ Flooding in Tight Reservoirs; China University of Petroleum (East China): Qingdao, China, 2020. [Google Scholar]
  16. Zhang, D.; Tang, H.; Zhang, X.; Ranjith, P.; Perera, M. Molecular simulation of methane adsorption in nanoscale rough slits. J. Nat. Gas Sci. Eng. 2022, 102, 104608. [Google Scholar] [CrossRef]
  17. Chen, J.; Ma, N.; Guo, J.; Zhao, J.; Wei, N. Molecular Simulation of Adsorption and Transport of Shale Gas in Rough Nanopores. J. At. Mol. Phys. 2024, 41, 67–74. [Google Scholar]
  18. Neto, C.; Evans, D.R.; Bonaccurso, E.; Butt, H.-J.; Craig, V.S.J. Boundary slip in Newtonian liquids: A review of experimental studies. Rep. Prog. Phys. 2005, 68, 2859–2897. [Google Scholar] [CrossRef]
Figure 1. Velocity profile of nanopore flow model.
Energies 17 04677 g001
Figure 2. Capillary imbibition flow model.
Energies 17 04677 g002
Figure 3. Slip model at solid wall interface.
Energies 17 04677 g003
Figure 4. Flow diagram with different apertures at 20 s and 25 s. (a) Flow diagram with different apertures at 20 s. (b) Flow diagram with different apertures at 25 s.
Energies 17 04677 g004
Figure 5. Displacement rate curves of different pore sizes.
Energies 17 04677 g005
Figure 6. Pore diameter and residual volume curve.
Energies 17 04677 g006
Figure 7. The relationship between aperture and velocity.
Energies 17 04677 g007
Figure 8. Flow diagram with different oil–water viscosity ratios at 15 s.
Energies 17 04677 g008
Figure 9. Change displacement rate curve of aqueous phase viscosity.
Energies 17 04677 g009
Figure 10. Change in the displacement rate curve of crude oil viscosity.
Energies 17 04677 g010
Figure 11. Relationship between composition change and residual volume of crude oil.
Energies 17 04677 g011
Figure 12. Flow diagram at different wettability pore sizes. (a) Pore size is 15 nm. (b) Pore size is 10 nm.
Energies 17 04677 g012
Figure 13. Displacement rate curves of different wettabilities.
Energies 17 04677 g013
Figure 14. Relation between contact angle and residual volume of crude oil.
Energies 17 04677 g014
Figure 15. Flow diagram at different pressures at 20 and 25 s. (a) Flow diagram at different pressures at 25 s. (b) Flow diagram at different pressures at 20 s.
Energies 17 04677 g015
Figure 16. Displacement rate curves of different pressures.
Energies 17 04677 g016
Figure 17. The relationship of pressure and residual oil saturation.
Energies 17 04677 g017
Figure 18. Aperture and contact angle synergistic flow diagram (the radius ratio is 2, 3, 4, 5, and 6).
Energies 17 04677 g018
Figure 19. Relationship between radius and contact angle synergies and crude oil flow.
Energies 17 04677 g019
Figure 20. Pressure and contact angle synergistic flow at 30 s diagram.
Energies 17 04677 g020
Figure 21. Relationship between pressure and contact angle synergies and crude oil flow.
Energies 17 04677 g021
Figure 22. Multifactor synergistic flow at 30 s diagram.
Energies 17 04677 g022
Figure 23. Crude oil flow relationship under the influence of multiple factors.
Energies 17 04677 g023
Table 1. Composition relationship between crude oil and water.
SchemeViscosity of Water (mPa·s)Oil Viscosity (mPa·s)Oil Viscosity (mPa·s)Water Viscosity (mPa·s)
1110108
285
353
432
521
Table 2. The change of contact angle under the influence of multiple factors.
Inlet Pressure
/MPa
Porosity/%Poisson’s RatioEffective Stress
/MPa
Initial Pressure
/MPa
Young’s Modulus
/MPa
Contact Angle/°
20.10.150.52541°
30.10.150.52548.38°
40.10.150.52553.71°
50.10.150.52557.81°
60.10.150.52561.5°
Disclaimer/Publisher’s Note: The statements, opinions and data contained in all publications are solely those of the individual author(s) and contributor(s) and not of MDPI and/or the editor(s). MDPI and/or the editor(s) disclaim responsibility for any injury to people or property resulting from any ideas, methods, instructions or products referred to in the content.

