

Thermodynamic Comparative Analysis of Cascade Refrigeration System Pairing R744 with R404A, R448A and R449A with Internal Heat Exchanger: Part 2—Exergy Characteristics


Abstract
:1. Introduction
2. Mathematical Model
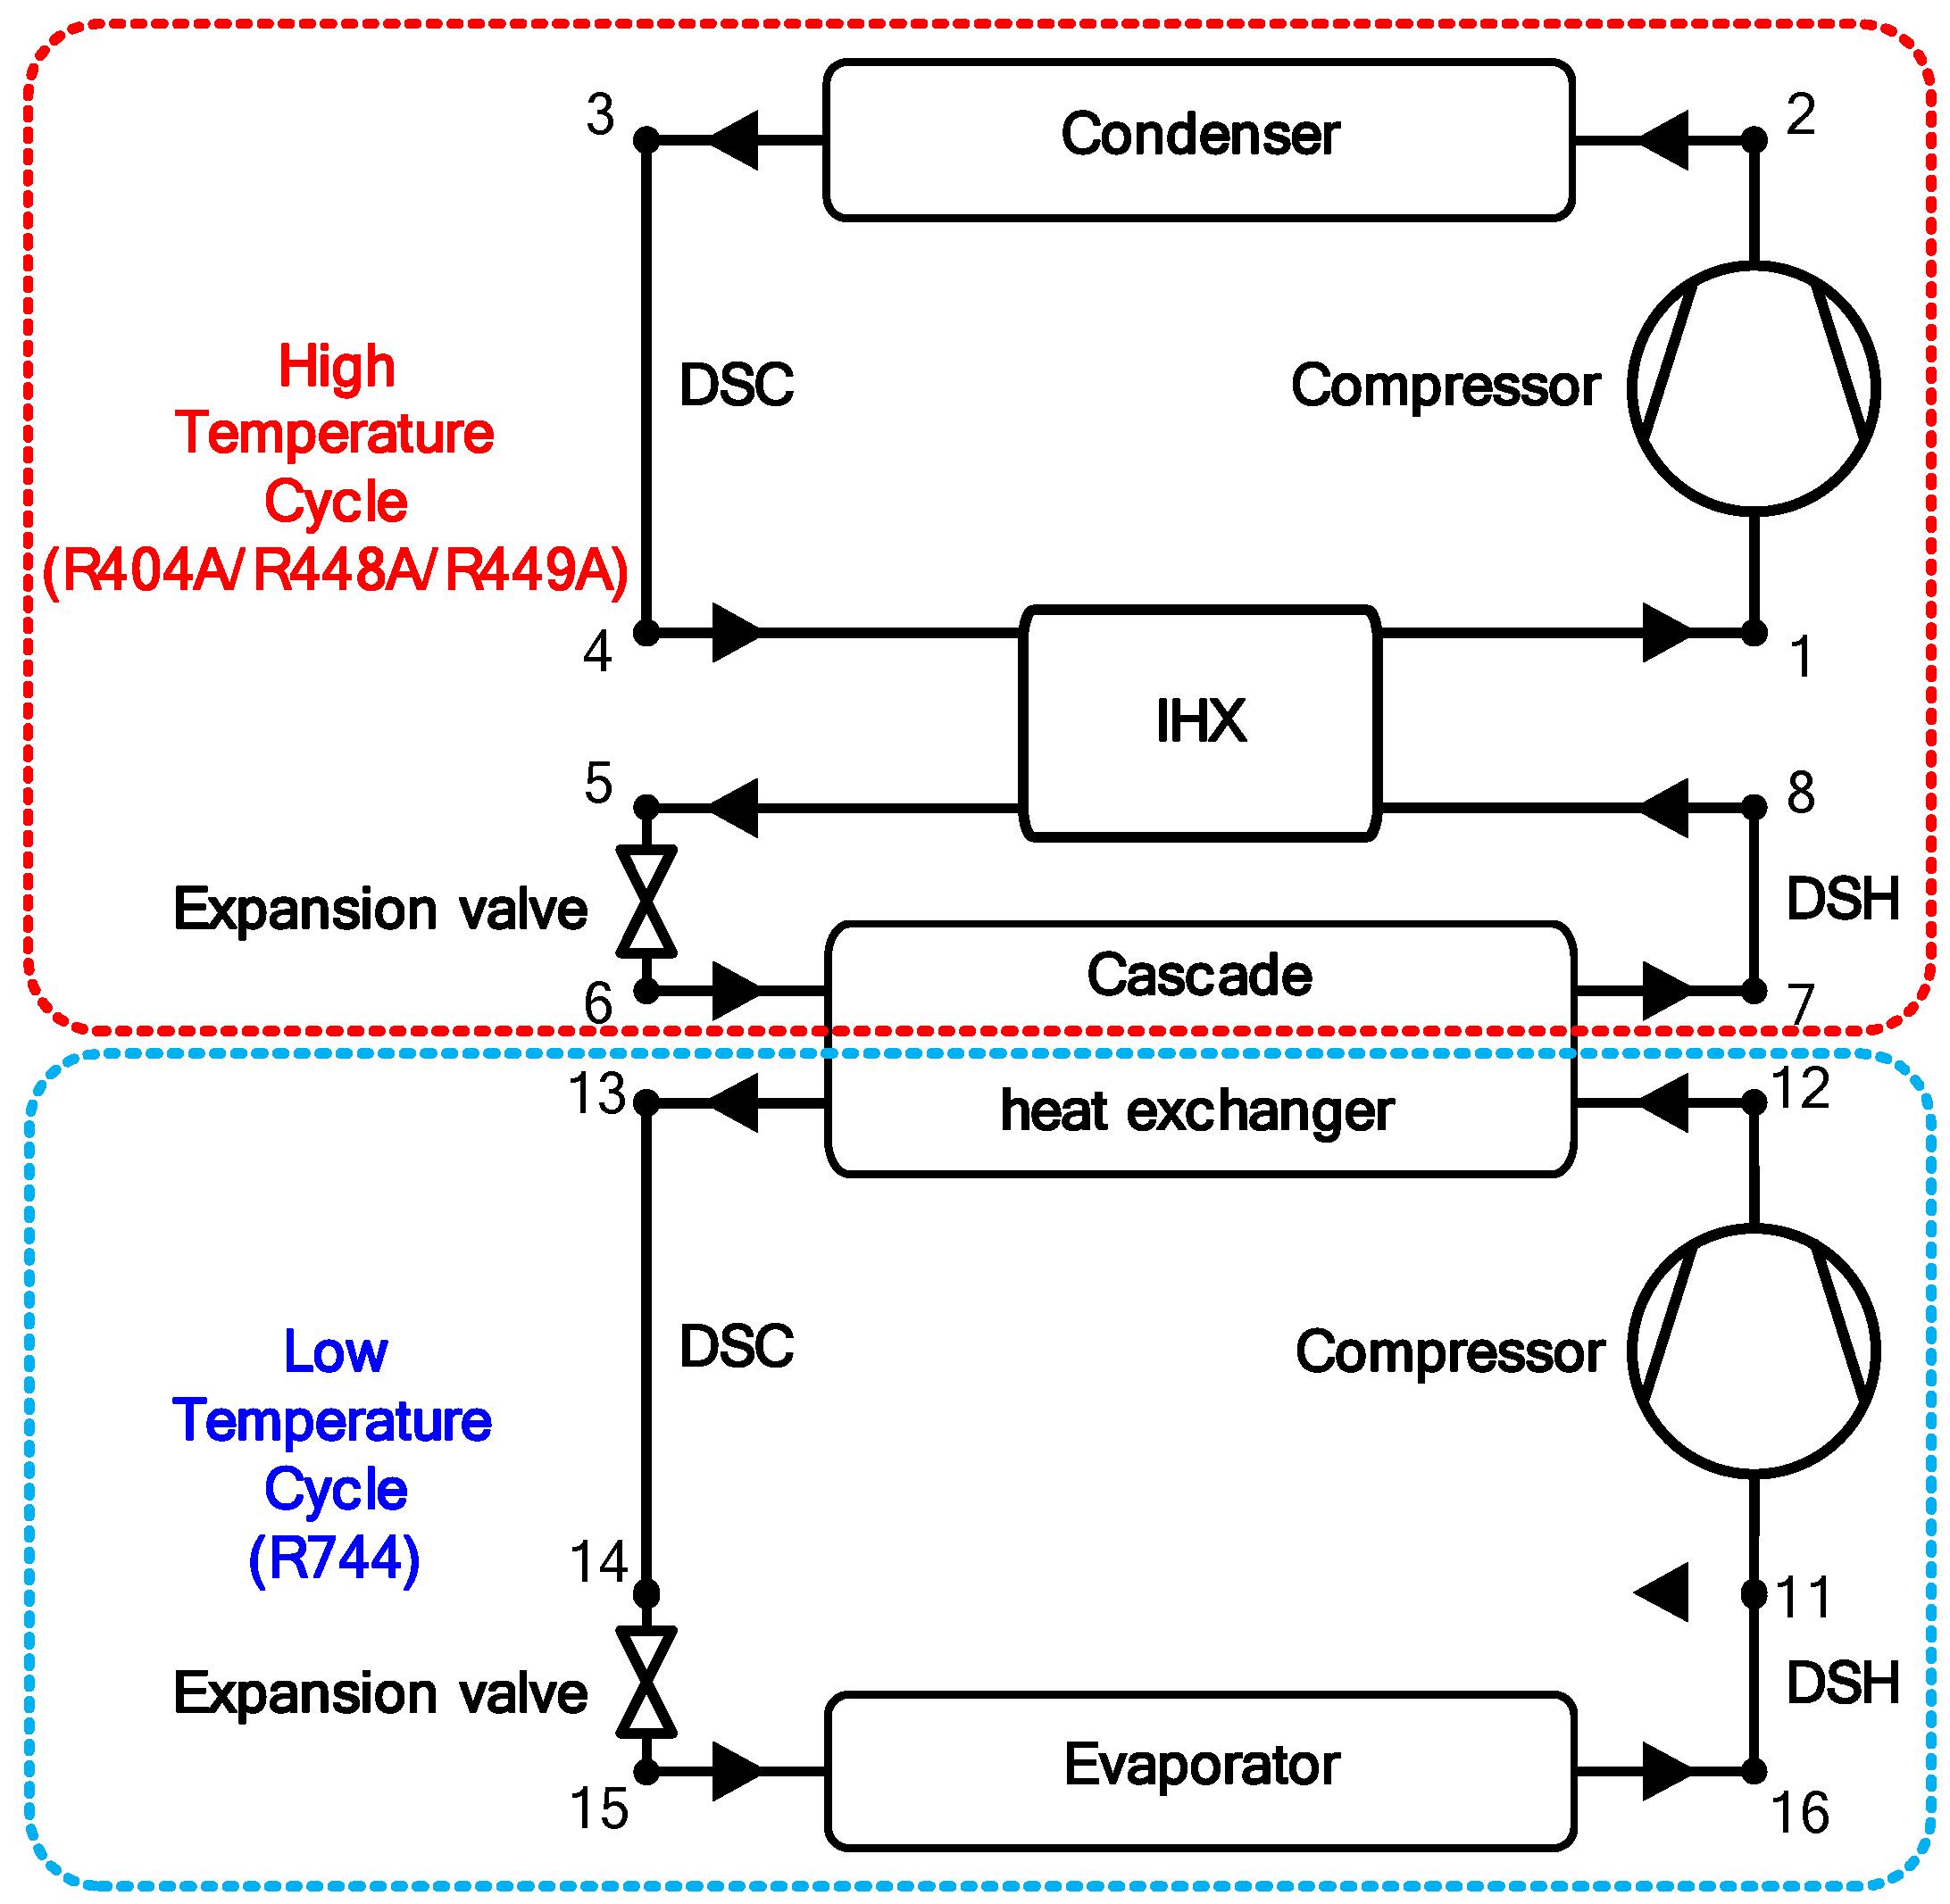
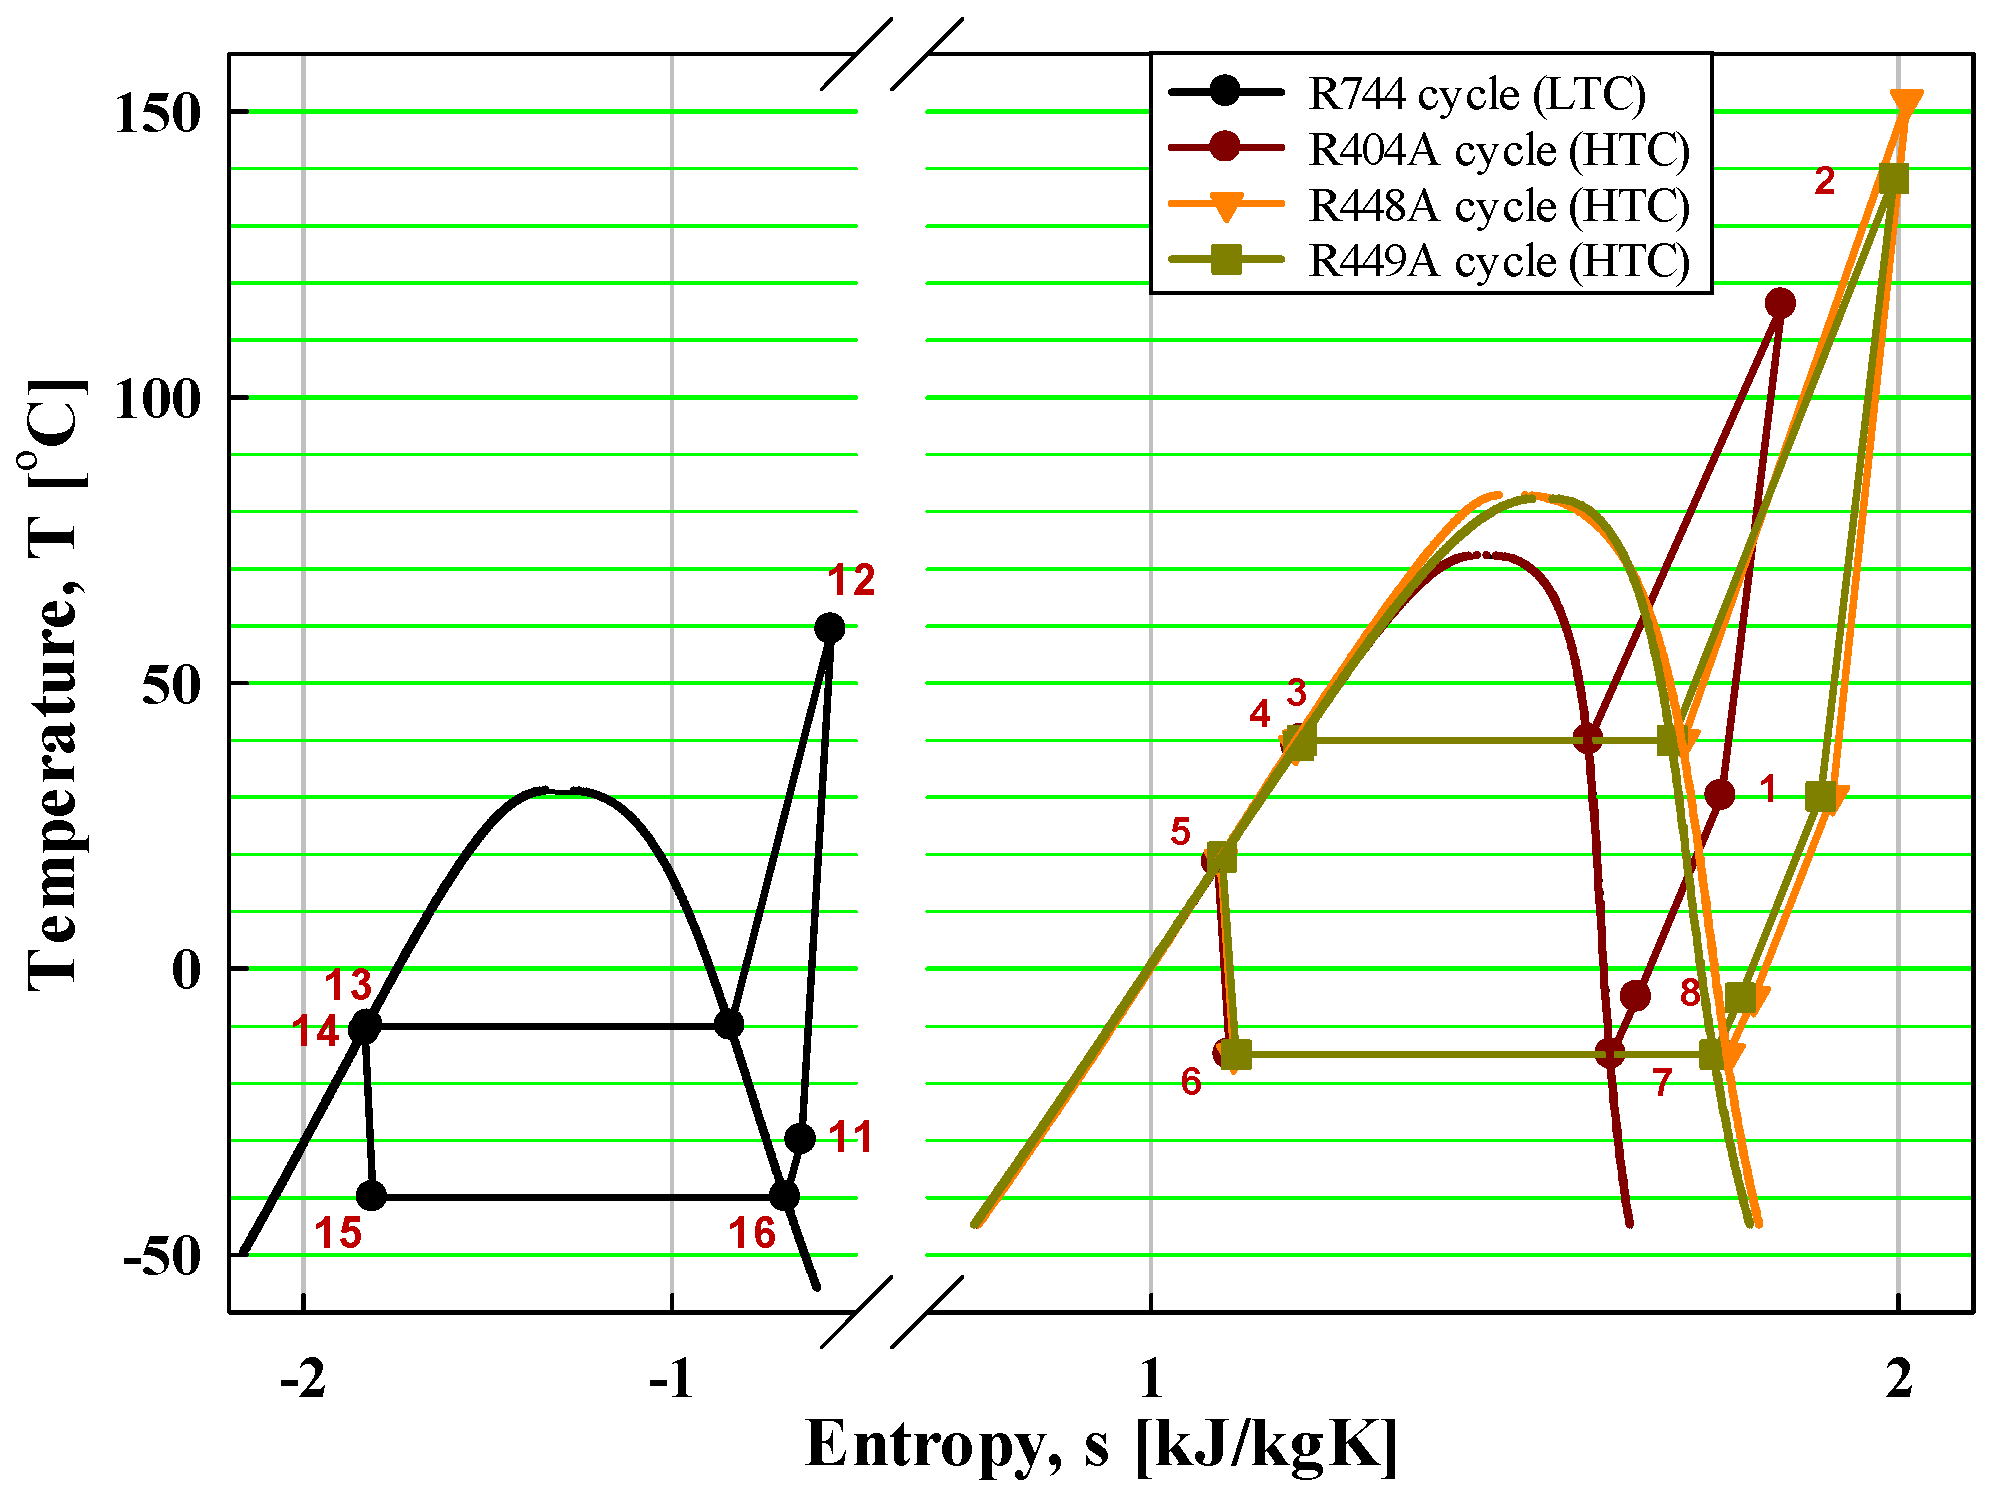
2.1. System Description
2.2. Thermodynamic Analysis
2.2.1. Compressor Modelling and Validation
2.2.2. Performance Analysis of CRS
2.2.3. Analysis Conditions
3. Analysis Results and Discussion
3.1. Effect of DSC and DSH
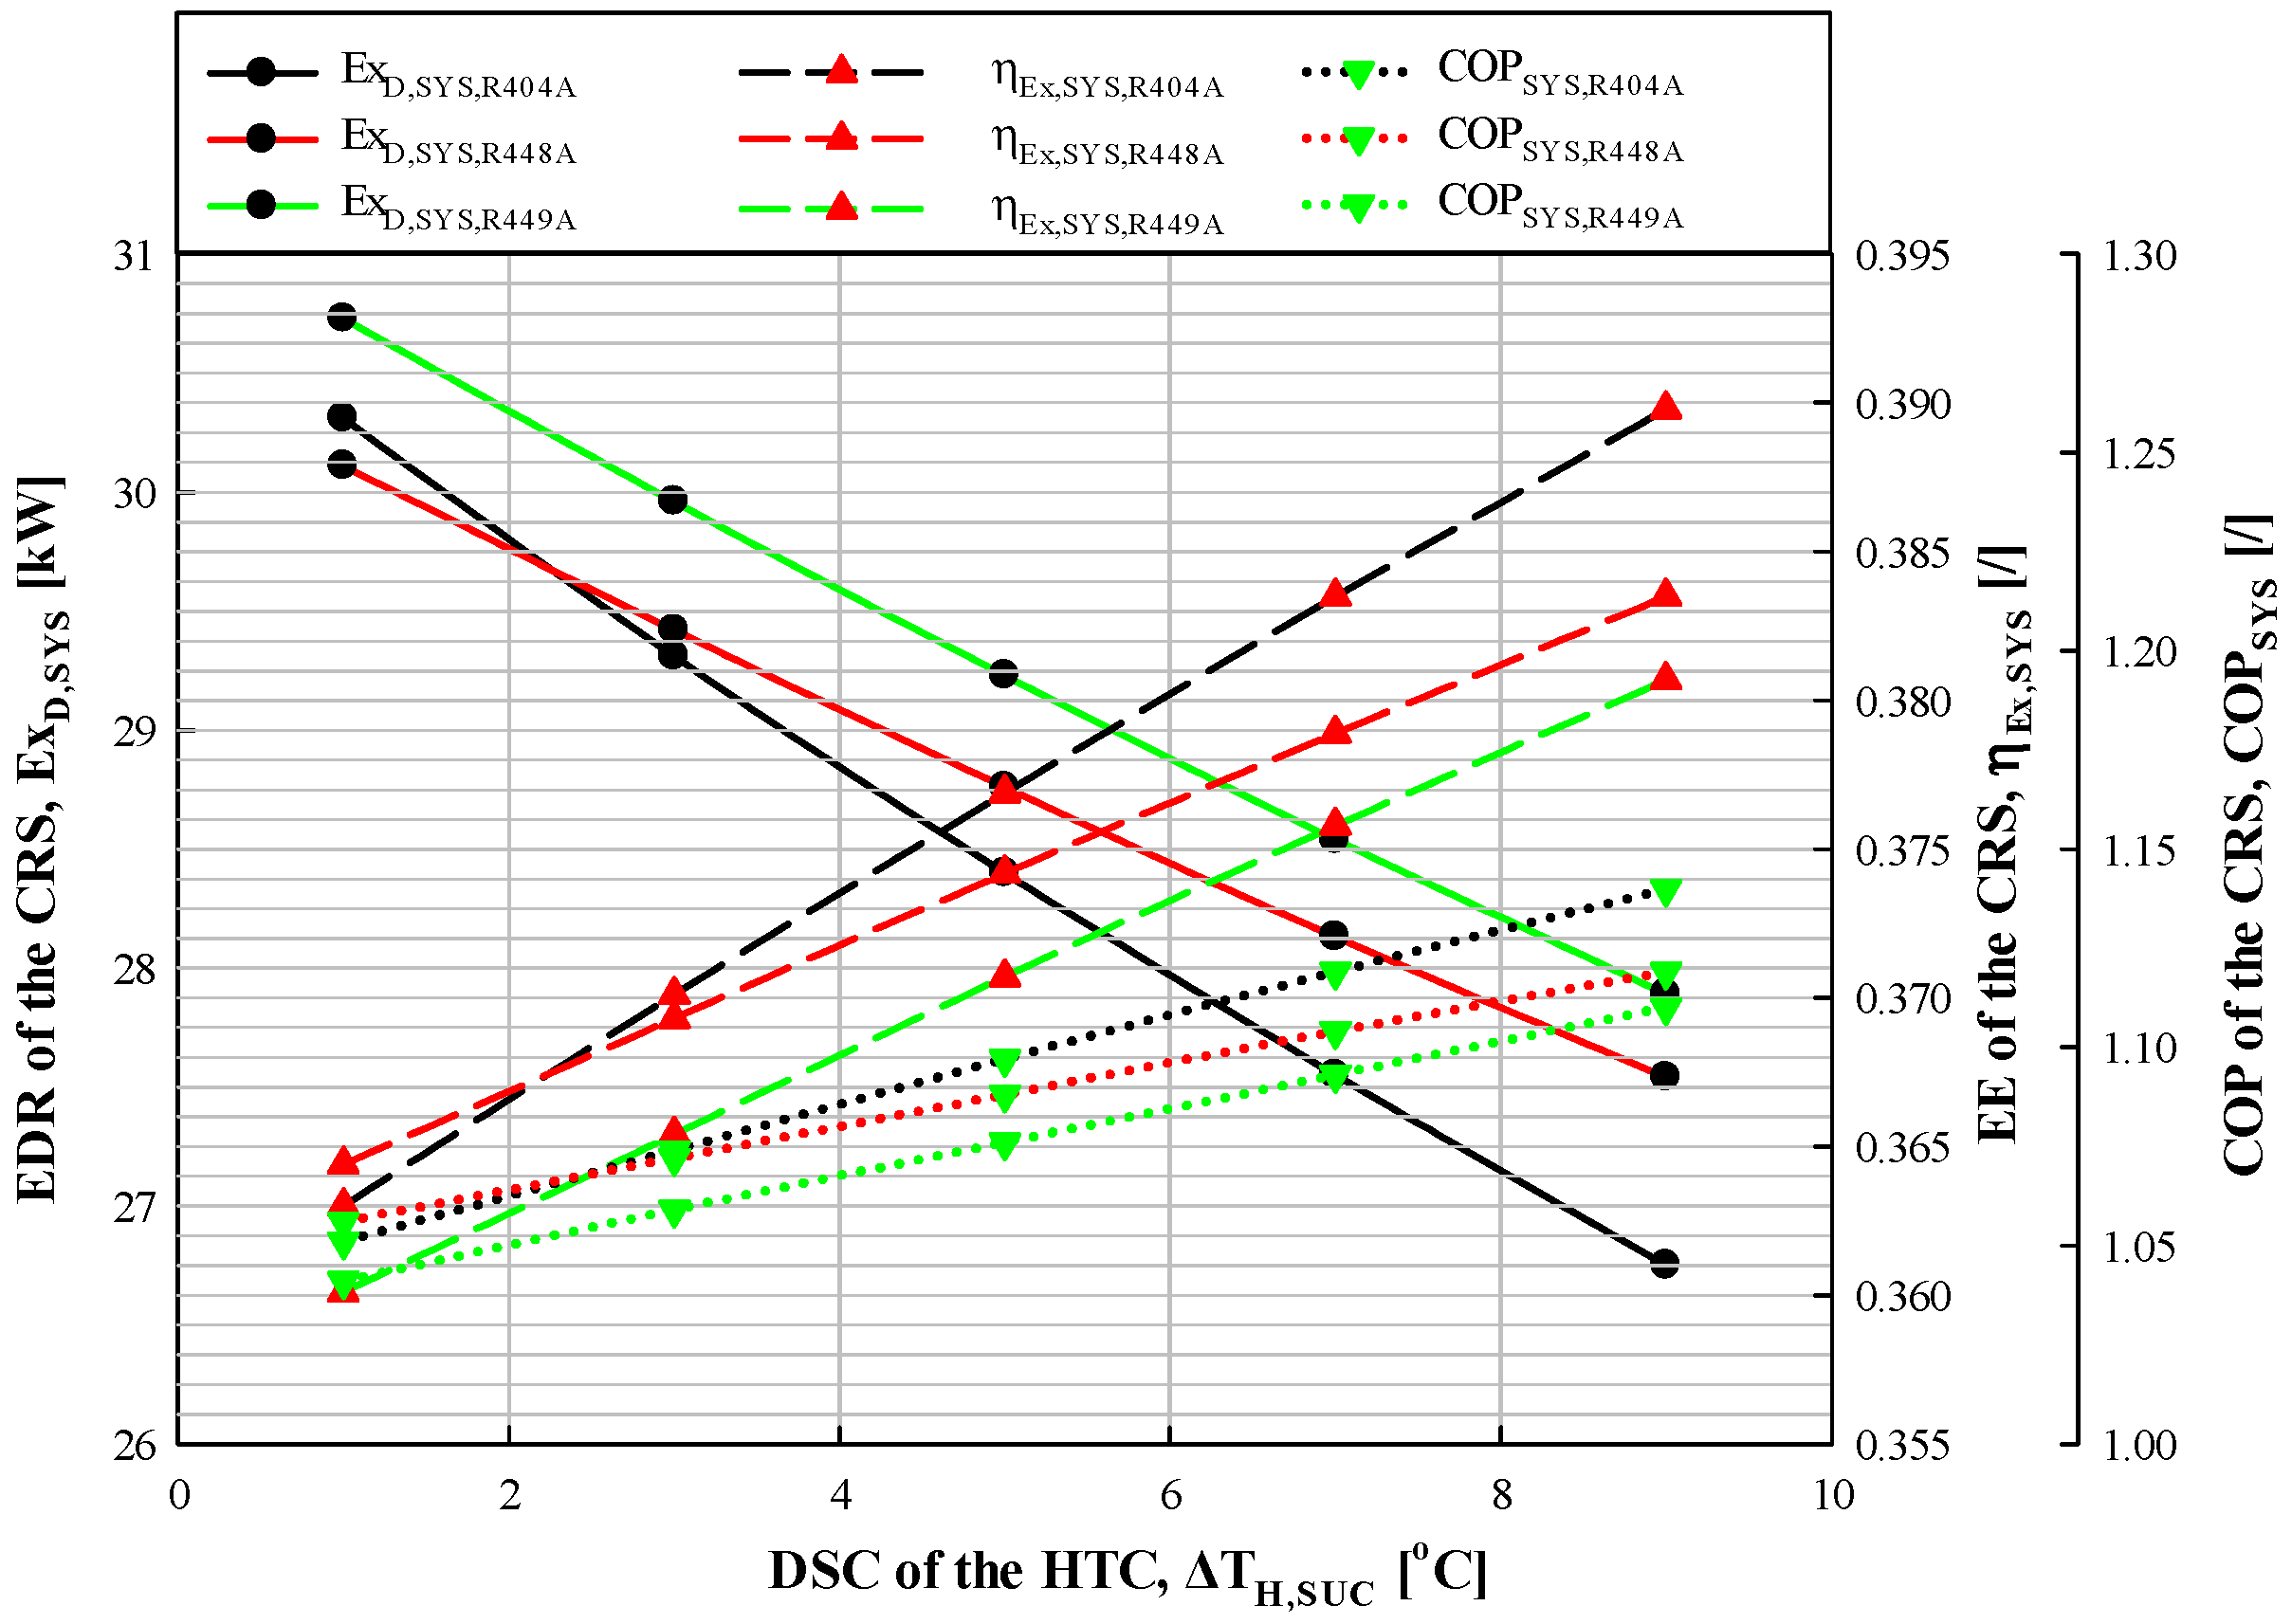
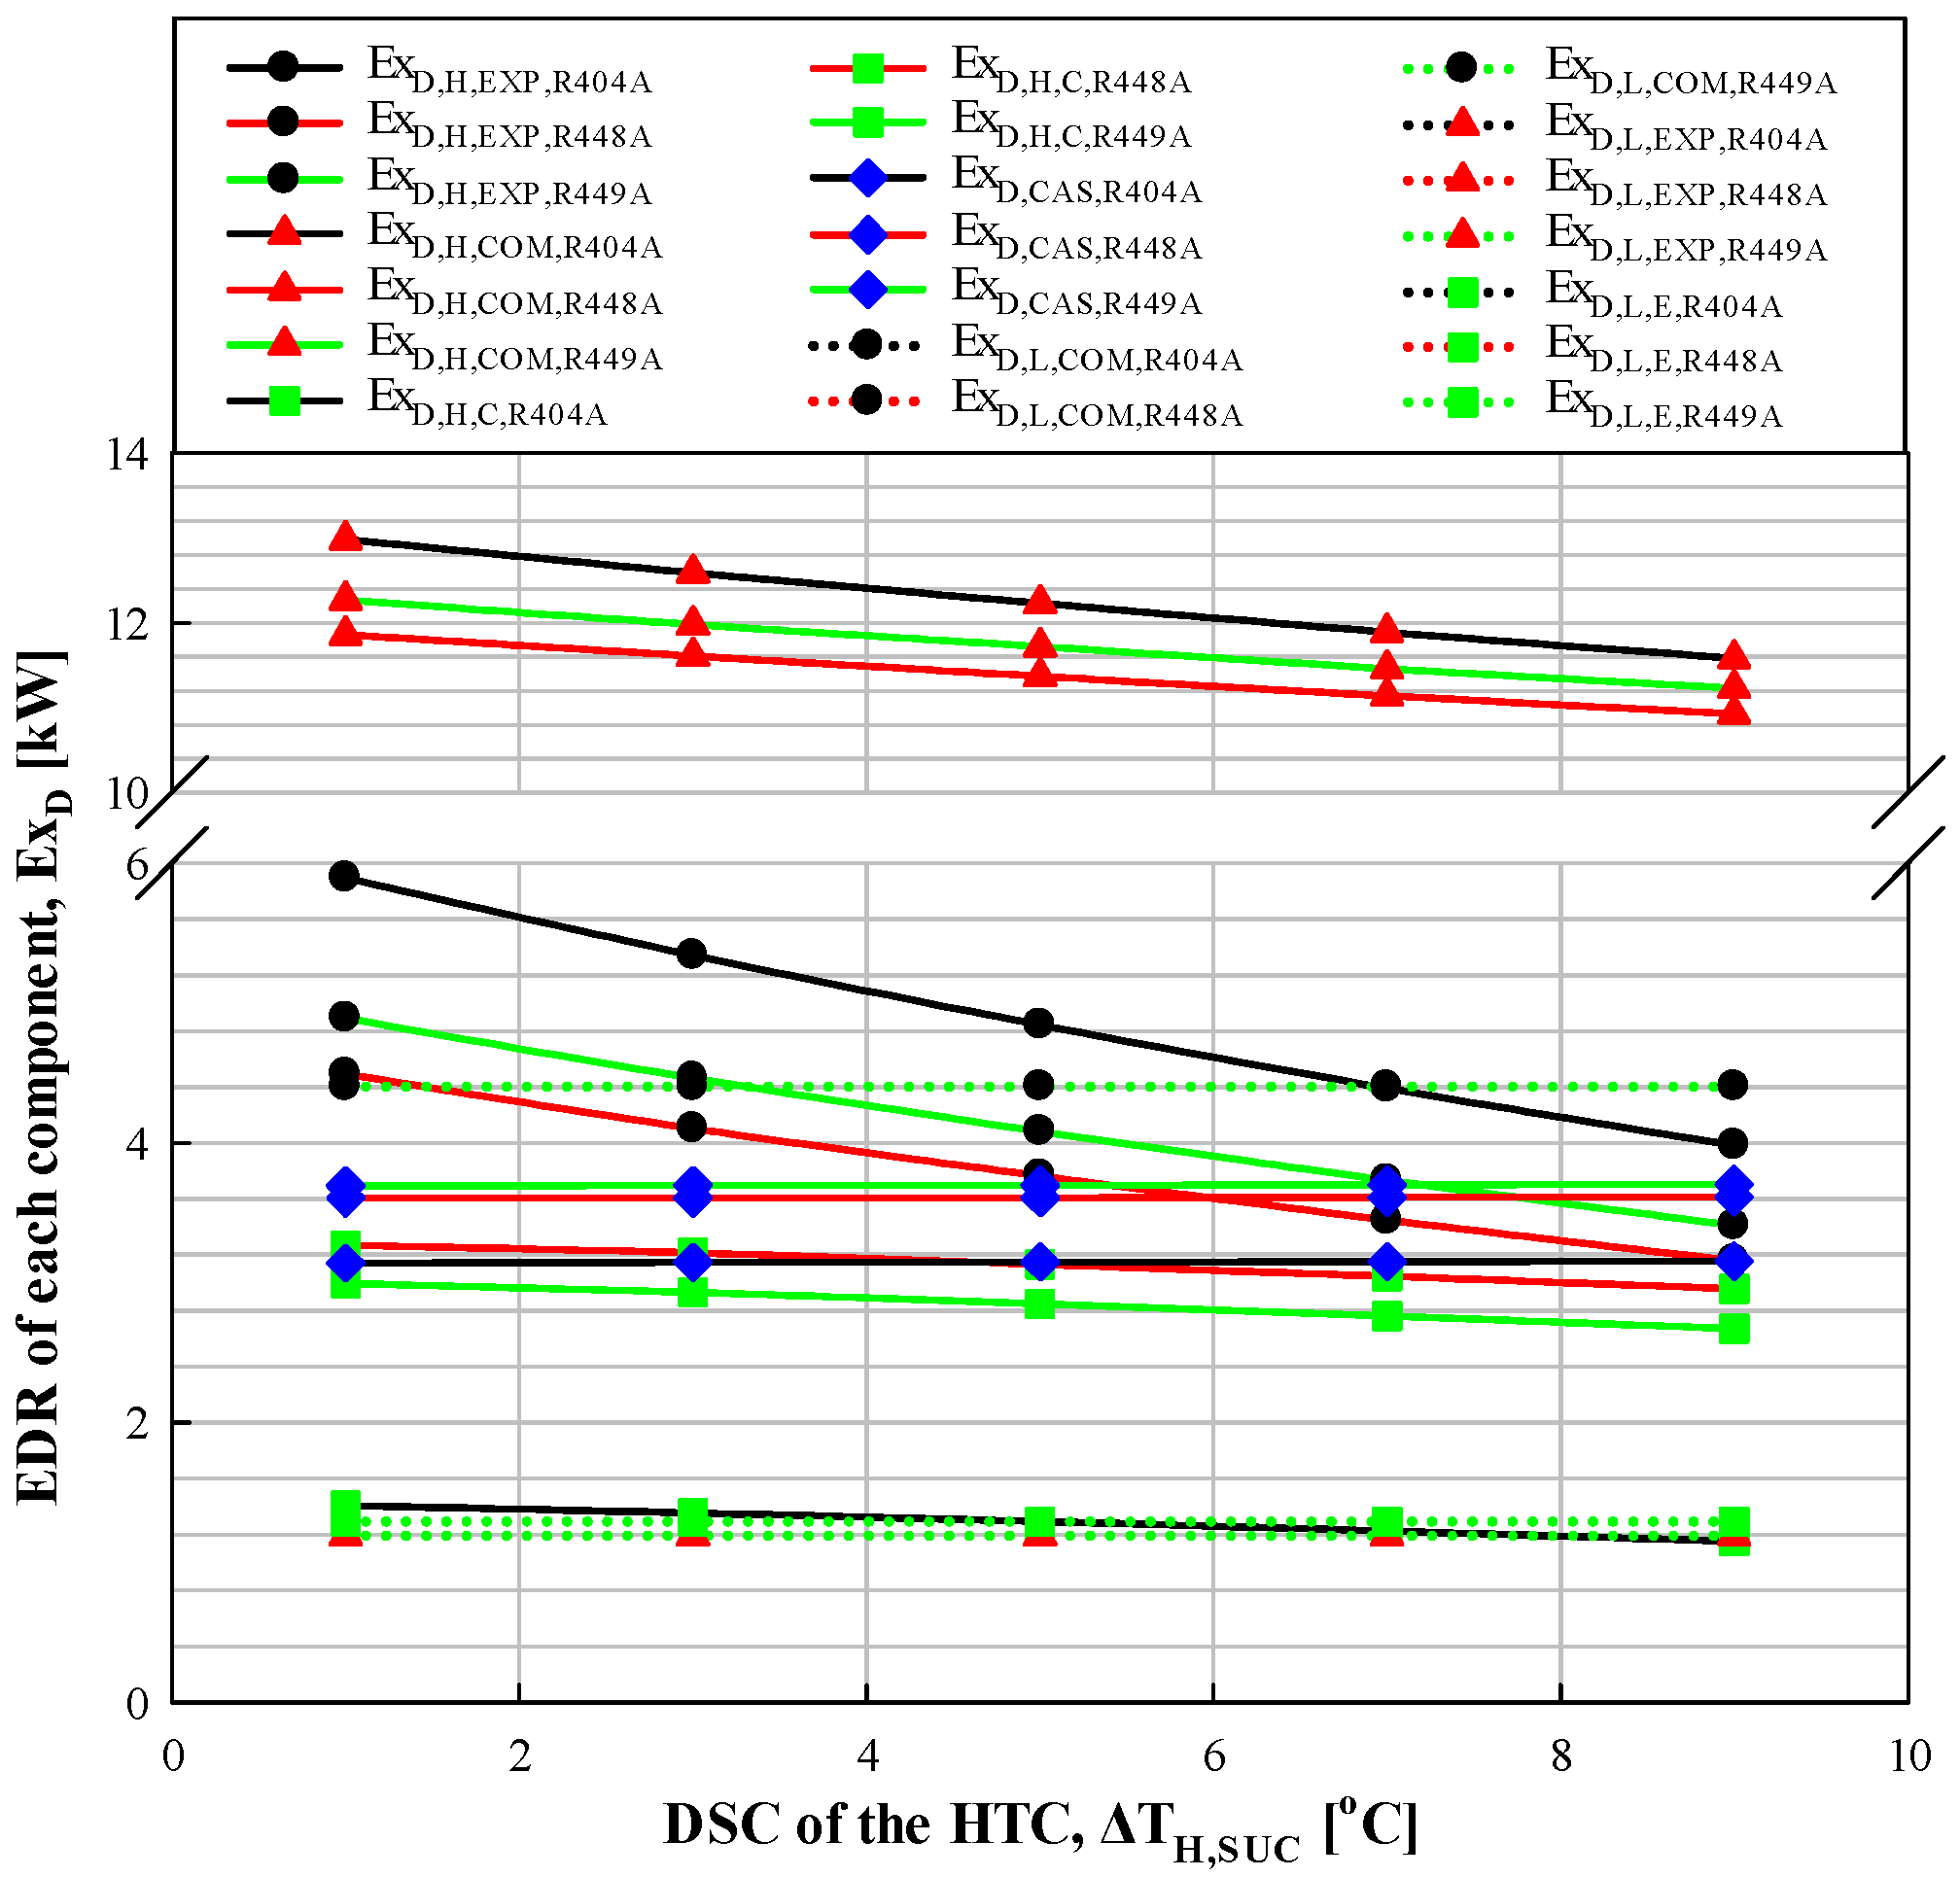
3.1.1. Effect of DSC in the HTC
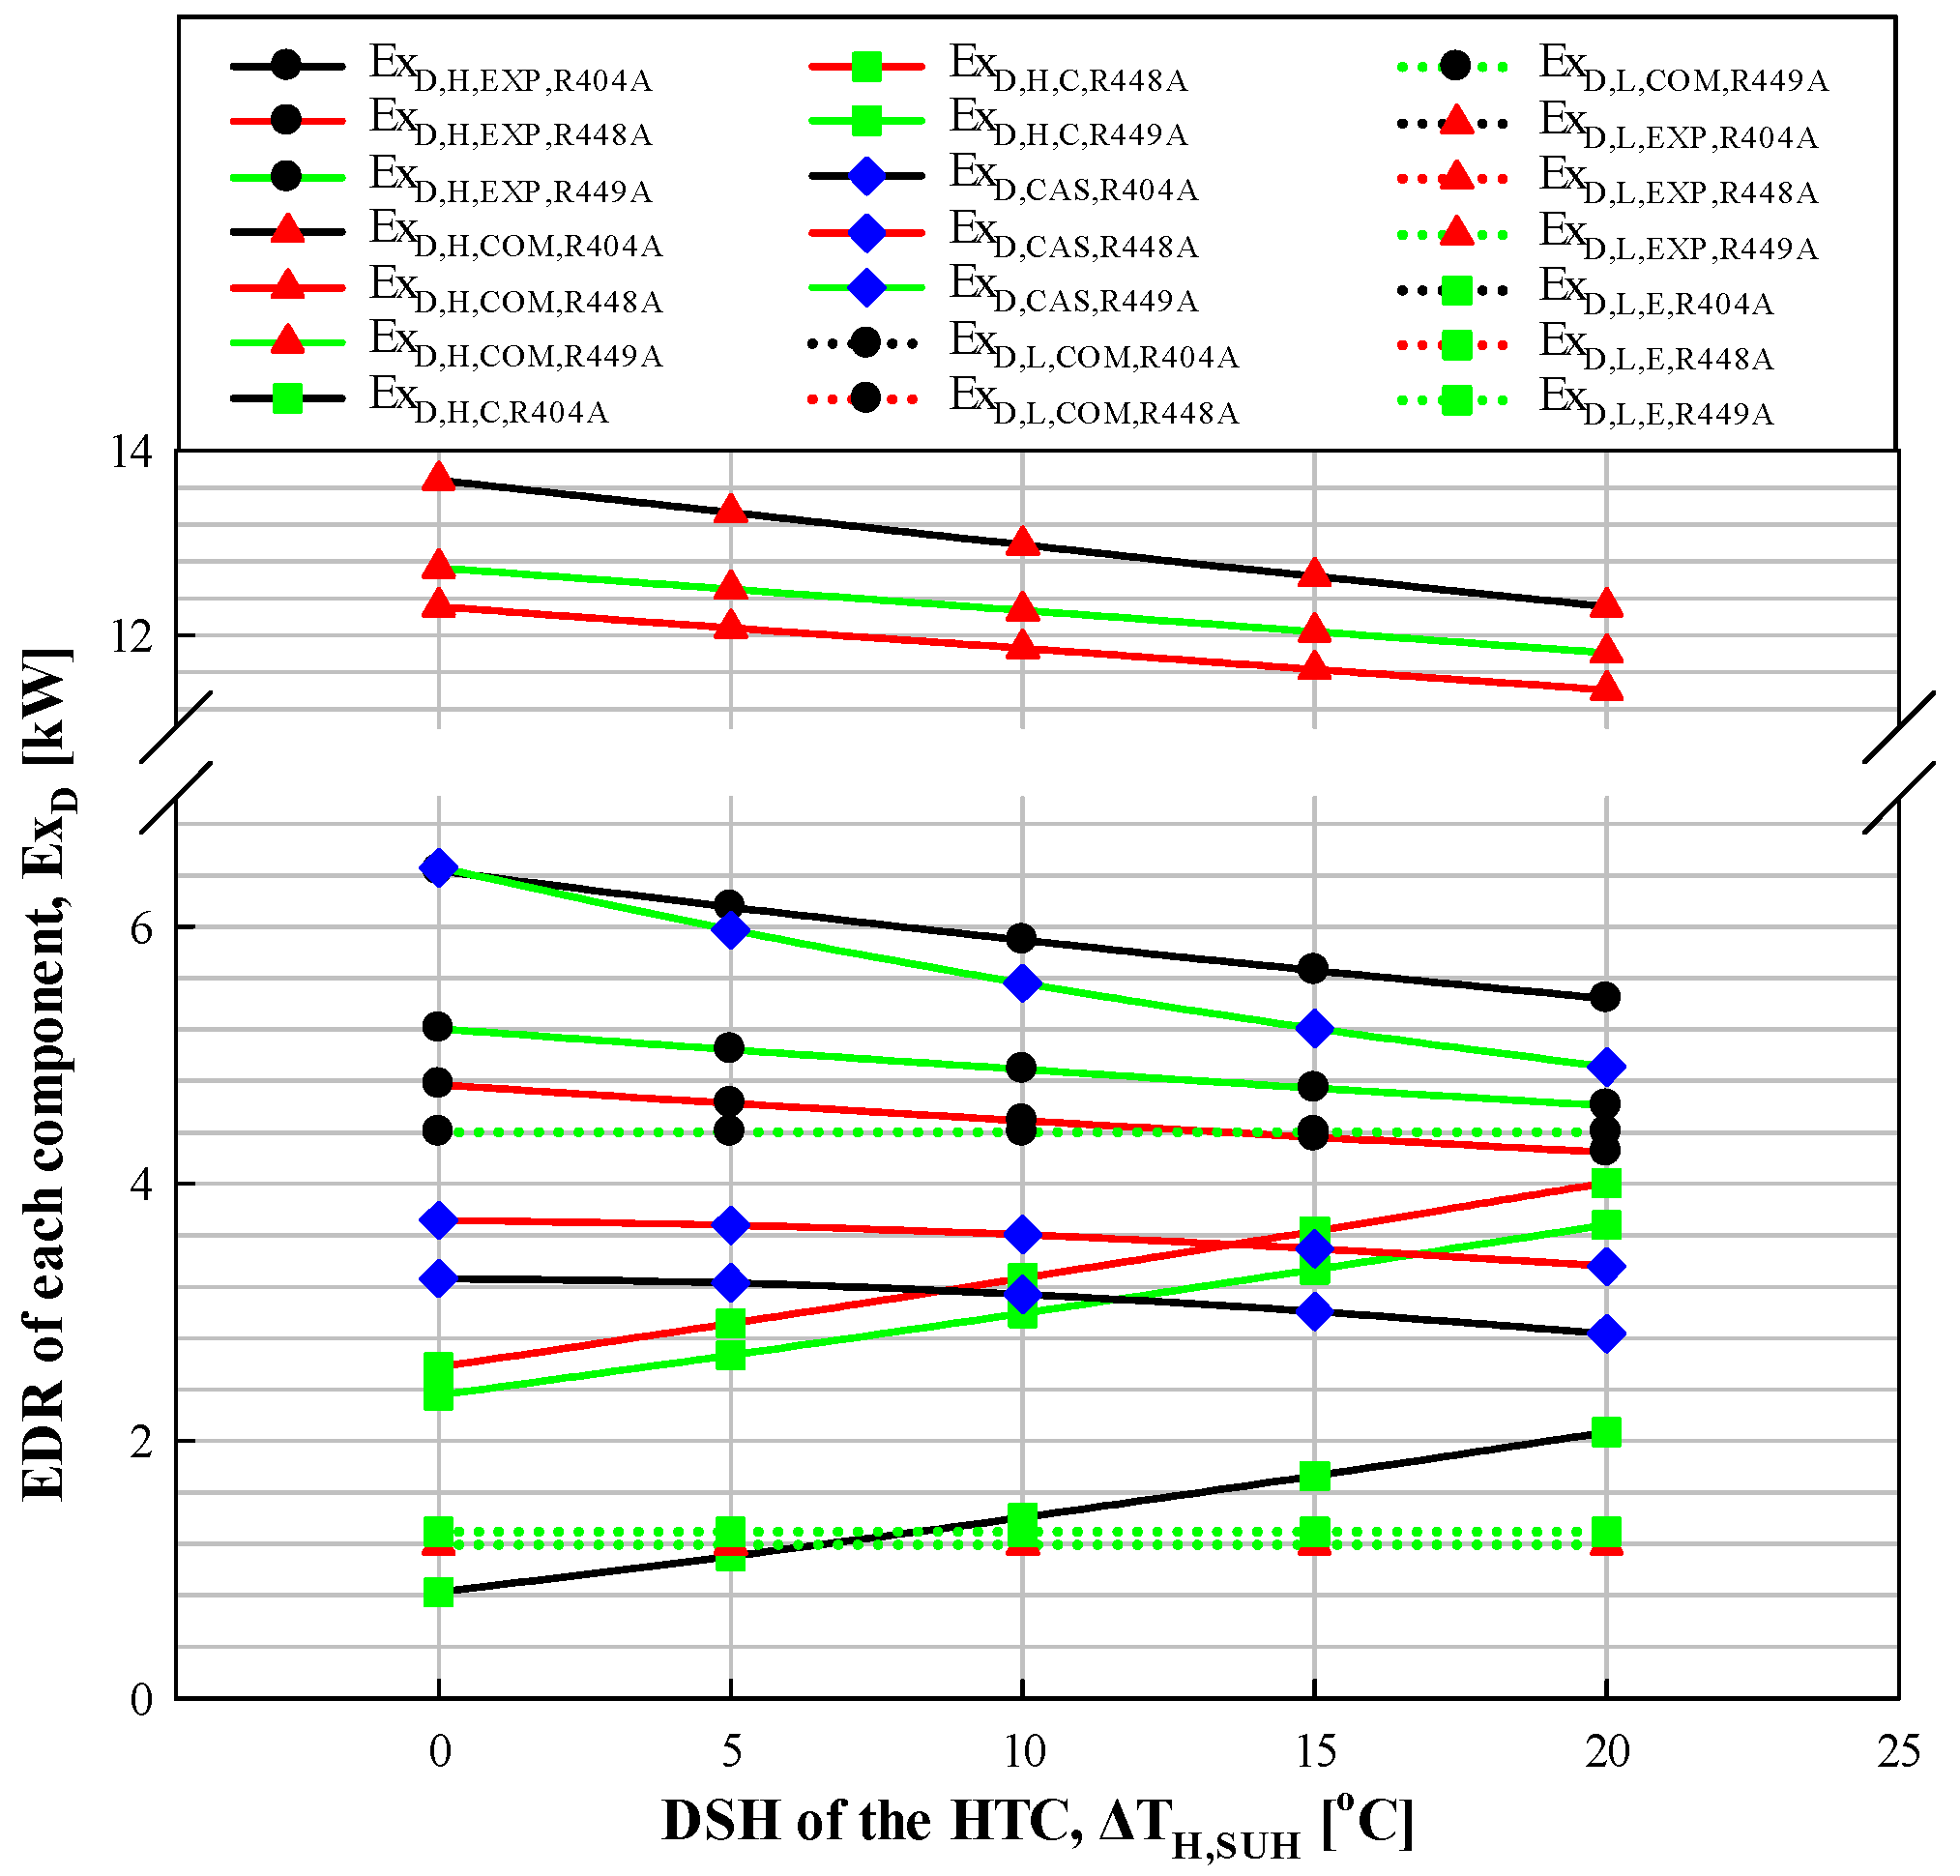
3.1.2. Effect of DSH in the HTC
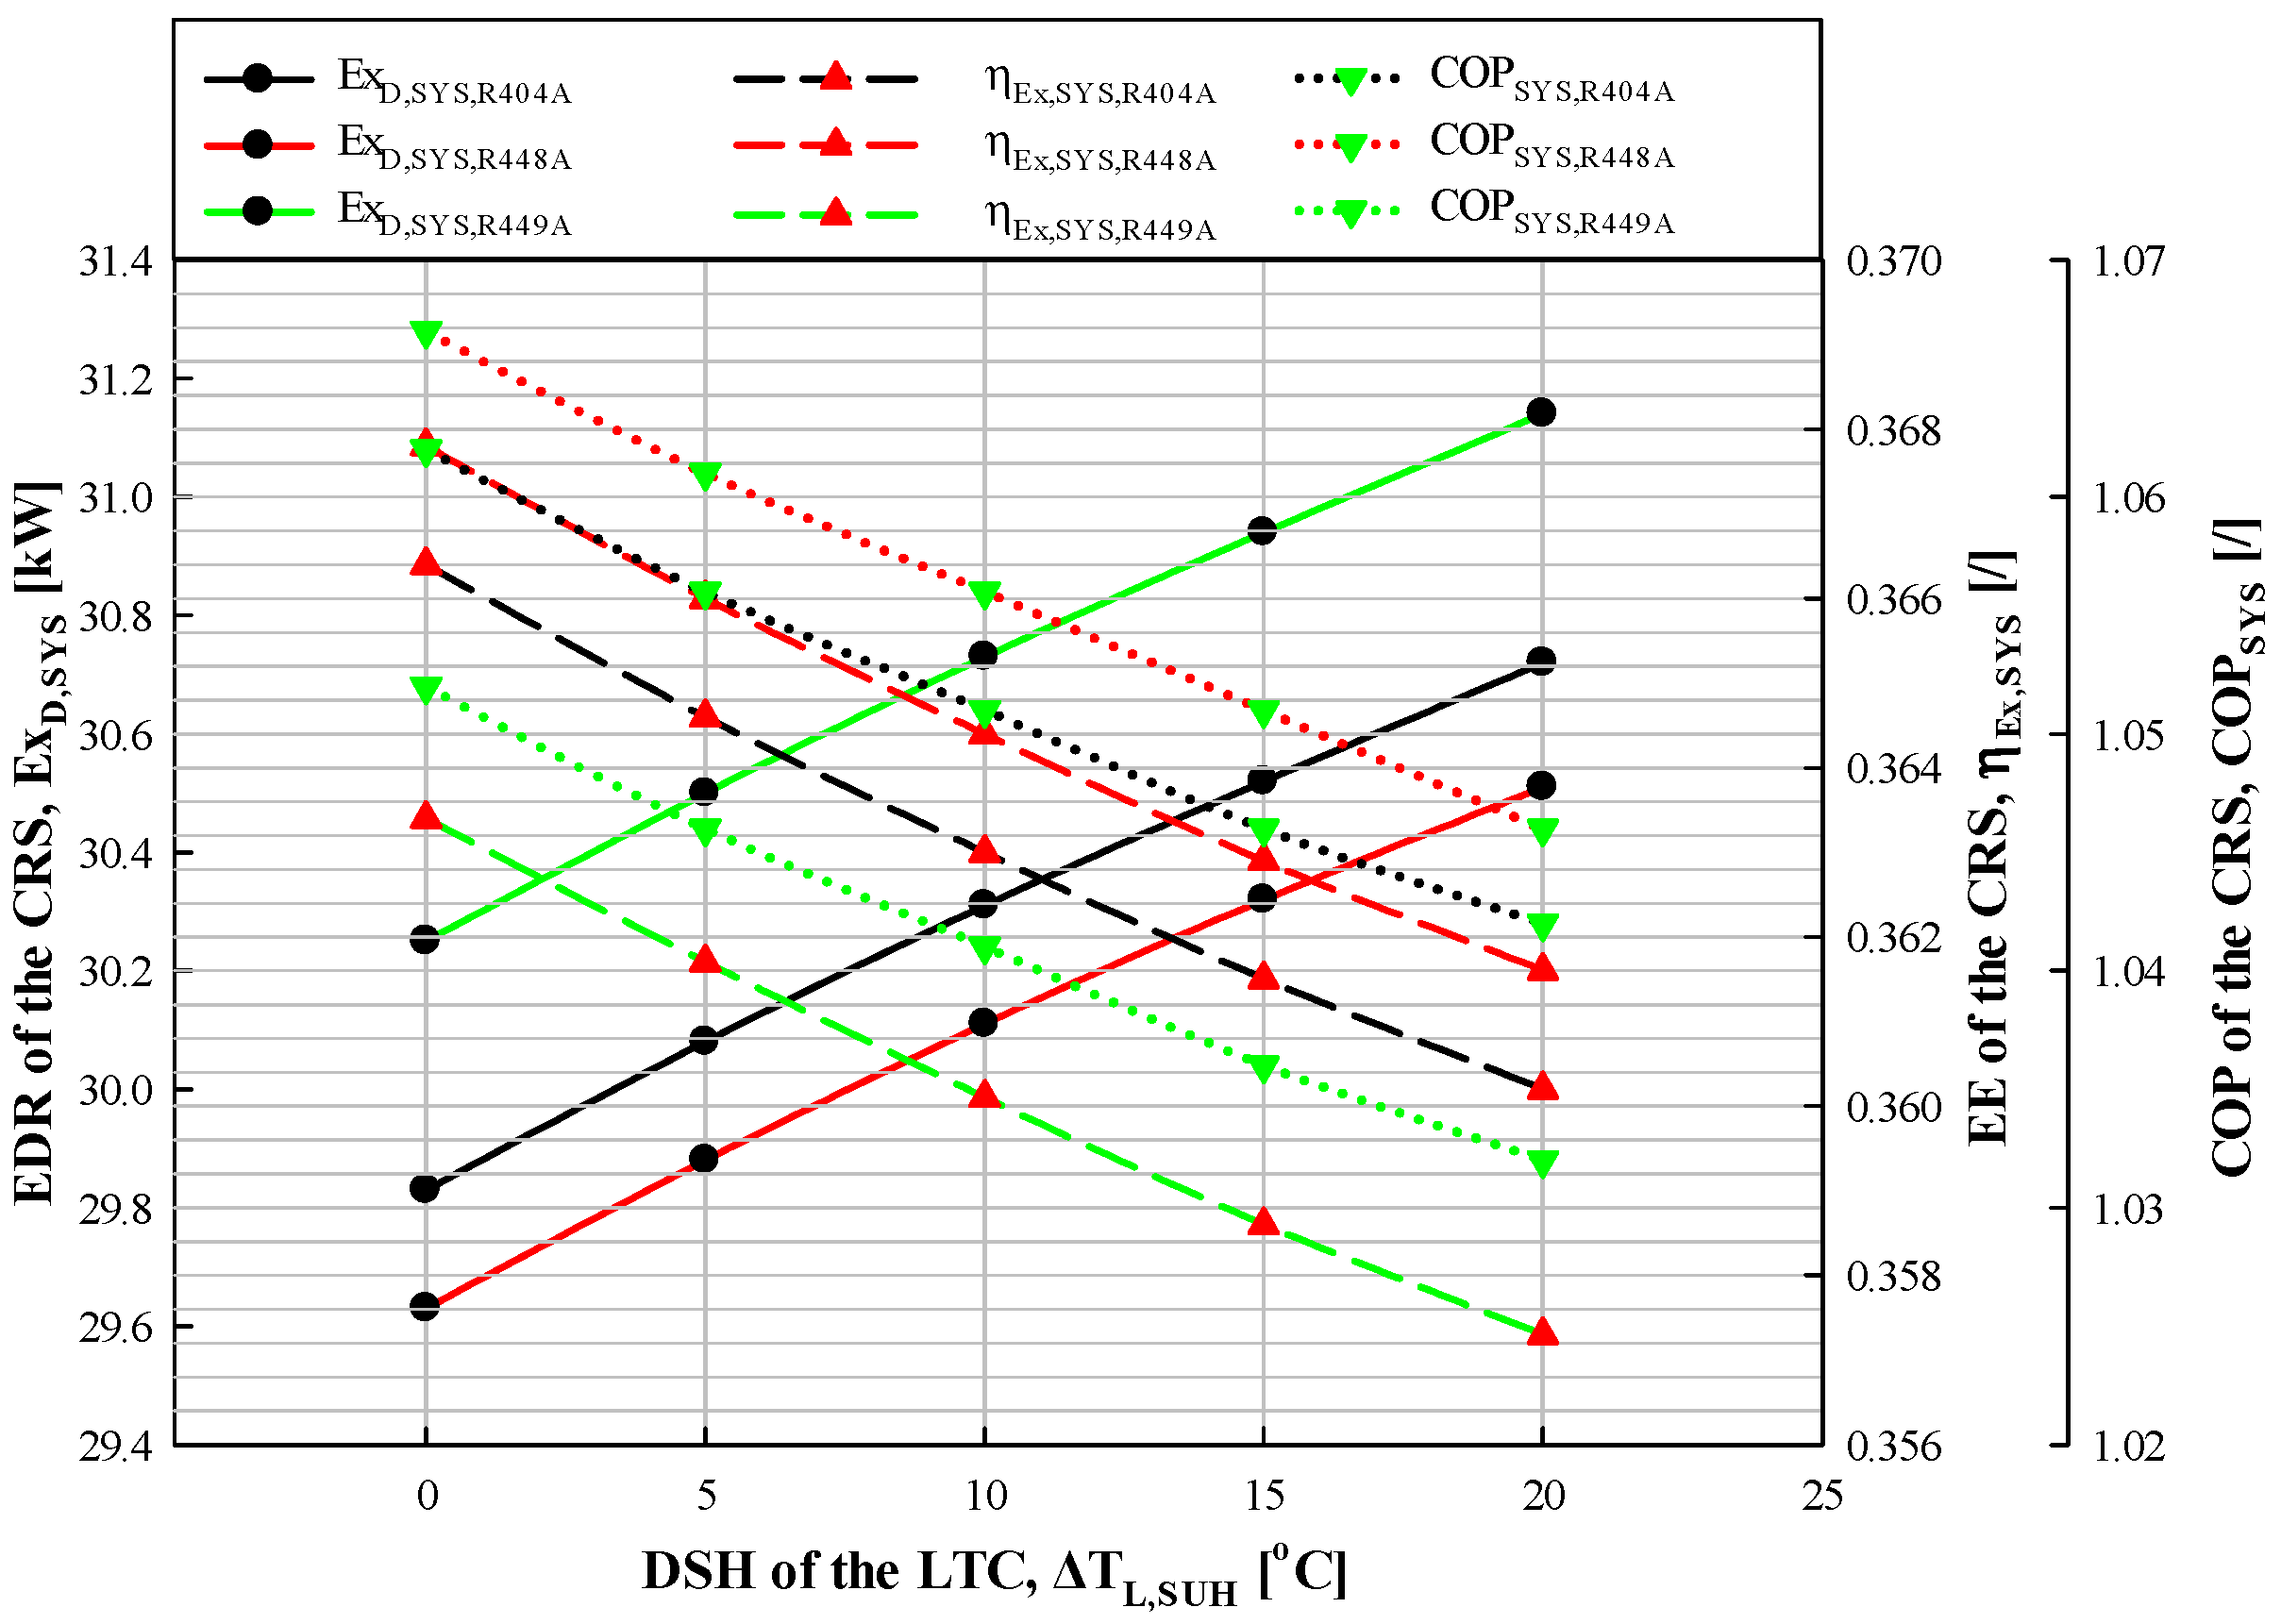
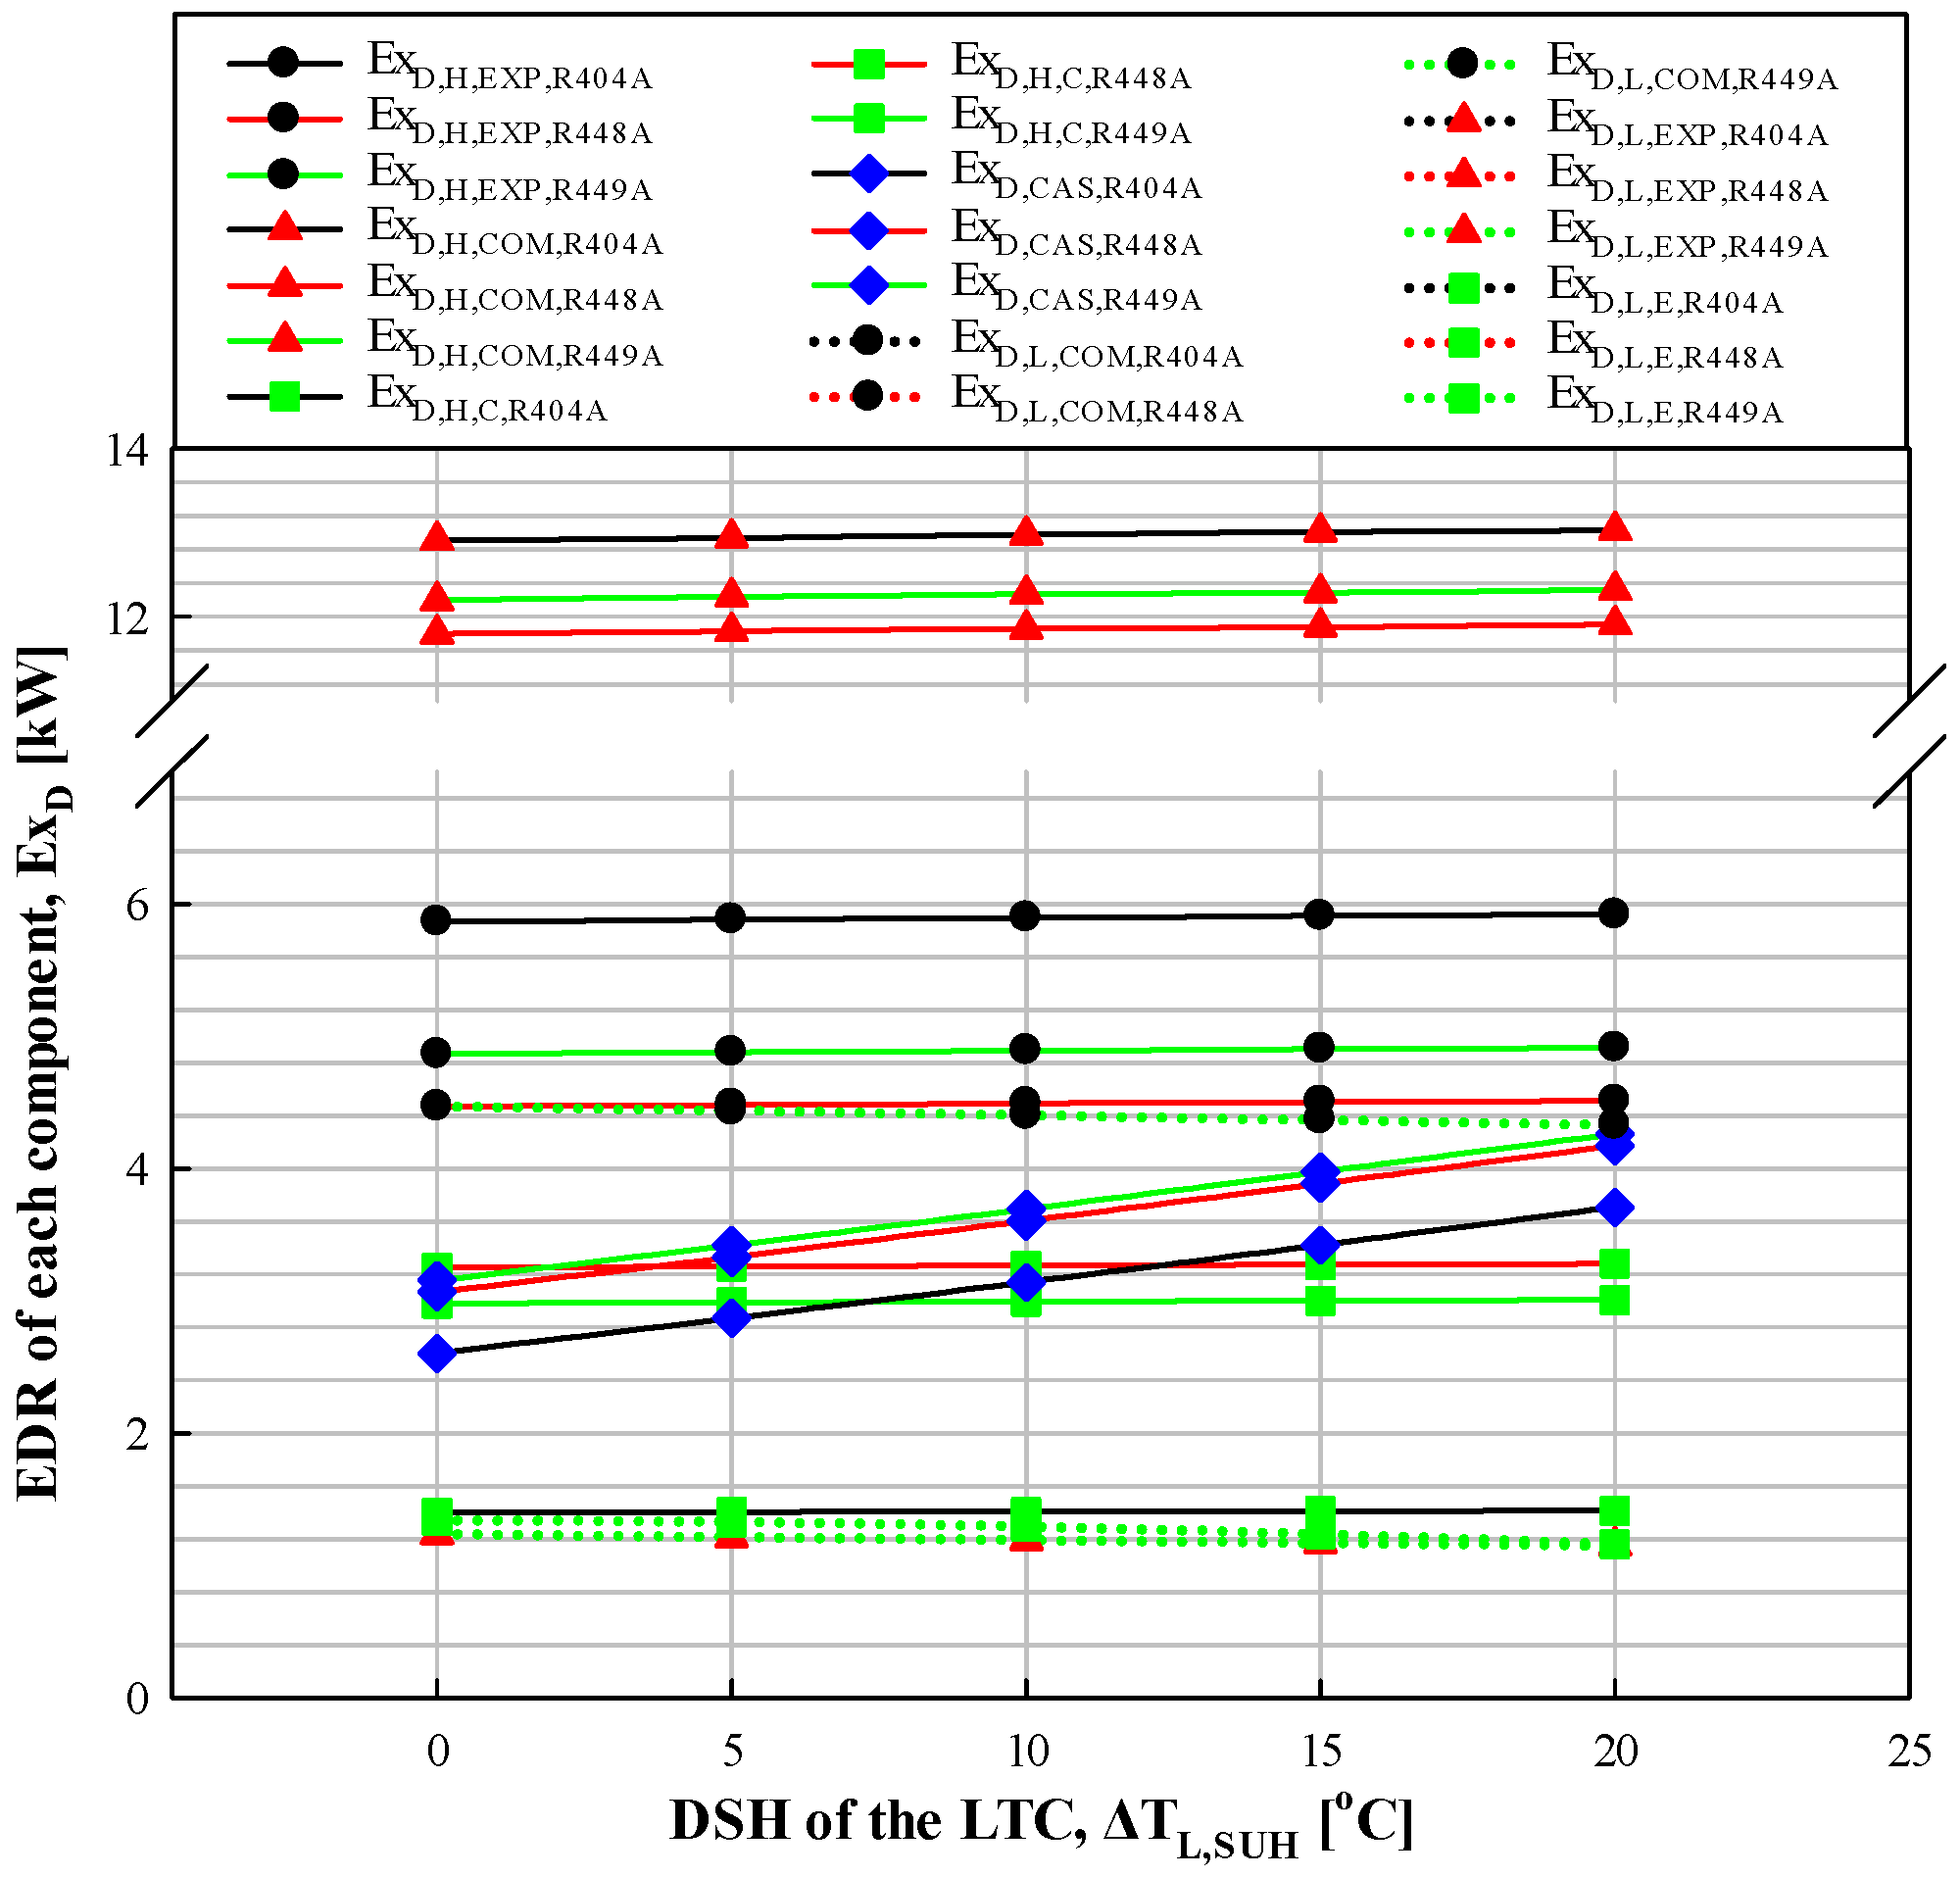
3.1.3. Effect of DSH in the LTC
3.2. Effect of CT and ET
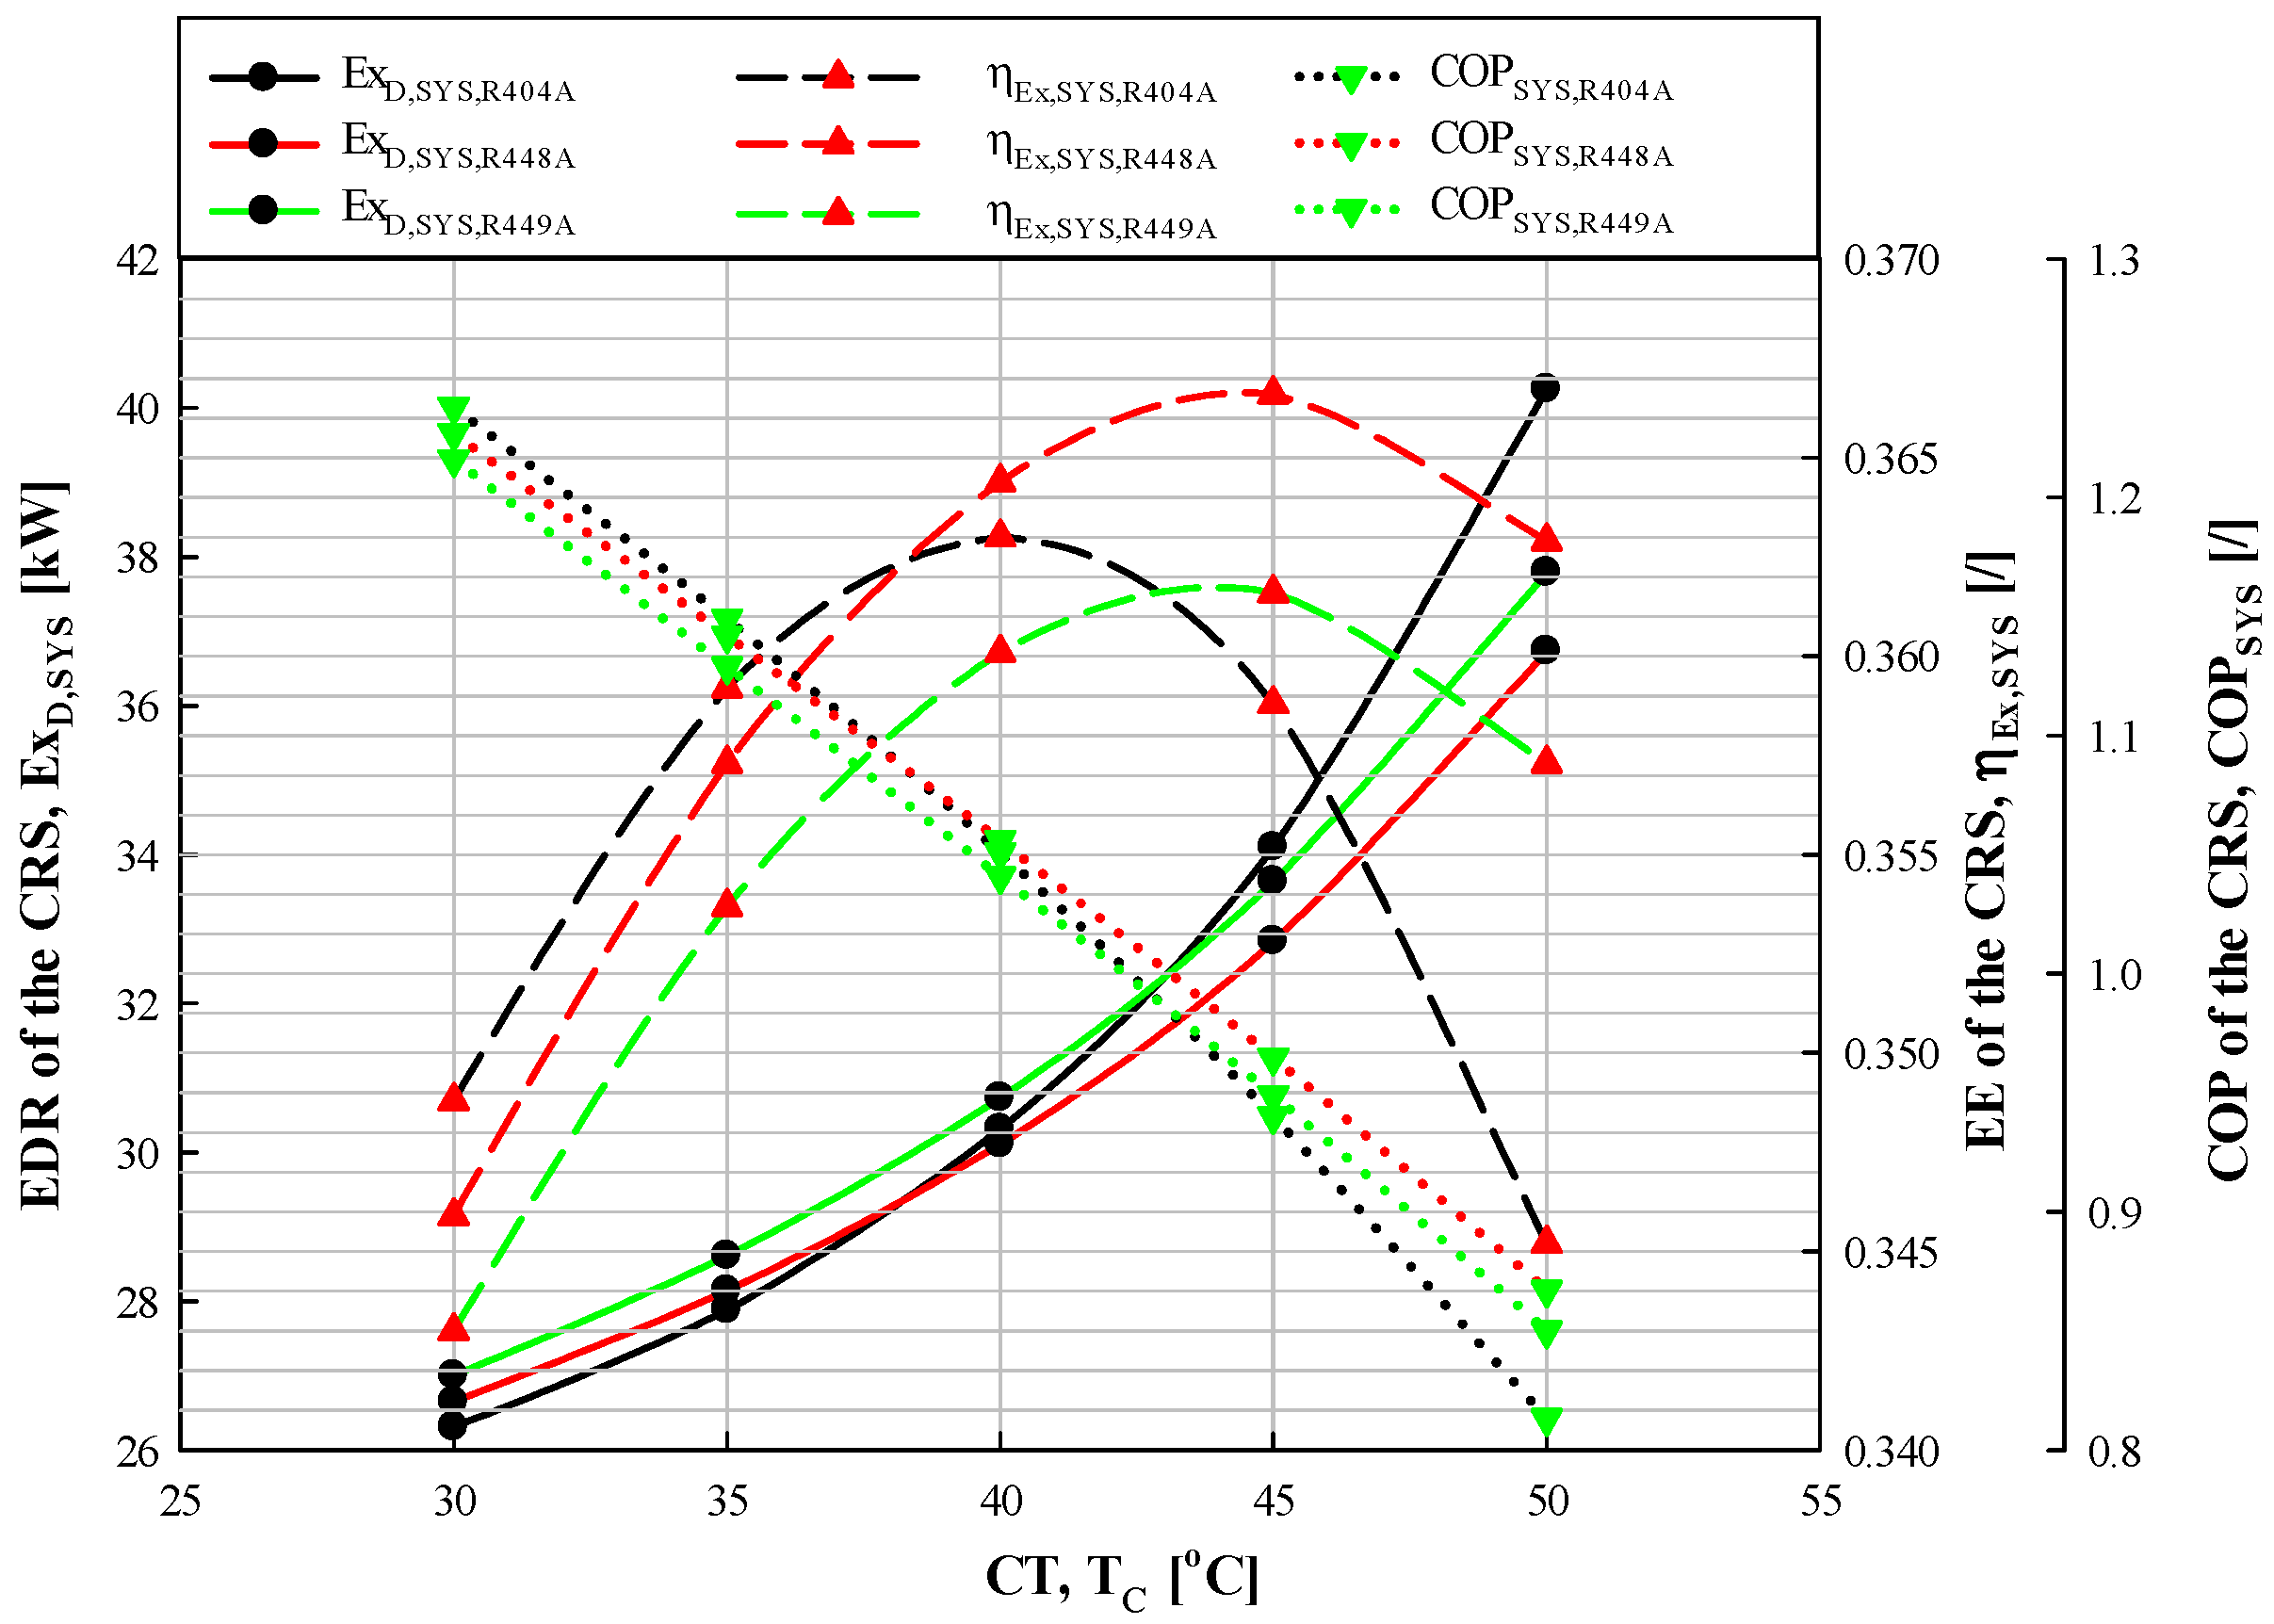
3.2.1. Effect of CT
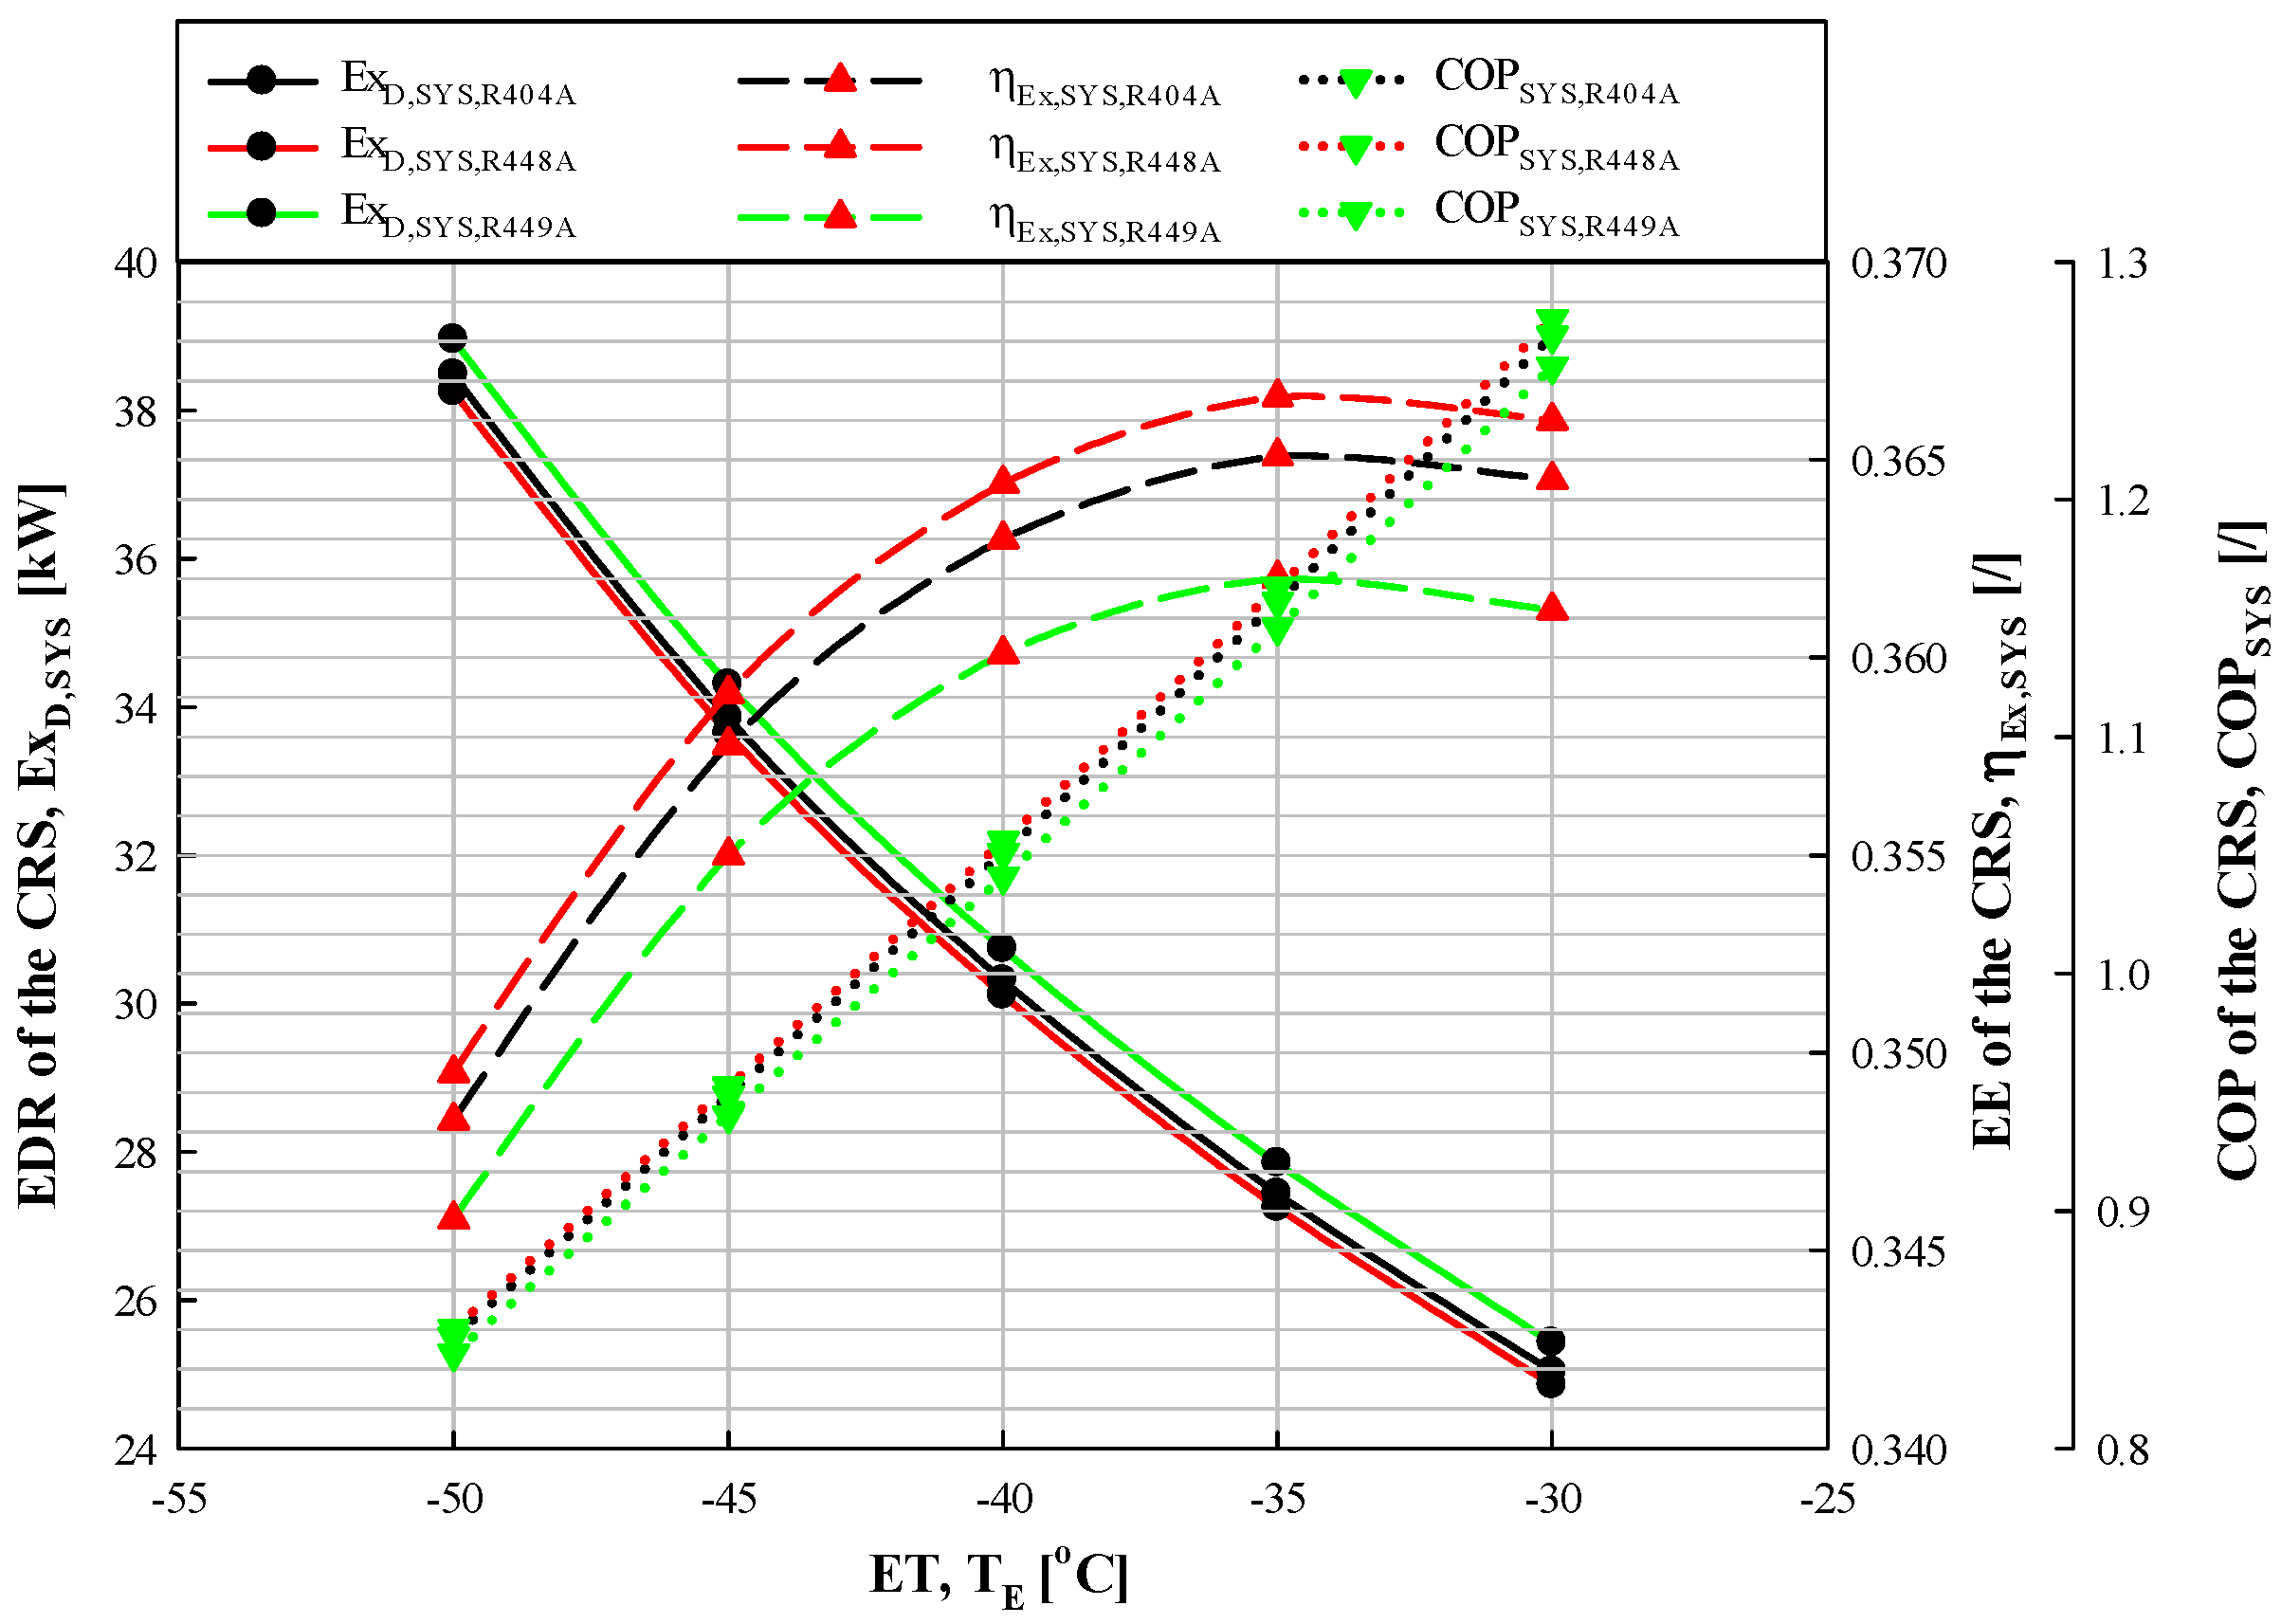
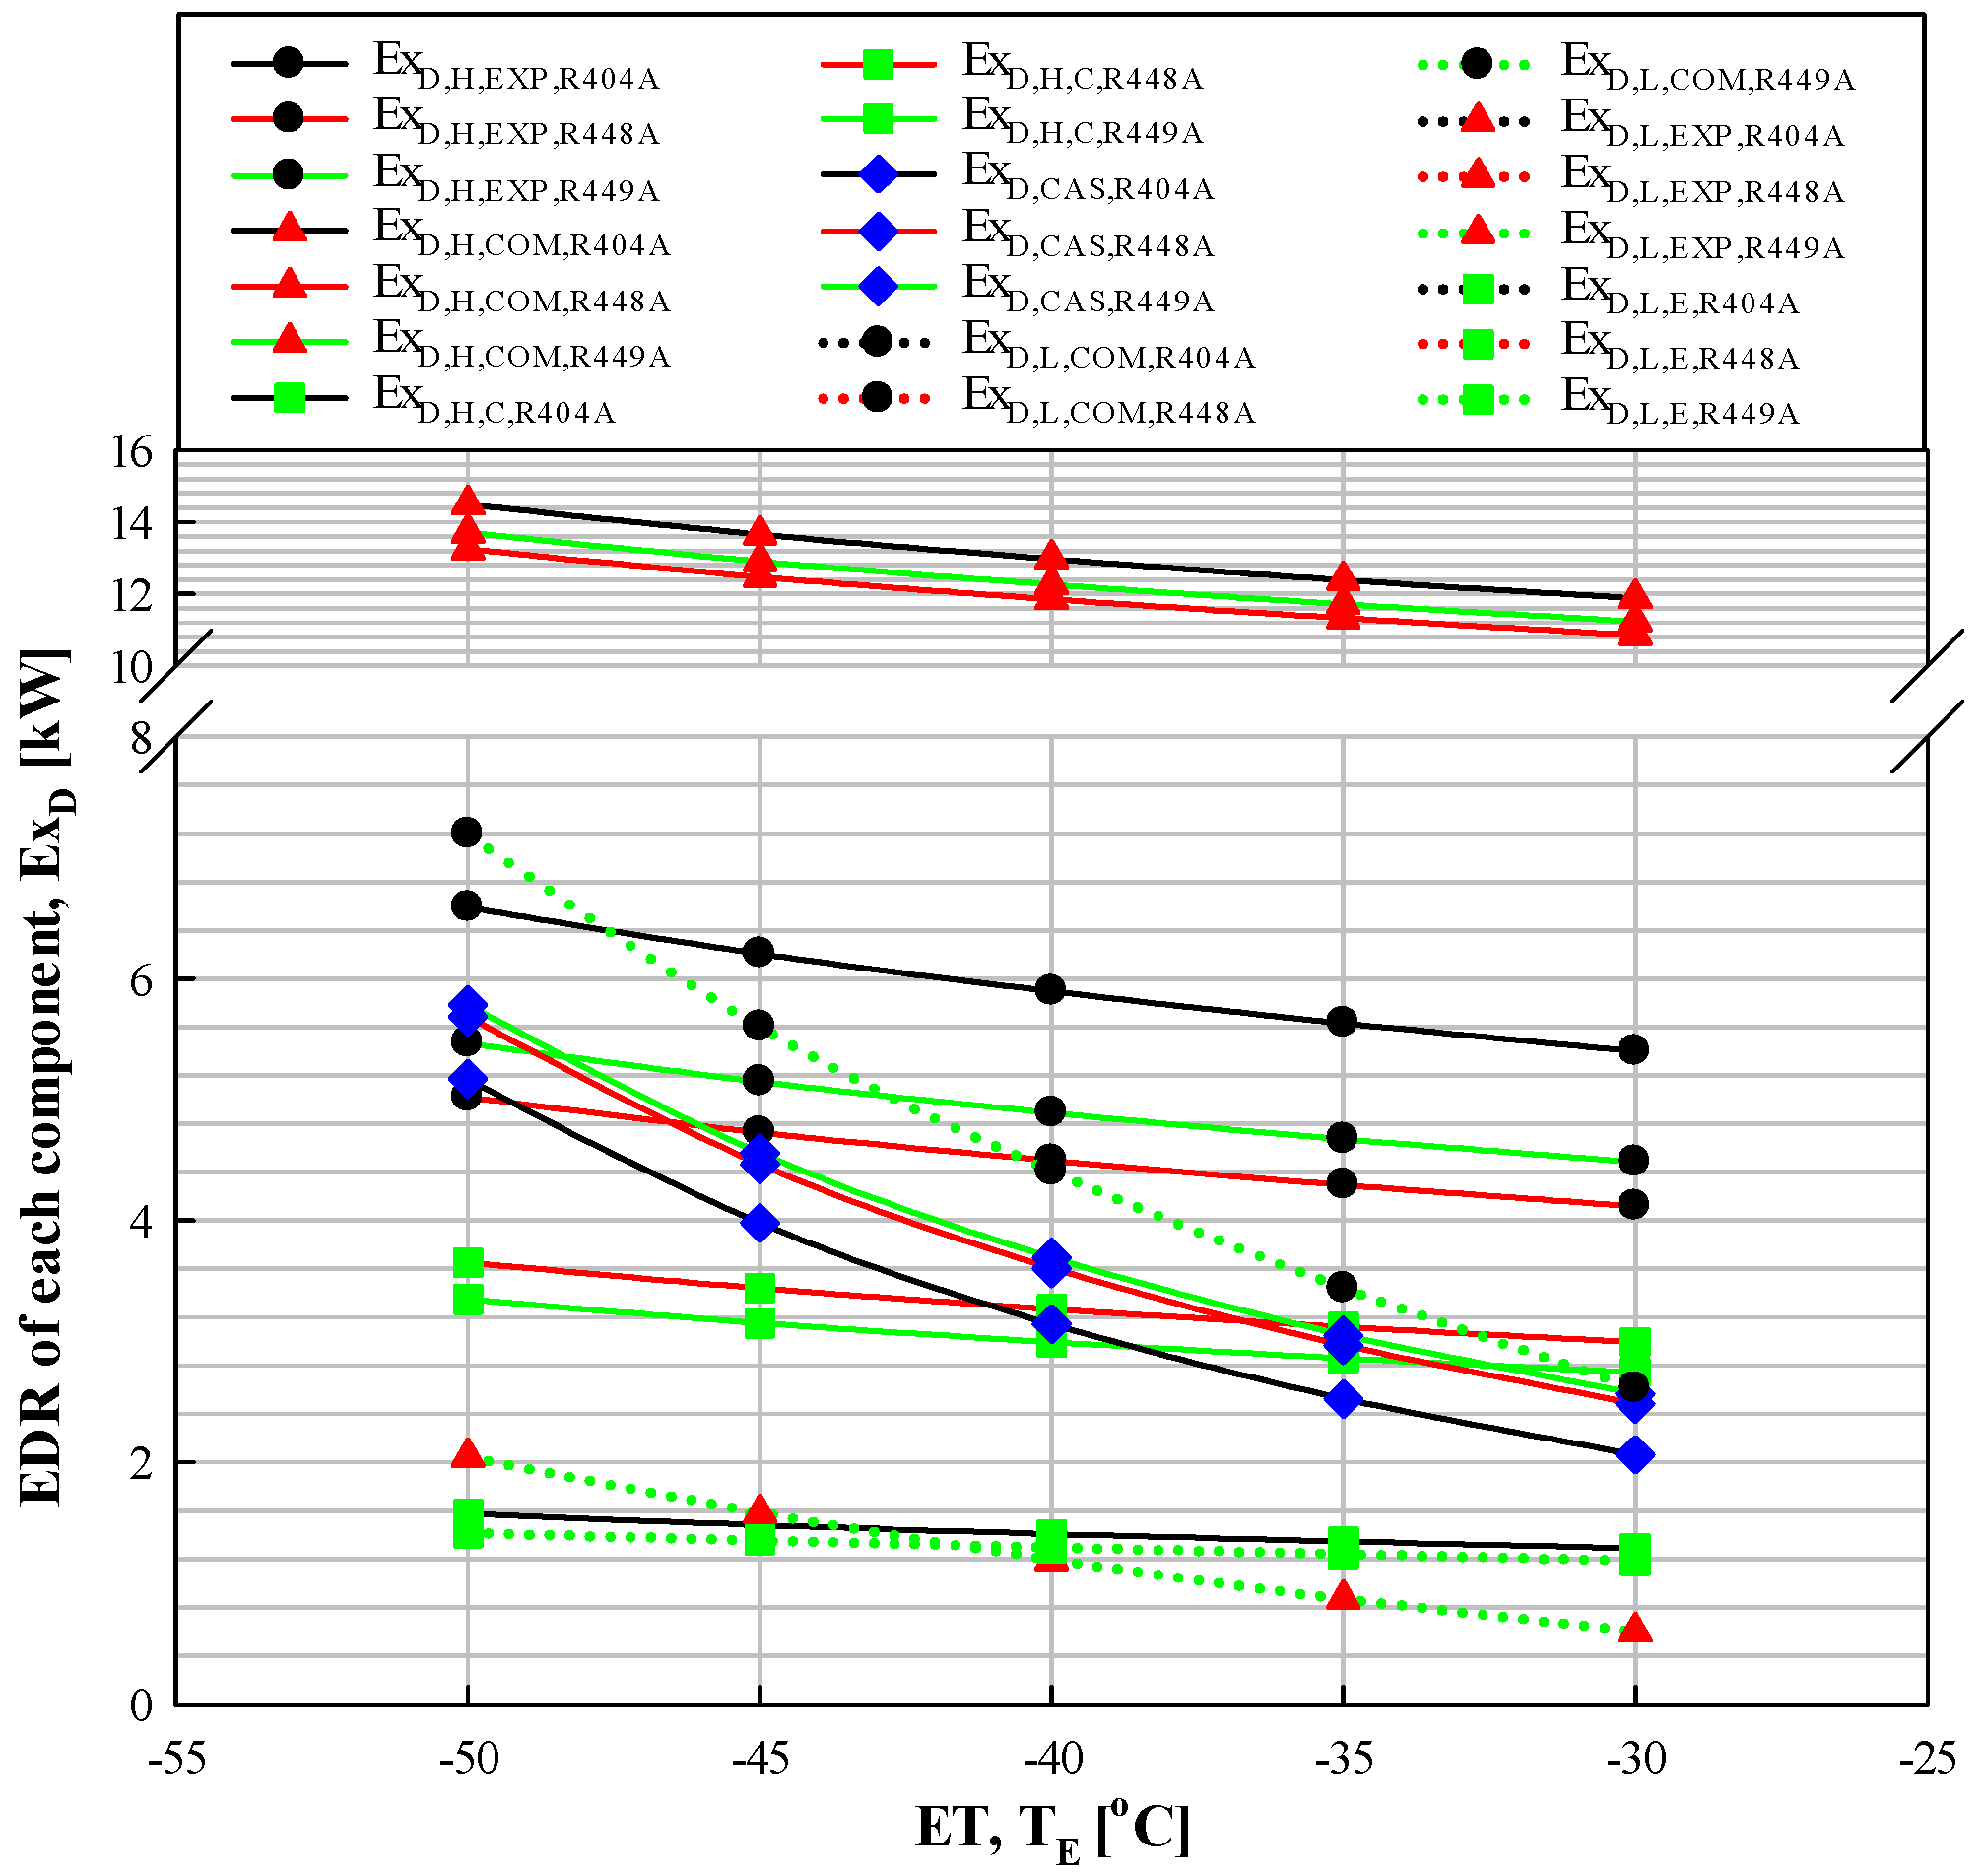
3.2.2. Effect of ET
3.3. Effect of CET and Temperature Difference of CHX
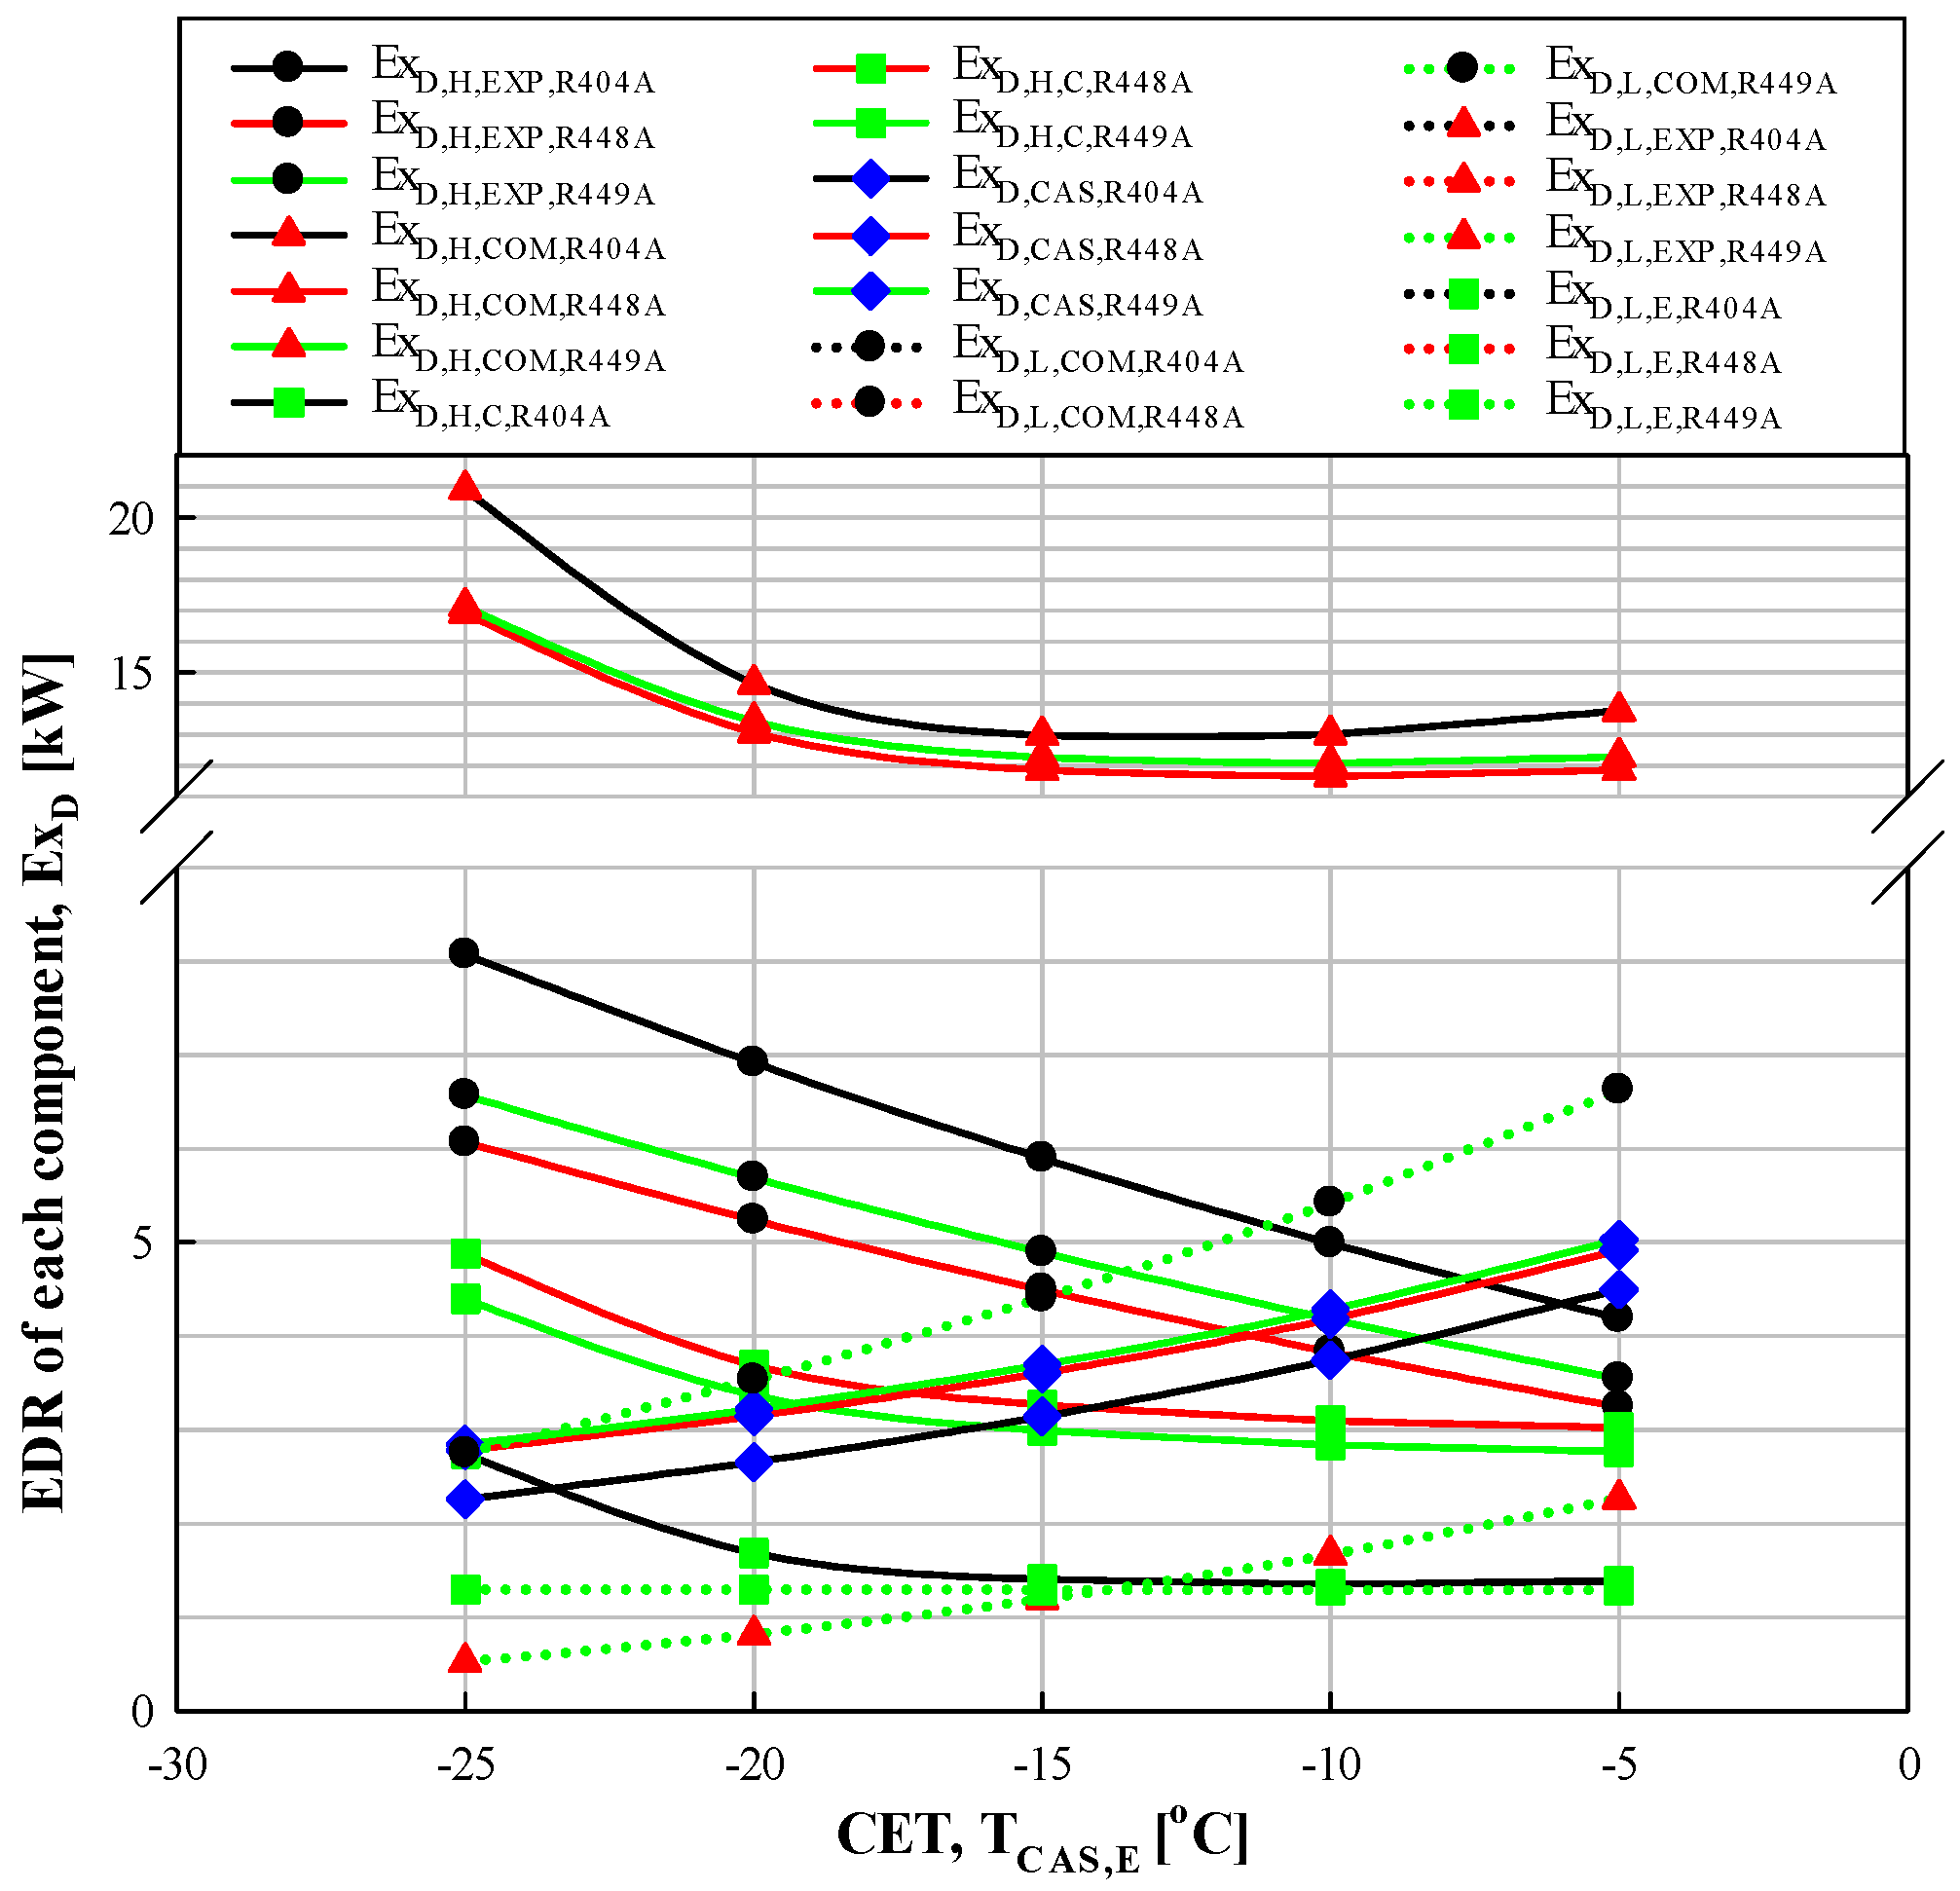
3.3.1. Effect of CET
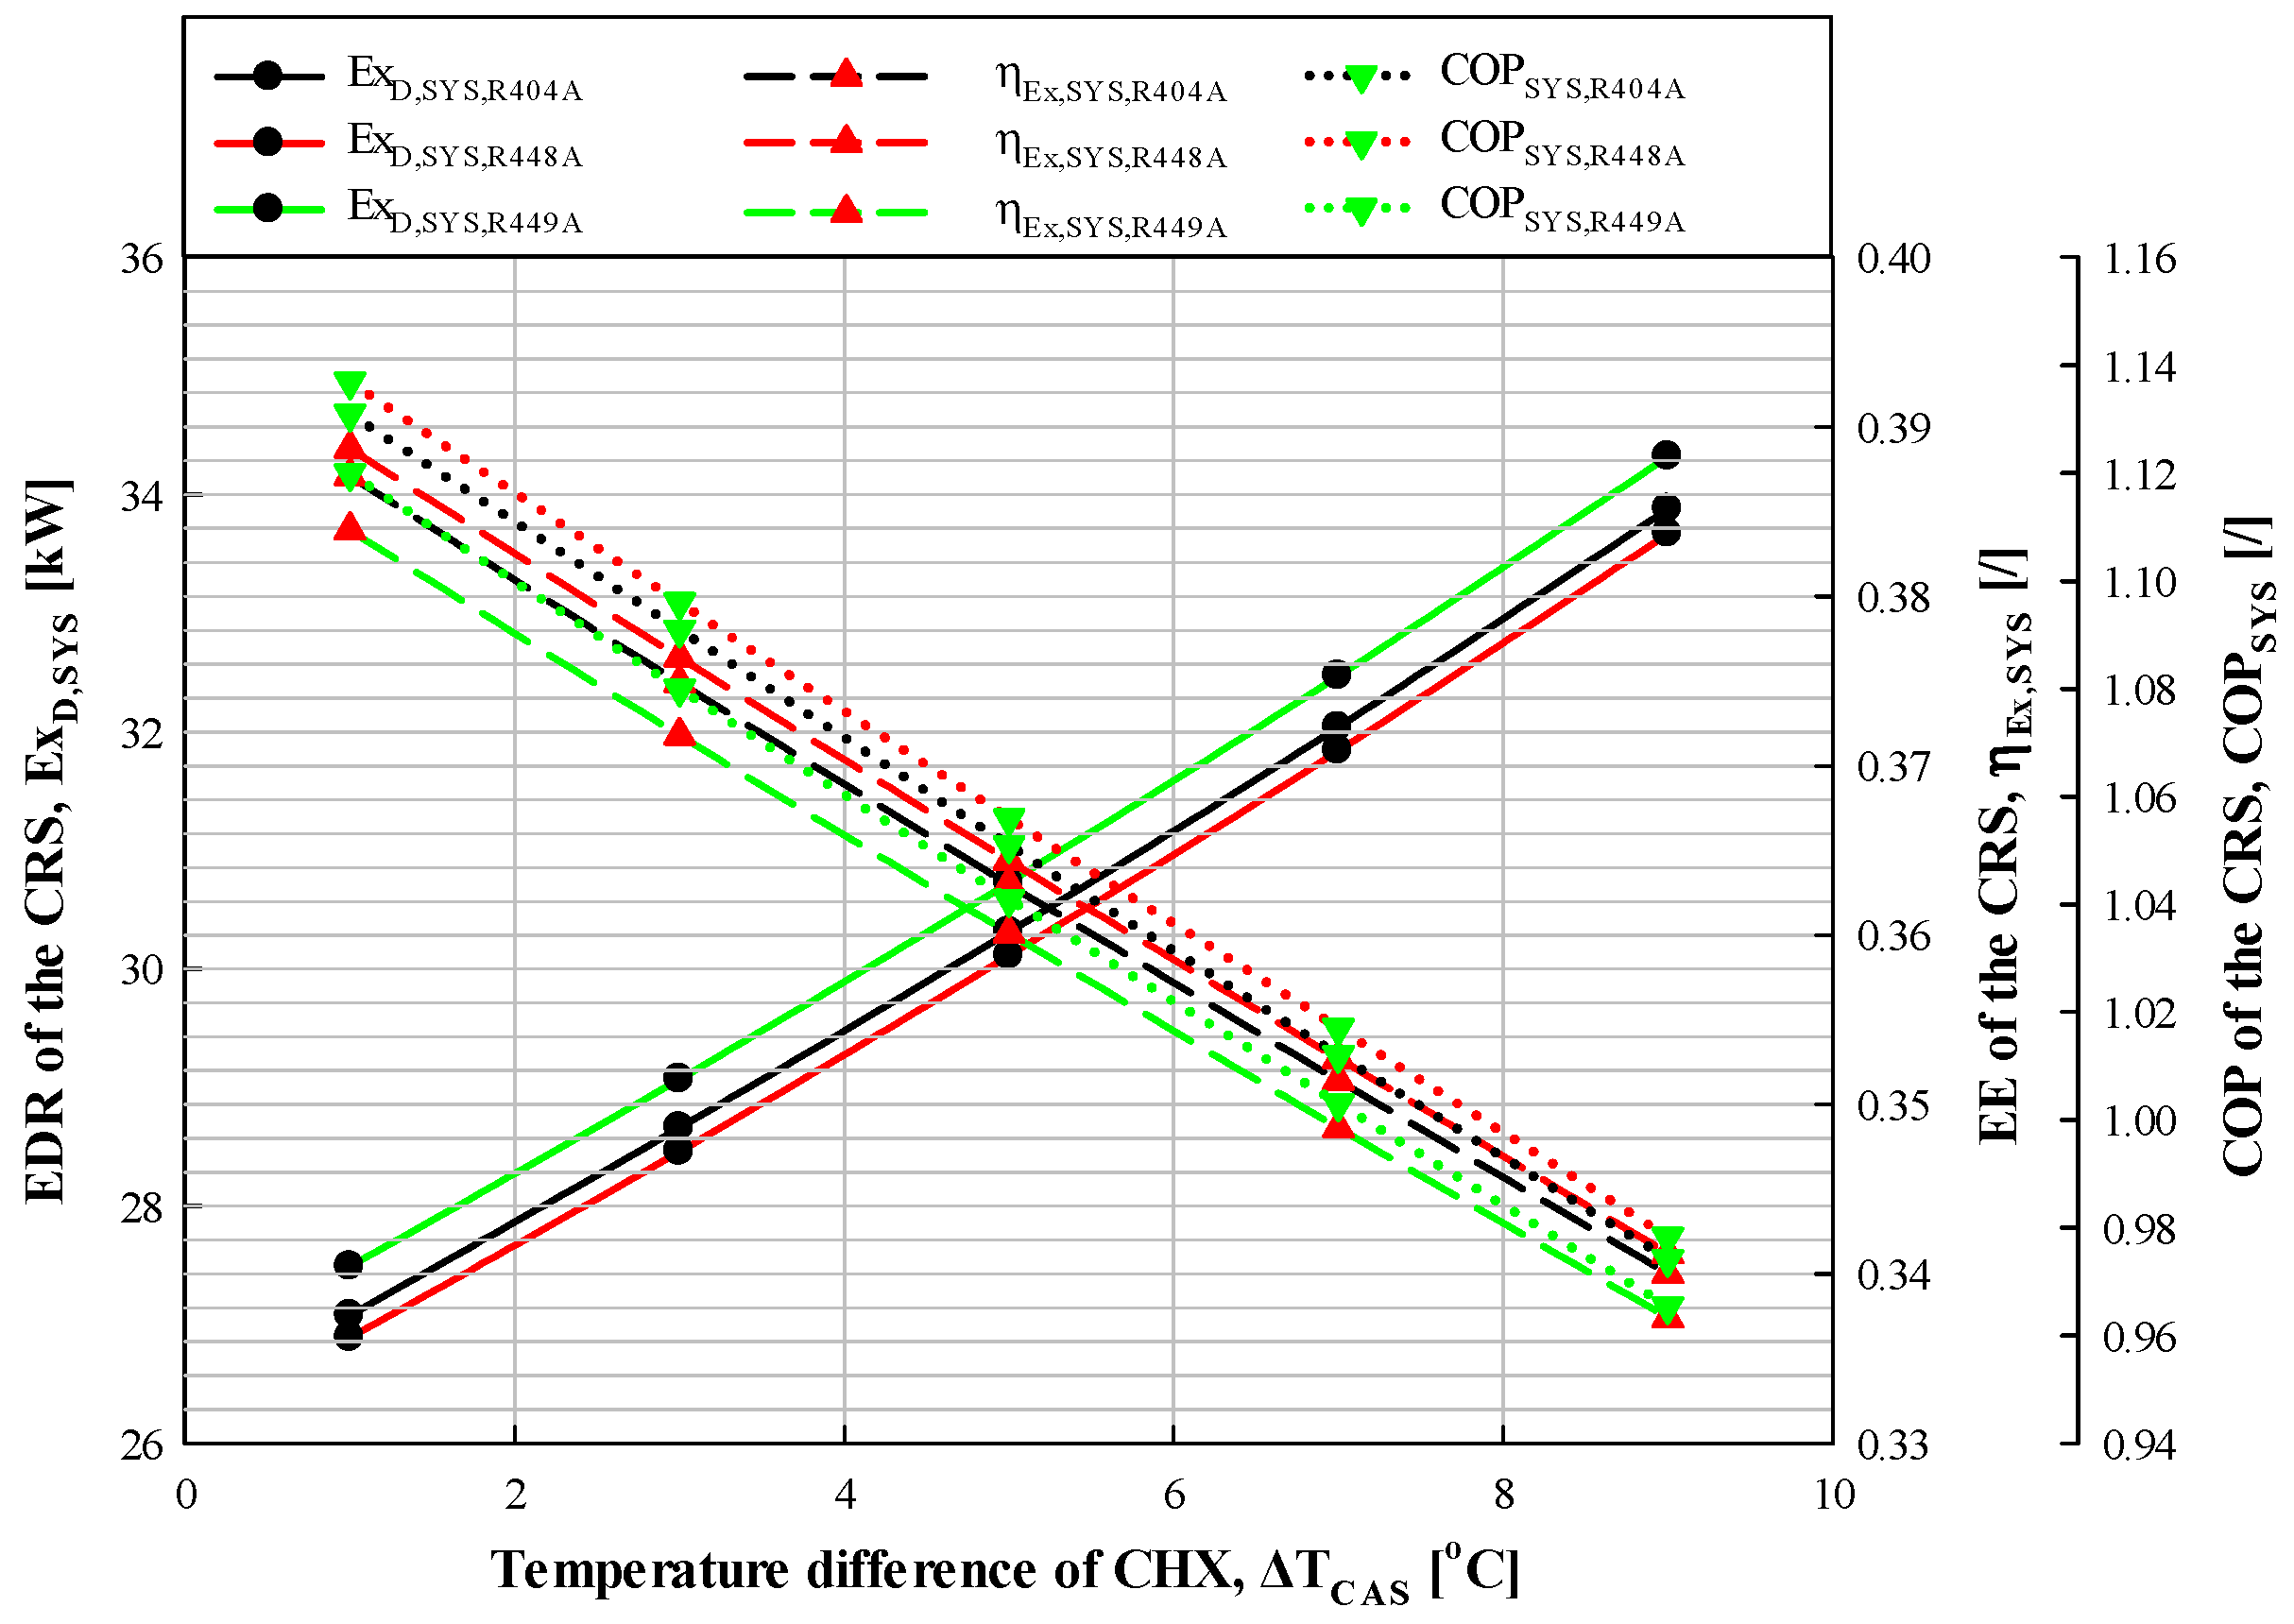
3.3.2. Effect of Temperature Difference of CHX
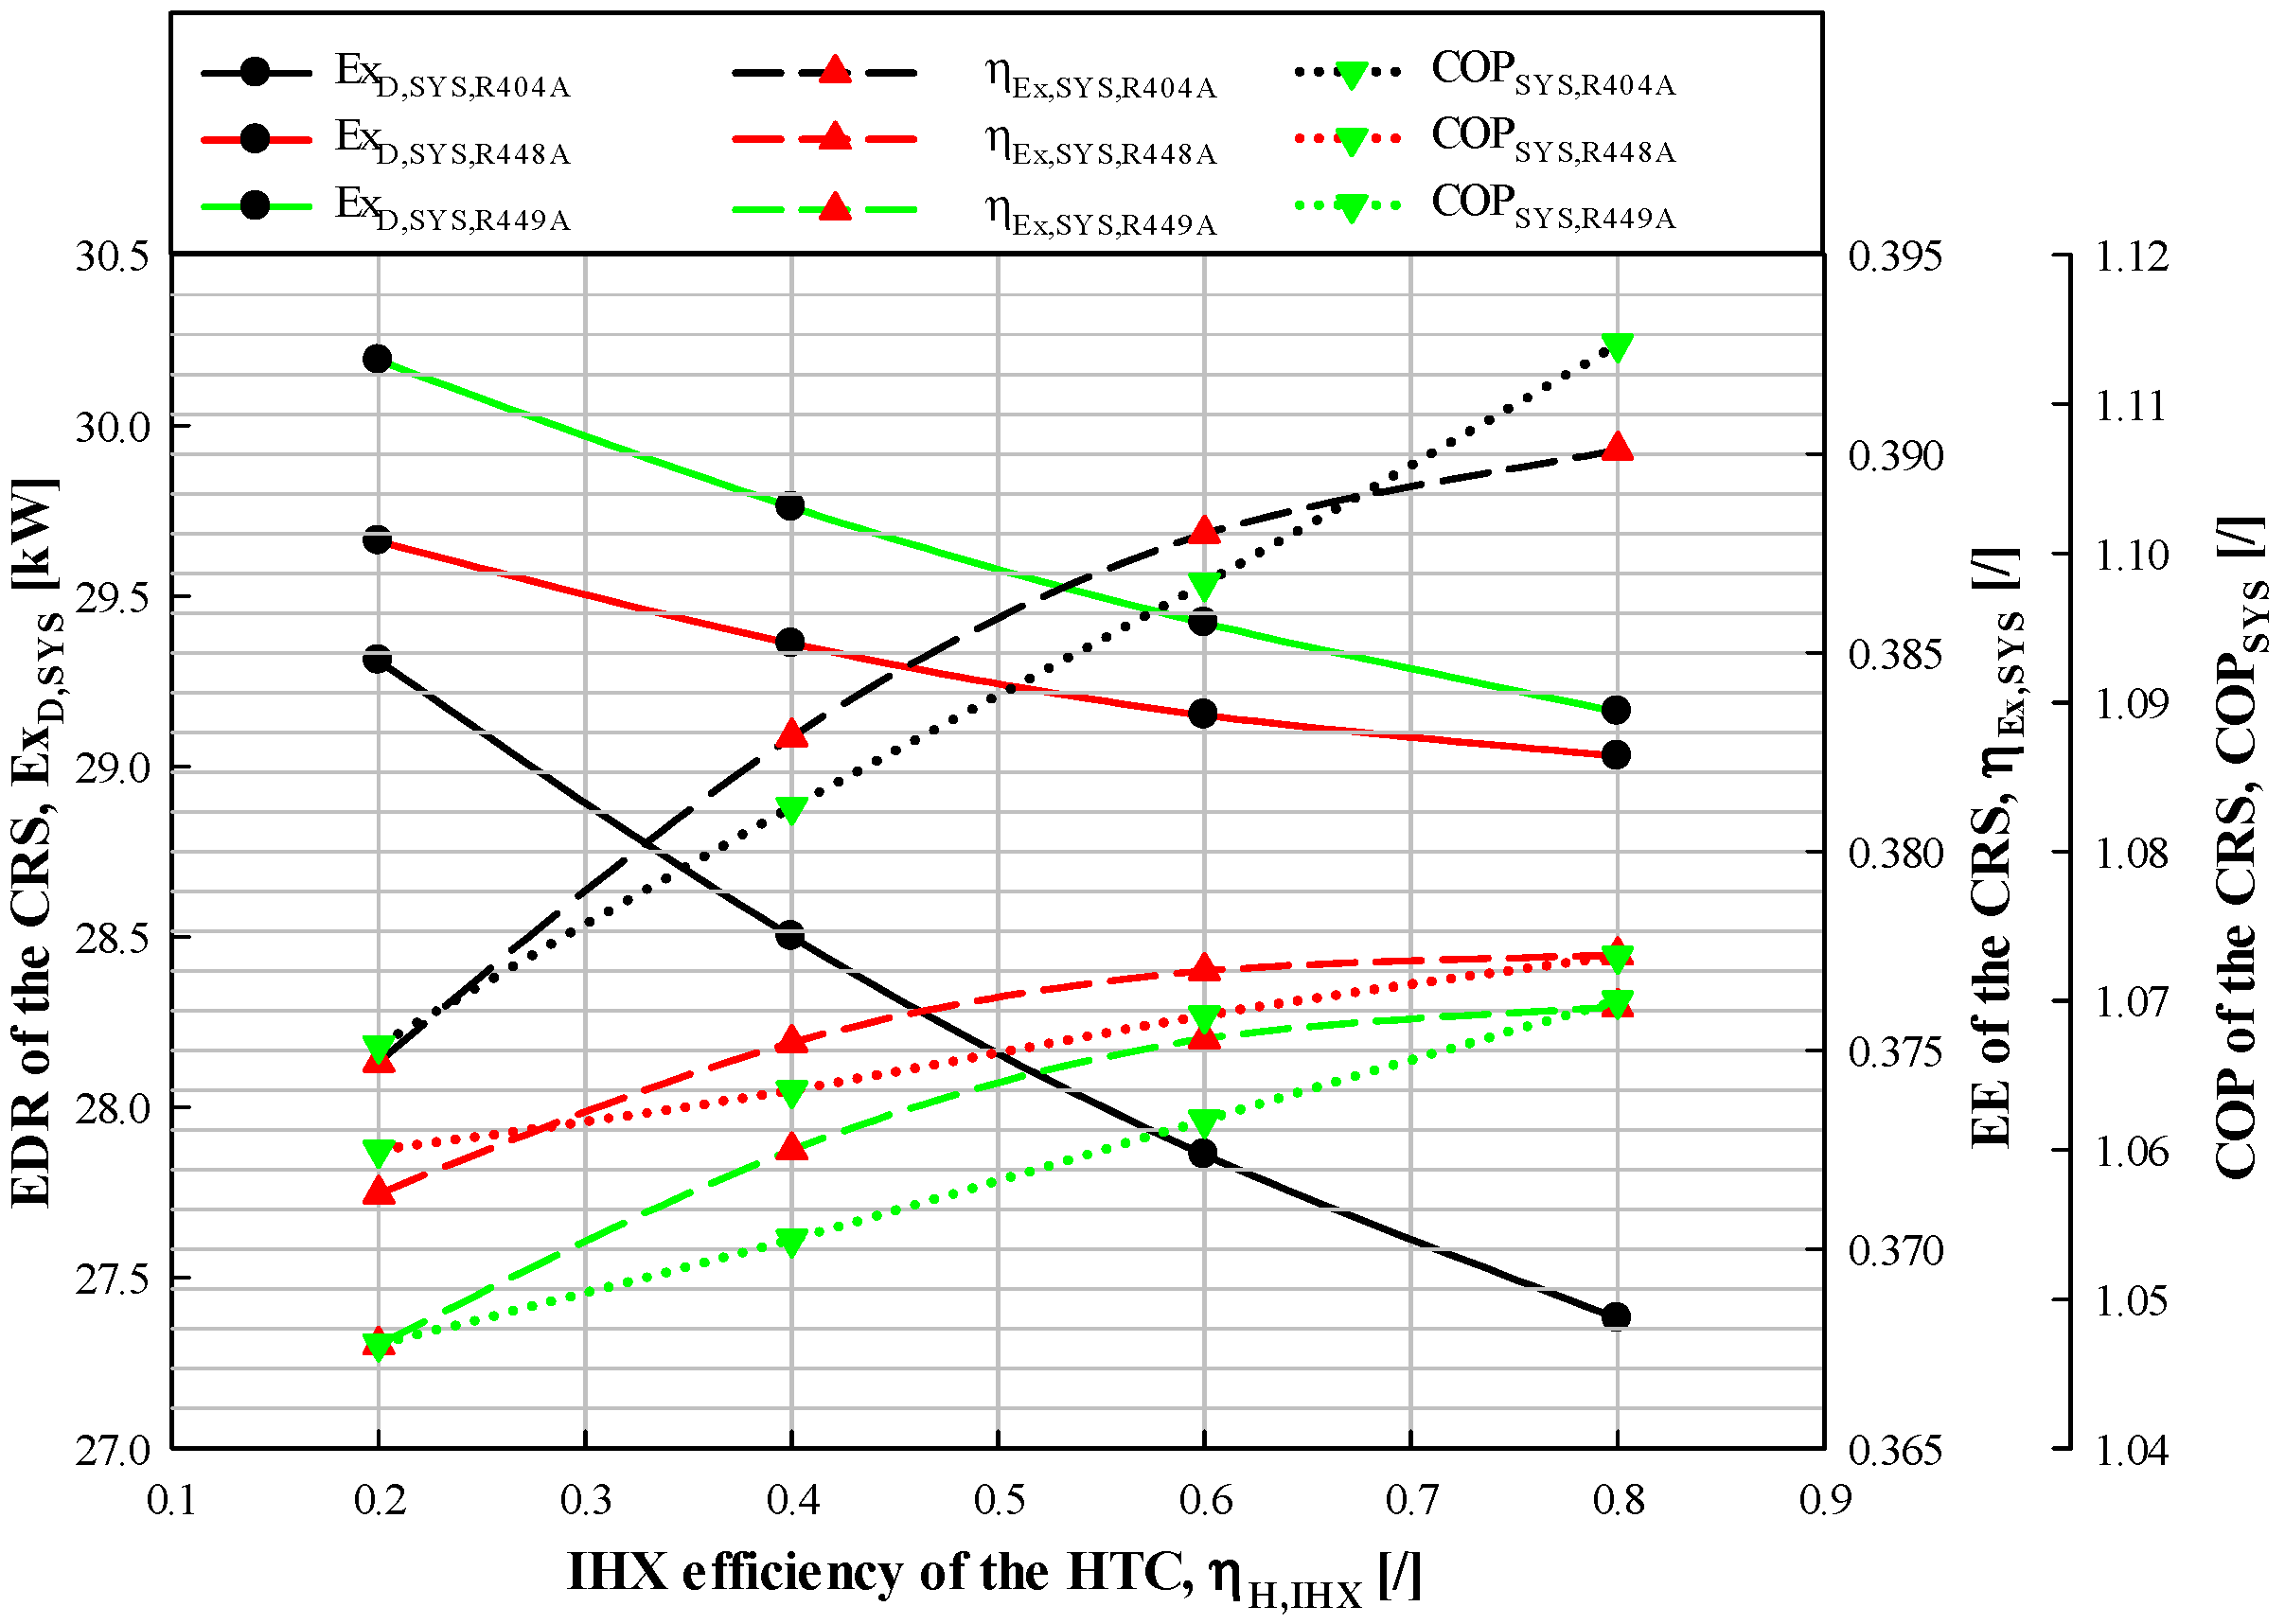
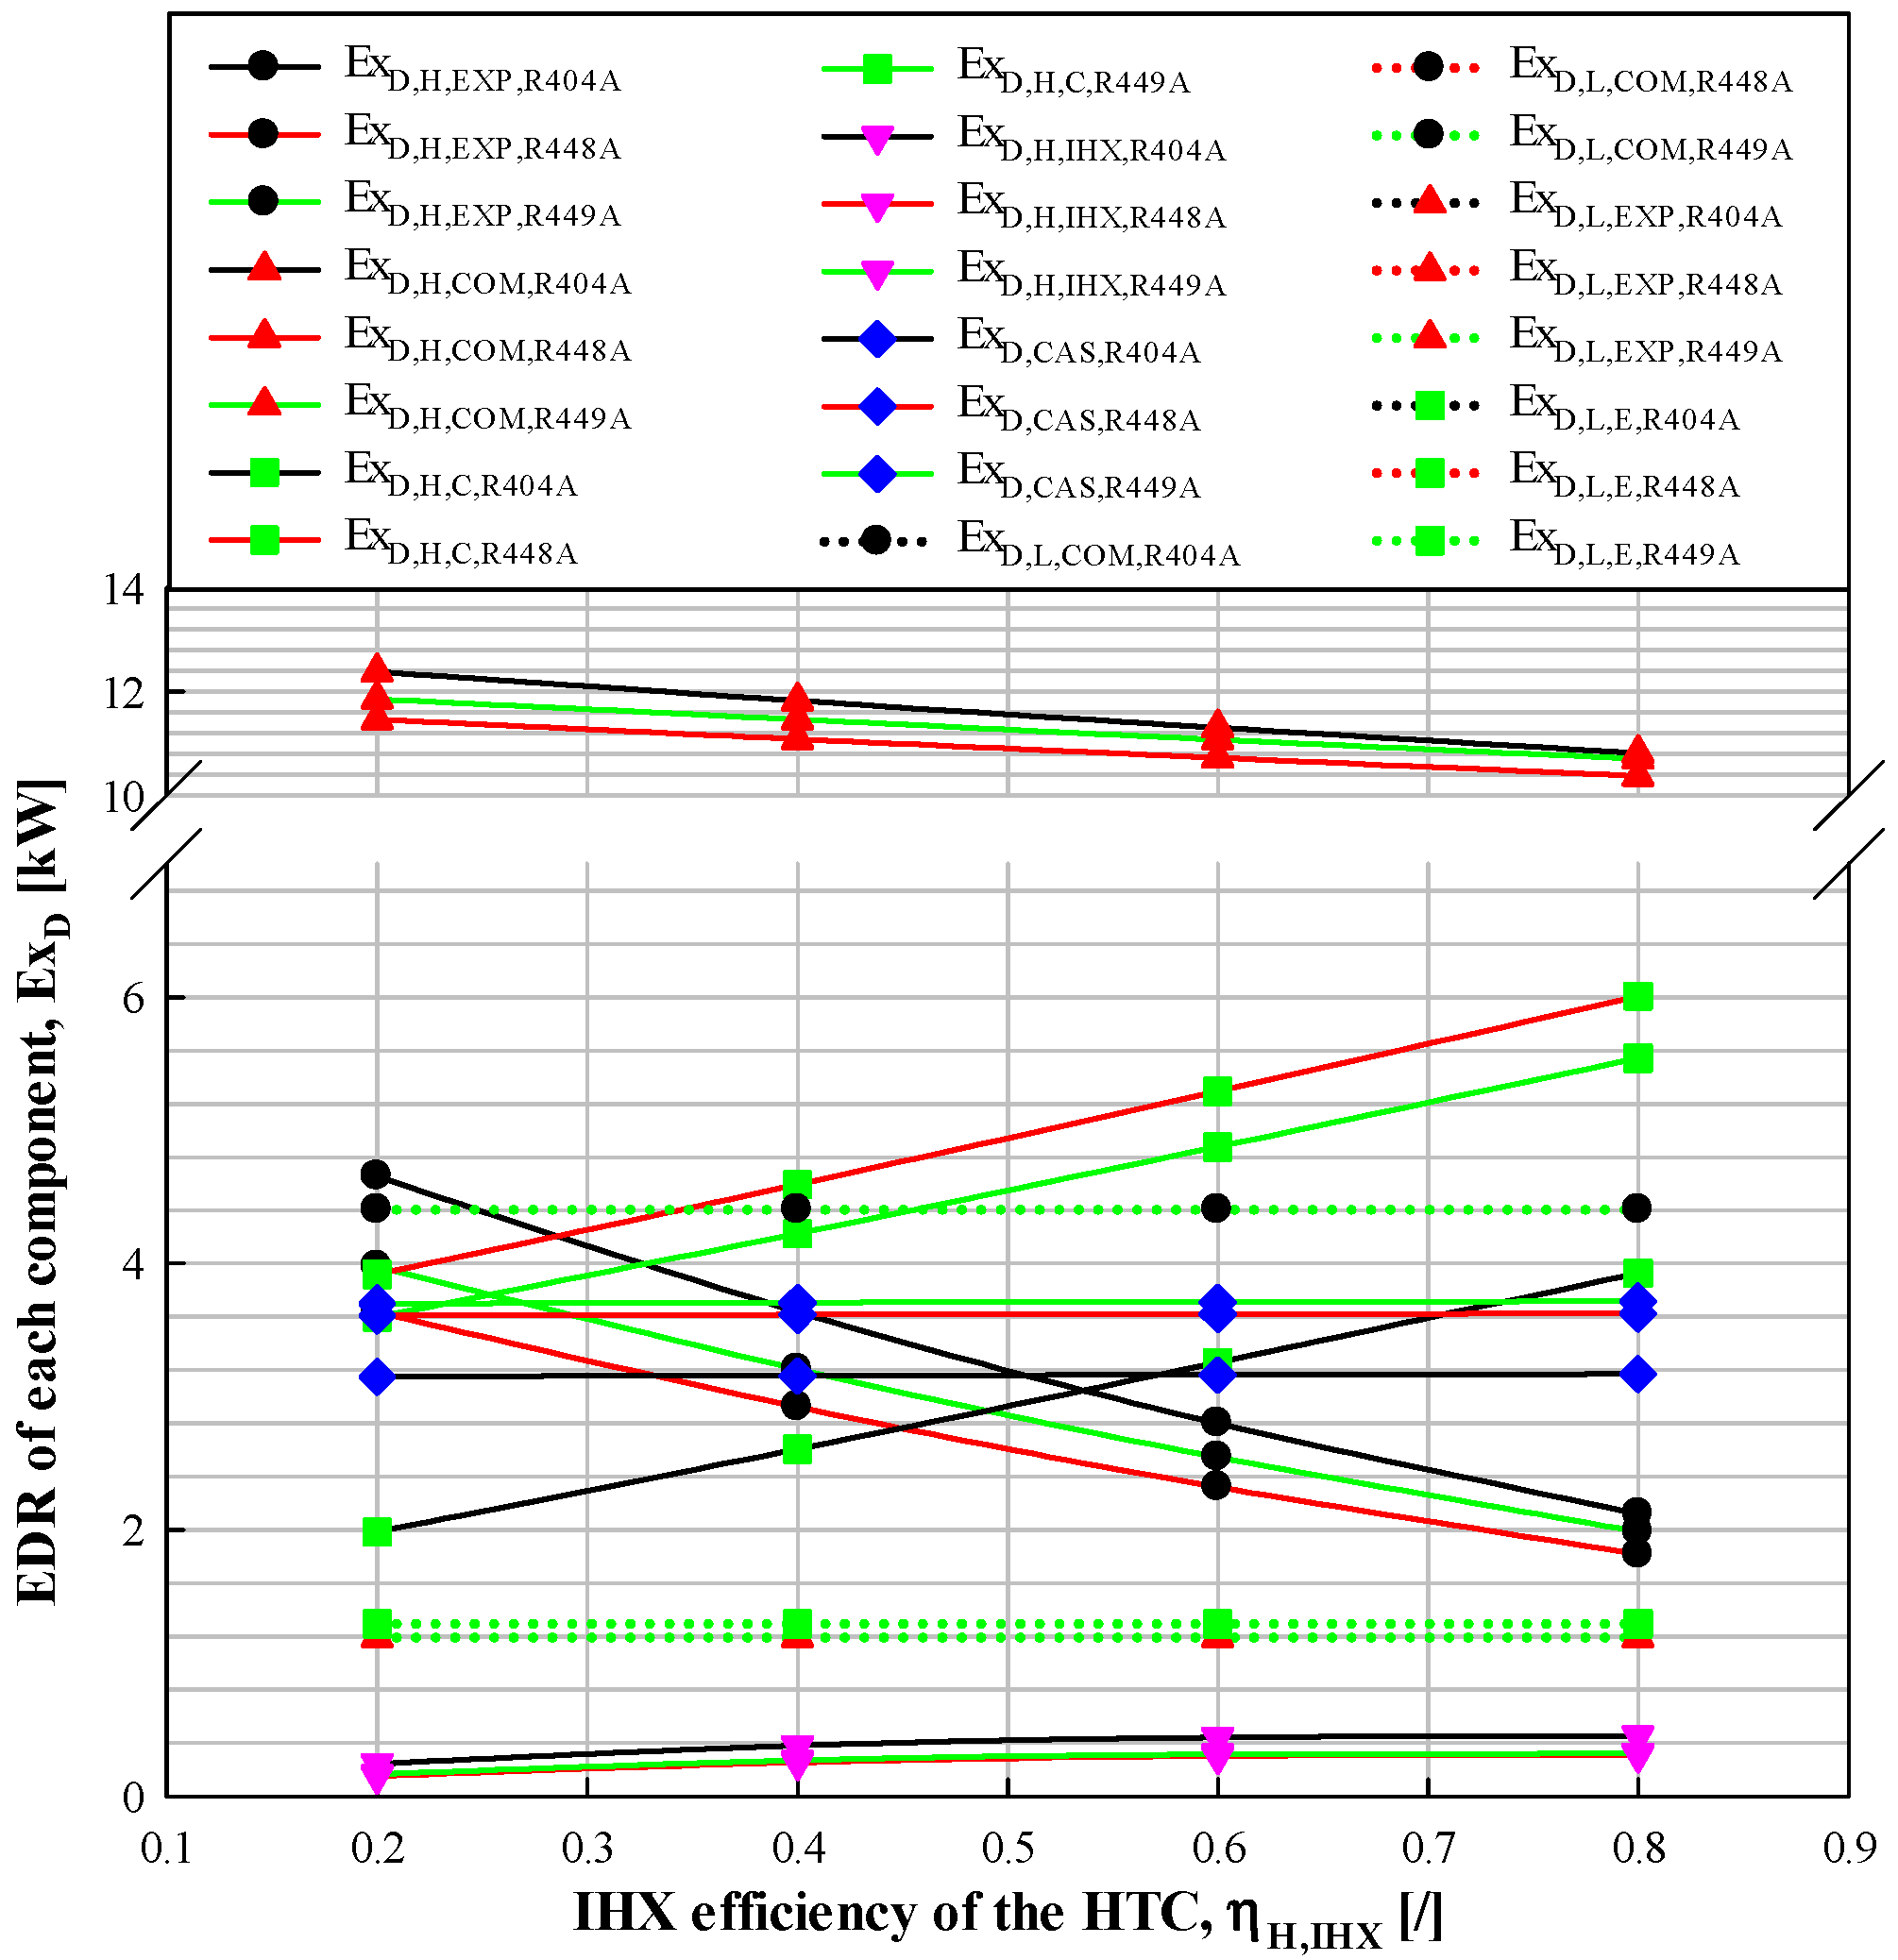
3.4. Effect of IHX Efficiency of the HTC
4. Conclusions
- To minimize system EDR, the DSC, DSH, IHX efficiency, ET of HTC should be increased to the maximum, and the DSH, CT, and temperature difference of CHX of LTC should be reduced to the minimum.
- In terms of system EDR and EE, R448A is more favorable than R449A when comparing R448A and R449A as a replacement refrigerant for R404A. Therefore, R744/R448A CRS is recommended to replace R744/R404A CRS.
- Under the given standard conditions, the highest change in system EDR based on R448A is the ET, followed by the CT, CET, and temperature difference of CHX, and the change due to other variables was less than 1 kW. Therefore, it is recommended to proceed with the design by considering the ET, CT, CET, and temperature difference of CHX in that order.
- In addition, the highest change rate of system EE due to R448A is the CET, followed by the temperature difference of CHX, ET, and DSC of HTC, and the change rate due to other variables is about 1% and can be ignored. Therefore, it is recommended to consider it when designing according to the order of the highest change rate.
- In particular, in the case of CHX, the system EDR is the smallest and the system EE is the largest at the inflection point (approximately −15.6 °C, −15.9 °C, −16 °C) depending on R404A, R448A, and R449A.
- When R448A is used in CRS’s HTC, for every 0.2 increase in HTC IHX efficiency, the EE of the system increases by 0.11–1.02% and the COP of system increases by 0.38–0.47%. Therefore, IHX is not recommended when applying R448A for economic and efficiency reasons.
- In the EDR of CRS components, the HTC compressor is the largest component, followed by the HTC expansion valve, LTC compressor, CHX, condenser, and evaporator, with the LTC expansion valve being the smallest.
Author Contributions
Funding
Data Availability Statement
Conflicts of Interest
Nomenclature
| ABBREVIATIONS | ||
| CE | Cascade evaporator | |
| CET | Cascade evaporation temperature | |
| CHX | Cascade heat exchanger | |
| COP | Coefficient of performance | |
| CR | Compression ratio | |
| CRS | Cascade refrigeration system | |
| CT | Condensation temperature | |
| DSC | Degree of subcooling | |
| DSH | Degree of superheating | |
| EC | Evaporation capacity | |
| EDR | Exergy destruction rate | |
| EE | Exergy efficiency | |
| ET | Evaporation temperature | |
| HTC | High-temperature cycle | |
| IE | Inlet enthalpy | |
| IHX | Internal heat exchanger | |
| IRS | Indirect refrigeration system | |
| LTC | Low-temperature cycle | |
| MFR | Mass flow rate | |
| OE | Outlet enthalpy | |
| SYMBOLS | ||
| COP | Coefficient of performance | - |
| h | Enthalpy | kJ/kg |
| Mass flow rate | kg/s | |
| Pressure | kPa | |
| Q | Heat capacity | kW |
| T | Temperature | °C |
| GREEK SYMBOLS | ||
| Difference | ||
| η | Efficiency | |
| SUPERSCRIPTS | ||
| M | Mechanical | |
| T | Thermal | |
| SUBSCRIPTS | ||
| C | Condensation | |
| CAS | Cascade heat exchanger | |
| COM | Compression | |
| D | Destruction | |
| E | Evaporation, Electromechanical | |
| Ex | Exergy | |
| EXP | Expansion valve | |
| H | High-temperature cycle | |
| IHX | Internal heat exchanger | |
| ISO | Isentropic | |
| L | Low-temperature cycle | |
| 0 | Atmospheric | |
| R404A | R404A refrigerant | |
| R448A | R448A refrigerant | |
| R449A | R449A refrigerant | |
| R744 | R744 refrigerant | |
| SUC | Degree of subcooling | |
| SUH | Degree of superheating | |
| SYS | Total system | |
| VOL | Volumetric |
References
- Cabello, R.; Andreu-Nácher, A.; Sánchez, D.; Llopis, R.; Vidan-Falomir, F. Energy comparison based on experimental results of a cascade refrigeration system pairing R744 with R134a, R1234ze(E) and the natural refrigerants R290, R1270, R600a. Int. J. Refrig. 2023, 148, 131–142. [Google Scholar] [CrossRef]
- Vaishak, S.; Singha, P.; Dasgupta, M.S.; Hafner, A.; Widell, K.; Bhattacharyya, S.; Saini, S.K.; Arun, B.S.; Samuel, M.P.; Ninan, G. Performance analysis of a CO2/NH3 cascade refrigeration system with subcooling for low temperature freezing applications. Int. J. Refrig. 2023, 153, 140–154. [Google Scholar] [CrossRef]
- Staubach, D.; Michel, B.; Revellin, R. Refrigerant selection from an economic and TEWI analysis of cascade refrigeration systems in Europe based on annual weather data. Appl. Therm. Eng. 2023, 230, 120747. [Google Scholar] [CrossRef]
- Shi, R.; Bai, T.; Wan, J. Performance analysis of a dual-ejector enhanced two-stage auto-cascade refrigeration cycle for ultra-low temperature refrigeration. Appl. Therm. Eng. 2024, 240, 122152. [Google Scholar] [CrossRef]
- Hinde, D.; Zha, S.; Lan, L. Carbon dioxide in north American supermarkets. ASHRAE J. 2009, 51, 18–26. Available online: https://19january2017snapshot.epa.gov/sites/production/files/documents/ASHRAE_CarbonDioxideSystems.pdf (accessed on 18 September 2024).
- Kruse, H. Refrigerant use in Europe. ASHRAE J. 2000, 42, 16–25. [Google Scholar]
- Queiroz, M.V.A.; Panato, V.H.; Antunes, A.H.P.; Parise, J.A.R.; Filho, E.P.B. Experimental comparison of a cascade refrigeration system operating with R744/R134a and R744/R404A. In Proceedings of the International Refrigeration and Air-Conditioning Conference, West Lafayette, IN, USA, 11–14 July 2016; Paper 1785. pp. 1–10. Available online: https://docs.lib.purdue.edu/cgi/viewcontent.cgi?params=/context/iracc/article/2784/&path_info=Contribution2530_final.pdf (accessed on 18 September 2024).
- Bivens, D.; Gage, C. Commercial Refrigeration Systems Emissions. In Proceedings of the 15th Annual Earth Technologies Forum, Washington, DC, USA, 13–15 April 2004. [Google Scholar]
- Pedersen, P.H. Evaluation of the Possibilities of Substituting Potent Greenhouse Gases (HFCs, PFCs and SF6). Environmental Project No. 771; Danish Environmental Protection Agency: Copenhagen, Denmark, 2003. [Google Scholar]
- COPELAND. Available online: https://e360blog.copeland.com/ten-tips-for-preventing-refrigerant-leaks-in-supermarket-systems/ (accessed on 10 August 2024).
- COOLING POST. Available online: https://www.coolingpost.com/world-news/us-supermarket-to-pay-400k-for-refrigerant-leaks/ (accessed on 10 August 2024).
- Wikipedia, List of Refrigerants. Available online: https://en.wikipedia.org/wiki/List_of_refrigerants#cite_note-ASHRAE2007-34m-v-10 (accessed on 25 July 2021).
- Citarella, B.; Viscito, L.; Mochizuki, K.; Mauro, A.W. Multi-criteria (thermo-economic) optimization and environmental analysis of a food refrigeration system working with low environmental impact refrigerants. Energy Convers. Manag. 2022, 253, 115152. [Google Scholar] [CrossRef]
- Alam, M.d.S.; Jeong, J.H. Calculation of the thermodynamic properties of R448A and R449A in a saturation temperature range of 233.15 K to 343.15 K using molecular dynamics simulations. Int. Commun. Heat Mass Transf. 2020, 116, 104717. [Google Scholar] [CrossRef]
- Kedzierski, M.A.; Kang, D.G. Horizontal Convective Boiling of R448A, R449A, and R452B within a Micro-Fin Tube. Sci. Technol Built Environ. 2016, 22, 1090–1103. Available online: https://www.researchgate.net/publication/303848958 (accessed on 18 September 2024). [CrossRef]
- Lillo, G.; Mastrullo, R.; Mauro, A.W.; Pelella, F.; Viscito, L. Experimental thermal and hydraulic characterization of R448A and comparison with R404A during flow boiling. Appl. Therm. Eng. 2019, 161, 114146. [Google Scholar] [CrossRef]
- Kim, C.H.; Kim, N.-H. Evaporation heat transfer of the low GWP alternative refrigerants (R-448A, R-449A, R-455A, R-454C) for R-404A in a microfin tube. Int. J. Refrig. 2021, 128, 118–128. [Google Scholar] [CrossRef]
- Lee, B.-M.; Gook, H.-H.; Lee, S.-B.; Lee, Y.-W.; Park, D.-H.; Kim, N.-H. Condensation heat transfer and pressure drop of low GWP R-404A alternative refrigerants (R-448A, R-449A, R-455A, R-454C) in a 5.6 mm inner diameter horizontal smooth tube. Int. J. Refri. 2021, 128, 71–82. [Google Scholar] [CrossRef]
- Jacob, T.A.; Matty, E.P.; Fronk, B.M. Comparison of R404A condensation heat transfer and pressure drop with low global warming potential replacement candidates R448A and R452A. Int. J. Refrig. 2020, 116, 9–22. [Google Scholar] [CrossRef]
- Rogstam, J.; Bolteau, S.; Makhnatch, P.; Khodabandeh, R. Evaluation of a Potential R404A Replacement-Field Test with R449A, Kylbranschens Samarbetsstiftelse, Stockholm, 28 November 2016. Available online: https://www.kys.se/wp-content/uploads/F%C3%A4ltm%C3%A4tning-R449A-28NOV16.pdf (accessed on 18 September 2024).
- Makhnatch, P.; Mota-Babiloni, A.; Rogstam, J.; Khodabandeh, R. Retrofit of lower GWP alternative R449A into an existing R404A indirect supermarket refrigeration system. Int. J. Refrig. 2017, 76, 184–192. [Google Scholar] [CrossRef]
- Ghanbarpour, M.; Mota-Babiloni, A.; Makhnatch, P.; Badran, B.E.; Rogstam, J.; Khodabandeh, R. ANN Modeling to analyze the R404A replacement with the low GWP alternative R449A in an indirect supermarket refrigeration system. Appl. Sci. 2021, 11, 11333. [Google Scholar] [CrossRef]
- Mota-Babiloni, A.; Giménez-Prades, P.; Makhnatch, P.; Rogstam, J.; Fernández-Moreno, A.; Navarro-Esbrí, J. Semi-empirical analysis of HFC supermarket refrigeration retrofit with advanced configurations from energy, environmental, and economic perspectives. Int. J. Refrig. 2022, 137, 257–271. [Google Scholar] [CrossRef]
- Giménez-Prades, P.; Navarro-Esbrí, J. Cosmin-Mihai Udroiu and Adrián Mota-Babiloni, Influence of subcooling in R-449A supermarket refrigeration system and screening of refrigerant mixtures for its energetic and environmental improvement. Appl. Therm. Eng. 2024, 236, 121787. [Google Scholar] [CrossRef]
- Mota-Babiloni, A.; Navarro-Esbrí, J.; Peris, B.; Molés, F.; Verdú, G. Experimental evaluation of R448A as R404A lower-GWP alternative in refrigeration systems. Energy Convers. Manag. 2015, 105, 756–762. [Google Scholar] [CrossRef]
- Deng, Q.; Zhang, Z.; Hu, X. Thermoeconomic and environmental analysis of an inverter cold storage unit charged R448A. Sustain. Energy Technol. Assess. 2021, 45, 101159. [Google Scholar] [CrossRef]
- Vaitkus, L.; Dagilis, V. Analysis of alternatives to high GWP refrigerants for eutectic refrigerating systems. Int. J. Refrig. 2017, 76, 160–169. [Google Scholar] [CrossRef]
- Ustaoglu, A.; Kursuncu, B.; Kaya, A.M.; Caliskan, H. Analysis of vapor compression refrigeration cycle using advanced exergetic approach with Taguchi and ANOVA optimization and refrigerant selection with enviroeconomic concerns by TOPSIS analysis. Sustain. Energy Technol. Assess. 2022, 52, 102182. [Google Scholar] [CrossRef]
- Altinkaynak, M. Exergetic performance analysis of low GWP alternative refrigerants for R404A in a refrigeration system. Int. J. Low-Carbon Technol. 2021, 16, 842–850. [Google Scholar] [CrossRef]
- Jeon, M.-J. Thermodynamic Comparative Analysis of Cascade Refrigeration System Pairing R744 with R404A, R448A and R449A with Internal Heat Exchanger. Part 1-Coefficient of Performance Characteristics. Energies 2024, 17, 4481. [Google Scholar] [CrossRef]
- “Diario Oficial de la Uni’on Europea. REGLAMENTO (UE) 2019/1781 DE LA COMISI’ON de 1 de octubre de 2019”. Diario Oficial de la Uni’on Europea. 2019. Available online: https://www.boe.es/doue/2019/272/L00075-00094.pdf (accessed on 18 September 2024).
- Calm, J.M.; Hourahan, G.C. Physical, safety, and environmental data for current and alternative refrigerants. In Proceedings of the 23rd International Congress of Refrigeration, Prague, Czech Republic, 21–26 August 2011; Available online: http://www.hourahan.com/wp/wp-content/uploads/2010/08/2011-Physical-Safety-and-Environmental-Data2.pdf (accessed on 18 September 2024).
- Australian-Government, Global Warming Potential Values of Hydrofluorocarbon Refrigerants, Department of Climate Change, Energy, the Environment and Water, Refrigeration and Air Conditioning. 2021. Available online: https://www.dcceew.gov.au/environment/protection/ozone/rac/global-warming-potential-values-hfc-refrigerants#daff-page-main (accessed on 18 September 2024).
- Lemmon, E.W.; Huber, M.L.; McLinden, M.O. NIST Standard Reference Database 23: Reference Fluid Thermodynamic and Transport Properties-REFPROP, Version 9.0. 2010. Available online: https://www.nist.gov/publications/nist-standard-reference-database-23-reference-fluid-thermodynamic-and-transport (accessed on 18 September 2024).
- Euro Refrigerant-Refrigerant Gas and Tools. Available online: https://www.eurorefrigerant.com (accessed on 18 September 2024).
- Refrigerantionline. Available online: https://refrigerantionline.com/en/ (accessed on 18 September 2024).
- Nicola, G.D.; Giuliani, G.; Polonara, F.; Stryjek, R. Blends of carbon dioxide and HFCs as a working fluids for the low-temperature circuit in cascade refrigerating systems. Int. J. Refrig. 2005, 28, 130–140. [Google Scholar] [CrossRef]
- Jeon, M.-J. Experimental Analysis of the R744/R404A Cascade Refrigeration System with Internal Heat Exchanger. Part 2: Exergy Characteristics. Energies 2022, 15, 1251. [Google Scholar] [CrossRef]
- Bai, T.; Yu, J.; Yan, G. Advanced exergy analysis on a modified auto-cascade freezer cycle with an ejector. Energy 2016, 113, 385–398. [Google Scholar] [CrossRef]
- Sun, Z.; Liang, Y.; Liu, S.; Ji, W.; Zang, R.; Liang, R.; Guo, Z. Comparative analysis of thermodynamic performance of a cascade refrigeration system for refrigerant couples R41/R404A and R23/R404A. Appl. Energy 2016, 184, 19–25. [Google Scholar] [CrossRef]
- Morosuk, T.; Tsatsaronis, G. Advanced exergetic evaluation of refrigeration machines using different working fluids. Energy 2009, 34, 2248–2258. [Google Scholar] [CrossRef]
- Vatani, A.; Mehrpooya, M.; Palizdar, A. Advanced exergetic analysis of five natural gas liquefaction processes. Energy Convers. Manag. 2014, 78, 720–737. [Google Scholar] [CrossRef]


| System | R404A | R449A |
|---|---|---|
| HTC | = −0.0379CR + 0.9944 = −0.0213CR2 + 0.2293CR + 0.0045 | = −0.0412CR + 0.9865 = −0.0079CR2 + 0.105CR + 0.2718 |
| LTC | = −0.0046CR2 − 0.0073CR + 0.7253 | |
| Refrigerant | R404A | R448A | R449A |
|---|---|---|---|
| Molar mass (kg/kmol) | 97.6 | 86.3 | 87.2 |
| Boiling point (°C) | −46.2 | −46.0 | −46.0 |
| Critical temperature (°C) | 72 | 83.7 | 81.5 |
| Critical pressure (kPa) | 3730 | 4660 | 4450 |
| GWP (100 yr) | 3922 | 1387 | 1397 |
| k (W/mK) | 0.067 | 0.088 | 0.080 |
| Chemical formula [37] | R125/143a/134a | R32/R125/R134a/R1234yf/R1234ze | R32/R125/R134a/R1234yf |
| (44%/52%/4%) | (26%/26%/21%/20%/7%) | (24.3%/24.7%/25.7%/25.3%) |
| Cycle | Component | , kW | , kW | , kW |
|---|---|---|---|---|
| HTC(R404A/R448A/R449A) | Compressor (1→2) | (- | ||
| Condenser (2→4) | () | |||
| Internal heat exchanger (4→5, 8→1) | () () | |||
| Expansion valve (5→6) | () () | |||
| Cascade heat exchanger (6→8, 12→14) | () () | |||
| LTC (R744) | ||||
| Compressor (11→12) | ( | |||
| Expansion valve (14→15) | () () | |||
| Evaporator (15→11) | () |
| Division | Parameter | Range | Unit |
|---|---|---|---|
| HTC (R404A/R448A/R449A) | 30, 35, 40 *, 45, 50 | °C | |
| 0.94 * | - | ||
| 0 *, 0.2, 0.4, 0.6, 0.8 | – | ||
| 1 *, 3, 5, 7, 9 | °C | ||
| 0, 5, 10 *, 15, 20 | °C | ||
| −25, −20, −15 *, −10, −5 | °C | ||
| 1, 3, 5 *, 7, 9 | °C | ||
| LTC (R744) | |||
| 0.94 * | - | ||
| 1 * | °C | ||
| 0, 5, 10 *, 15, 20 | °C | ||
| −50, −45, −40 *, −35, −30 | °C | ||
| 50 * | kW | ||
| Atmospheric conditions | 25 * | °C | |
| 101.325 * | kPa |
Disclaimer/Publisher’s Note: The statements, opinions and data contained in all publications are solely those of the individual author(s) and contributor(s) and not of MDPI and/or the editor(s). MDPI and/or the editor(s) disclaim responsibility for any injury to people or property resulting from any ideas, methods, instructions or products referred to in the content. |
© 2024 by the authors. Licensee MDPI, Basel, Switzerland. This article is an open access article distributed under the terms and conditions of the Creative Commons Attribution (CC BY) license (https://creativecommons.org/licenses/by/4.0/).
Share and Cite
Jeon, M.-J.; Lee, J.-H. Thermodynamic Comparative Analysis of Cascade Refrigeration System Pairing R744 with R404A, R448A and R449A with Internal Heat Exchanger: Part 2—Exergy Characteristics. Energies 2024, 17, 4708. https://doi.org/10.3390/en17184708
Jeon M-J, Lee J-H. Thermodynamic Comparative Analysis of Cascade Refrigeration System Pairing R744 with R404A, R448A and R449A with Internal Heat Exchanger: Part 2—Exergy Characteristics. Energies. 2024; 17(18):4708. https://doi.org/10.3390/en17184708
Chicago/Turabian StyleJeon, Min-Ju, and Joon-Hyuk Lee. 2024. "Thermodynamic Comparative Analysis of Cascade Refrigeration System Pairing R744 with R404A, R448A and R449A with Internal Heat Exchanger: Part 2—Exergy Characteristics" Energies 17, no. 18: 4708. https://doi.org/10.3390/en17184708