Article

Impact of the Location and Energy Carriers Used on Greenhouse Gas Emissions from a Building

by
Grzegorz Nawalany
1,
Miroslav Zitnak
2,
Małgorzata Michalik
1,*,
Jana Lendelova
2 and
Paweł Sokołowski
1
1
Department of Rural Building, Faculty of Environmental Engineering and Land Surveying, University of Agriculture in Krakow, al. Mickiewicza 24/28, 30-059 Krakow, Poland
2
Faculty of Engineering, Institute of Agricultural Engineering, Transport and Bioenergetics, Slovak University of Agriculture in Nitra, Trieda Andreja Hlinku 2, 94976 Nitra, Slovakia
*
Author to whom correspondence should be addressed.
Energies 2024, 17(19), 4761; https://doi.org/10.3390/en17194761
Submission received: 30 August 2024 / Revised: 18 September 2024 / Accepted: 20 September 2024 / Published: 24 September 2024
(This article belongs to the Section B: Energy and Environment)

Abstract

:
The growth in population increases greenhouse gas (GHG) emissions into the environment. High GHG emissions are attributed to meat production, due to its high energy demand. The largest carbon footprint in the production of poultry meat is generated by combustion. This paper deals with the problem of greenhouse gas emissions (total dust, CO, CO2, NOx, SOx and benzo(a)pyrene) resulting from the generation of energy for heating broiler houses located in different locations in Europe. The study includes continuous measurements of selected microclimate parameters: temperature and relative humidity inside and outside the building, floor temperature, wind speed and direction, and solar radiation intensity. Validation and calibration of the model, emission calculations, and analysis of the obtained results were conducted. Eighteen design variants were assumed, differentiated by the heating fuel used (hard coal, fuel oil, gaseous fuels), material and construction solutions for the floor and the location of the facility. The analysis showed that CO2 emissions for a facility located in northern Europe are 123,153 kg higher compared to the same building located in southern Europe. In addition, increasing the floor’s thermal resistance by 3.69 m2·K·W−1 reduced harmful gas emissions by an average of 5.7% for each of the locations analysed.

1. Introduction

Greenhouse gas (GHG) emissions contribute to climate change. Between the years 2010 and 2020, the population increased by 12%. This results in less forested areas and more productive areas, thus higher GHG emissions [1]. GHGs of greatest concern include CO2, N2O and CH4 [2]. It is estimated that the agricultural sector is responsible for about 14% of GHG emissions, with three-quarters of these emissions attributed to meat production. This is caused by high energy, water and space demands [3,4,5,6,7]. Nitrous oxide (N2O) and methane are naturally occurring gases in agriculture. The dairy industry is a major contributor to GHG production, caused by methane generation by cows. Direct emissions of harmful gases, from the agricultural industry, include emissions from the consumption of fossil fuels or electricity; indirect emissions include transport as defined, for example, by the delivery of fodder to the farm [2,8].
In 2007, a carbon footprint (CF) labelling system was set up in the United Kingdom. It defines CO2, N2O and CH4 emissions expressed in terms of carbon dioxide equivalent (CO2e). Thus, the carbon footprint is defined as a measure of the total CO2 emissions of a specific product, during its entire life cycle [2,5]. Meat production is considered to have a high carbon footprint resulting in high pressure on this sector of agriculture to reduce CO2e. Due to production efficiency, in terms of bird growth and fodder intake rates, broiler chickens are used [9,10]. The poultry industry’s CO2e emissions come from the use of fossil fuels, fodder production or manure management [2,11]. According to Dunkley et al. (2015) [2], the highest CO2e emissions from the broiler house were generated by combustion over 96%, while transport accounted for 0.33%.
International organisations increasingly require that renewable energy sources be used, which are cleaner than fossil fuels, among others, which have a major impact on global warming [12]. Emissions of harmful pollutants from emitters located at a height of 40 m or less are called “low emissions”. In heating facilities with poor-quality fuels, the use of low-efficiency boilers or insufficient insulation all contribute to the increased release of harmful substances into the air. Low emissions are therefore the result of the inefficient combustion of fuel. Due to the low height of emitters, low emissions have a remarkably high impact on air quality in the human habitation zone. The products of low emissions include particulate matters (PM10, PM5 or PM2.5), CO, CO2, SOx, NOx, heavy metals (mercury, cadmium, lead, manganese, chromium), and benzo(a)pyrene. [13,14,15].
Global climate change is leading to stricter regulations on the emission of harmful pollutants into the air. This also affects the construction sector and, consequently, livestock buildings. The production of broilers involves a particular use and has a high energy demand [14,16,17]. Broiler rearing time is between four and six weeks. These birds are particularly susceptible to heat stress during the first days of rearing. Improper management of the microclimate in the broiler house results in inhibited growth rates and even mortality. Therefore, broiler houses require constant monitoring of the microclimate inside the facility and most of the energy in the building is used to ensure comfortable conditions inside the poultry house. [14,18,19].
Taking into account that the agricultural sector, and meat production in particular, is responsible for a significant part of GHG emissions, the authors of this study focused their analysis on the pollution from an agricultural building. Broiler houses are characterized by high energy demand, which is mainly used to heat the building [18,19]. Most studies focus on maintaining an appropriate interior microclimate, climate change, energy consumption or equipment used [20,21,22,23], and there is a lack of research on the analysis of pollutant emissions from heating the broiler house. The analysis presented in this paper is only related to the direct pollutant emissions arising from the generation of energy to heat the broiler house, using different fuels. The analysis does not consider the pollutant emissions generated during the transport of fuel to the facility and the pollutant emissions generated by the birds’ breeding. In their study, the authors focused only on the low-emission products (i.e., total dust, CO2, CO, NOx, SOx and benzo(a)pyrene) resulting from the combustion of fuels to ensure optimal thermal conditions in the building.
The results shown here are a continuation of previous research focusing on pollutant emissions produced as a result of energy generation for heating, in southern Poland [14]. The following results aim to analyse low emissions assuming different building locations in Europe. This will allow an assessment of the impact of climate, resulting from different locations and material and construction floor solutions, on GHG emissions. The pollutant emissions analysis is based on measured data and the results of numerical analyses.

2. Materials and Methods

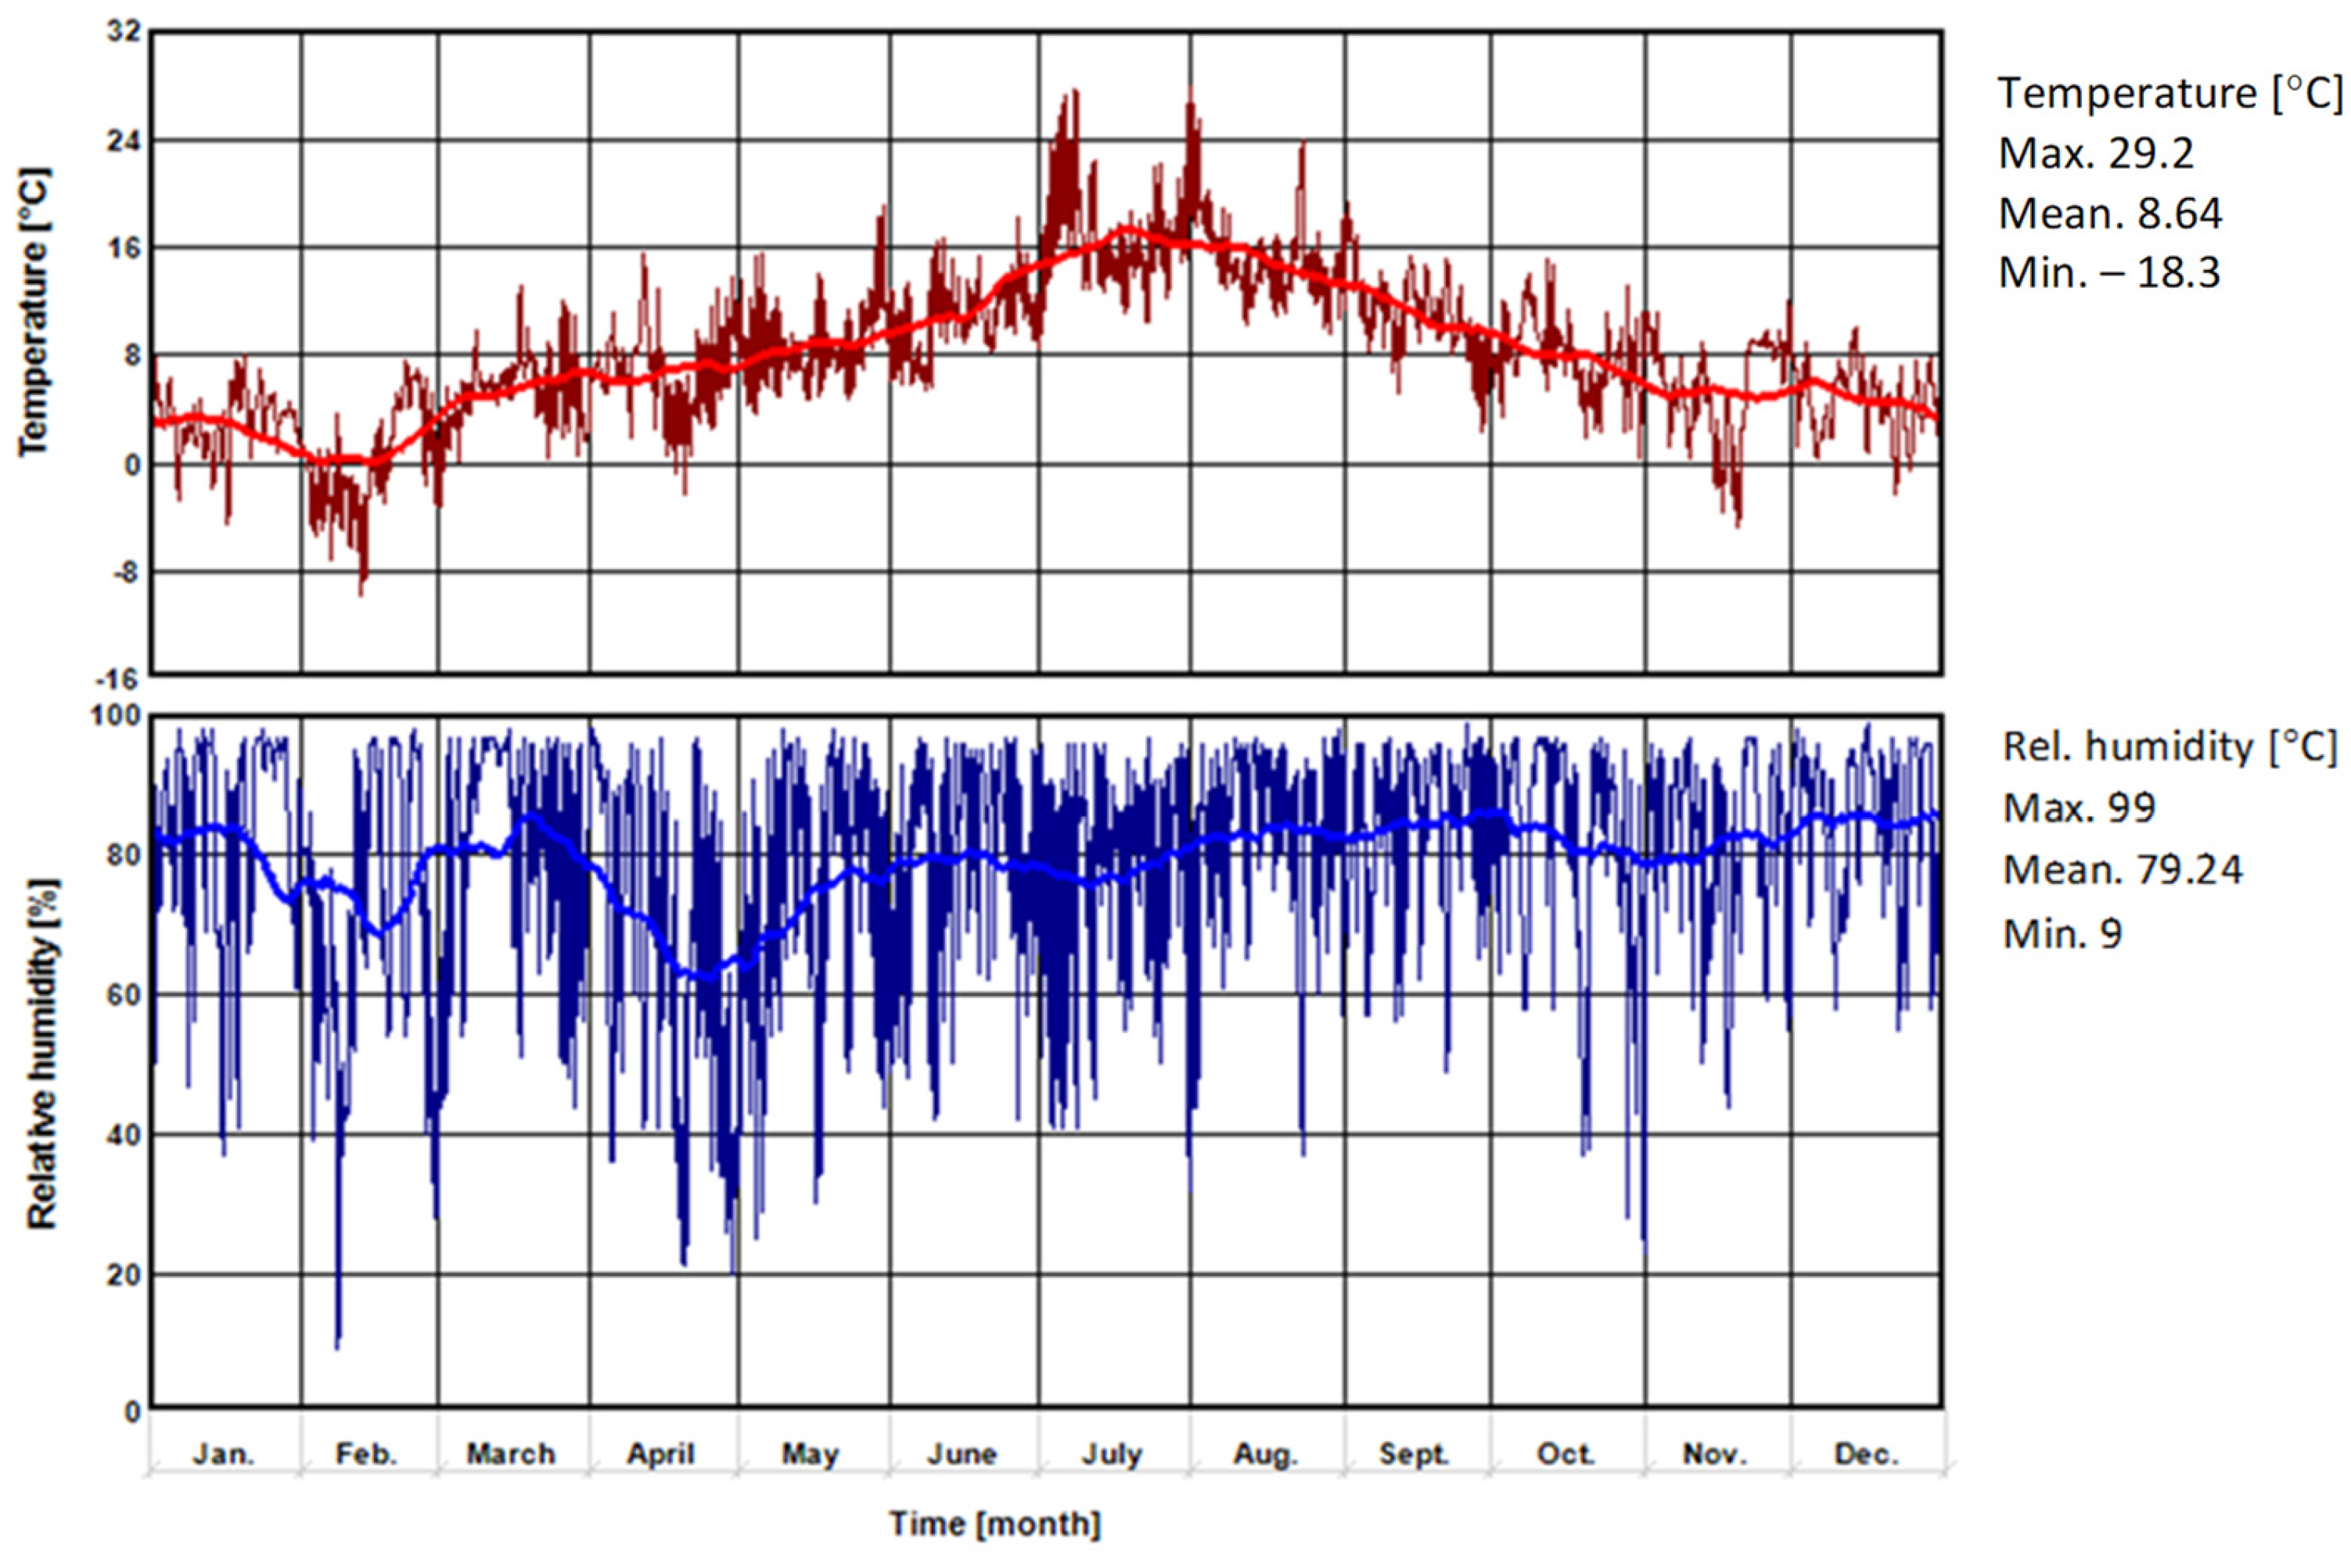
2.1. Research Facility

The study, conducted over a period of two years, on a large-scale poultry farm, in southern Poland, provided the basis for the calculations. The broiler houses were built using masonry technology. The external walls were made of 24 cm thick cellular concrete and heat-insulated with 10 cm thick EPS. The walls were erected on 24 cm thick concrete foundations, positioned 1.0 m below ground level. The floor of the building was laid in layers; it consists of 20 cm of gravel and sand bedding and 20 cm of concrete screed. Throughout the production cycle, the floor in the broiler house is covered with a minimal layer of bedding (3 cm layer of straw). The ceiling in the building consists of UPN 140 steel channels and a 10 cm thick layer of mineral wool laid between them. The bottom of the ceiling was finished with galvanised steel sheeting.
The building under study is equipped with wall-mounted tubular heating, supported by fan heating. The facility also has ventilation and fogging systems. Feeding and watering of the birds is conducted with automated feeders and drinkers. At the time of the study, Ross broiler chickens did not suffer from bacterial or viral diseases and there were no other factors that could significantly affect the farming.

2.2. Measuring Apparatus

Measurements in the broiler house were conducted between October 2019 and October 2021. The control and measurement equipment used for the study included PT-100 sensors with a resolution of 0.1 °C and a measurement error of ±0.1 °C. Data loggers were used to measure air temperature inside and outside the facility. DTH22 sensors with a measuring range of 0–100% and an accuracy of 0.3% were used to measure air relative humidity outside and inside the building. The tests of air temperature and relative humidity inside the building were conducted at a height of 30 cm above the floor (bird habitation zone).
The surveys were carried out continuously, with a measurement frequency of every 15 min. Measurements were conducted at 14 measurement points (Figure 1). At the points marked θA1–θA3, θB1–θB3, the indoor air temperature of the building was measured. At points RhA1–RhA3, RhB1–RhB3 the relative humidity inside the building was measured, while at points θp1–θp8 the floor temperature was measured.

2.3. Numerical Analysis

The numerical analysis was carried out using the elementary balance method (EBM). The model was divided into balancing-differential elements, and for each element created, an energy and temperature balance was calculated, assuming a 1 h time step. The heat flow through the analysed area is calculated in non-stationary terms, assuming a time interval:
ΔQ = Δτ (Φixiyiz,ix+1iyiz + Φixiyiz,ix−1iyiz + Φixiyiz,ixiyiz+1 + Φixiyiz,ixiyiz−1 + Φixiyiz,ixiy+1iz + Φ ixiyiz,ixiy−1iz)
where i—element number; Φixiyiz,…—heat flux between element ix, iy, iz and adjacent elements [W].
The calculations were based on a system of balance-differential equations, which consider the boundary conditions and the initial conditions, considering the temperature distribution in the previous time step. The energy balance equation for the geometric model created can be written using, for example, the Crank–Nicolson differential quotient:
C i x i y i z · θ i x i y i z k + 1 θ i x i y i z k = 1 2 τ A i x i y i z , i x + 1 i y i z R i x i y i z , i x + 1 i y i z · θ i x + 1 i y i z k θ i x i y i z k + A i x i y i z , i x 1 i y i z R i x i y i z , i x 1 i y i z · θ i x 1 i y i z k θ i x i y i z k + A i x i y i z , i x i y i z + 1 R i x i y i z , i x i y i z + 1 · θ i x i y i z + 1 k θ i x i y i z k + A i x i y i z , i x i y i z 1 R i x i y i z , i x i y i z 1 · θ i x i y i z 1 k θ i x i y i z k + A i x i y i z , i x i y + 1 i z R i x i y i z , i x i y + 1 i z · θ i x i y + 1 i z k θ i x i y i z k + A i x i y i z , i x i y 1 i z R i x i y i z , i x i y 1 i z · θ i x i y 1 i z k θ i x i y i z k + A i x i y i z , i x + 1 i y i z R i x i y i z , i x + 1 i y i z · θ i x + 1 i y i z k + 1 θ i x i y i z k + 1 + A i x i y i z , i x 1 i y i z R i x i y i z , i x 1 i y i z · θ i x 1 i y i z k + 1 θ i x i y i z k + 1 + A i x i y i z , i x i y i z + 1 R i x i y i z , i x i y i z + 1 · θ i x i y i z + 1 k + 1 θ i x i y i z k + 1 + A i x i y i z , i x i y i z 1 R i x i y i z , i x i y i z 1 · θ i x i y i z 1 k + 1 θ i x i y i z k + 1 + A i x i y i z , i x i y + 1 i z R i x i y i z , i x i y + 1 i z · θ i x i y + 1 i z k + 1 θ i x i y i z k + 1 + A i x i y i z , i x i y 1 i z R i x i y i z , i x i y 1 i z · θ i x i y 1 i z k + 1 θ i x i y i z k + 1
where
  • C—total heat capacity of an element [J·K−1];
  • θk+1—time step temperature k + 1 [K];
  • θk—time step temperature k [K];
  • Δτ—time step [s];
  • A—surface area through which heat flows between elements [m2];
  • R—thermal resistance [m2·K·W−1].
An appropriately validated and calibrated calculation model allowed calculations to be conducted for the assumed variants.
This study analysed the impact of the building’s location, material and construction floor solutions and the variation in terms of the heating device used on emissions of pollutants such as total dust, CO2, CO, NOx, SOx and benzo(a)pyrene. Three locations were adopted Jyväskylä (Finland), Graz (Austria) and Kassel (Germany). For this purpose, calculations were based on climate data available in WUFI®plus (version 3.5), for a typical meteorological year (TRY) at the selected locations. The basic climatic parameters that were included in the simulation, for each of the selected locations, are shown in Figure 2, Figure 3 and Figure 4.
Eighteen calculation options were adopted for the purpose of calculations, differentiated according to the location of the building (three locations), material and construction floor solutions and the heating device used (Table 1).
Calculations were made with WUFI®Plus software. The first step of the numerical analysis was the validation of the computational model, for which a geometrical model of the building under study and the results of measurements were created. Both heating and ventilation systems located in the building were also included in the simulation. Physical parameters of the soil as well as the building materials of the partitions were considered when creating the model (Table 2).
The same thermal and humidity conditions inside the facility were adopted for each calculation option. These are dictated by the microclimate requirements for this type of facility and the broiler chicken production.

2.4. Facility Pollutant Emissions

Calculations of pollutant emissions, resulting from fuel combustion, were made based on the energy demand of the facility. Calculations of the energy demand of a large-scale poultry farm, in individual variants, were made using the WUFIplus® software. The analysis includes pollutant emissions from one production hall in eighteen calculation options.
The annual fuel demand (B) can be calculated using Formula (3):
B = Q Wo   · η [ kg · year 1 ]
where
  • B—annual fuel demand [kg·year−1];
  • Q—annual heat demand [MJ];
  • Wo—fuel calorific value [MJ·year−1];
  • η—boiler efficiency [–].
Calorific values were adopted from tables containing data on calorific values [24]. Table 3 shows the Wo values adopted for the calculations.
Calculations of pollutant emissions from fuel combustion were made considering pollutant emission factors based on KOBiZE data [25], in which data are based on assumptions in Directive 2003/87/EC [26]. Calculations were made based on Formula (4). Pollutants that are products of low emissions were assumed for the analysis. The pollutant emitter is located at a height of less than 40 m. Low-emission products include total dust, CO, CO2, SOx, NOx and benzo(a)pyrene. Resulting from inefficient combustion of fuels [14,15,27]. The values of the pollutant emission factors are shown in Table 4.
E = B   ·   Wo   ·   EF 1000000         k g
where
  • E—pollutant emission [kg];
  • B—annual fuel demand [Mg];
  • Wo—calorific value [kJ·year−1];
  • EF—emission factor [g·GJ−1].
The calculation of the bird stock density in the production hall per large livestock conversion unit (LCU) was made on the basis of the conversion coefficients of actual animals per LCU contained in the Decree of the Council of Ministers of 31 January 2023 [28].
1 LCU = L·0.0036
where
  • L—livestock density [pcs.];
  • 0.0036—Conversion rate of actual broiler chickens to LCU.
The results obtained made it possible to conduct an analysis of pollutant emissions resulting from the combustion of fuels, for heating purposes. The results of calculations of individual options have been analysed and discussed later in the article. In addition, the results have been compared with data presented in the article [14] on pollutant emissions from a large-scale poultry farm located in Poland.

3. Results

3.1. Validation of the Computational Model

Validation of the computational model was carried out based on the results of field measurements. For the results obtained, a correlation analysis was performed, the data obtained did not have a normal distribution, so the calculation of correlation based on Spearman’s rank test was performed, and was 0.7. Figure 5 shows the floor temperature waveforms for selected measurement points.

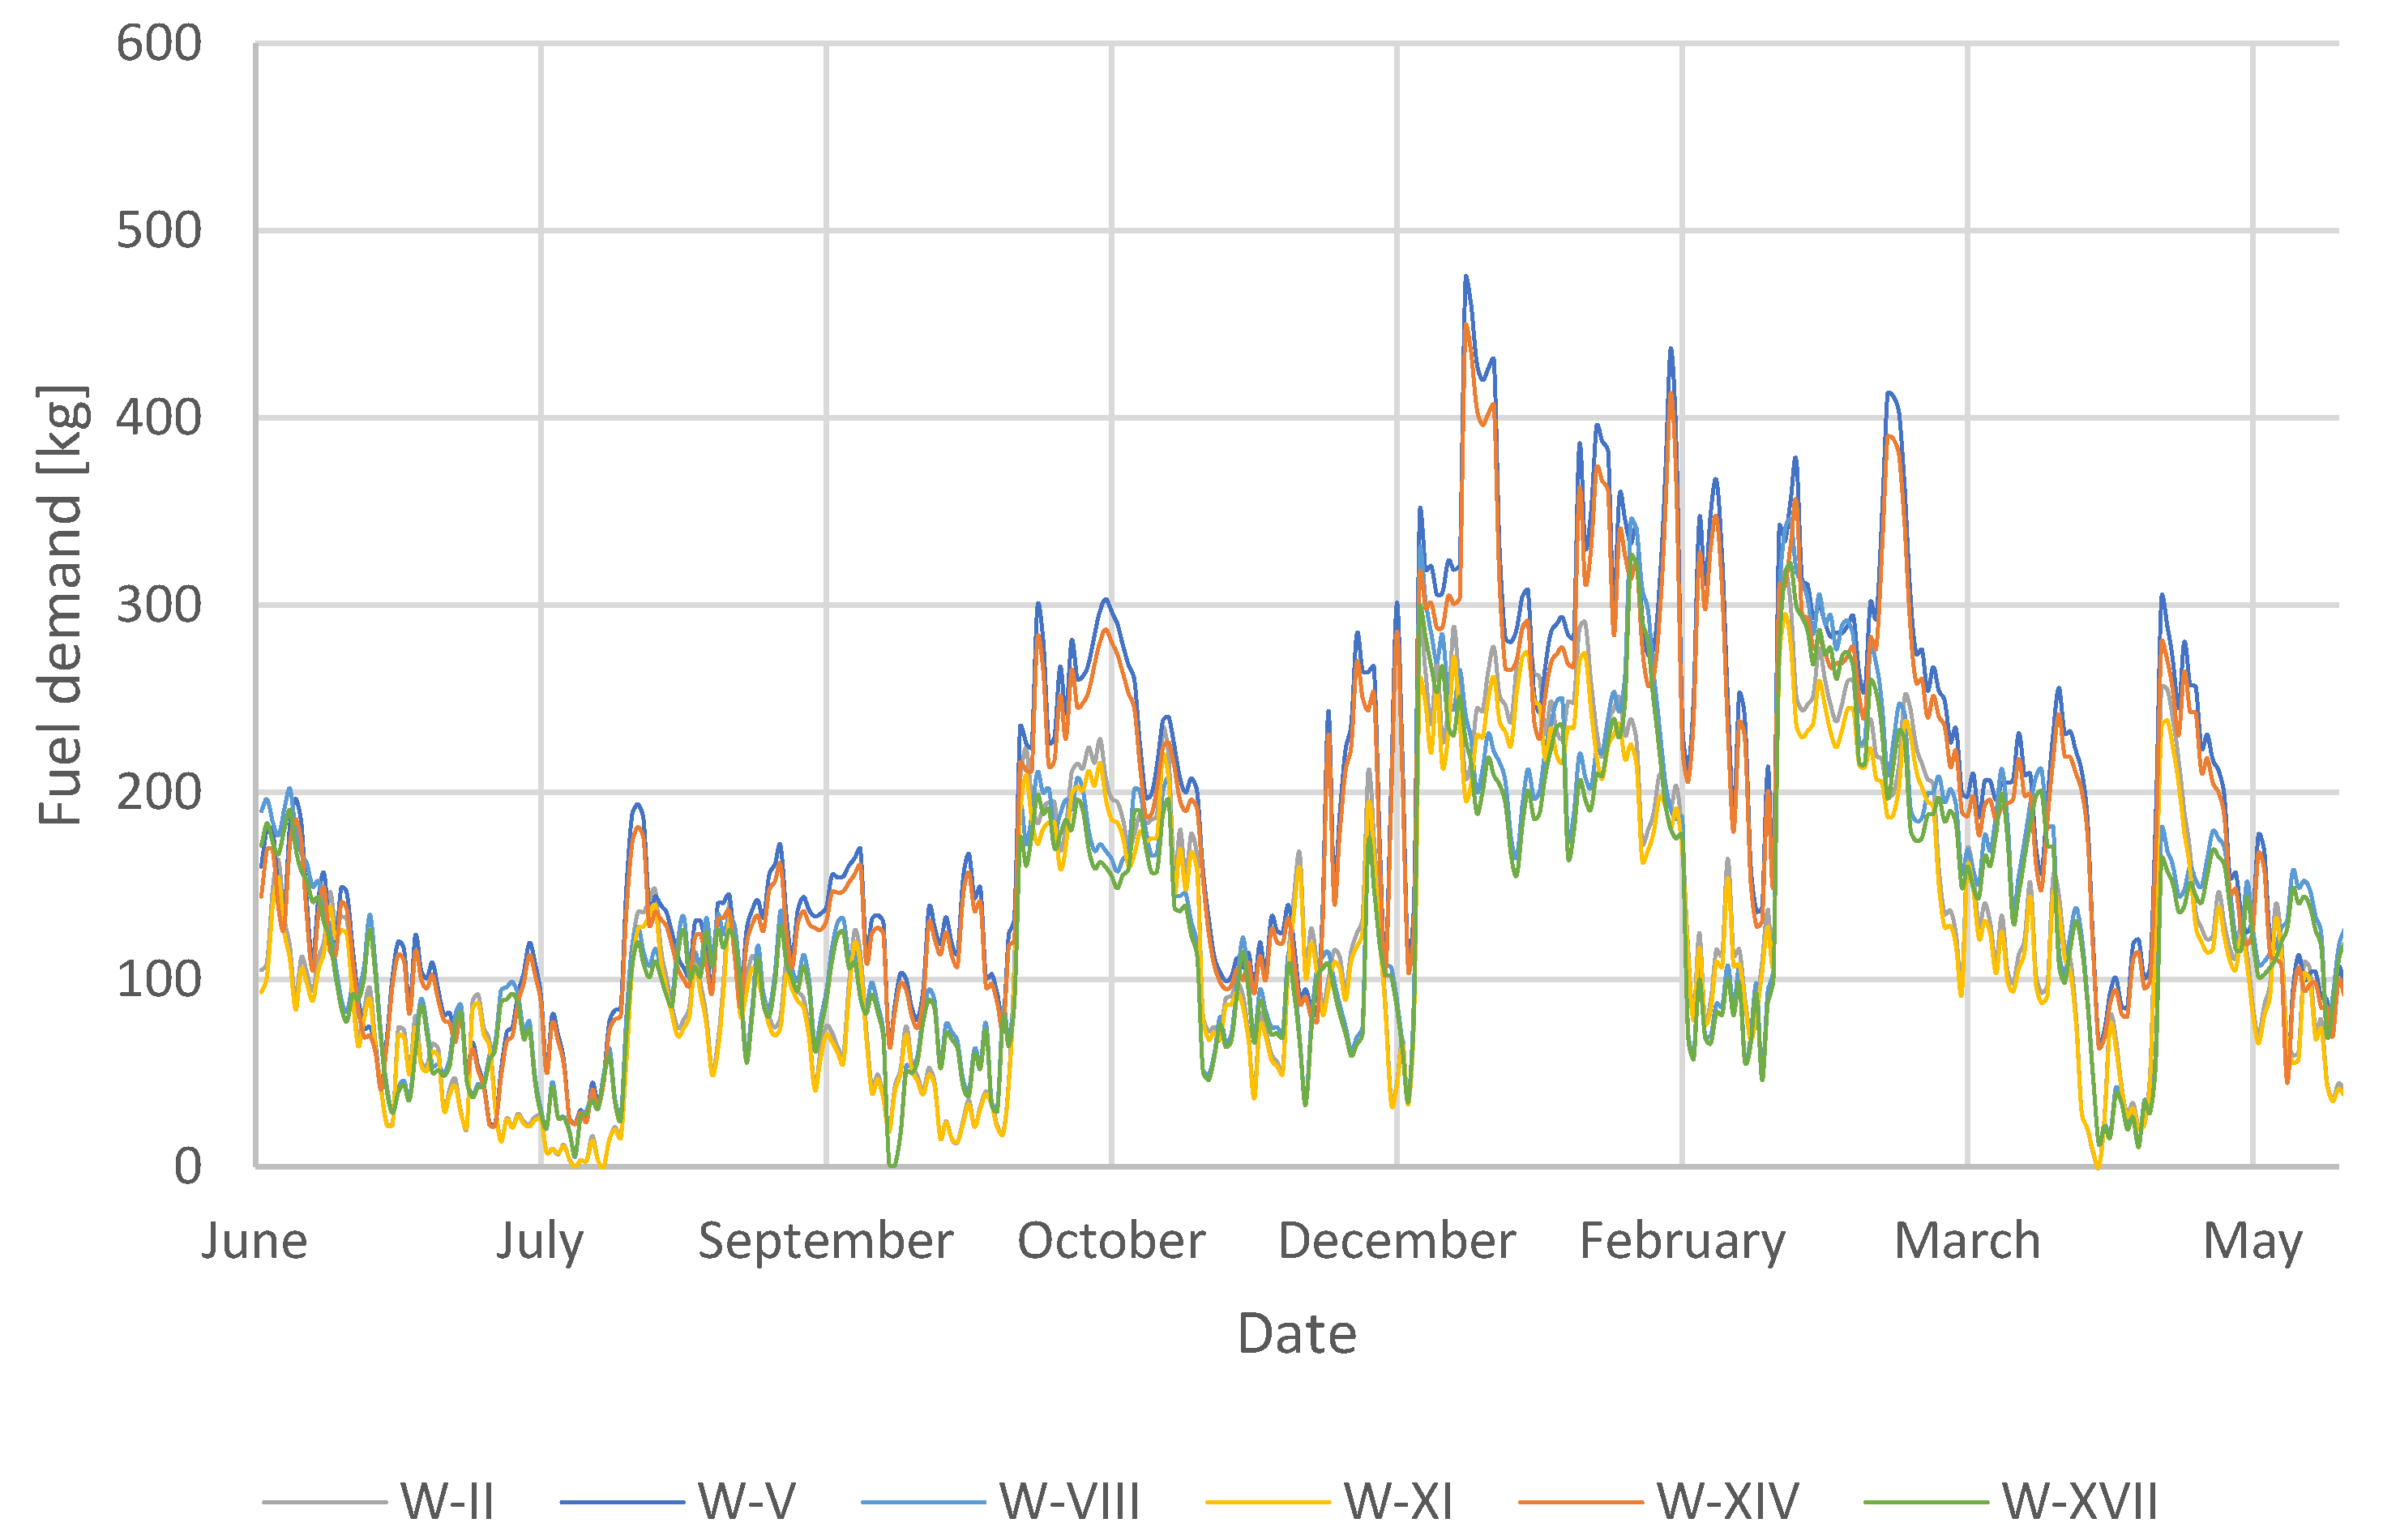
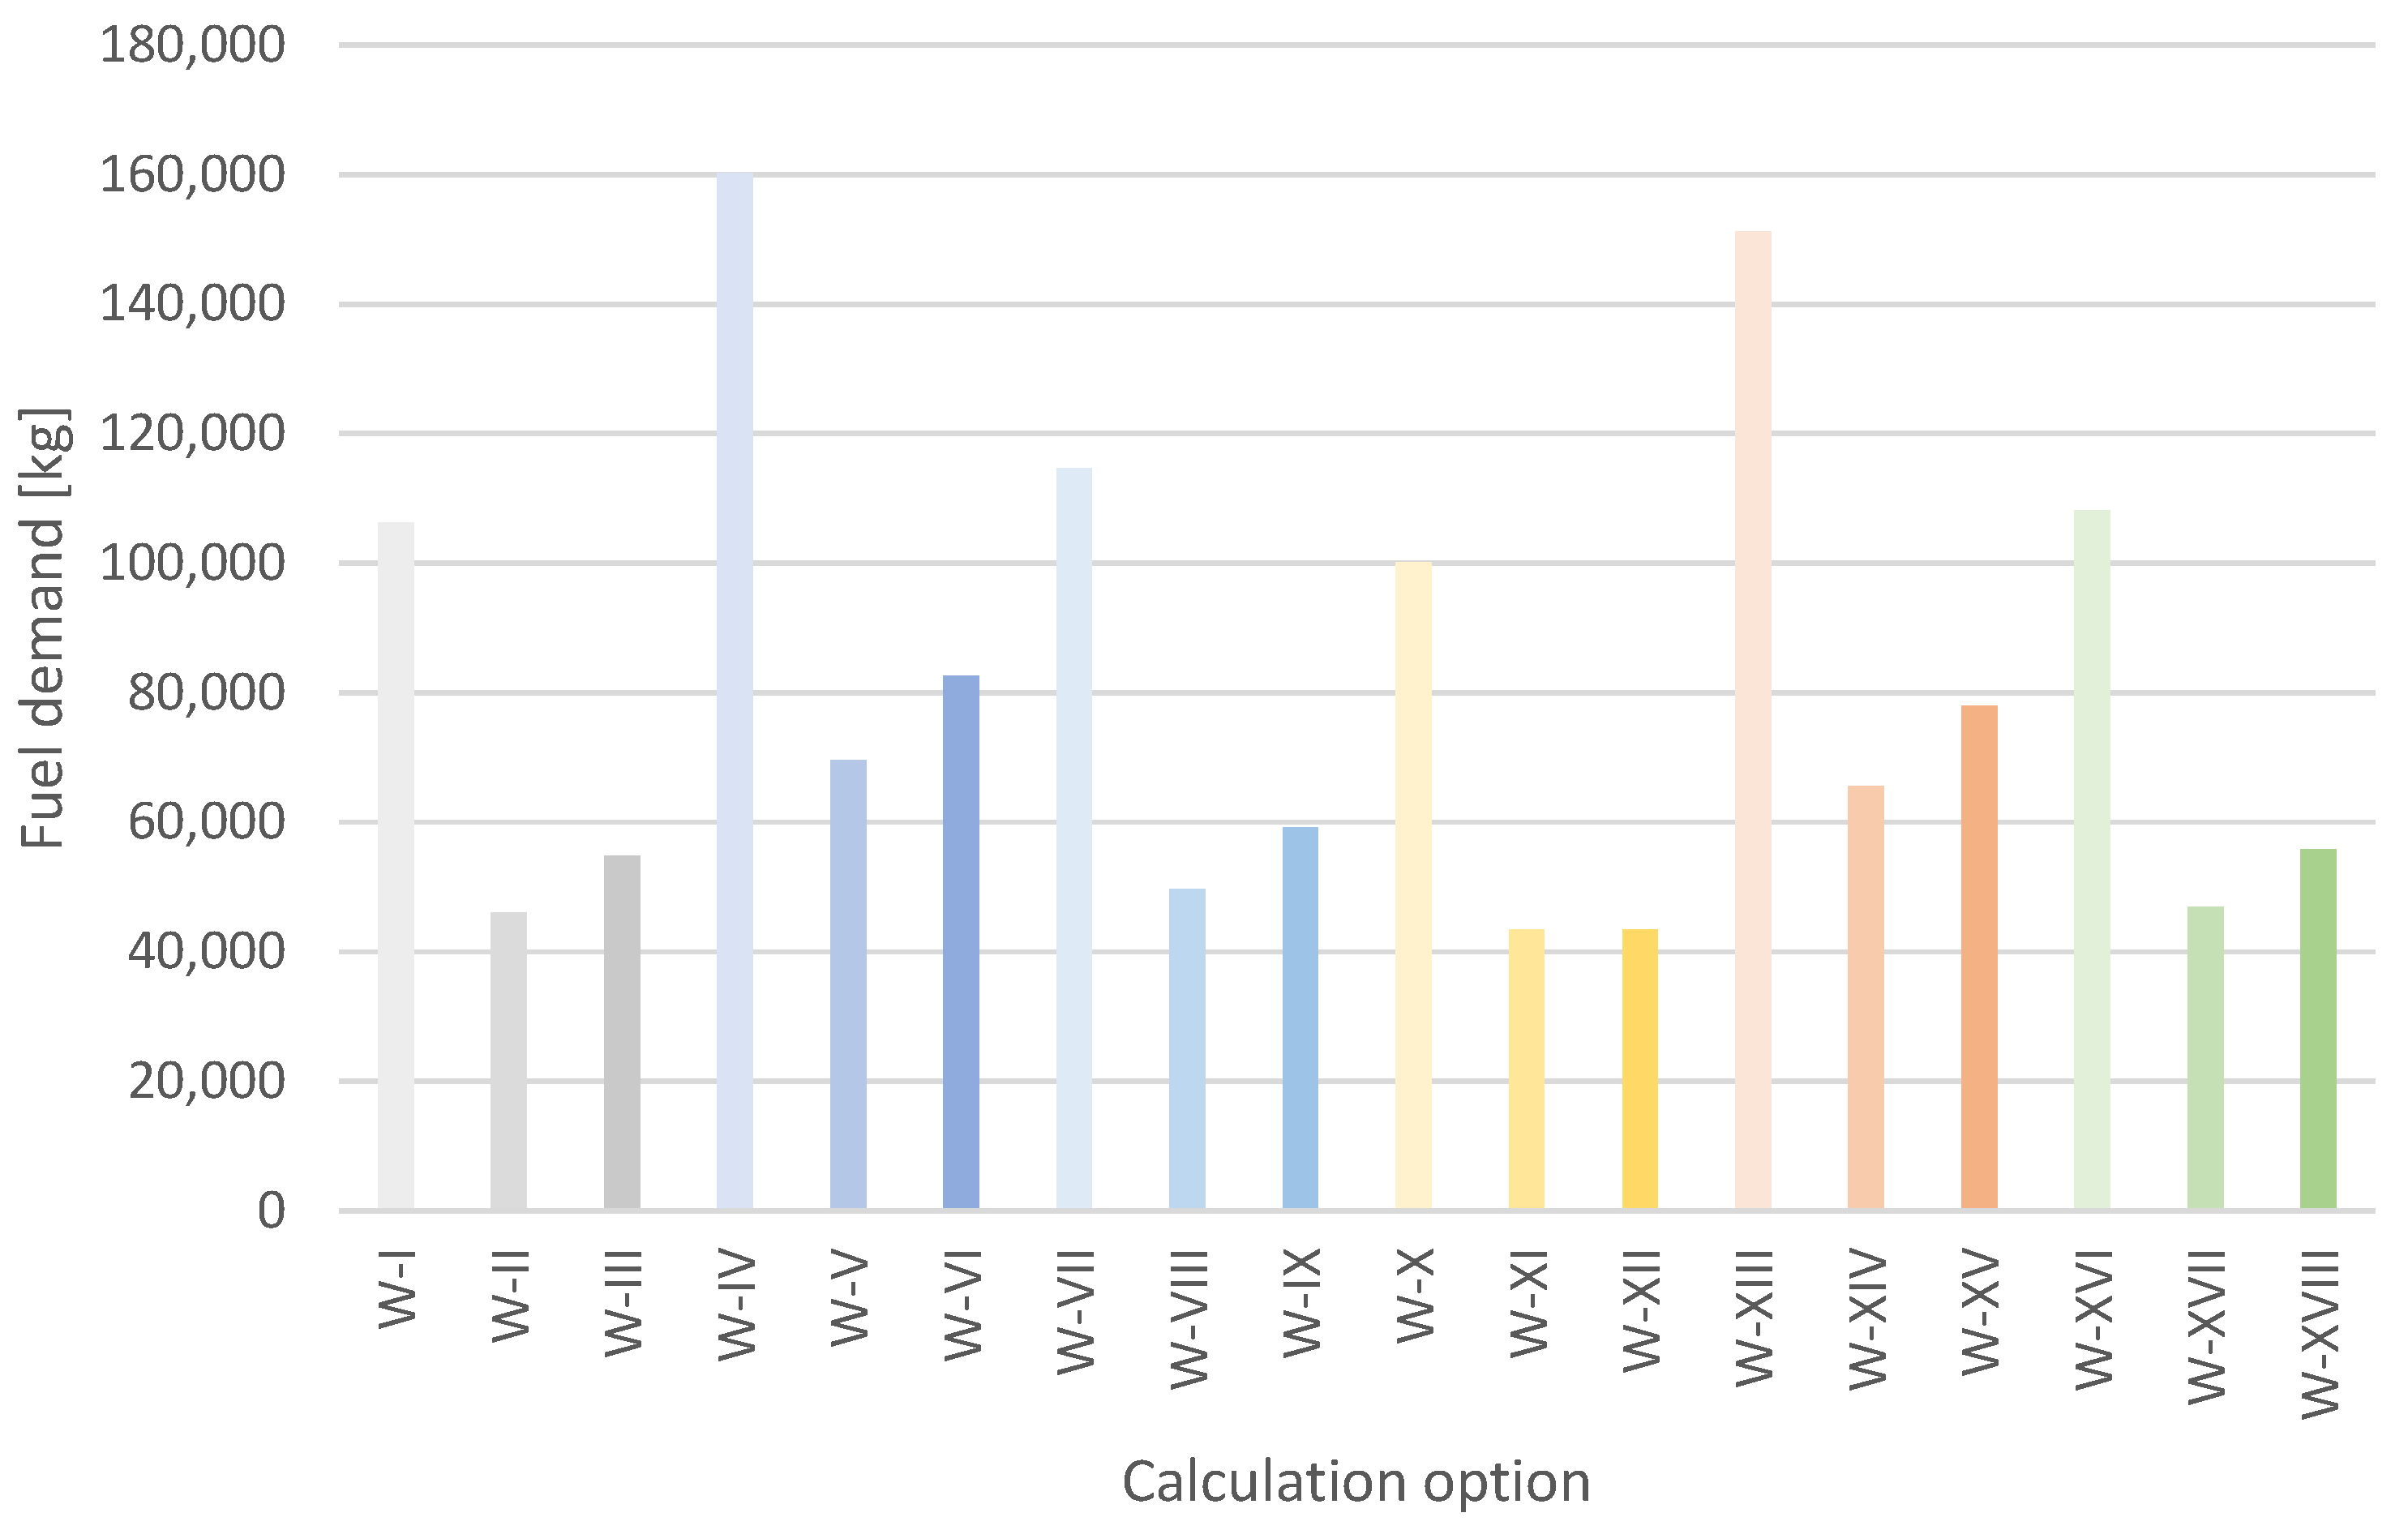
3.2. Calculation of Energy and Fuel Demand

First of all, the average daily energy demand for heating throughout the year was calculated for the broiler house, with an area of 1000 m2, suitable for the production of 20,000 broiler chickens (Figure 6 and Figure 7). Considering the location of the facilities, the highest energy demand for heating was characterised by the facility in Jyvaskyla. This location has the lowest average outdoor air temperature (2.8 °C) among the analysed locations. The annual energy demand in option W-IV, therefore, located in Jyvaskyla and with no thermal insulation of the floor, was 834,394 kWh. In contrast, increasing the thermal resistance of the floor by 3.69 m2·K·W−1 (option W-XIII), reduced the energy demand for heating by 49,604 kWh (5.9%). The lowest energy demand was calculated for the building located in Graz. The annual energy demand in a building with no thermal insulation was 553,073 kWh. However, increasing the thermal pore of the floor by 3.69 m2·K·W−1, reduced the energy demand for heating by 31,855 kWh (5.8%). The last location analysed was Kassel, where the annual energy demand in a building without floor thermal insulation was 597,163 kWh. Increasing the thermal resistance of the floor, as in the previously analysed locations, reduced the demand by 34,084 kWh (5.7%).
All of the locations analysed are in the northern hemisphere, so the period from November to April is characterised by lower outdoor air temperatures (winter half-year). On the other hand, May to October is characterised by higher outdoor air temperature values (summer half-year). As can be seen in Figure 6, the winter half-year is characterised by higher energy demands, in each of the locations analysed. The energy demand in the summer half-year is lower from 36% in Kassel to 45% in Graz compared to the winter half-year.
Based on the obtained results of the energy demand for heating, the fuel demand [B] was calculated for each of the analysed locations. Calculations were made using Formula (3). The results are shown in Figure 8, Figure 9, Figure 10 and Figure 11.
The fuel demand by month is in line with the previously calculated energy demand for heating. Consequently, the highest fuel demand occurs in the winter half of the year (November to April). The highest fuel demand occurs in Jyvaskyla and is related to the occurrence of the lowest average outdoor air temperature in this location. As a result, the highest energy demand was for heating, to ensure optimal microclimatic conditions inside the facility and to minimise the risk of heat stress for the birds. No fuel demand occurred during the outage when the heating in the building was turned off. This occurs for 518 h·year−1. However, the lack of heating in the building, particularly during the winter half-year, causes the facility to cool down and increases demand at the beginning of the production cycle. As noted by Nawalany and Sokolowski (2020) [29], the energy demand for a three-day process interruption is 9% higher compared to a one-day interruption.
The highest fuel demand was calculated for hard coal at the facility located in Jyvaskyla, characterised by reduced floor thermal resistance (option W-IV). The annual demand for hard coal was 160,257 kg at this facility. In each of the locations analysed, the demand for hard coal was the highest (irrespective of the presence or absence of floor thermal insulation), compared to gas or fuel oil. The lowest fuel demand was calculated for gaseous fuel in variant W-X, characterised by an increased floor thermal resistance of 3.69 m2·K·W−1 and located in Graz. The annual gaseous fuel demand there was 43,434 kg.

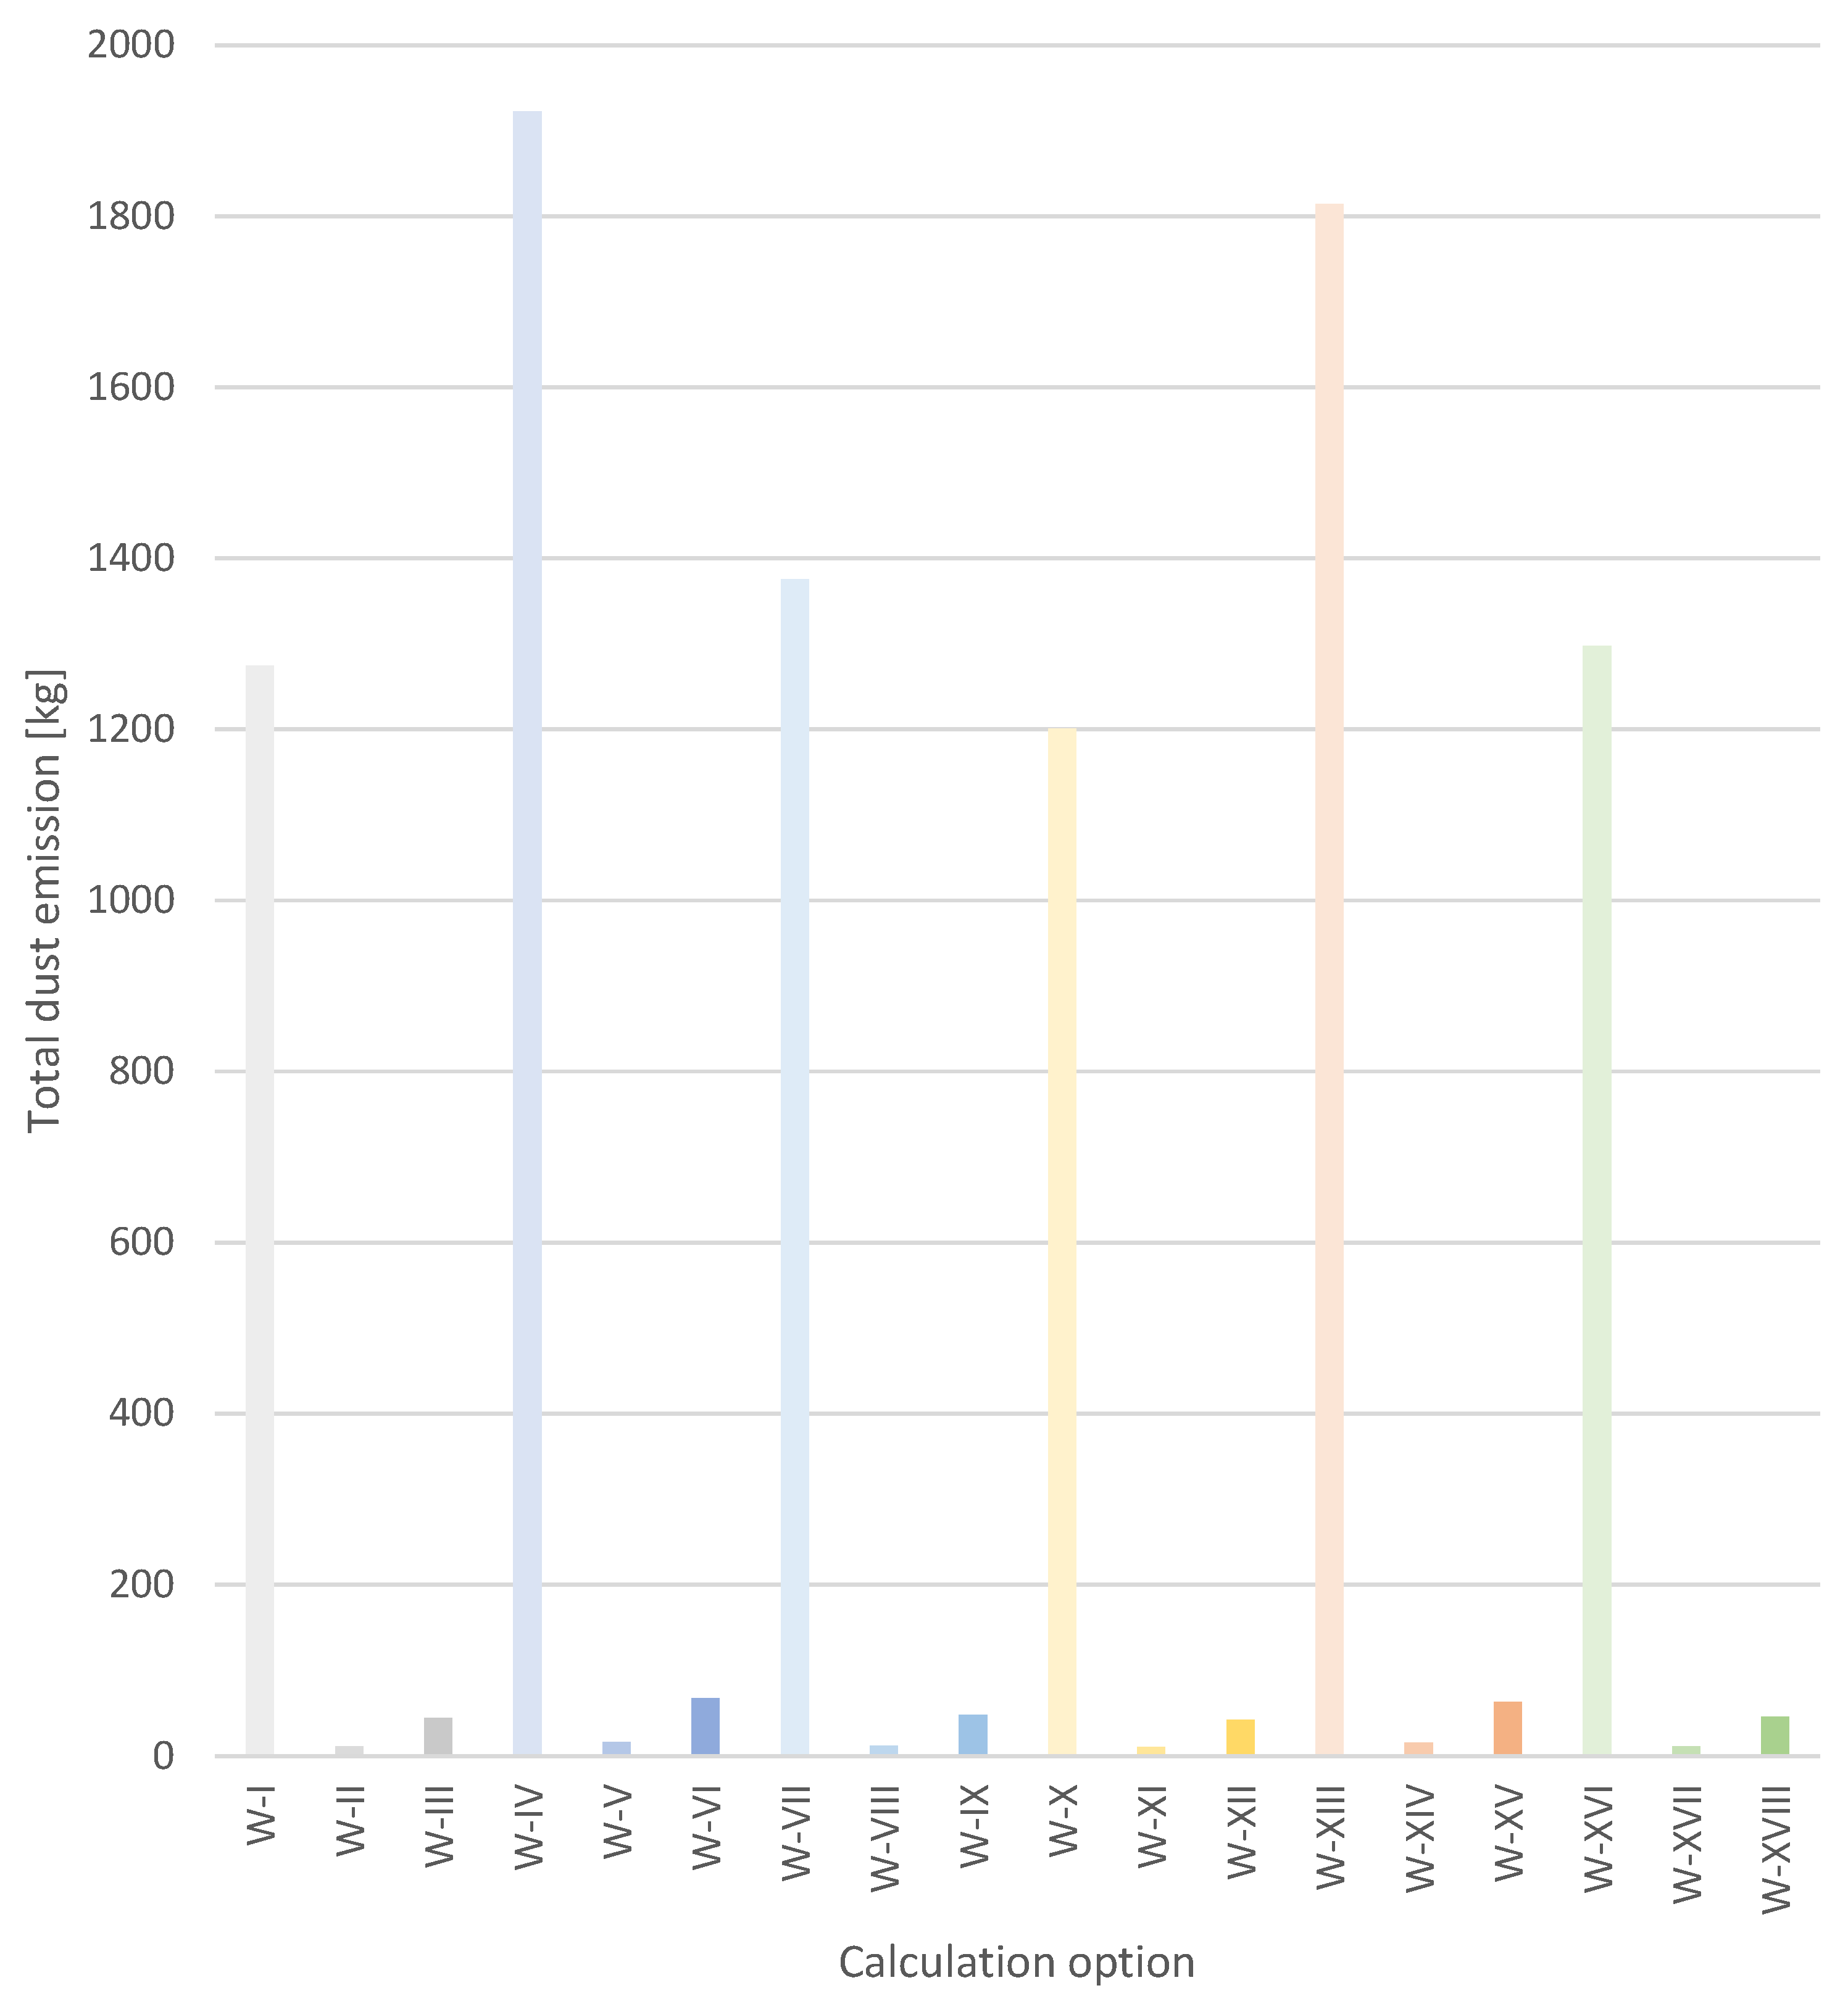
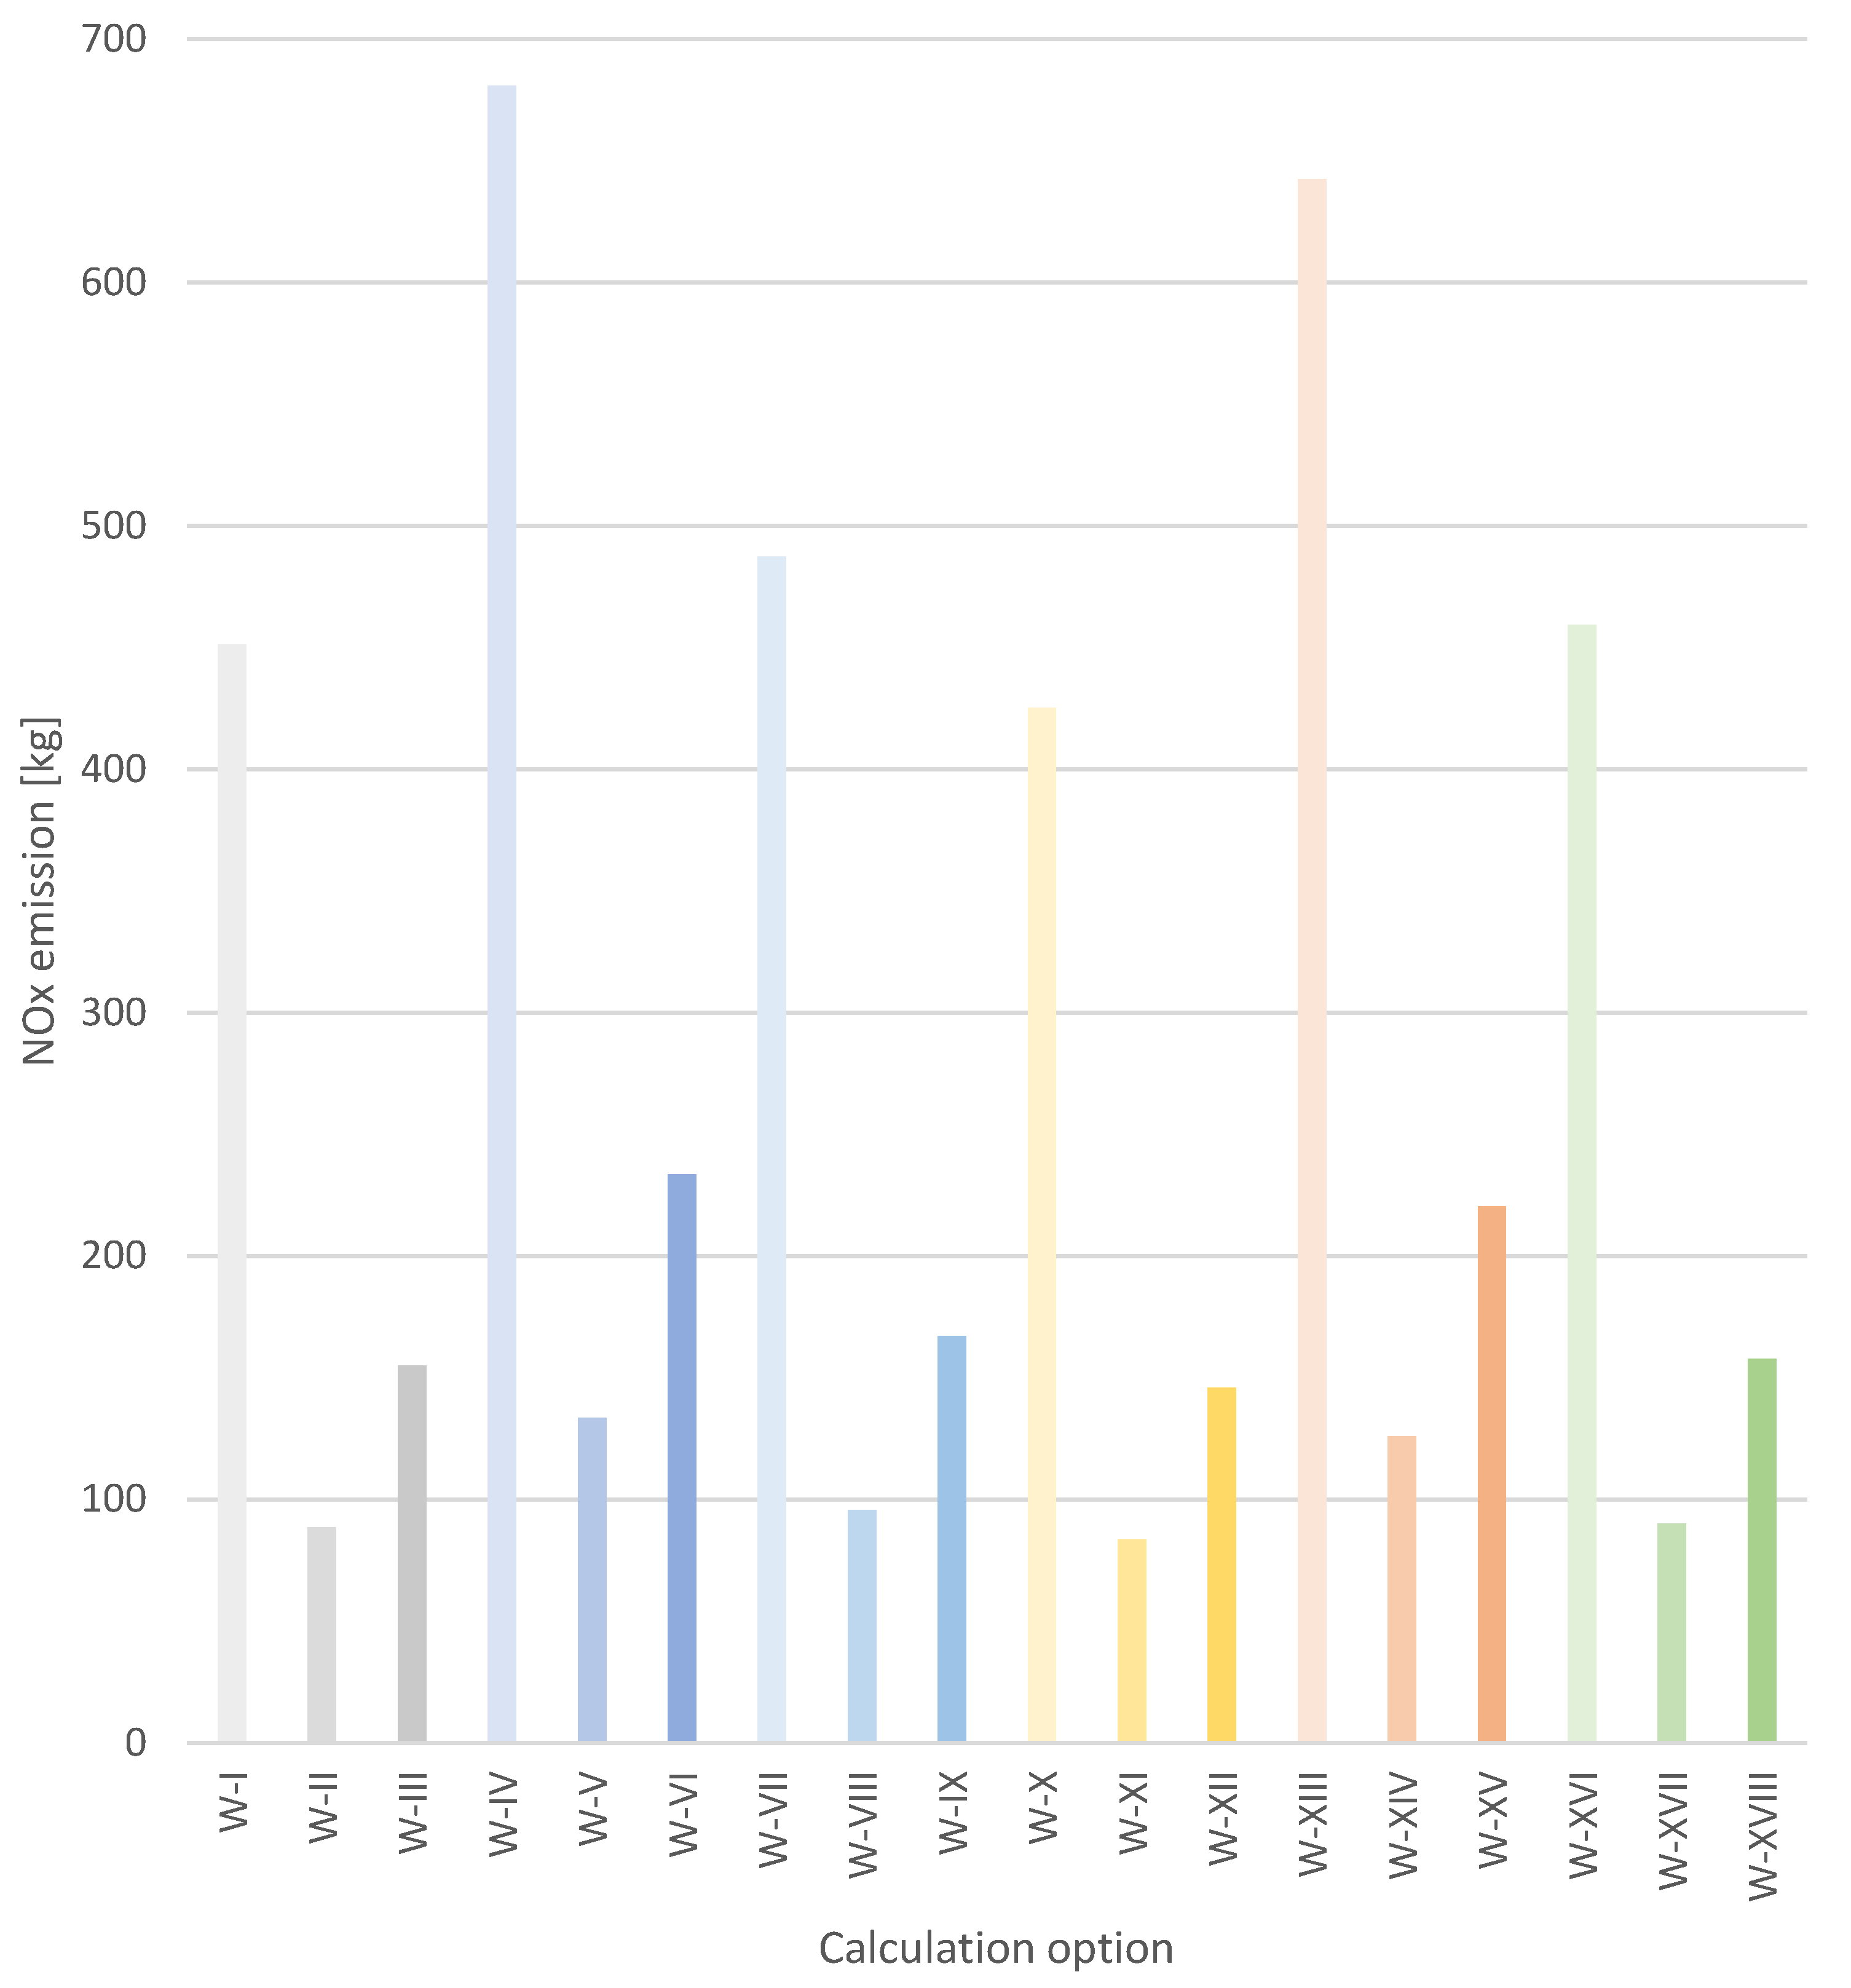
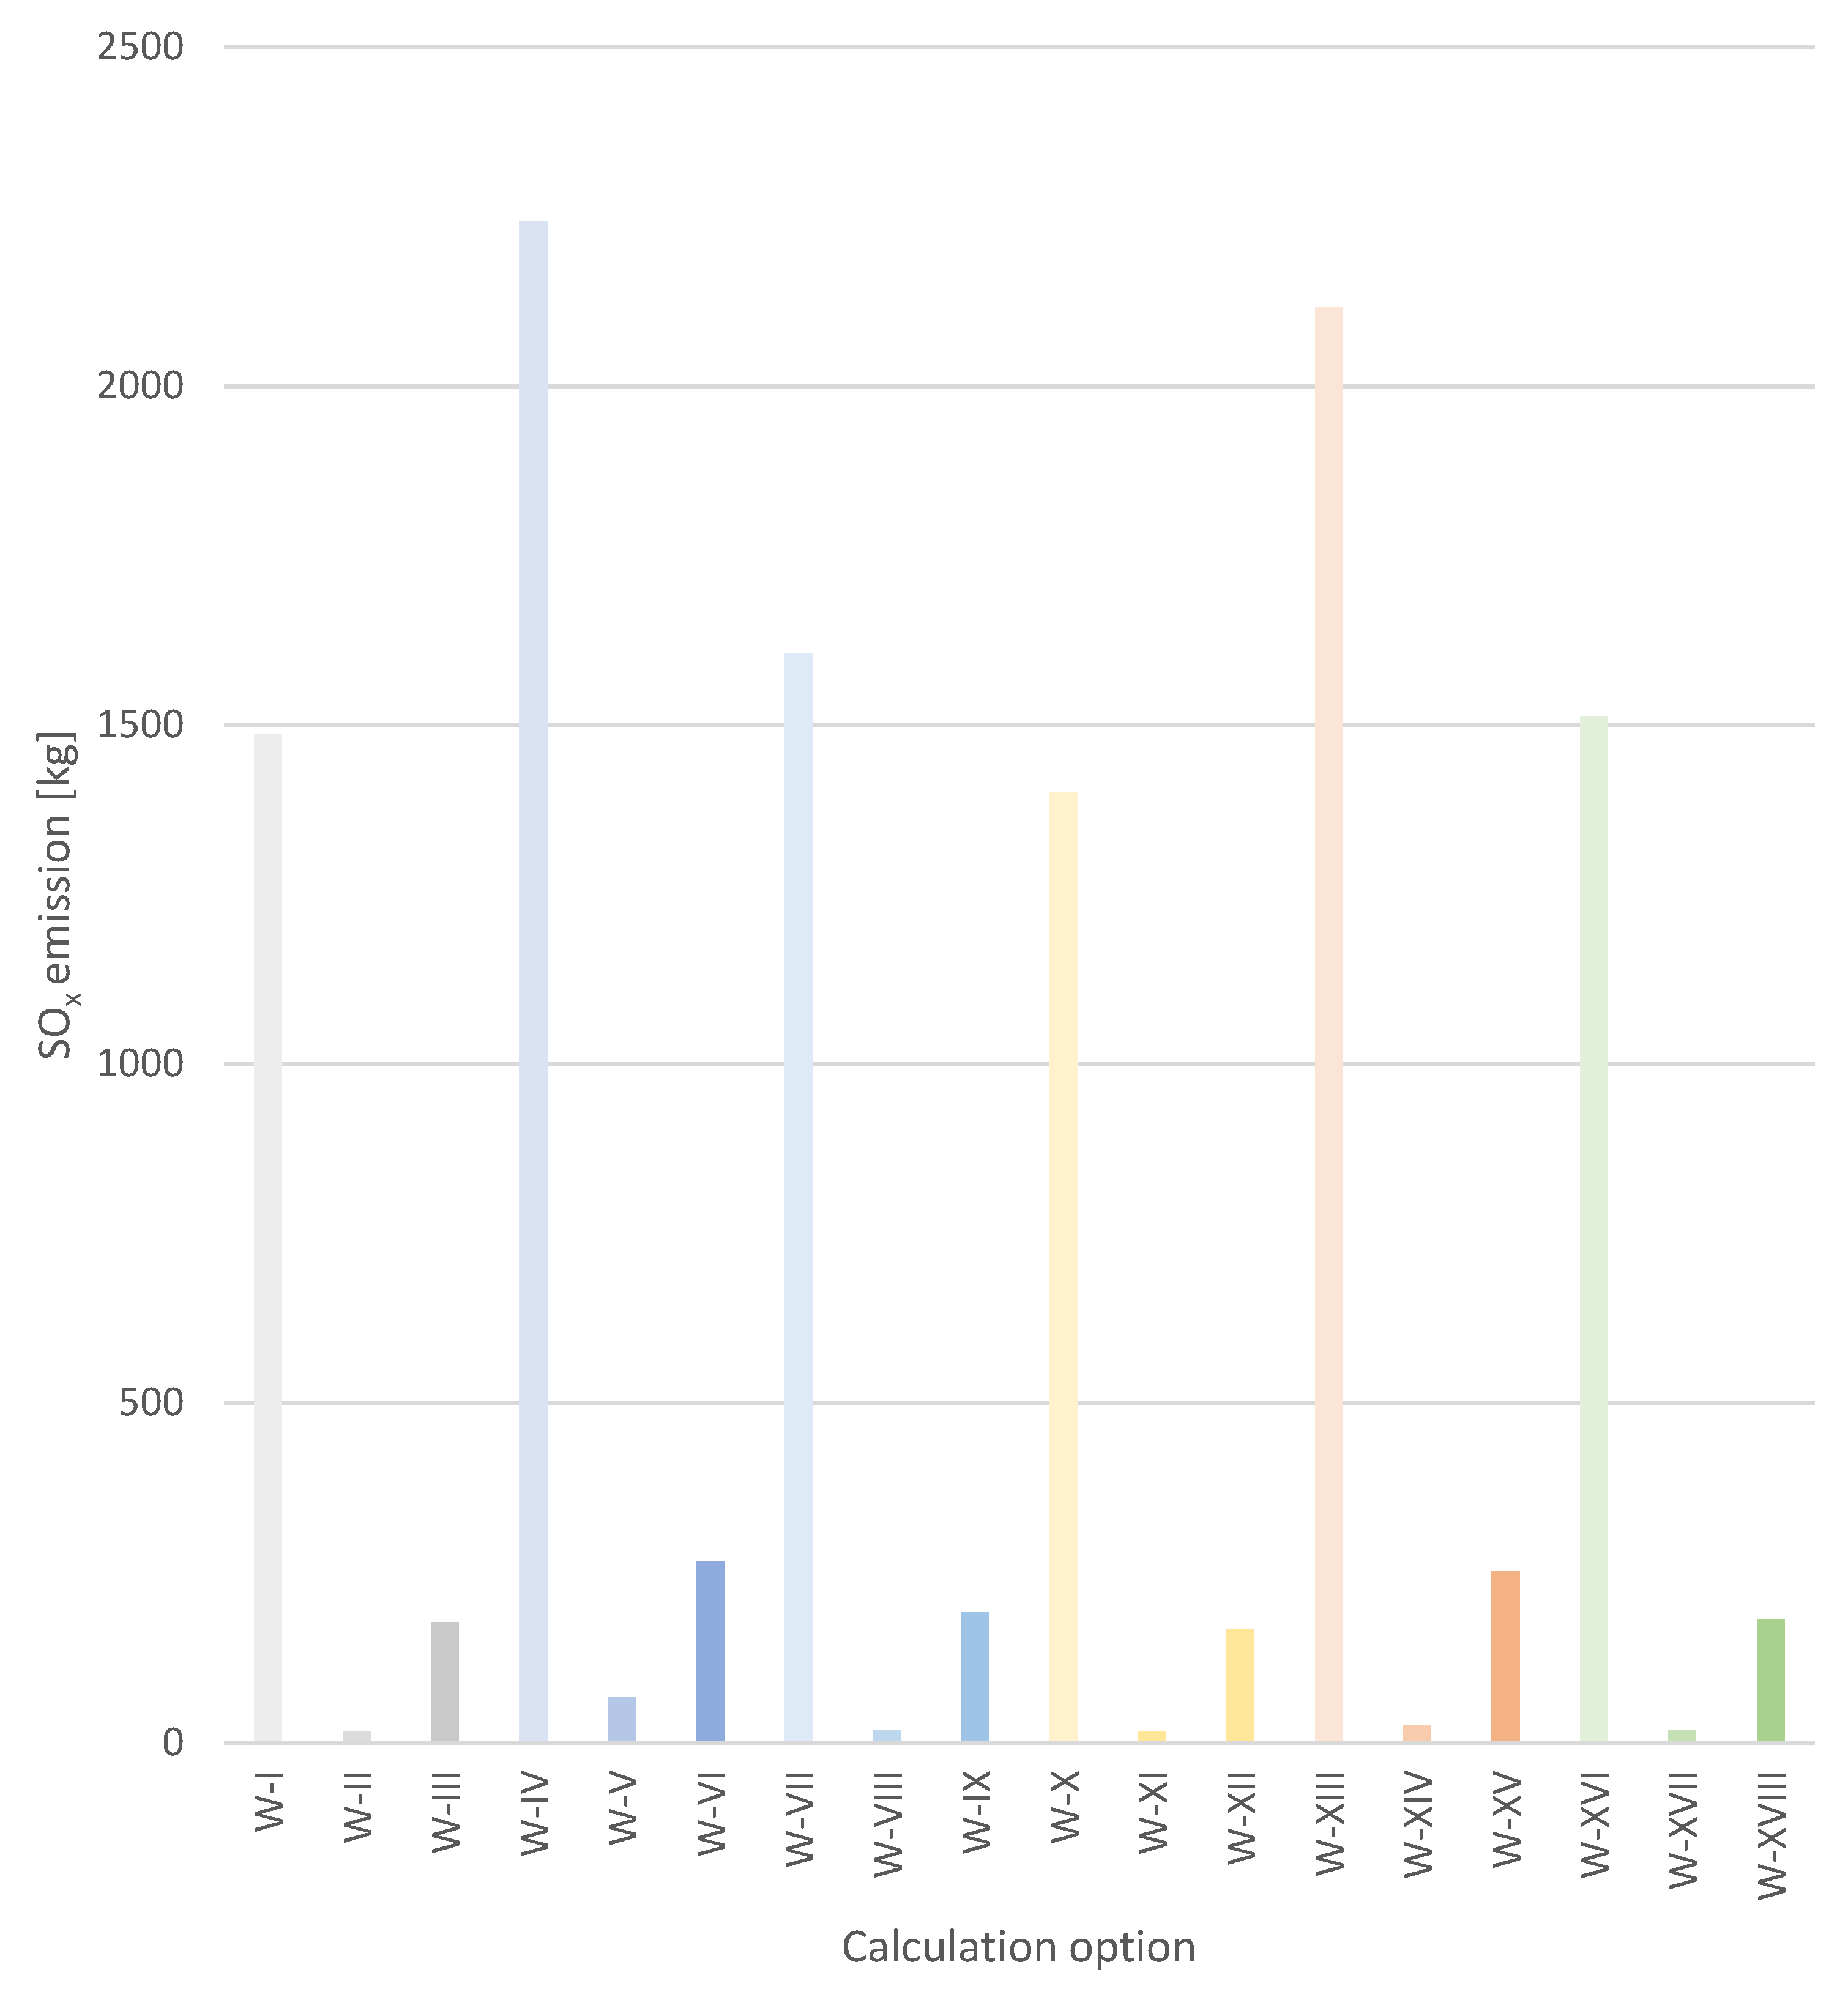
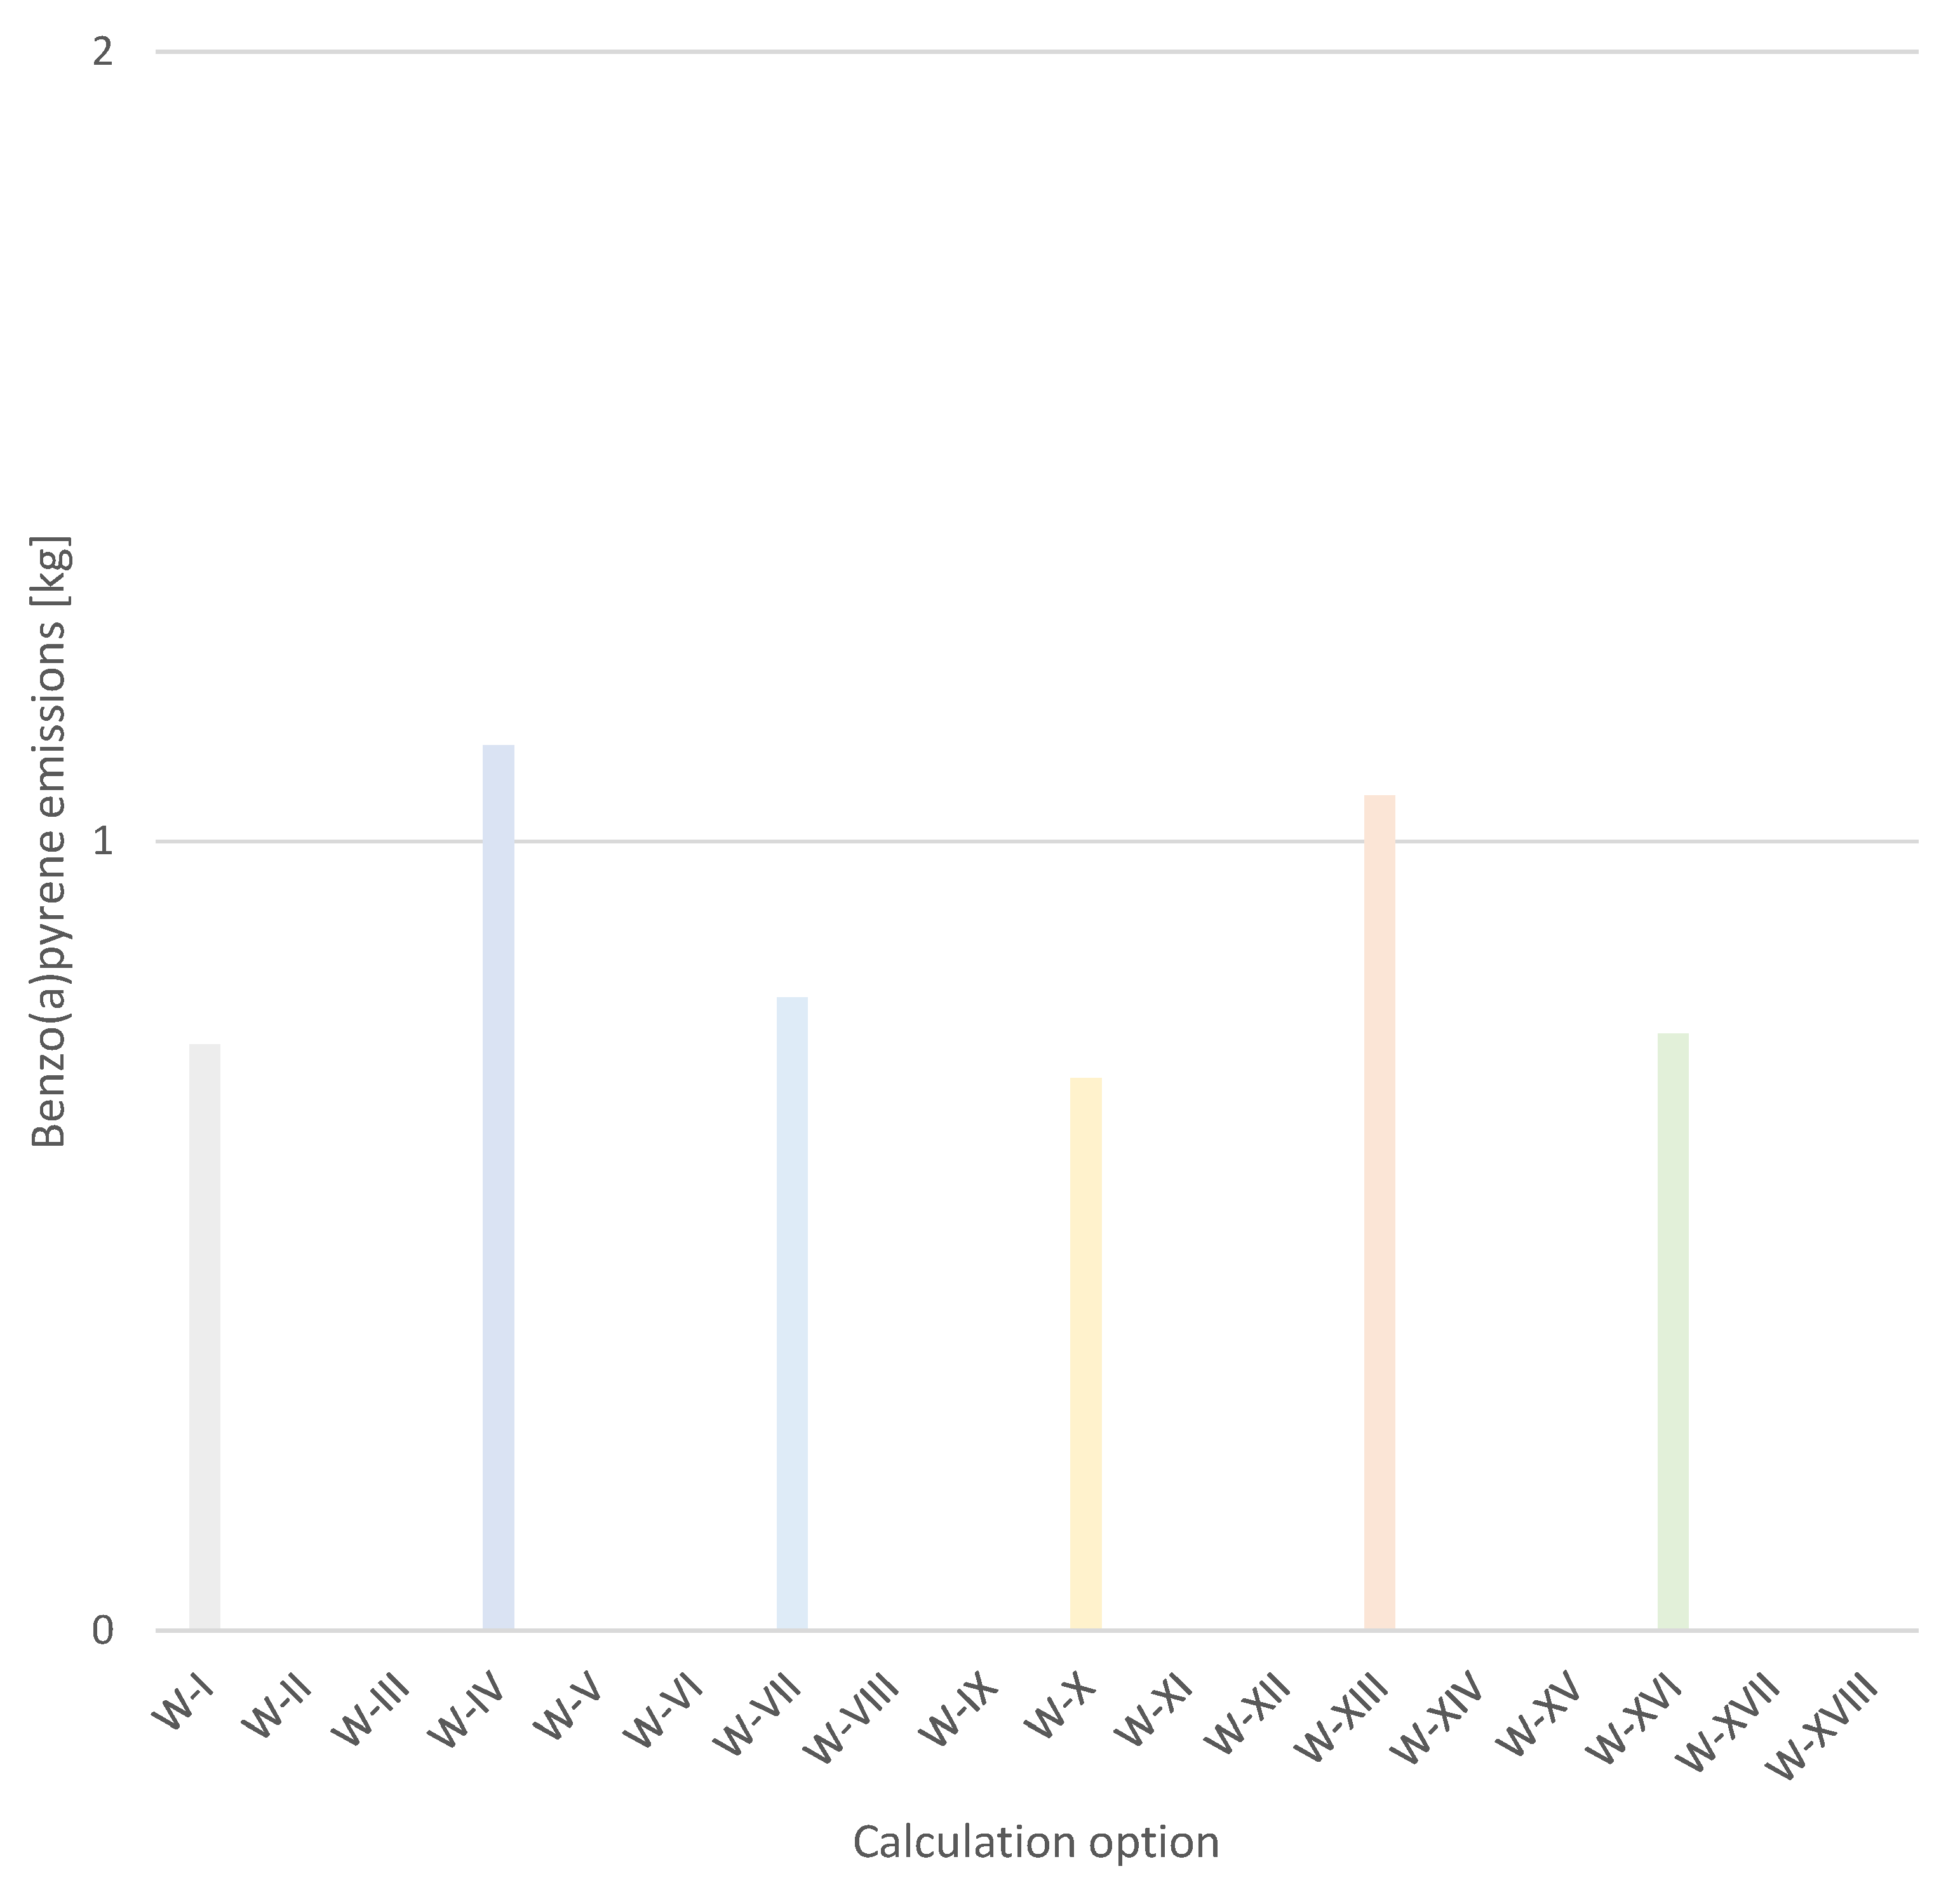
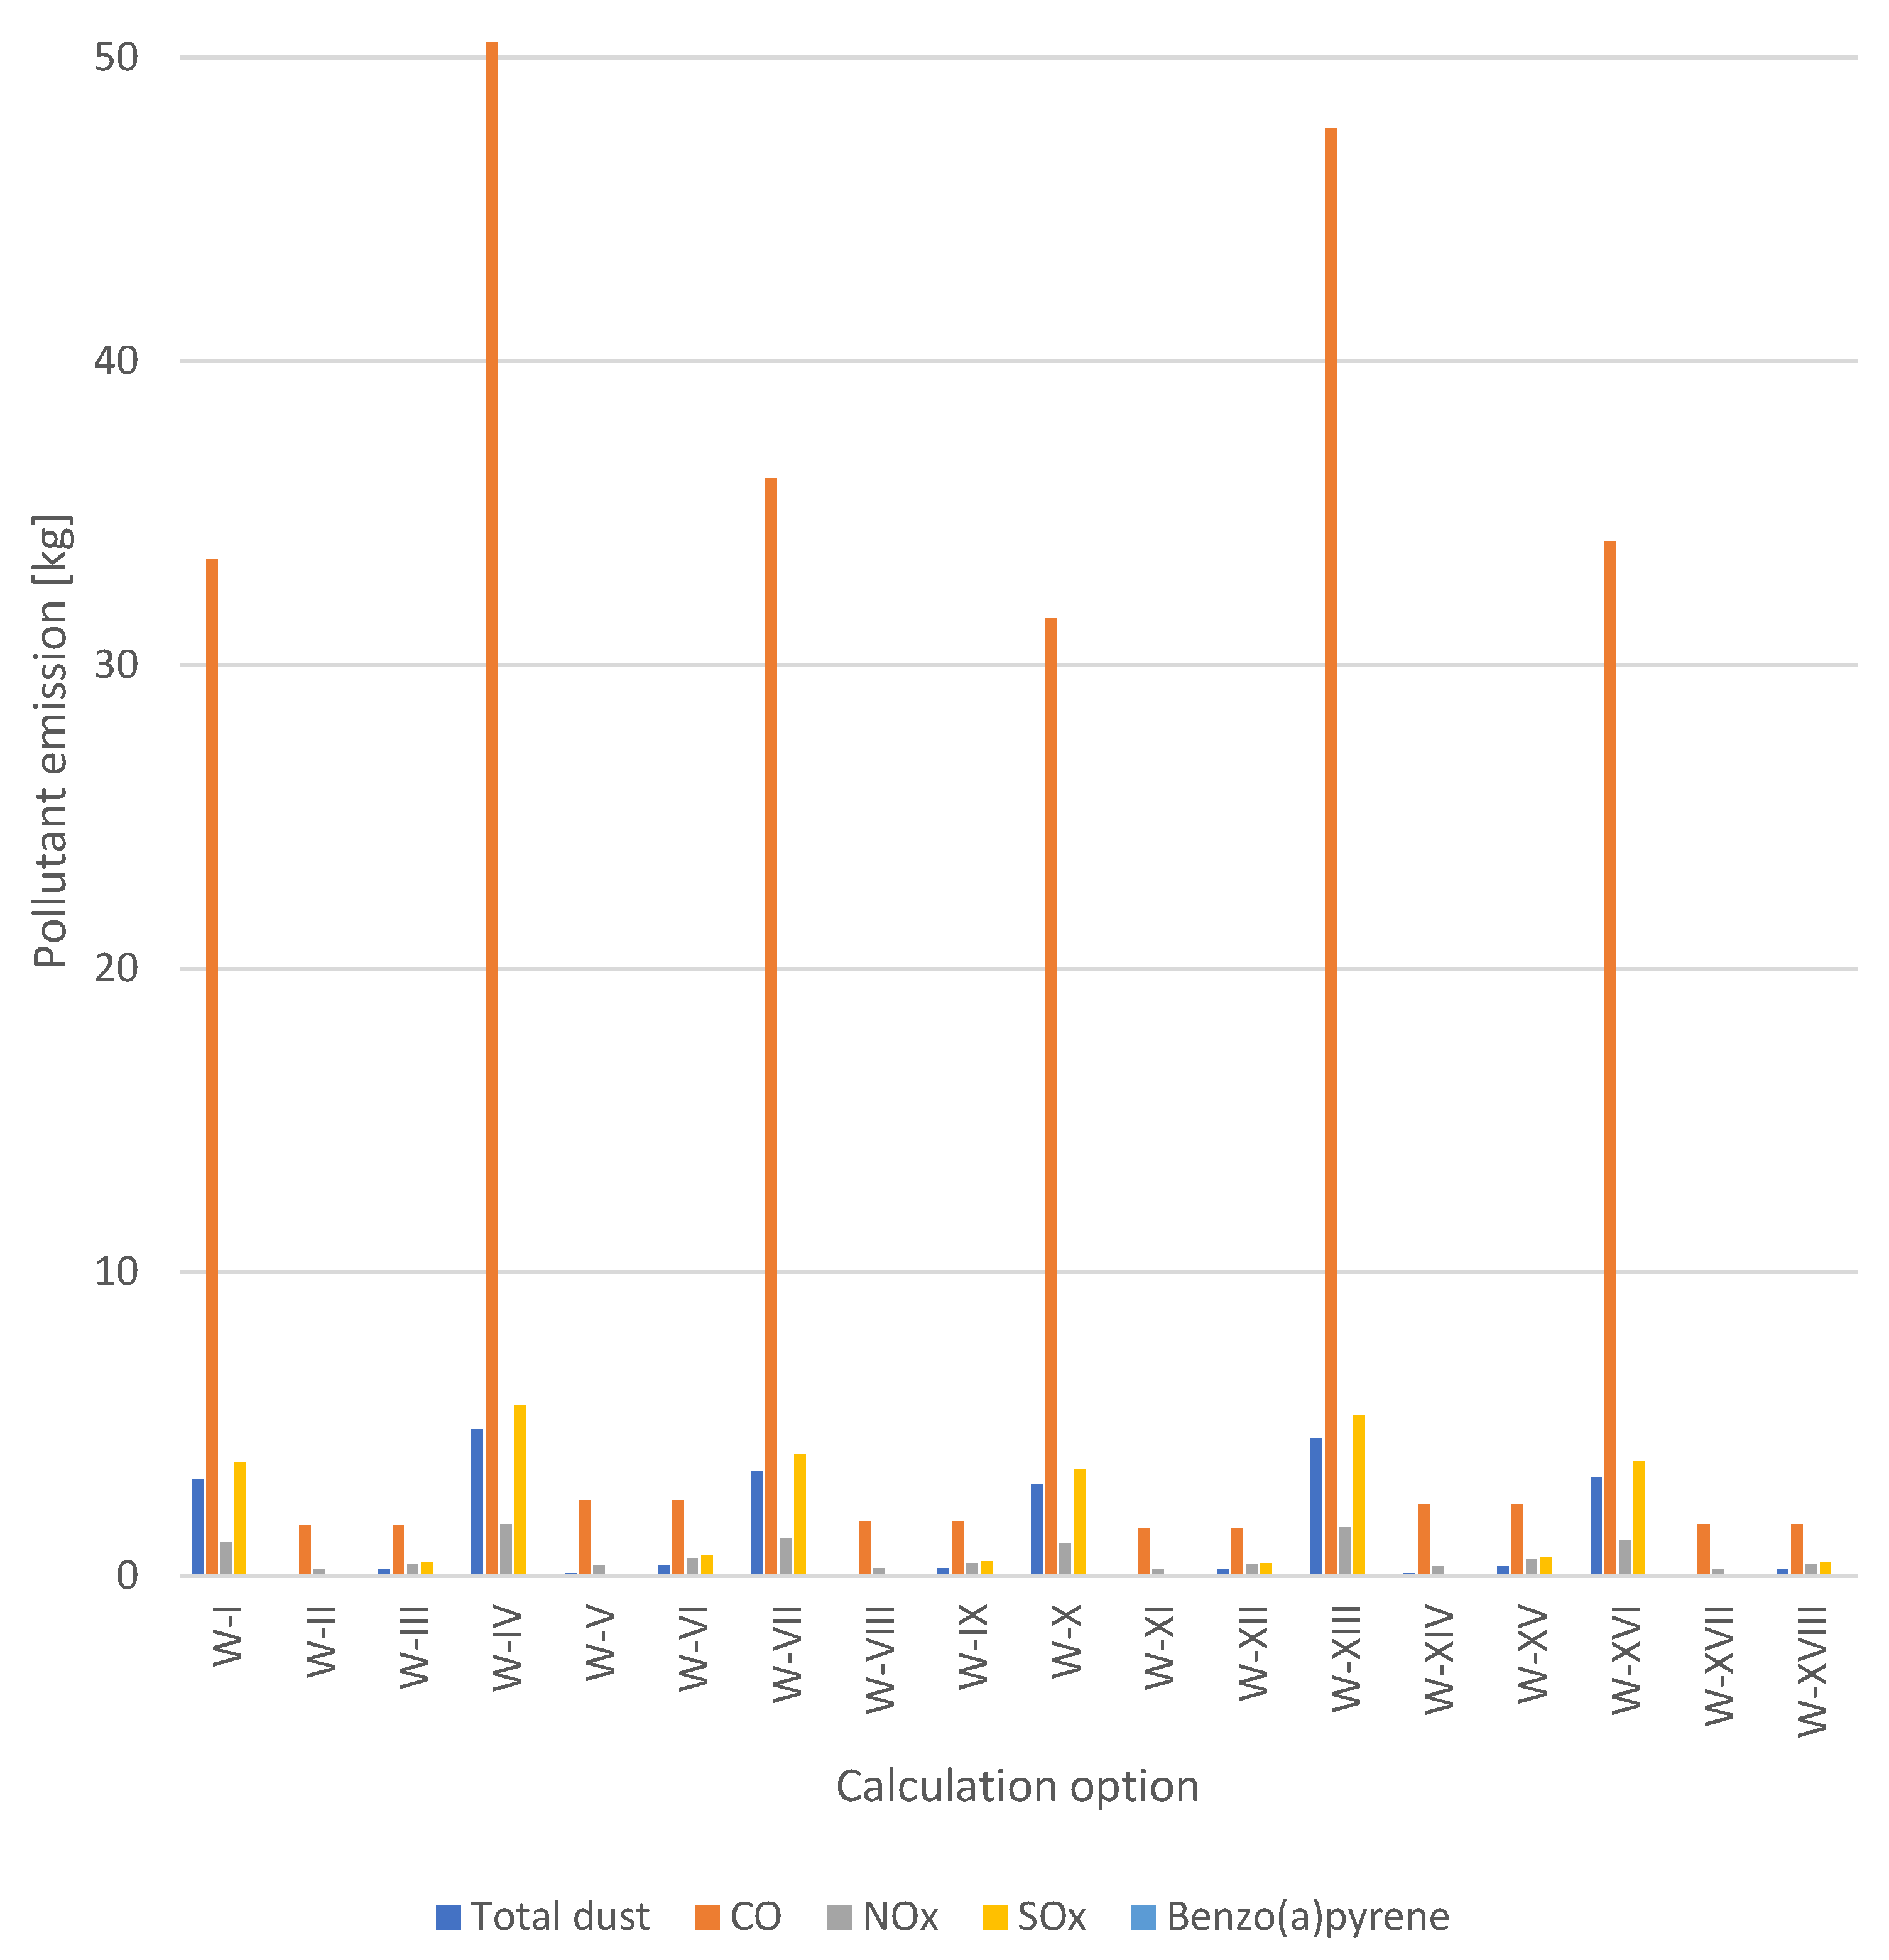
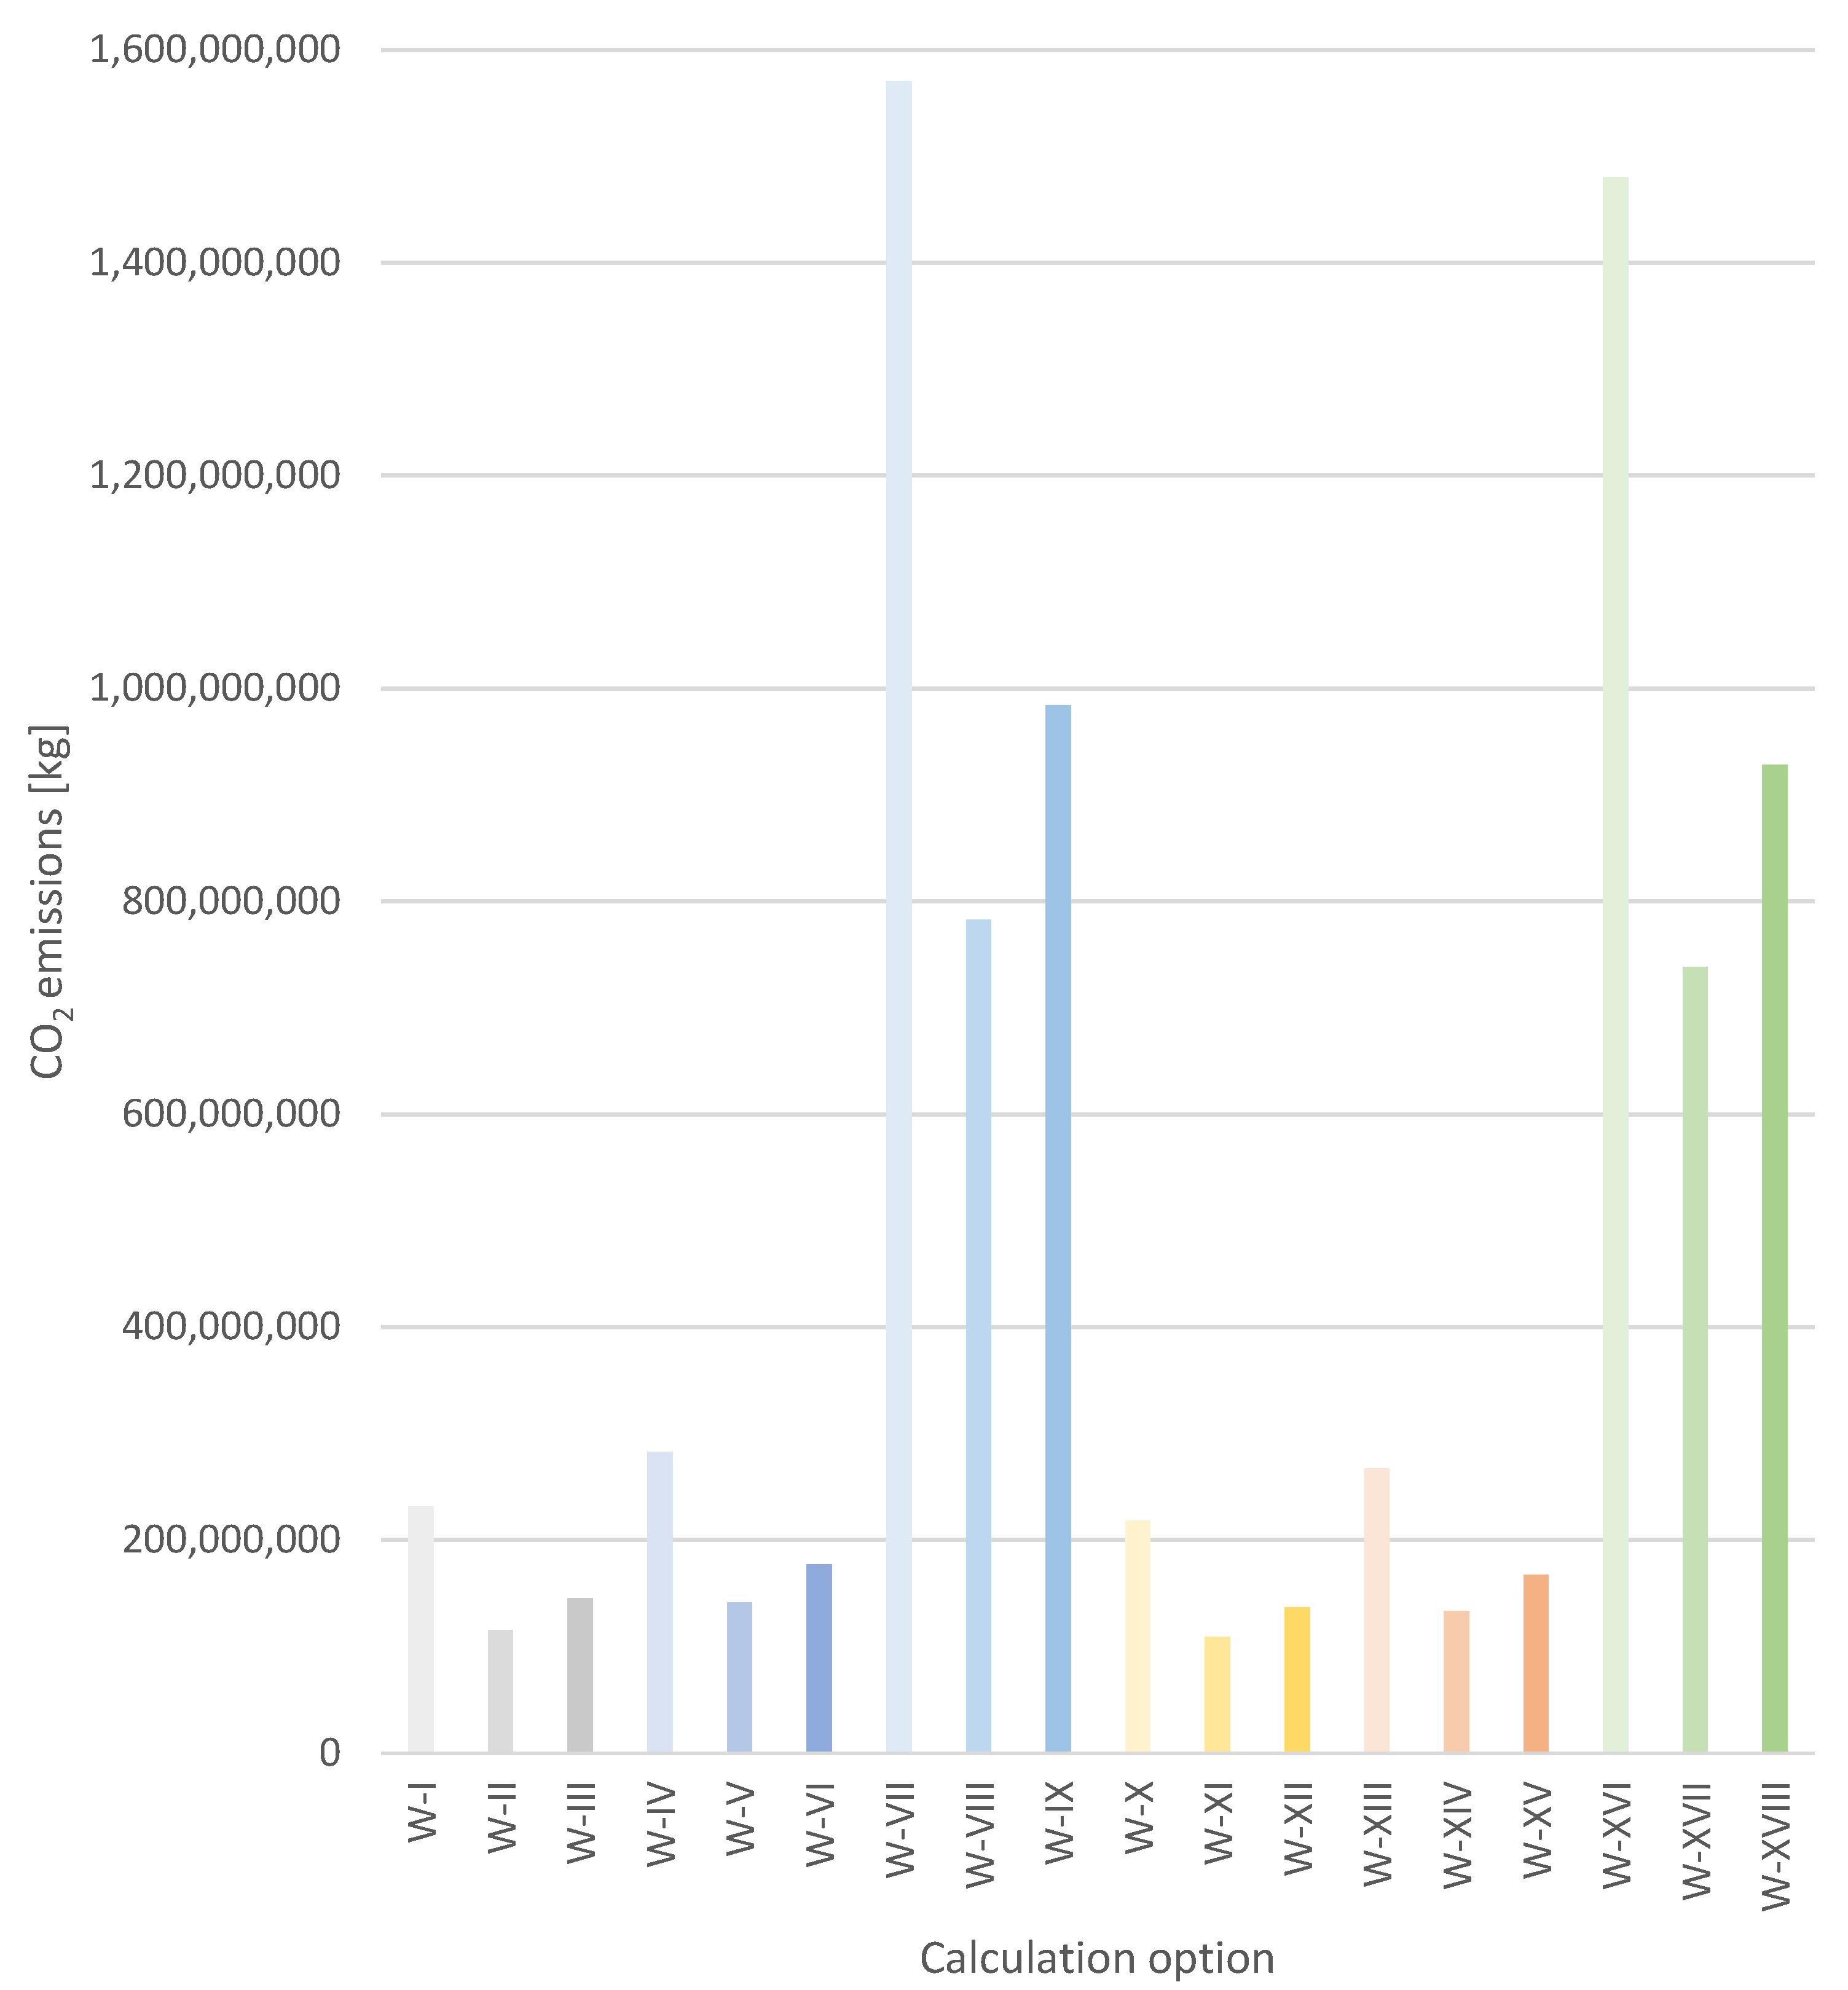
3.3. Emission of Pollutants from an Individual Building

Once the fuel requirements had been calculated, the calculation of pollutant emissions proceeded, for each of the calculation options. The results refer to the pollutant emissions resulting from the combustion of fuels to heat one broiler house, for each calculation option. The annual summary of emissions of total dust, CO, CO2, NOx, SOx and benzo(a)pyrene, for each of the calculation options are shown in Figure 12, Figure 13, Figure 14, Figure 15, Figure 16 and Figure 17.
The highest values of total dust emissions, shown in Figure 12, were calculated for Jyvaskyla, using hard coal, in line with the previous calculations of the highest heating energy and fuel demand. For all of the locations analysed, hard coal had the highest emission values (from 1201 kg in W-X to 1922 kg in W-IV) compared to total dust emissions using fuel oil or gaseous fuel, where emission values ranged from 1 kg for options W-II, W-VIII, W-XI or W-VII (gaseous fuel) to a maximum of 7 kg in option W-VI (fuel oil). Thus, when analysing total dust emissions, the use of gaseous fuels is the most environmentally friendly. While total dust emissions when using hard coal reach values more than a thousand times higher, compared to gaseous fuels. Under Polish climatic conditions, total dust emissions ranged from 1 kg for gaseous fuels to 1027 kg for hard coal, in a building with reduced floor thermal resistance [14].
High CO2 emissions are found with each of the fuels analysed. As in the case of total dust emissions, the highest carbon dioxide emission values were recorded in Jyvaskyla, for hard coal. In contrast, the lowest values were recorded in Graz for gaseous fuels and amounted to 127,531 kg for W-II, while increasing the thermal resistance of the floor by 3.69 m2·K·W−1 (W-XI), reduced CO2 emissions by 5.8%. The use of fuel oil resulted in higher carbon dioxide emissions by 30,918 kg in Graz, in the building with increased floor thermal resistance to 49,493 kg in Jyvaskyla (W-V, W-VI), compared to gaseous fuels. Thus, as with total dust emissions, the most environmentally friendly of the fuels analysed is the use of gaseous fuels, with increased floor thermal resistance.
In the case of CO emissions, it is a similar situation to that of total dust emissions. Carbon monoxide emission values with hard coal reach values more than 200 times higher than with gas or fuel oil. The differences in CO emissions between fuel oil and natural gas in the various options are negligible. The lowest emission values were calculated for Graz, 63 kg (W-XI and W-XII). The highest, however, were in Jyvaskyla and ranged from 19,050 kg (W-XIII) to 20,184 kg (W-IV). Increasing the thermal resistance of the floor by 3.69 m2·K·W−1 reduces pollutant emissions by an average of 5.7%. As with the pollutants analysed above, hard coal is the most harmful fuel, while gaseous fuel and fuel oil show similar levels of pollutant emissions.
As with the pollutant emissions analysed above, the highest one occurred in Jyvaskyla in the facility with reduced floor thermal resistance and with the use of hard coal (W-IV) and amounted to 681 kg. Increasing the floor thermal resistance by 3.69 m2·K·W−1 (W-XIII), resulted in a 5.8% reduction in emissions. The lowest NOx emission for the Graz location, with increased floor thermal resistance and using gaseous fuels (W-XI), was 83 kg. NOx emissions were between 63 and 100 kg lower when using gaseous fuel compared to fuel oil. In contrast, the use of hard coal resulted in higher emissions by up to 547 kg compared to gaseous fuels. In line with previous analysis, the most environmentally friendly use of gaseous fuels is in buildings with increased floor thermal resistance.
Analysing the SOx emission results, it can be seen that there are high emissions when using hard coal, compared to the other fuels analysed, in all calculation options. The highest emissions, as in the case of the previously discussed pollutants, were recorded in option W-IV and amounted to 2243 kg. The lowest values of SOx emissions were calculated for gaseous fuel and reach values 167 to 267 times lower compared to fuel oil and 1401 to 2243 times lower compared to hard coal.
Benzo(a)pyrene emissions are a by-product of incomplete combustion of fossil fuels, so the use of hard coal for heating is characterised by higher values of benzo(a)pyrene emissions to the environment compared to the other fuels analysed. As can be seen in Figure 16, benzo(a)pyrene emissions from facilities using hard coal are around 1 kg, while for gas or fuel oil, they are negligible. Benzo(a)pyrene emissions are 3360 times higher compared to fuel oil and 420,000 times higher compared to gas fuel.

3.4. Pollutant Emissions per 1 Livestock Unit (LCU)

According to data from the European Commission [30] poultry production in 2022, there were 100,313 thousand head in Austria, 631,051 thousand head in Germany and 81,278 thousand head in Finland. The actual number of birds per country was converted to a large livestock conversion unit (LCU) and then the emissions of heating pollutants per LCU were calculated for each calculation option. This will allow comparisons to be made, pollutant emissions per 1 LCU in different locations.
The highest emissions per LCU were calculated for CO2 and occurred in Finland. However, it should be noted that CO2 emissions in all calculation options were high (from 300 kg in option W-XI to 965.8 kg in option W-IV) (Figure 18). The highest emissions occurred in Finland in buildings heated with hard coal and ranged from 911.5 kg in option W-XIII to 965.8 kg in option W-IV. The lowest, however, was in Austria, in buildings heated with hard coal and ranged from 300.8 kg (W-XI) to 319.1 kg (W-II). CO2 emissions were about 50.1% lower for natural gas compared to hard coal and about 20.5% lower compared to fuel oil. In contrast, CO2 emissions were approximately 37.3% lower for fuel oil compared to hard coal. The emissions of the other analysed pollutants are shown in Figure 19. The highest total dust emissions were calculated for the options that assume the use of hard coal (W-I, W-IV, W-VII, W-X, W-XIII, W-XVI). The highest emissions were calculated for Finland and ranged from 4.5 kg in option W-XIII (with increased floor thermal resistance) to 4.8 kg without floor thermal insulation. The lowest particulate matter emissions, for hard coal, were calculated for Austria, in option W-X and were 1.5 kg lower compared to option W-XIII. The lowest particulate matter emissions were characterised by gaseous fuel. Total dust emissions were approximately 99.9% higher than particulate matter emissions for gaseous fuel and approximately 99.7% higher than for fuel oil. In contrast, total dust emissions using fuel oil were approximately 75% higher, compared to gaseous fuels.
Emissions of CO, NOx, SOx and benzo(a)pyrene, similarly to total dust, are higher for buildings heated with hard coal compared to buildings heated with hard coal or fuel oil. Benzo(a)pyrene emissions, as mentioned above, are a product of incomplete combustion of fossil fuels and therefore occur in fossil fuel options. The NOx emissions per 1 LCU were a maximum of 1.7 kg in option W-IV, and a minimum of 0.2 kg in options W-II, W-VIII, W-XI and W-XVII. CO emissions and 1 LCU in buildings using hard coal were about 99.5% higher compared to gaseous fuels and fuel oil. The highest CO emission was 50.5 kg in option W-IV. SOx emissions per LCU, in buildings heated with gaseous fuel are about 99.9% lower for gaseous fuels compared to hard coal and 99.5% lower compared to fuel oil. For fuel oil, SOx emissions were about 88.1% lower than for hard coal.
In summary, the highest pollutant emissions were calculated for a building located in Finland, equipped with a solid fuel boiler. However, the highest poultry production, of the locations analysed, in 2022, was in Germany (631,051 thousand pcs), while the lowest was in Finland (81,278 thousand pcs). Accordingly, Figure 20 and Figure 21 show pollutant emissions from heating, considering the total production per year in the country.
Considering the production volume, the highest pollutant emissions were calculated for Germany. Given that the largest poultry manufacturer in Europe is Poland, with an annual poultry production of 1,200,098 thousand in 2022, followed by Spain (13% of total EU poultry production), Germany (12%) and France (11%), the largest poultry meat production is in Central Europe. Consequently, the need to reduce the share of conventional heating fuels and thus reduce pollutant emissions for the Central European area seems justified. Due to the location, in Central Europe, one can consider both the possibility of using photovoltaic panels, whose use is limited in northern Europe, but also heat pumps or biogas, which is a good option for agricultural production that involves the availability of manure.

4. Discussion

Facilities using hard coal for heating purposes showed the highest pollutant emissions. The results of calculations of individual pollutant emissions confirm the results presented in Nawalany et al. (2023) [14] and Marzec (2016) [27]. Hard coal combustion accounted for the highest pollutant emissions. As noted by Elahi et al. (2022) [31], 43.5% of total CO2 emissions from agriculture came from fossil fuel combustion. This is confirmed by the results presented in the paper. The highest emissions were calculated for carbon dioxide, in all the calculation options analysed. However, the type of energy carrier used (coal, fuel oil, gaseous fuels) affects the emissions of individual pollutants. Each of the fuels analysed is characterised by a different emission factor for a given pollutant. In addition, boiler efficiency, fuel consumption and the calorific value of the fuel also affect emissions. Among the components of low emissions, we distinguish benzo(a)pyrene, which results from the incomplete combustion of fossil fuels. Therefore, its emissions for hard coal are the highest, as has been noted previously by, e.g., Marzec (2016) [27], Wierzbińska and Adamus (2020) [32].
The increase in global demand for oil and natural gas makes it necessary to replace fossil fuels with renewable energy. With high emissions from burning fossil fuels, it is worth considering integrated energy systems based on wind and solar power [33,34]. The highest energy demand for heating was calculated for Jyvaskyla, which was influenced by the outdoor microclimate. This is in line with the results presented by Nawalany et al. (2021) [16] and Nawalany and Sokolowski (2022) [35]. The energy management system on Finnish farms is undergoing a change and there is more interest in alternative energy sources. Hydro-, wind- or solar power are taking an increasing share of the energy economy in Finland. The use of hard coal, oil or gaseous fuels is declining [10]. Cui et al. (2020) [36] studied the combination of photovoltaic panels together with a heat pump on a poultry farm. The study showed that the use of photovoltaic panels could meet the electricity demand of the poultry house but also cover more than 40% of the electricity demand of the heat pump installed in the facility. However, the combination of heat pump and photovoltaic panels required the support of an additional heat source, particularly during the December–February period.
The results presented in this paper support the well-known view that there is a need to move away from fossil fuels and place more emphasis on the use of renewable energy sources (RES) in the energy economy. Considering the increased energy consumption worldwide, as well as the increasing demand for food related to population growth, it is important to note the problem of greenhouse gas emissions from heating broiler houses using traditional fuels [12]. The results presented in this paper are only for a unit facility in the given calculation option.
It should be noted that broiler farms usually consist of a complex of several production halls. In the study presented by Nawalany et al. (2023) [14], pollutant emissions from broiler houses located in southern Poland (87 buildings) were presented. The study showed that CO2 emissions were as high as 24,608,365 kg. Thus, the need to modernise livestock buildings and use RES should be kept in mind.
Due to the specific nature of production, which is agricultural activity, there is the availability of manure, which can be a source of biofuel. The need to manage the manure generated during the production cycle and the high energy demand of the facility offers great potential for biogas production. At the same time, energy production from biogas could make a significant contribution to reducing emissions of harmful pollutants into the environment. An additional advantage of using manure for biogas production, next to production halls, is the reduction in storage area [12,37,38]. According to Sobczak et al. (2022) [38], biogas plants are a stable source of renewable energy. The energy production of wind farms or photovoltaics is dependent on temporary weather conditions, so additional sources are required as a backup.

5. Conclusions

The studies presented in this paper do not give a complete picture of pollutant emissions from broiler houses. This paper focuses only on the narrow aspect of pollutant emissions resulting from the combustion of fuel for heating purposes. The analysis does not consider the pollutant emissions associated with the transport of fuel to the combustion point and the emissions associated with the rearing of the birds. However, the analysis presented in the above article presents an important problem, which is the pollutant emissions arising from the generation of energy for heating. The results of the study support the well-known thesis of the need to move away from traditional sources of heating and the need to use alternative energy sources.
The specific nature of broiler house use involves high energy demand. In addition to the mode of use, the location of the building and the outdoor conditions as well as the thermal insulation of the building play an important role in the amount of energy demand for heating. The highest energy demand was calculated for the facility in Jyvaskyla (the northernmost point included in the analysis) and was 834,394 kWh. However, increasing the thermal resistance of the foundation by 3.69 m2·K·W−1, reduced the energy demand for heating by 49,604 kWh (5.9%). The lowest, however, was in Graz (Austria). The annual energy demand in a building with no thermal insulation was 553,073 kWh.
The type of energy carrier, the type and efficiency of the boiler and the energy demand affect the emissions of harmful gases into the air. The highest pollutant emissions to the air were calculated for hard coal. On an annual basis, CO2 emissions for one facility with increased floor heat resistance located in Jyvaskyla were 364,250 kg. By contrast, for the same facility located in Graz, CO2 emissions were 241,097 kg.
Increasing the thermal resistance of the floor by 3.69 m2·K·W−1 reduces pollutant emissions. Increasing the thermal insulation of the floor reduced pollutant emissions by an average of 5.7% for each of the locations analysed.
Numerical tools make it possible to determine the energy requirements of buildings, considering the systems used in them. The continuous development of numerical methods allows them to be used not only in residential or public buildings, but also in agricultural buildings. This study shows the impact of increasing the thermal resistance of a floor, depending on the location and volume of poultry production, on reducing GHG emissions into the environment. They highlight the problem of GHG emissions into the environment. Given that poultry production is increasing year on year, it is necessary to develop a system that reduces GHG emissions, through the use of renewable energy sources or by finding appropriate material and construction solutions.

Author Contributions

Conceptualization, G.N., M.Z., M.M., J.L. and P.S.; methodology, G.N., M.Z., M.M., J.L. and P.S.; software, M.M. and P.S.; validation, M.M. and P.S.; formal analysis, G.N., M.Z., M.M., J.L. and P.S.; investigation, G.N., M.Z., J.L. and P.S.; resources, G.N.; data curation, G.N., M.Z., M.M., J.L. and P.S.; writing—original draft preparation, G.N., M.Z., M.M., J.L. and P.S.; writing—review and editing, G.N., M.Z., M.M., J.L. and P.S.; visualization, M.M. and P.S.; supervision, G.N., M.Z., J.L. and P.S. All authors have read and agreed to the published version of the manuscript.

Funding

This research was funded by the Faculty of Environmental Engineering, the University of Agriculture in Krakow, through the project “Subvention 030001-D014 Environmental Engineering, Mining and Energy”.

Data Availability Statement

Data are contained within the article.

Conflicts of Interest

The authors declare no conflicts of interest.

Nomenclature

Δτtime interval;
ielement number;
Φixiyiz,heat flux between ix, iy, iz and adjacent elements [W];
Ctotal heat capacity of an element [J·K−1];
θk+1time step temperature k + 1 [K];
θktime step temperature k [K];
Δτtime step [s];
Asurface area through which heat flows between elements [m2];
Rthermal resistance [m2·K·W−1];
Bannual fuel demand [kg·year−1];
Qannual heat demand [MJ];
Wofuel calorific value [MJ·year−1];
ηboiler efficiency [–];
Epollutant emission [kg];
Wocalorific value [kJ·year−1];
EFemission factor [g·GJ−1];
Llivestock density [pcs].

References

  1. Magazzino, C.; Cerulli, G.; Haouas, I.; Unuofin, J.O.; Sarkodie, S.A. The drivers of GHG emissions: A novel approach to estimate emissions using nonparametric analysis. Gondwana Res. 2023, 127, 4–21. [Google Scholar] [CrossRef]
  2. Dunkley, C.S.; Fairchild, B.D.; Ritz, C.W.; Kiepper, B.H.; Lacy, M.P. Carbon footprint of poultry production farms in South Georgia: A case study. J. Appl. Poult. Res. 2015, 24, 73–79. [Google Scholar] [CrossRef]
  3. Forero-Cantor, G.; Ribal, J.; Sanjuán, N. Levying carbon footprint taxes on animal-sourced foods. A case study in Spain. J. Clean. Prod. 2020, 243, 118668. [Google Scholar] [CrossRef]
  4. Sokołowski, P.; Nawalany, G. Analysis of Energy Exchange with the Ground in a Two-Chamber Vegetable Cold Store, Assuming Different Lengths of Technological Break, with the Use of a Numerical Calculation Method—A Case Study. Energies 2020, 13, 4970. [Google Scholar] [CrossRef]
  5. Rondoni, A.; Grasso, S. Consumers behaviour towards carbon footprint labels on food: A review of the literature and discussion of industry implications. J. Clean. Prod. 2021, 301, 127031. [Google Scholar] [CrossRef]
  6. Kler, R.; Gangurde, R.; Elmirzaev, S.; Hossain, M.S.; Vo, N.V.T.; Nguyen, T.V.T.; Kumar, P.N. Optimization of meat and poultry farm inventory stock using data analytics for green supply chain network. Discret. Dyn. Nat. Soc. 2022, 2022, 8970549. [Google Scholar] [CrossRef]
  7. Shabir, I.; Dash, K.; Dar, A.; Pandey, V.K.; Fayaz, U.; Srivastava, S.; Nisha, R. Carbon footprints evaluation for sustainable food processing system development: A comprehensive review. Future Foods 2023, 7, 100215. [Google Scholar] [CrossRef]
  8. Minoofar, A.; Gholami, A.; Eslami, S.; Hajizadeh, A.; Gholami, A.; Zandi, M.; Ameri, M.; Kazem, H.A. Renewable energy system opportunities: A sustainable solution toward cleaner production and reducing carbon footprint of large-scale dairy farms. Energy Convers. Manag. 2023, 293, 117554. [Google Scholar] [CrossRef]
  9. Poore, J.; Nemecek, T. Reducing food’s environmental impacts through producers and consumers. Science 2018, 360, 987–992. [Google Scholar] [CrossRef]
  10. Usva, K.; Hietala, S.; Nousiainen, J.; Vorne, V.; Vieraankivi, M.L.; Jallinoja, M.; Leinonen, I. Environmental life cycle assessment of Finnish broiler chicken production–Focus on climate change and water scarcity impacts. J. Clean. Prod. 2023, 410, 137097. [Google Scholar] [CrossRef]
  11. Pelletier, N. Environmental performance in the US broiler poultry sector: Life cycle energy use and greenhouse gas, ozone depleting, acidifying and eutrophying emissions. Agric. Syst. 2008, 98, 67–73. [Google Scholar] [CrossRef]
  12. Pestisha, A.; Gabnai, Z.; Chalgynbayeva, A.; Lengyel, P.; Bai, A. On-Farm Renewable Energy Systems: A Systematic Review. Energies 2023, 16, 862. [Google Scholar] [CrossRef]
  13. Tucki, K.; Orynycz, O.; Wasiak, A.; Świć, A.; Mieszkalski, L.; Wichłacz, J. Low Emissions Resulting from Combustion of Forest Biomass in a Small Scale Heating Device. Energies 2020, 13, 5495. [Google Scholar] [CrossRef]
  14. Nawalany, G.; Sokołowski, P.; Michalik, M. The effect of floor material and construction solutions and the type of heating system on greenhouse gas (GHG) emissions—A case study. J. Build. Eng. 2023, 77, 107422. [Google Scholar] [CrossRef]
  15. Mirowski, T.; Orzechowska, M. The use of biomass fuels in individual heating in areas threatened by low emission. Polityka Energetyczna Energy Policy J. 2015, 18, 75–88. [Google Scholar]
  16. Nawalany, G.; Lendelova, J.; Sokołowski, P.; Zitnak, M. Numerical Analysis of the Impact of the Location of a Commercial Broiler House on Its Energy Management and Heat Exchange with the Ground. Energies 2021, 14, 8565. [Google Scholar] [CrossRef]
  17. Nawalany, G.; Bieda, W.; Radoń, J. Effect of floor heating and cooling of bedding on thermal conditions in the living area of broiler chickens. Arch. Geflügelk. 2010, 74, 98–101. [Google Scholar]
  18. Costantino, A.; Fabrizio, E.; Ghiggini, A.; Bariani, M. Climate control in broiler houses: A thermal model for the calculation of the energy use and indoor environmental conditions. Energy Build. 2018, 169, 110–126. [Google Scholar] [CrossRef]
  19. Izar-Tenorio, J.; Jaramillo, P.; Griffin, W.; Small, M. Impacts of projected climate change scenarios on heating and cooling demand for industrial broiler chicken farming in the Eastern U.S. J. Clean. Prod. 2020, 255, 120306. [Google Scholar] [CrossRef]
  20. Costantino, A. Development, Validation, and Application of Building Energy Simulation Models for Livestock Houses: A Systematic Review. Agriculture 2023, 13, 2280. [Google Scholar] [CrossRef]
  21. Qi, F.; Zhao, X.; Shi, Z.; Li, H.; Zhao, W. Environmental Factor Detection and Analysis Technologies in Livestock and Poultry Houses: A Review. Agriculture 2023, 13, 1489. [Google Scholar] [CrossRef]
  22. Vanbaelinghem, L.; Costantino, A.; Grassauer, F.; Pelletier, N. Alternative Heating, Ventilation, and Air Conditioning (HVAC) System Considerations for Reducing Energy Use and Emissions in Egg Industries in Temperate and Continental Climates: A Systematic Review of Current Systems, Insights, and Future Directions. Sustainability 2024, 16, 4895. [Google Scholar] [CrossRef]
  23. Boutera, Y.; Boultif, N.; Moummi, N.; Arıcı, M.; Saleh, M.; Rouag, A.; Kethiri, M.; Beldjani, C. Evaluation of the earth-air heat exchanger’s performance in improving the indoor conditions of an industrial poultry house using computational fluid dynamics verified with field tests. J. Clean. Prod. 2024, 434, 140218. [Google Scholar] [CrossRef]
  24. Wartości Opałowe (WO) i Wskaźniki Emisji CO2 (WE) w Roku 2020 do Raportowania w Ramach Wspólnotowego Systemu Handlu Uprawnieniami do Emisji za Rok 2023; KOBiZE: Warszawa, Poland, 2021.
  25. Wskaźniki Emisji Zanieczyszczeń ze Spalania Paliw dla Źródeł o Nominalnej Mocy Cieplnej do 5 MW, Zastosowane do Automatycznego Wyliczenia Emisji w Raporcie do Krajowej Bazy za 2022 r; KOBiZE: Warszawa, Poland, 2022.
  26. Directive 2003/87/EC; Directive 2003/87/EC of the European Parliament and of the Council of 13 October 2003 Establishing a Scheme for Greenhouse Gas Emission Allowance Trading within the Community and Amending Council Directive 96/61/EC. European Union: Brussels, Belgium, 2003.
  27. Marzec, E. Analiza energetyczna i ekologiczna zastosowania wybranych systemów ogrzewania domu jednorodzinnego. Arch. Inst. Tech. Ciepl. 2016, 2, 87–109. [Google Scholar]
  28. Council of Ministers Regulation of January 31, 2023 on the “Program of Measures to Reduce Water Pollution by Nitrates from Agricultural Sources and Prevent Further Pollution”. Available online: https://sip.lex.pl/akty-prawne/dzu-dziennik-ustaw/program-dzialan-majacych-na-celu-zmniejszenie-zanieczyszczenia-wod-21790383 (accessed on 15 September 2024).
  29. Nawalany, G.; Sokołowski, P. Improved Energy Management in an Intermittently Heated Building Using a Large Broiler House in Central Europe as an Example. Energies 2020, 13, 1371. [Google Scholar] [CrossRef]
  30. Available online: https://agridata.ec.europa.eu/extensions/DashboardPoultry/PoultryProduction.html (accessed on 6 February 2024).
  31. Elahi, E.; Khalid, Z.; Zhang, Z. Understanding farmers’ intention and willingness to install renewable energy technology: A solution to reduce the environmental emissions of agriculture. Appl. Energy 2022, 309, 118459. [Google Scholar] [CrossRef]
  32. Wierzbińska, M.; Adamus, A. Wpływ rodzaju spalanego paliwa oraz urządzenia grzewczego na jakość powietrza atmosferycznego. Ecol. Eng. 2020, 21, 17–25. [Google Scholar]
  33. Li, Z.; Wu, L.; Xu, Y.; Zheng, X. Stochastic-Weighted Robust Optimization Based Bilayer Operation of a Multi-Energy Building Microgrid Considering Practical Thermal Loads and Battery Degradation. IEEE Trans. Sustain. Energy 2022, 13, 668–682. [Google Scholar] [CrossRef]
  34. Ding, B.; Li, Z.; Li, Z.; Xue, Y.; Chang, X.; Su, J.; Jin, X.; Sun, H. A CCP-based distributed cooperative operation strategy for multi-agent energy systems integrated with wind, solar, and buildings. Appl. Energy 2024, 365, 123275. [Google Scholar] [CrossRef]
  35. Nawalany, G.; Sokołowski, P. Interaction between a Cyclically Heated Building and the Ground, for Selected Locations in Europe. Energies 2022, 15, 7493. [Google Scholar] [CrossRef]
  36. Cui, Y.; Theo, E.; Gurler, T.; Su, Y.; Saffa, R. Feasibility of hybrid renewable heating system application in poultry house: A case study of East Midlands, UK. Int. J. Low-Carbon Technol. 2020, 16, 73–88. [Google Scholar] [CrossRef]
  37. Ramos-Suárez, J.L.; Ritter, A.; Mata González, J.; Camacho Pérez, A. Biogas from animal manure: A sustainable energy opportunity in the Canary Islands. Renew. Sustain. Energy Rev. 2019, 104, 137–150. [Google Scholar] [CrossRef]
  38. Sobczak, A.; Chomać-Pierzecka, E.; Kokiel, A.; Różycka, M.; Stasiak, J.; Soboń, D. Economic Conditions of Using Biodegradable Waste for Biogas Production, Using the Example of Poland and Germany. Energies 2022, 15, 5239. [Google Scholar] [CrossRef]
Figure 1. Arrangement diagram for measuring points θA1RHA1–θA3RHA3—for measuring indoor air temperature and relative humidity, θp1–θp8—for measuring floor temperature, θzRHz—for measuring outdoor air temperature and relative humidity (a) projection, (b) cross-section.
Energies 17 04761 g001aEnergies 17 04761 g001b
Figure 2. TRY characteristics for Graz (Austria). Source: Database WUFI®plus.
Energies 17 04761 g002
Figure 3. TRY characteristics for Jyväskylä (Finland). Source: Database WUFI®plus.
Energies 17 04761 g003
Figure 4. TRY characteristics for Kassel (Germany). Source: Database WUFI®plus.
Energies 17 04761 g004
Figure 5. Waveforms for the measured and calculated temperature at the points: θp3.
Energies 17 04761 g005
Figure 6. Average daily energy demand for broiler house heating; options W-I, W-IV, W-VII, W-X, W-XIII, W-XVI.
Energies 17 04761 g006
Figure 7. Annual energy demand for broiler house heating; options W-I, W-IV, W-VII, W-X, W-XIII, W-XVI.
Energies 17 04761 g007
Figure 8. Fuel demand [B]—hard coal; options W-I, W-IV, W-VII, W-X, W-XIII, W-XVI.
Energies 17 04761 g008
Figure 9. Fuel demand [B]—gaseous fuel; options W-I, W-IV, W-VII, W-X, W-XIII, W-XVI.
Energies 17 04761 g009
Figure 10. Fuel demand [B]—fuel oil; options W-I, W-IV, W-VII, W-X, W-XIII, W-XVI.
Energies 17 04761 g010
Figure 11. Annual fuel demand [B], for each of the calculation options analysed (I-XVIII).
Energies 17 04761 g011
Figure 12. Total dust emissions from an individual building, for each calculation option analysed (I-XVIII).
Energies 17 04761 g012
Figure 13. CO2 emissions from an individual building, in each of the calculation options analysed (I-XVIII).
Energies 17 04761 g013
Figure 14. CO emissions from an individual building, in each of the calculation options analysed (I-XVIII).
Energies 17 04761 g014
Figure 15. NOx emissions from an individual building, in each of the calculation options analysed (I-XVIII).
Energies 17 04761 g015
Figure 16. SOx emissions from an individual building, in each of the calculation options analysed (I-XVIII).
Energies 17 04761 g016
Figure 17. Benzo(a)pyrene emissions from an individual building, in each of the calculation options analysed (I-XVIII).
Energies 17 04761 g017
Figure 18. CO2 emissions per 1 LCU, for each calculation option analysed (I-XVIII).
Energies 17 04761 g018
Figure 19. Emissions of pollutants (total dust, CO, NOx, SOx and Benzo(a)pyrene) per 1 LCU, for each calculation option analysed (I-XVIII).
Energies 17 04761 g019
Figure 20. CO2 emissions per total poultry production, for all calculation options I-XVIII.
Energies 17 04761 g020
Figure 21. Pollutant emissions of pollutants (total dust, CO, NOx, SOx and Benzo(a)pyrene) per total poultry production, for all calculation options I-XVIII.
Energies 17 04761 g021
Table 1. Calculation option.
AssumptionsCalculation Options
W-IW-IIW-IIIW-IVW-VW-VIW-VIIW-VIIIW-IXW-XW-XIW-XIIW-XIIIW-XIVW-XVW-XVIW-XVIIW-XVIII
Material and construction floor solutions- Concrete C12/15, 20 cm,xxxxxxxxx
- Gravel and sand ballast 20 cm,
- Sandy clay
- Concrete C12/15, 10 cm, xxxxxxxxx
- Extruded polystyrene XPS 10 cm,
- Concrete C12/15, 20 cm,
- Gravel and sand ballast 20 cm,
- Sandy clay
Boiler150 kWx x x x x x
fine coal boiler
2 × 70 kW x x x x x x
gas heater
2 × 70 kW x x x x x x
oil heater
Boiler efficiency [-]0.75x x x x x x
0.9 xx xx xx xx xx xx
LocationAustria (Graz)xxx xxx
Finland (Jyvaskyla) xxx xxx
Germany (Kassel) xxx xxx
Table 2. Physical parameters of ground and building materials applied for calculations.
MaterialVolumetric Density
[kg·m−3]
Specific Heat
[J·kg−1·K−1]
Heat Transfer Coefficient
[W·m−1·K−1]
Concrete C12/1522008501.60
Mineral wool408000.050
Extruded polystyrene XPS4015000.030
Cellular concrete6008500.140
Gravel and sand ballast15808500.505
Sandy clay15508500.454
Table 3. Assumptions for calculations, according to the National Balancing and Emissions Management Centre.
FuelWO [MJ·kg−1]
Hard coal24.99
Natural gas48.00
Fuel oil40.40
Table 4. The pollutant emission factors according to the National Balancing and Emissions Management Centre.
PollutantHard Coal
[g·GJ−1]
Gaseous Fuel
[g·GJ−1]
Fuel Oil
[g·GJ−1]
Total dust4800.52
CO296,37057,65072,480
CO50403030
NOx1704070
SOx5600.480
benzo(a)pyrene0.280.00000080.0001
Disclaimer/Publisher’s Note: The statements, opinions and data contained in all publications are solely those of the individual author(s) and contributor(s) and not of MDPI and/or the editor(s). MDPI and/or the editor(s) disclaim responsibility for any injury to people or property resulting from any ideas, methods, instructions or products referred to in the content.

