Article

Flow Characteristics of Oil-Carrying by Water in Downward-Inclined and Horizontal Mobile Pipeline

Petroleum, Oil & Lubricants Department, Army Logistics Academy, Chongqing 401331, China
*
Authors to whom correspondence should be addressed.
These authors contributed equally to this work.
Energies 2024, 17(19), 4779; https://doi.org/10.3390/en17194779
Submission received: 7 July 2024 / Revised: 14 September 2024 / Accepted: 23 September 2024 / Published: 24 September 2024
(This article belongs to the Section H: Geo-Energy)

Abstract

:
After transporting oil with a mobile pipeline, it is necessary to empty the oil within the pipeline. A common method is to inject water into the inlet to push the oil out. However, due to the effects of buoyancy and surface tension, the oil within the pipeline tends to accumulate at the elevated section, forming a stagnant oil layer, which will limit the evacuation efficiency. Based on the multiphase flow theory, a hydrodynamic model of oil–water flow was utilized to describe the pressure distribution and the thickness of the stagnant oil layer within the pipeline. A numerical model for oil-carrying water flow in a downward-inclined mobile pipeline was established, and the model was solved under given initial and boundary conditions to obtain the characteristics of the oil-carrying water flow within the pipeline. The calculation results indicate that the initial water phase velocity has a promoting effect on the oil-carrying capacity of water flow. The pipe diameter is negatively correlated with the capacity. The initial thickness of the oil is not directly related to the capacity but can increase the oil phase front velocity, which can enable the oil phase to be emptied more quickly. When the initial water phase velocity is lower than the critical water phase velocity, an increase in the inclination angle will weaken the capacity of water flow to carry oil. Conversely, when the velocity of the initial water phase is higher than the critical water phase velocity, an increase in the inclination angle will enhance the capacity.

1. Introduction

Mobile pipeline is a type of logistics equipment that can continuously transport bulk fuel from the strategic rear to the tactical front, usually laid on the surface of the ground. Its advantage is that it can be quickly laid out and quickly removed, thus offering good mobility and flexibility [1,2]. When the fuel transportation task is completed, it is necessary to empty the fuel in the pipeline thoroughly. If the fuel in the pipeline is not emptied completely, it will lead to serious fuel waste or environmental pollution. More importantly, the speed of pipeline withdrawal will directly affect the efficiency of fuel supply support.
The emptying methods for mobile pipelines mainly include three types: self-flow emptying, gas displacement of oil, and water displacement of oil [3,4]. The water displacement method works by switching the oil source to a water source through a valve and continuously pressurizing it with a pump to displace the stored oil in the pipeline with water. In contrast to the self-flow emptying and gas displacement method, the water displacement method has the advantages of simple operation, fast speed, less fuel loss, and high safety [5,6]. Namely, when there is an adequate water source and the temperature is above 0 °C, the water displacement is preferred.
However, during the process of water displacement, because the density of oil is less than that of water, the oil will float upward and contact the pipe wall under the influence of buoyancy. Under the influence of viscous stress, the oil becomes hard to discharge and usually forms an accumulation of oil, which will limit the evacuation efficiency. It has been found in practice that this phenomenon is particularly evident in the downward-inclined sections of the mobile pipeline. To better address this issue and improve the efficiency of emptying, it is necessary to conduct research on the characteristics of oil-carrying by water within the mobile pipeline.
The issue of oil-carrying water in pipelines belongs to the phenomenon of immiscible oil–water two-phase flow [7,8,9]. To obtain a comprehensive understanding of this flow pattern, a series of studies have been conducted. Xu et al. [10,11,12] used two steel pipes with undulating terrain and different diameters as experimental systems, conducting experiments on water-carrying by oil flow with 0# diesel and water. They found that under the same superficial oil flow velocity, regardless of the amount of retained water, the volume of water carried out by the oil decreases as the pipe diameter increases. Zhang et al. [13] conducted experiments on the water phase reflux ratio of the oil–water velocity for upward-inclined pipelines with four different diameters. The analysis revealed that the reflux ratio of the water phase is positively correlated with pipe diameter, resulting in a reduction in the water volume carried out by the oil. Xiong et al. [14,15] set up an experimental system with eight groups of annular channels at different upward-inclined angles with a transparent glass pipe to observe the critical flow velocity at which water accumulation is carried out completely by the oil flow. Based on the experimental results and the similarity criteria of fluid, they deduced the relationship between the critical flow velocity and different inclination angles and pipe diameters and found that when the pipe diameter and inclination angle increase, the critical oil flow velocity to carry water needs to increase accordingly, indicating that there is a negative correlation between the angle of inclination and the water-carrying capacity of the oil flow. Yang [16] used a “downward-upward inclined” pipe section annular channel experimental system to conduct experiments on three upward angles and two downward angle combinations. Under the premise of a fixed amount of water accumulation, it was found that when the inclination angle remains unchanged, the capacity of oil flow to carry water decreases significantly when the upward angle increases. When comparing the same upward angle with different downward angles, the water-carrying capacity decreases when the downward angle increases, but the impact is much smaller. Unlike batch transportation, the oil flow carries water mainly by the action of the shear force of the oil phase to carry the stagnant water out. To investigate the effect of oil phase flow velocity on water-carrying capacity, through experimentations, Xu et al. [17] found that the velocity of water to be carried is positively correlated with the superficial velocity of the oil phase.
From the current research conducted, it appears that the flow characteristics of oil–water two-phase flow primarily revolves around the mechanism of water-carrying by oil flow within fixed pipelines. However, during the emptying process of mobile pipelines, due to the buoyancy and surface tension, the retention position of accumulated oil within mobile pipelines differs from that of water accumulation in fixed pipelines, and the impact of different working conditions on the flow pattern will also show differences. Therefore, a research gap remains on the flow characteristics of oil-carrying by water within the downward-inclined and horizontal mobile pipelines. In order to investigate the mechanism of oil-carrying by water flow within the mobile pipeline, this paper, based on a two-dimensional simplified liquid layer thickness model, utilized numerical simulation methods to investigate the impact of different water phase velocities, initial oil phase thickness, downward-inclined pipe angles, and pipe diameters on the water’s capacity to carry oil and the front velocity of the oil phase.

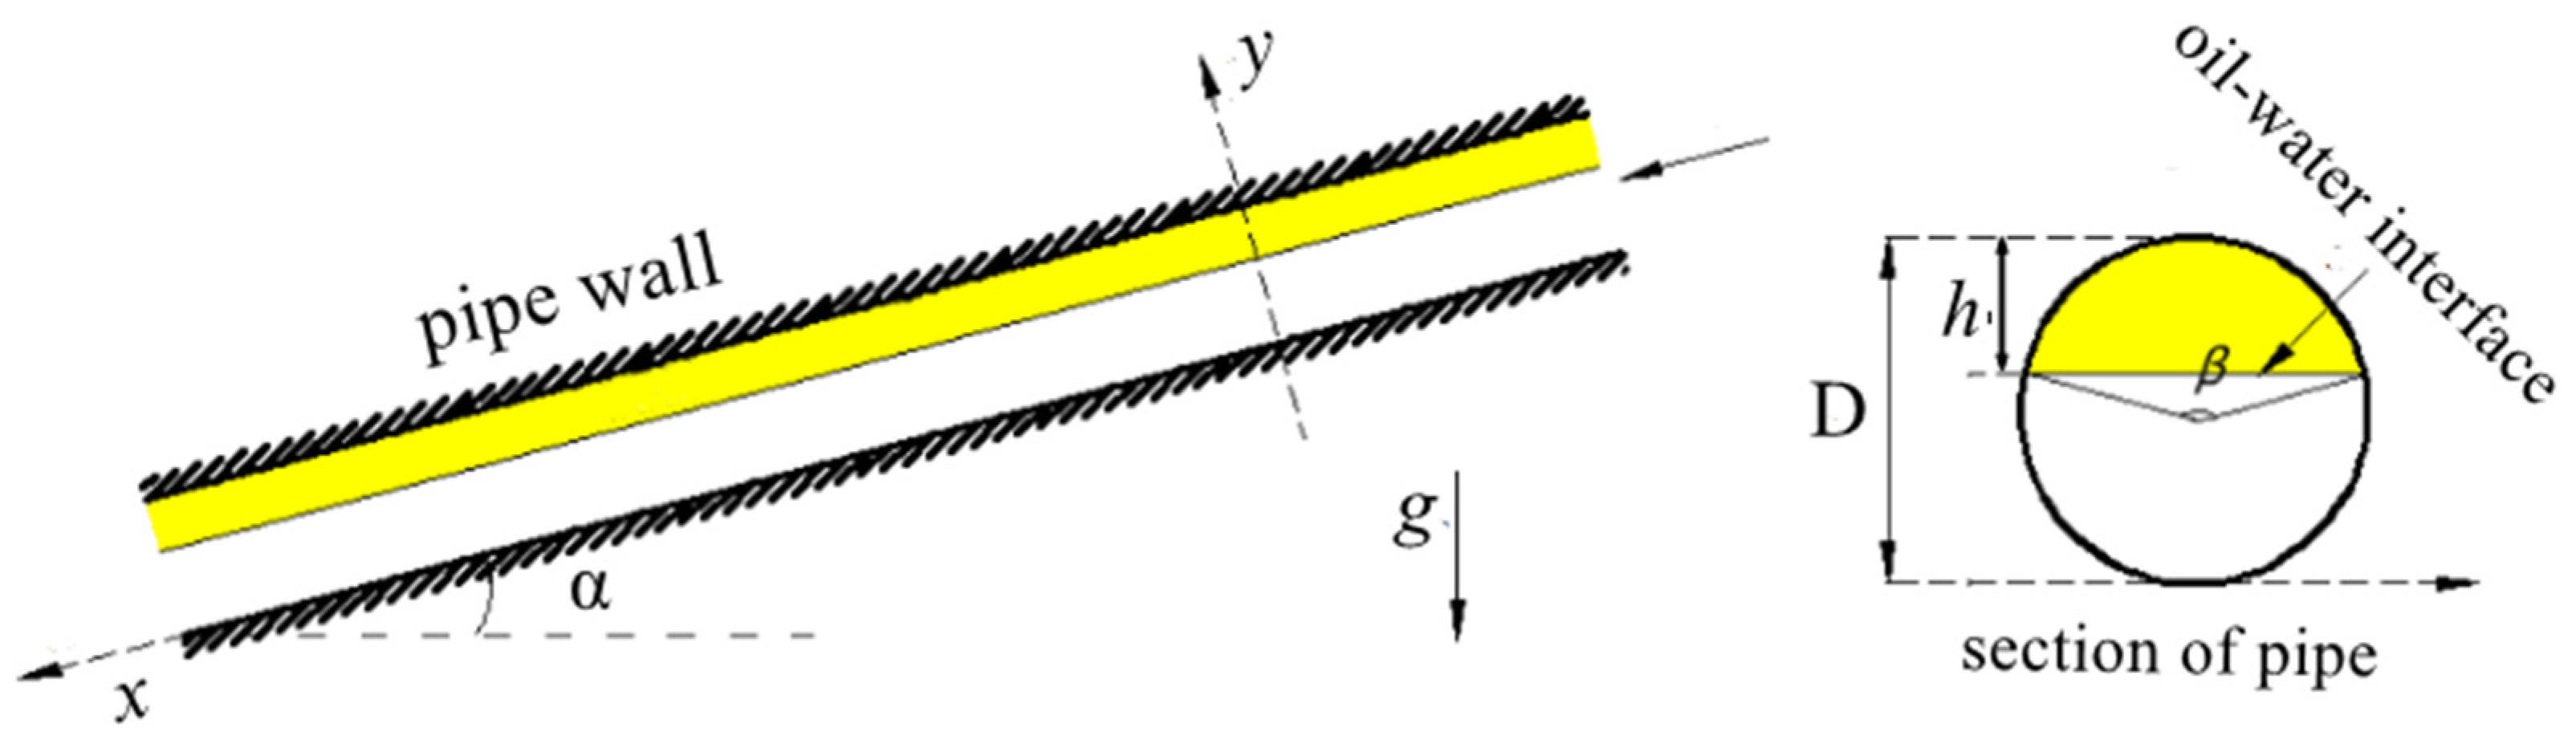
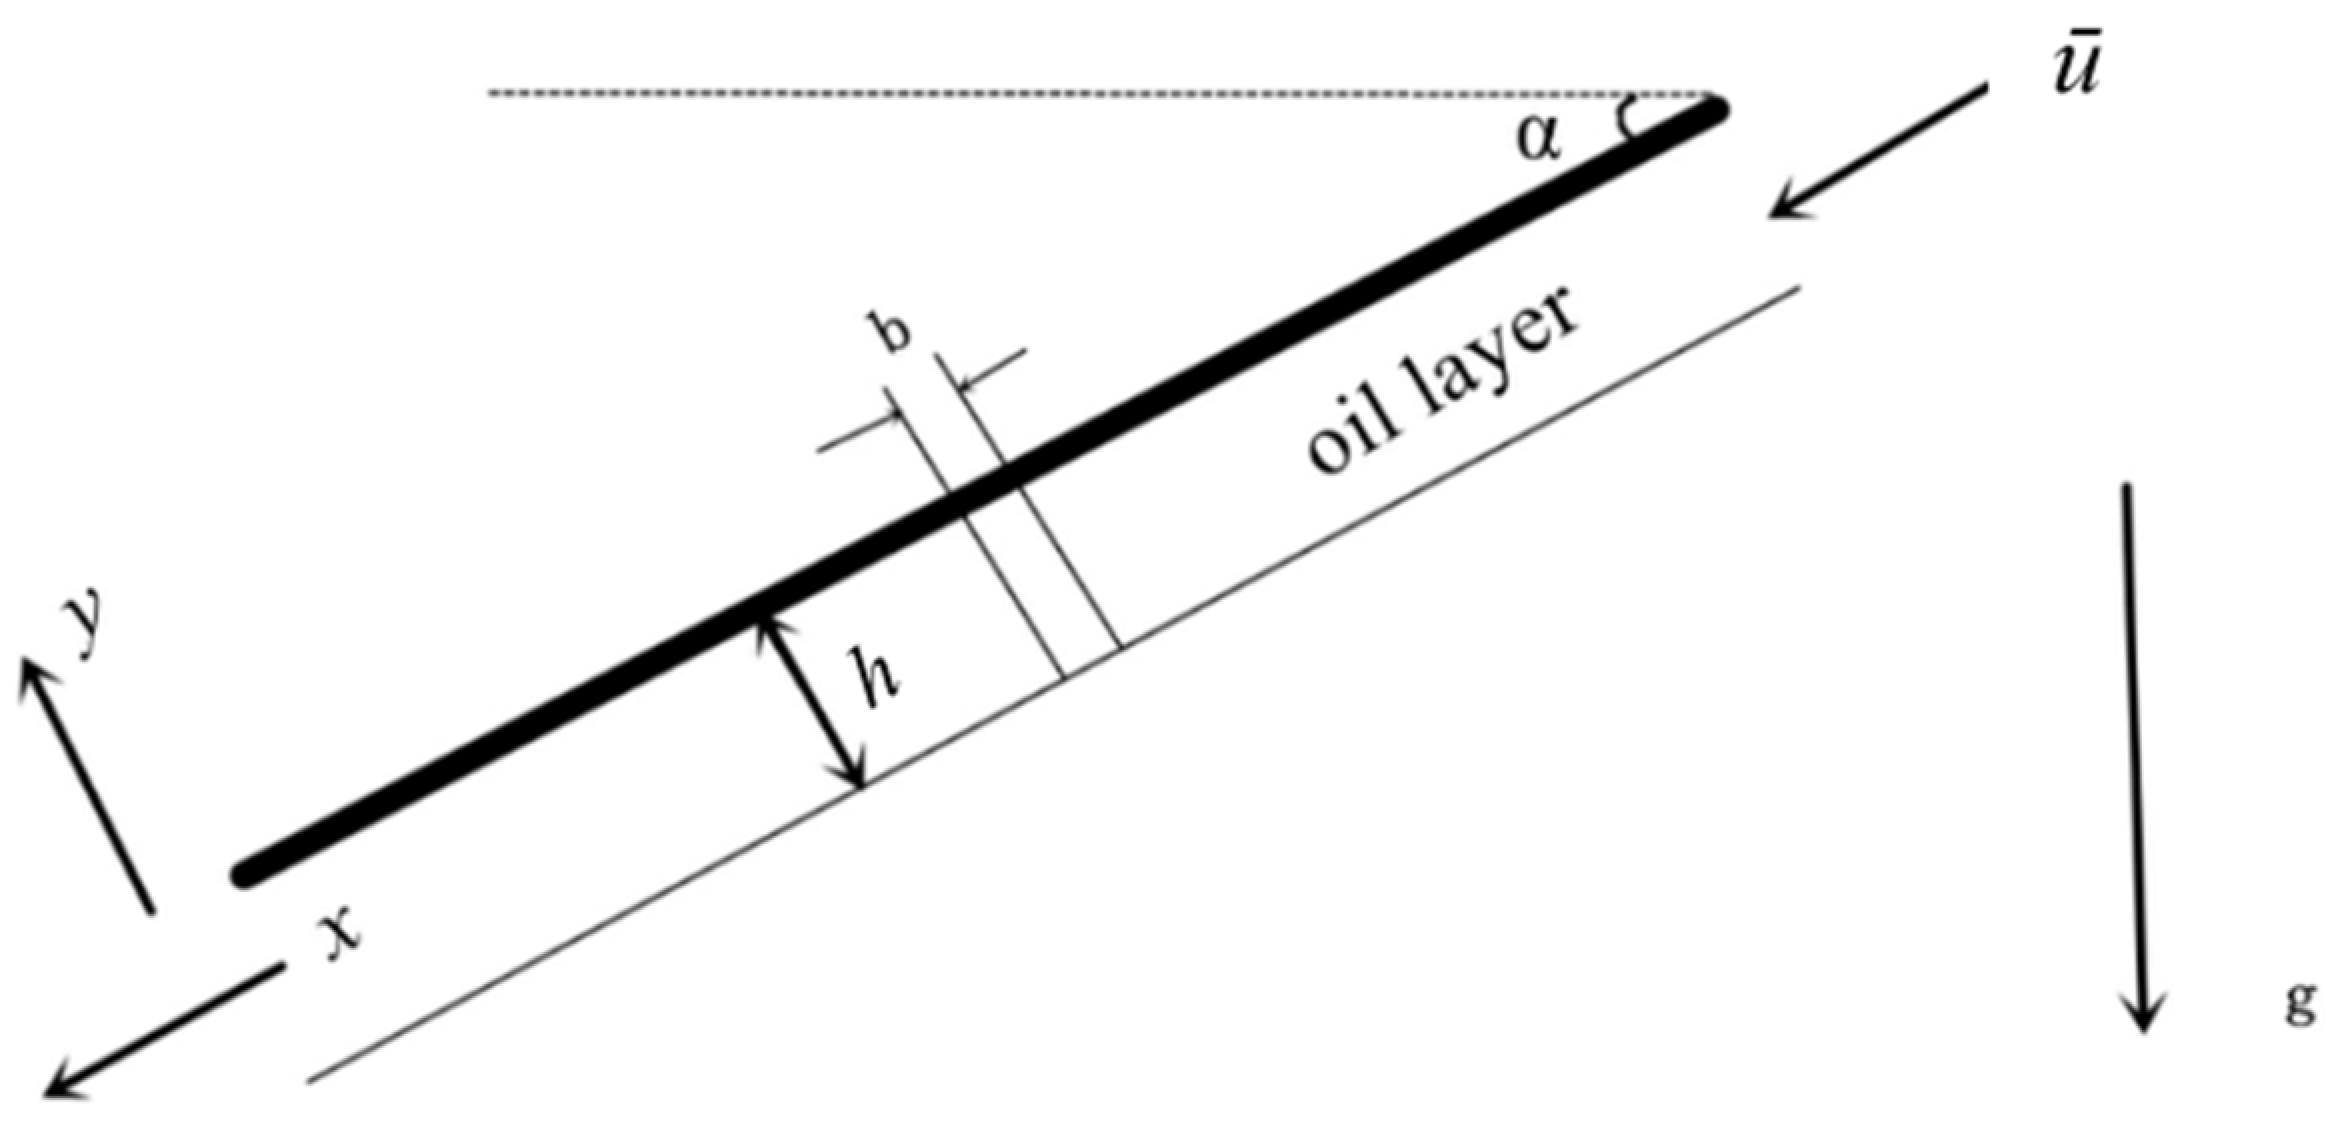
2. Mathematical Model

The oil–water hydrodynamics model [18] is utilized to describe the multiphase flow within the pipeline. It can be seen from Figure 1 that the yellow area represents the oil phase, and the white area represents the water phase, with the oil layer positioned above in the downward-inclined pipeline.
Due to the relatively small thickness of the oil layer compared to the pipe diameter, the retained oil layer in the circular pipe can be simplified to a flat layer on an inclined flat plate. Considering a micro-element section of the axial length dx in the pipeline, the pressure gradient in the x-direction can be derived by writing the conservation of momentum equation for the water phase in the x-direction:
d p d x = τ i 2 β π D + τ w 2 D 2 β π ρ w g sin α
where ρw is the density of the water phase, g represents the acceleration due to gravity, α is the angle of inclination of the pipeline, β represents the central angle corresponding to the retained oil layer, p denotes the pressure at the cross-section x, D represents the diameter of the pipeline, τi stands for the oil–water interface shear stress, and τw is the shear stress between the pipeline wall and the water phase, which can be calculated by empirical formulas [19,20,21,22].
Figure 2 describes the oil–water two-phase flow simplified to a flat layer on a flat plate. Taking a control volume with a thickness of b and writing the momentum transfer equation for the oil phase flow, the relationship between the oil layer thickness and time can be obtained:
d h d t = τ i ρ o u i 1 + 2 β h π D + τ o ρ o u i τ w ρ o u i 2 h D 2 β π + g h u i sin α 1 + ρ w ρ o
where h represents the oil layer thickness, ui denotes the interface velocity, ρo represents the oil phase density, and τo stands for the shear stress between the oil and the pipe wall.

3. Methodology

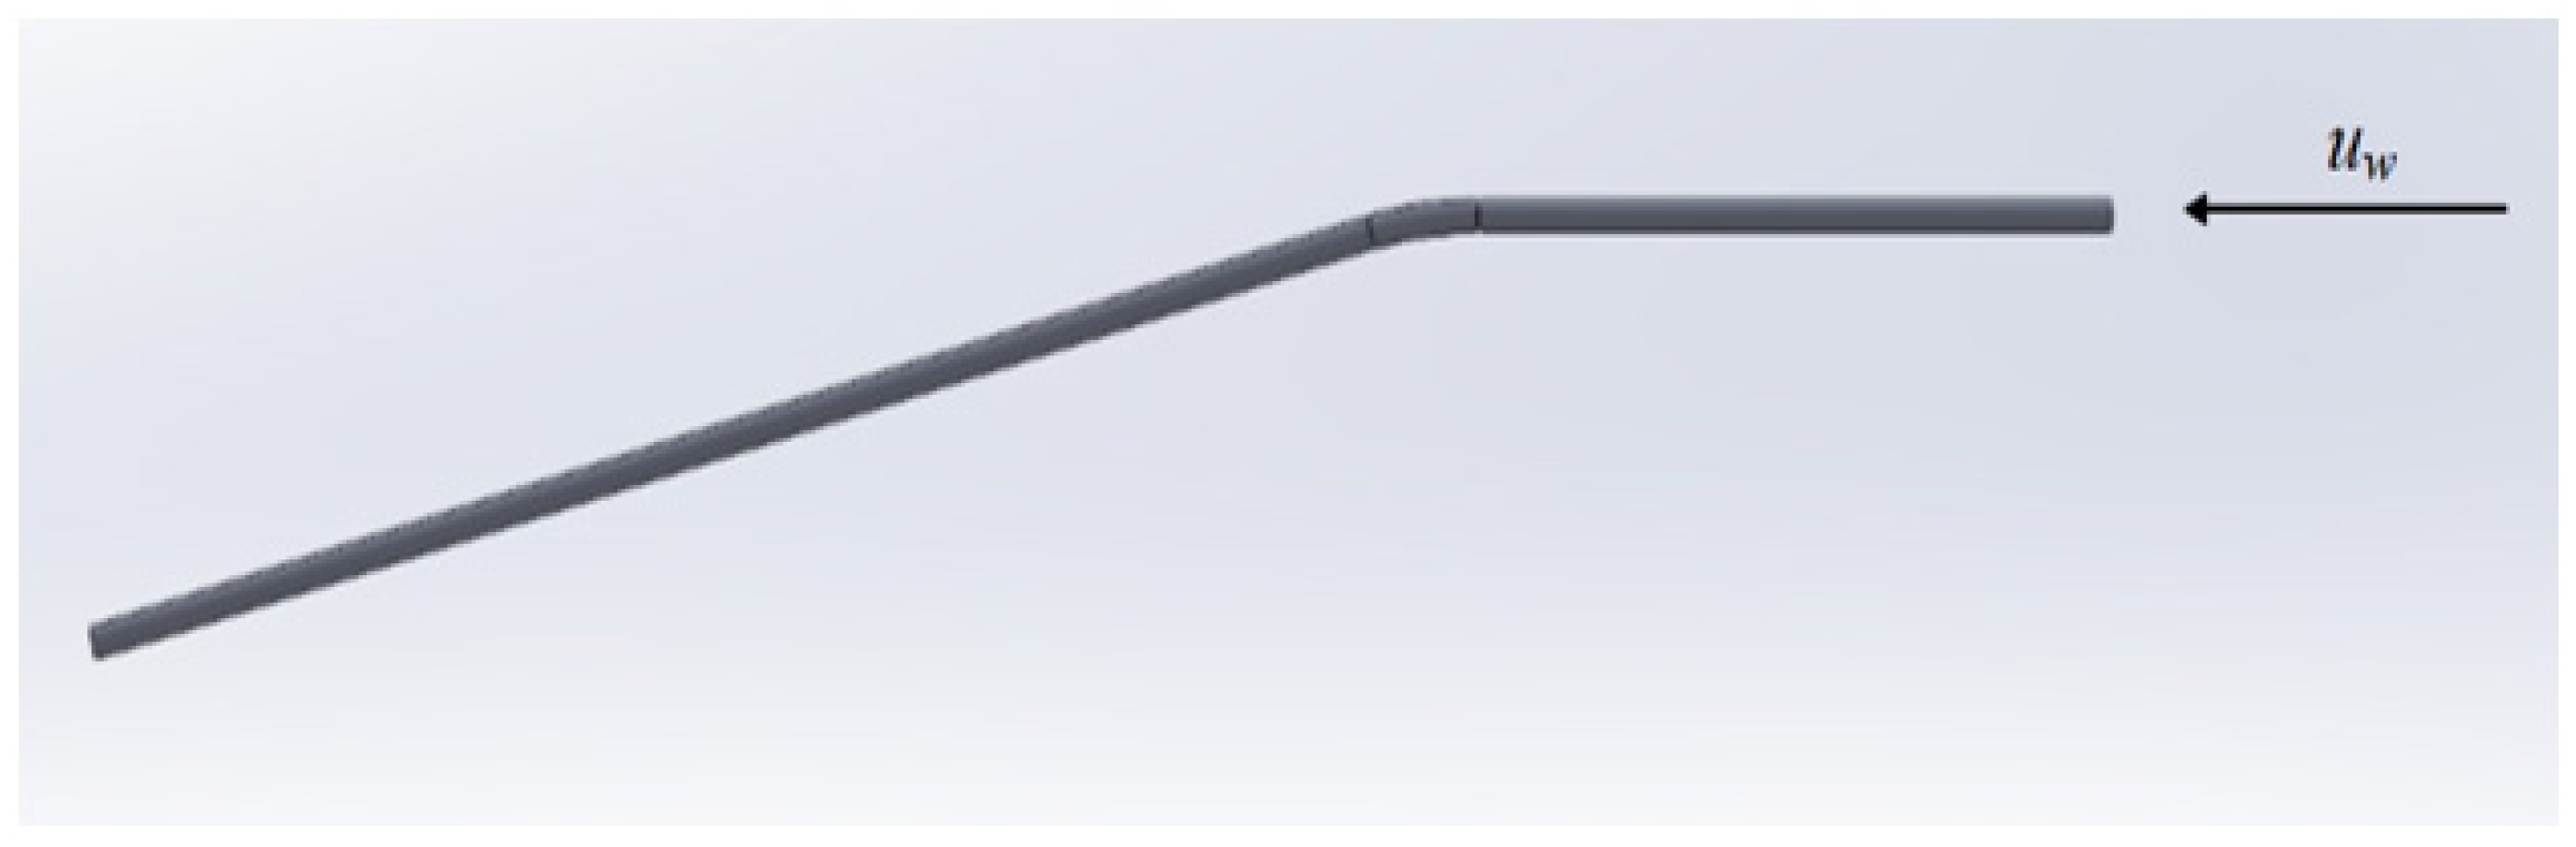
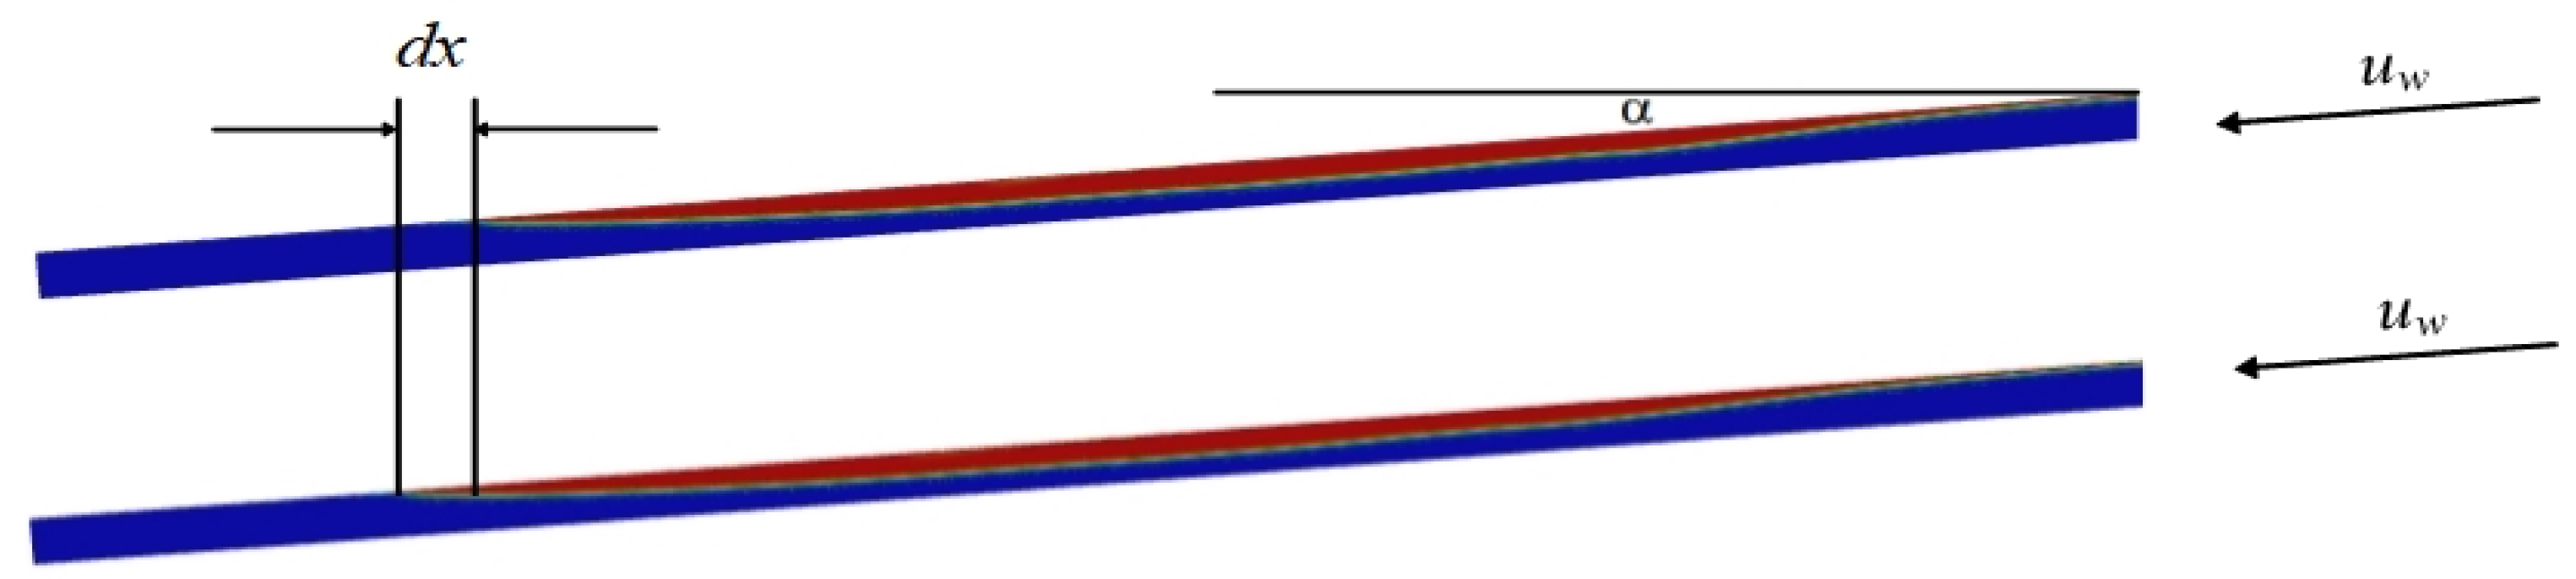
3.1. Geometric Model

The diameter of mobile pipelines is typically 100 mm or 150 mm, and the initial water phase velocity during the actual emptying process generally does not exceed 2 m/s, with the angle of inclination not exceeding 45 degrees. To enhance computational efficiency, the flow was simulated using fluid similarity criteria. Since the inertial forces generated by the liquid flow play a dominant role in the water–oil displacement in mobile pipelines, the Froude number (Fr) can be used as a similarity criterion to scale the actual flow process. Denoted the inlet water phase velocity as uw, under the 15 mm pipe diameter working condition, the maximum velocity of water flow was designed to be 0.8 m/s. According to the similarity criteria with a constant Froude number (Fr), a comparison was made between some of the calculated inlet initial water phase velocities and the actual initial water phase velocities during the water–oil displacement in mobile pipelines, as shown in Table 1.
From Table 1, we can see that the designed experimental initial water phase velocities can fully cover the initial water phase velocities during the actual mobile pipeline water–oil displacement process.
To simulate the flow process with ANSYS Fluent 2021 R1, the first step is to establish a geometric model of the fluid. To fully eliminate the inlet effect and allow the evacuation process to develop adequately, the length of the horizontal pipe is typically not less than 20 times the pipe diameter. Consequently, the horizontal pipe length is chosen to be 0.5 m, and the length of the downward-inclined pipe section is 1 m; the curvature radius R at the bend should be R ≥ 5D, and a curvature radius of 100 mm is taken. Figure 3 illustrates a three-dimensional model of a horizontal downward-inclined pipeline with a pipe diameter of 20 mm and an inclination angle of 15 degrees.
Since this paper studies the issue of water carrying oil, the flow near the wall surface is more complex due to the larger velocity gradient. To capture the subtle changes in the flow, the mesh is refined during the surface grid division, using a three-layer grid with a maximum size of 0.3 mm, a minimum size of 0.1 mm, and a growth rate of 1.2. For the volume grid, a mixed grid division method of hexahedra and polyhedra is selected, with the same growth rate of 1.2, and the maximum size is set to 1 mm. Taking a pipe with an inclined angle of 15° and a diameter of 20 mm as an example, the cross-sectional grid after division is shown in Figure 4, with a grid quality of 0.801.
To eliminate the impact of grid division on simulation results, a grid independence verification was conducted for a case with a diameter of 15 mm, an inclination angle of 5 degrees, a water phase velocity of 0.1 m/s, and an oil phase thickness of 2.5 mm. Preliminary grid division was carried out based on the aspect ratio of cell dimensions, and Table 2 lists the four grid division schemes used. The criterion for judging grid independence was the distribution of water and oil phases at the same cross-section, as depicted in Figure 5.
It can be found that when the grid size increases from 0.2 mm to 1.5 mm, both the number of grids and the average grid quality decrease. The rate of decrease in the number of grids diminishes while the rate of decrease in average grid quality increases. When the grid size is increased from 0.2 mm to 0.5 mm, the reduction in the number of grids is the most significant.
From Figure 5, it can be observed that the distribution contours in schemes 1, 2, and 3 are essentially consistent with each other as the grid size increases. However, in scheme 4, the accumulation of oil is more concentrated compared to the other three grid division schemes, and due to the larger grid size, the oil–water interface appears blurred. Therefore, the grid division scheme 4 needs to be discarded.
Taking the impact of both computation time and accuracy into account, this paper selects grid division scheme 2 as the grid division plan for simulation.

3.2. Physical Properties

The mobile pipeline is primarily used for transporting diesel fuel, so Grade 0 diesel oil and water are chosen as the simulation materials. The densities and viscosities are taken from the test results at 25 °C, and the interfacial tension coefficient between the two phases is taken to be 0.0182 N·m−1. The detailed parameter settings are shown in Table 3.

3.3. Computational Parameters

Since the process of water-carrying oil in a downward-inclined mobile pipeline is mainly related to factors such as pipe diameter, inclination angle, initial water phase velocity, and initial oil phase height, the computational parameters are set as follows: the pipe diameters are chosen to be 15 mm and 20 mm, the inclination angles are 5°, 15°, 30°, and 45°, and the designed simulation flow velocities are 0.05 m/s, 0.1 m/s, 0.2 m/s, 0.4 m/s, and 0.8 m/s.

3.4. Initial Conditions

The simulated pipeline length is 0.5 m, which is approximately 25 to 33 times the pipe diameter (D), greater than 20 D. This allows us to consider that the flow can fully develop after entering the horizontal pipeline. At the same time, the inlet water phase volume fraction is set to 1 to ensure that the inlet is a single-phase water.
To research the impact of the initial thickness of the oil layer on the emptying process, the initial oil phase thickness is designed to be 2.5 mm, 5 mm, and 7.5 mm for a pipe diameter of 15 mm. For a pipe diameter of 20 mm, the initial oil phase thickness is designed to be 10 mm. The Patch function is utilized to initialize the model to achieve an oil layer of a certain thickness, as shown in Figure 6. In Figure 6, the red regions represent the oil phase obtained during initialization, the blue regions represent the water, and the colors in between represent the oil–water mixture.

3.5. Boundary Conditions

Taking a simulated pipeline with a diameter of 15 mm, an angle of 5 degrees, an initial oil thickness of 5 mm, and a flow velocity of 0.2 m/s as an example, the specific boundary condition settings are listed in Table 4.

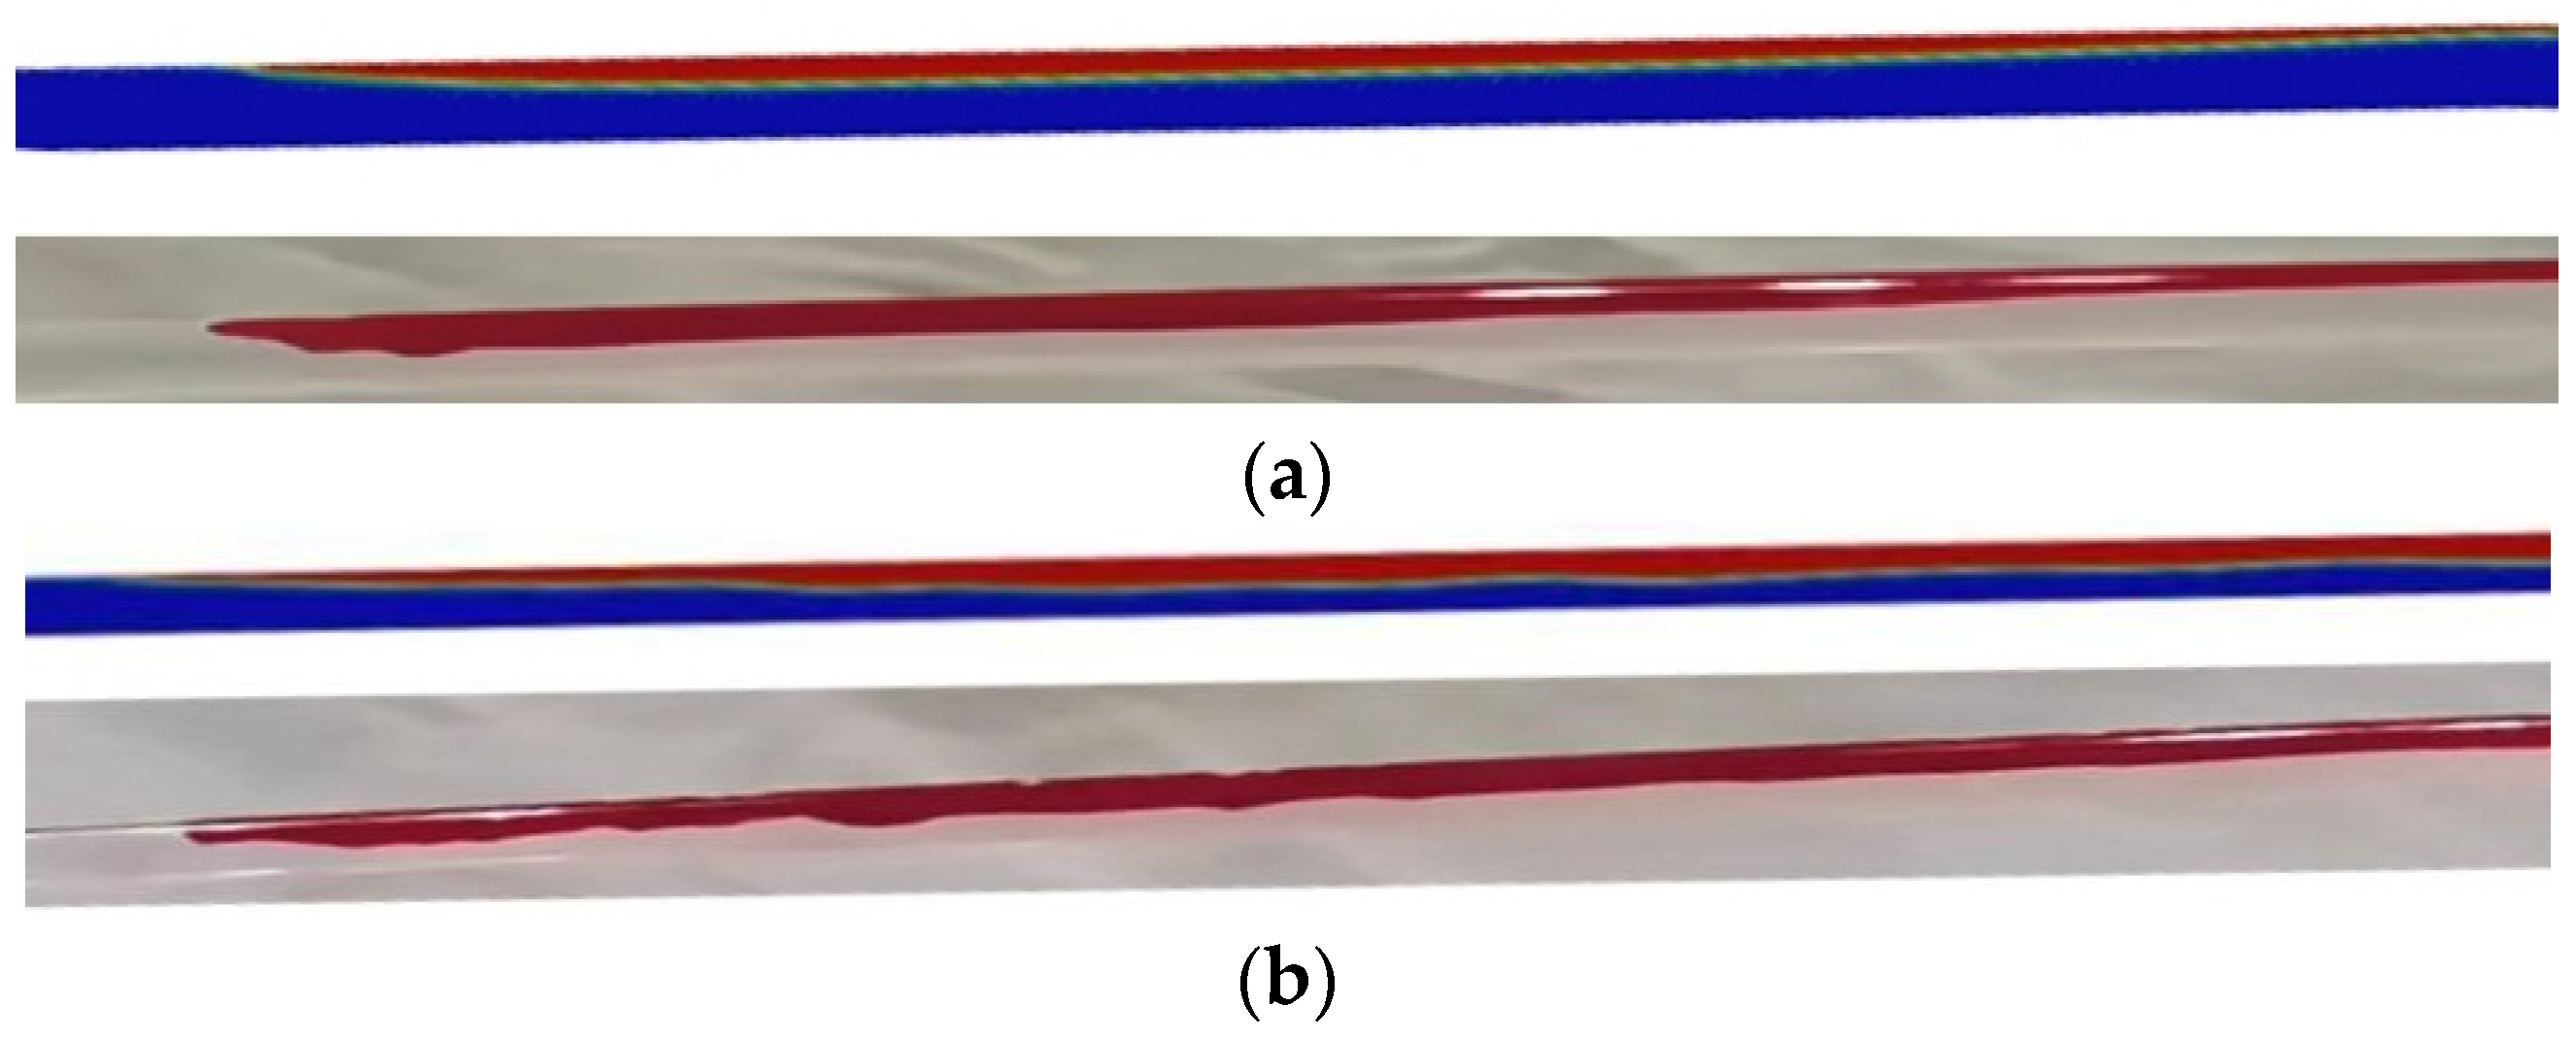
3.6. Model Verification

To validate the model, a loop experiment platform was constructed. A high-speed camera was utilized to capture the oil–water interface. The dip angle was adjusted using a height-adjustable stand, and the inlet water phase velocity was changed through a control panel. The constructed experimental platform is shown in Figure 7, and the corresponding process is shown in Figure 8.
Figure 9 shows the flow pattern comparisons between simulation and experiment under some conditions.
Comparing the simulation with the experimental results, it can be observed that the simulation matches the experiments well when smooth stratified flows occur in the experiments. Increasing the flow velocity, the oil–water flow pattern transitions toward intermittent flow and double continuous flow. The complexity of the flow increases at this point. However, judging from the flow patterns, the types of flow patterns in the simulation do not change with different conditions compared to the experiments. Therefore, it can be concluded that the computational model is accurate and effective.
Through experimentation, it was found that no matter the working conditions, there exists an initial water phase velocity that can completely remove the oil phase from the pipeline. This initial water velocity is referred to as the critical water phase velocity. According to the geometric model established in this experiment, there are two critical water phase velocities: one is the critical water phase velocity that can completely remove the stagnant oil from the horizontal pipe, uw1, and the other is the critical water phase velocity that can completely remove the stagnant oil from the inclined pipe, uw2. It was observed in the experiments that uw2 is always greater than uw1. The oil-carrying capacity of the water in the pipeline can be measured by the critical water phase velocity; the smaller the critical water phase velocity, the stronger the oil-carrying capacity of the water flow under those conditions. The critical water phase velocities for oil-carrying measured in the experiments under different pipe diameters and different dip angles can be found in Table 5.

4. Results and Discussion

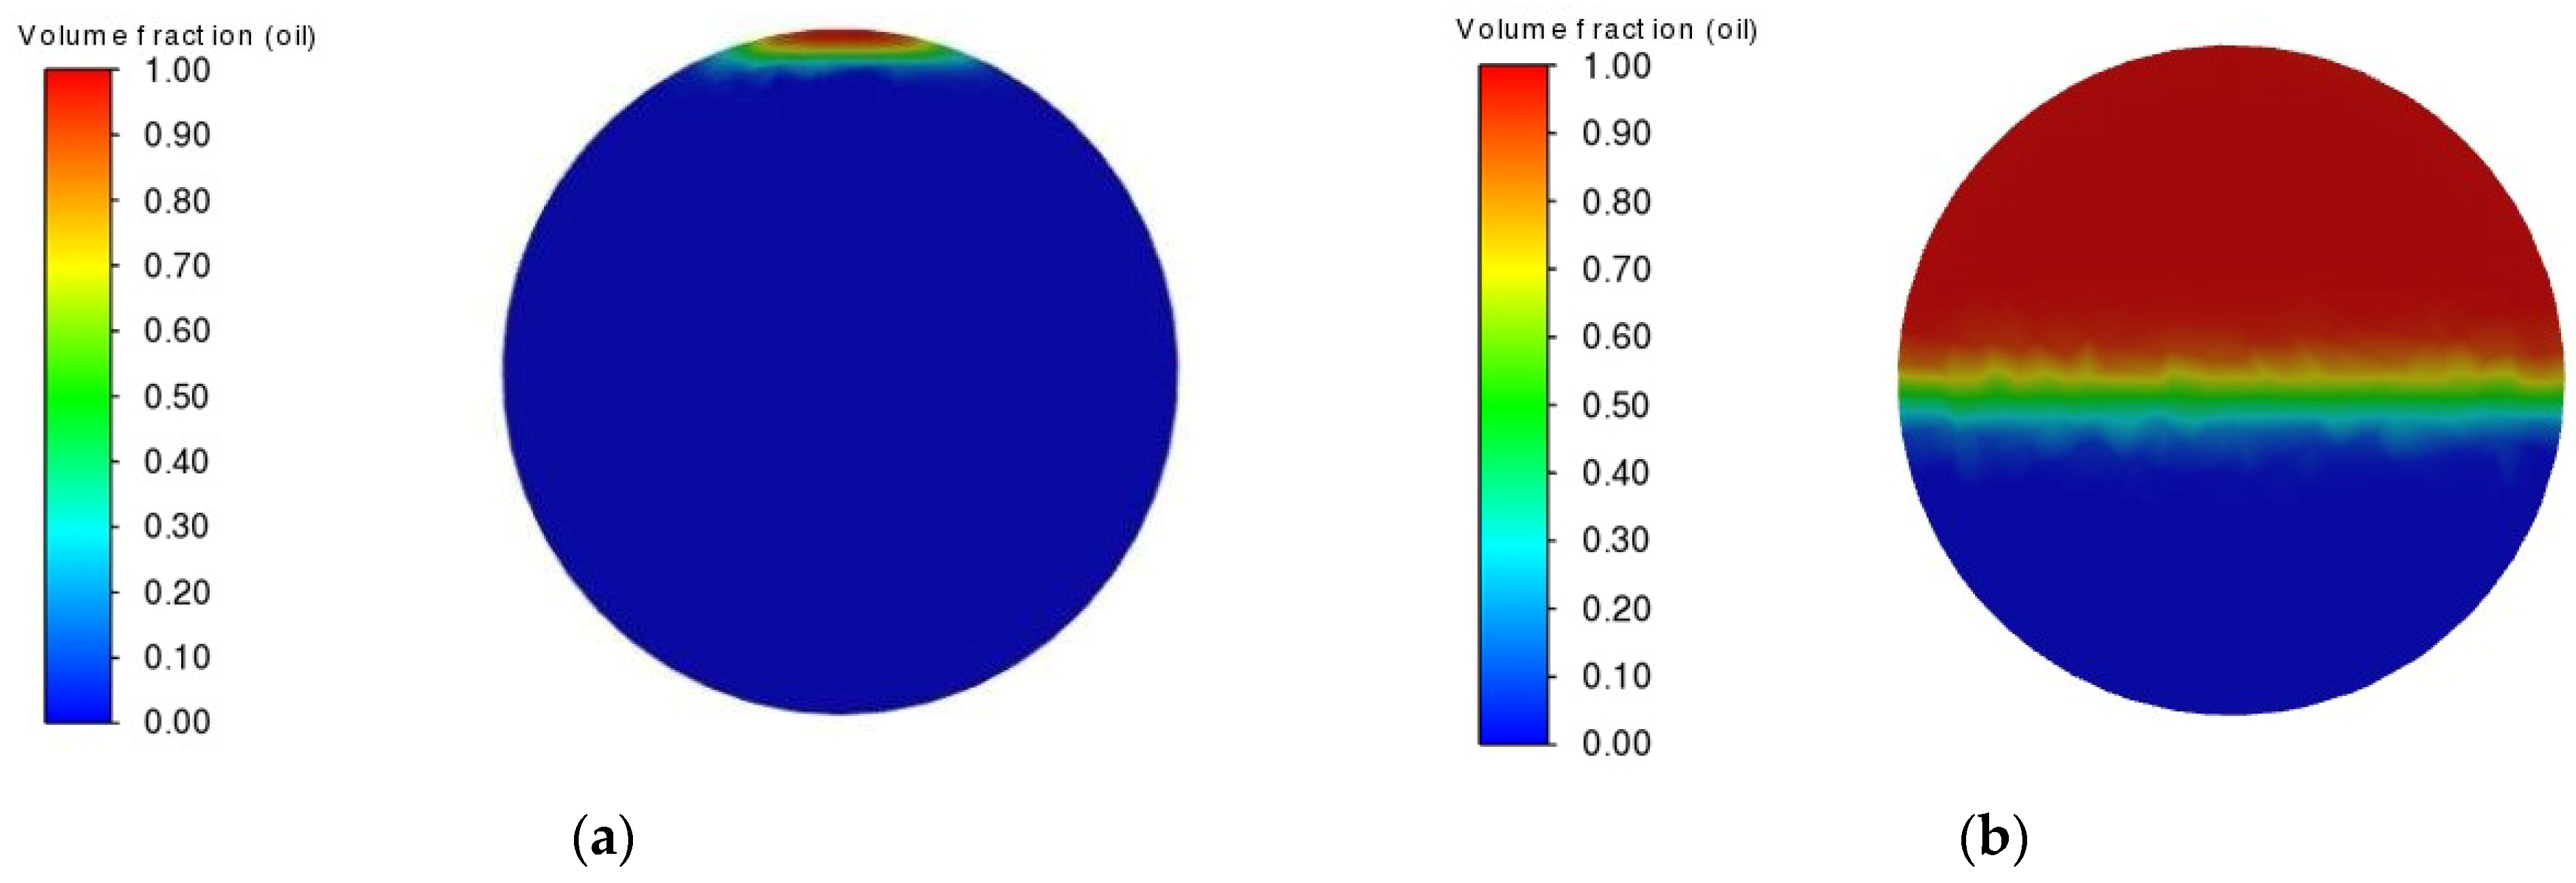
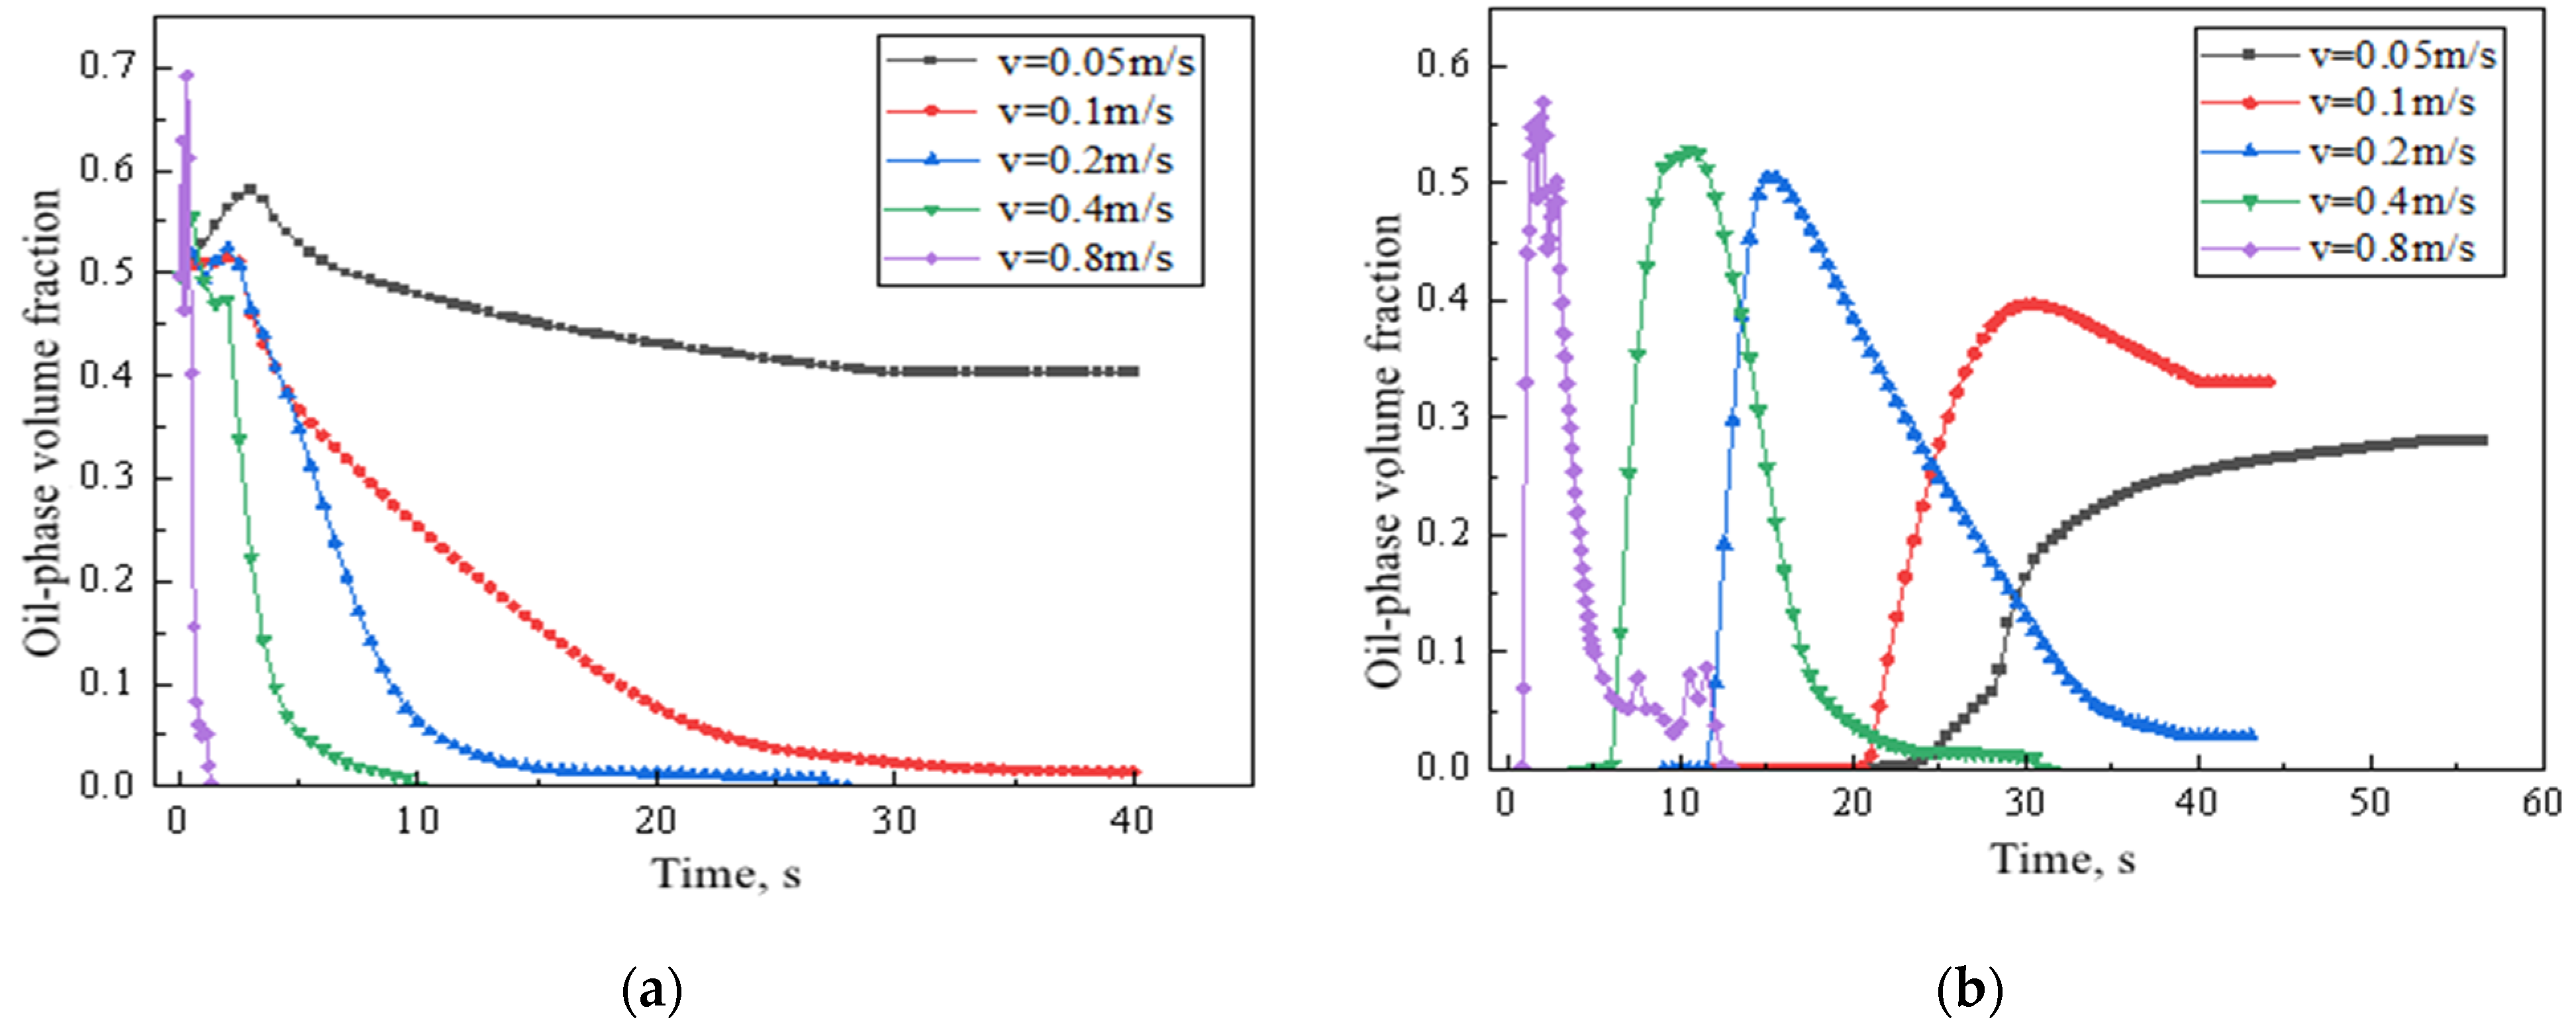
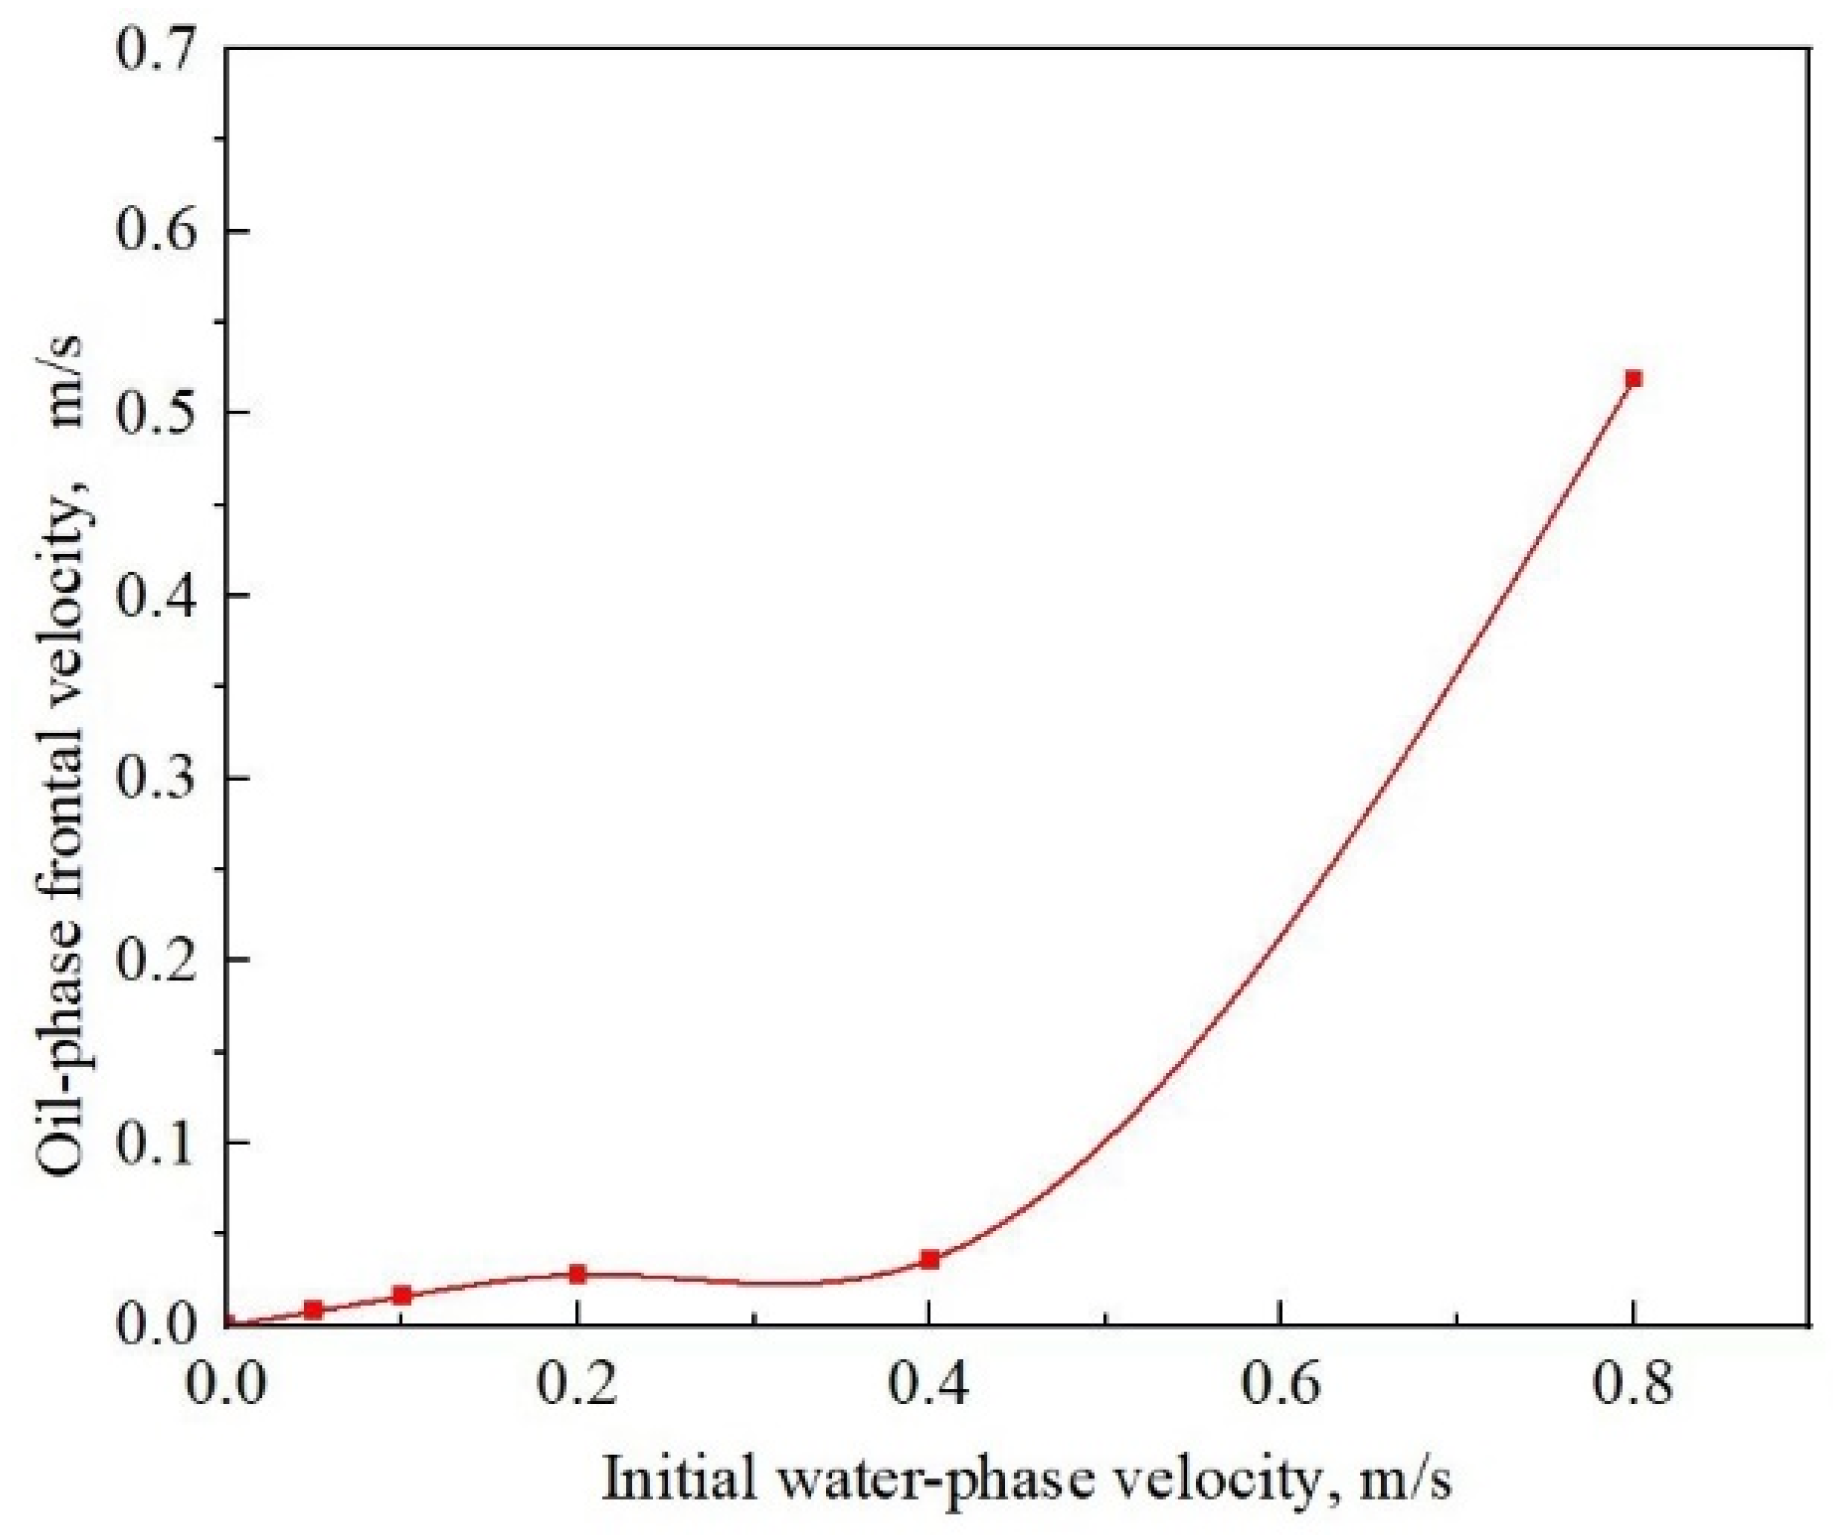
4.1. The Impact of Initial Water Phase Velocity

When investigating the flow characteristics of oil-carrying water, the capacity of water to carry oil is an important aspect. It indicates whether, under certain conditions, the water can carry the oil away from the pipe to achieve the purpose of emptying. By calculating the changes in the oil phase volume fraction at the outlets of both the horizontal and downward-inclined sections at each time step (as shown in Figure 10), the impact of the water phase velocity on the oil-carrying capacity can be determined.
Taking the pipe diameter of 15 mm, the inclination angle of 5 degrees, and the initial oil thickness of 7.5 mm as an example, the relationship between the oil volume fraction at the outlet of the horizontal pipe section and the outlet of the downward-inclined pipe, as it changes over time under different initial water phase velocities, is plotted in Figure 11.
As can be seen from Figure 11a, when the flow rate is 0.05 m/s, the oil in the horizontal pipe section cannot be taken out, and a residual oil layer is formed in the horizontal pipe. When increasing the flow velocity, more oil phase is carried away from the horizontal pipe. When the flow velocity reaches 0.2 m/s, the oil in the horizontal pipe can be carried away completely under the action of water. As the water flow rate continues to increase, the time for the oil to be carried away from the horizontal pipe is shorter, and the efficiency is higher.
From Figure 11b, similar to the horizontal pipe, it can be observed that the oil in the downward-inclined pipe cannot be completely discharged under low water phase velocity, and the oil will be totally carried away from the inclined pipe with the continuous increase in initial water phase velocity. Different from the horizontal pipe section, when the velocity reaches 0.2 m/s, the oil in the inclined pipe section still cannot be completely discharged. As a result, it can be considered that when the water phase velocity remains the same, the oil in the downward-inclined pipe section is harder to be carried away by water than the oil in the horizontal pipe. According to the analysis of Figure 11, it can be concluded that increasing the water phase velocity is conducive to the evacuation of residual oil layers. Although the oil in the downward-inclined pipe is harder to be carried away by water, there is a critical water phase velocity that can carry all the oil away from the pipe under certain working conditions.
In addition, the oil phase front velocity can directly affect the efficiency of the emptying process. The greater the frontal velocity, the less time it takes for the oil phase to reach the receiving tank during the evacuation process, thereby reducing the evacuation time. By solving the distance dx of the oil front in two time steps dt (Figure 12), the oil phase front velocity equation v o = d x d t cos α is obtained.
Taking the pipe diameter of 15 mm, the down-dip angle of 5°, and the initial oil phase height of 7.5 mm as an example, the oil phase front velocity under different initial water phase velocities was calculated according to the above methods, as shown in Figure 13. The phenomenon can be observed from the oil–water interface contours in Figure 9.
From Figure 13, it can be found that with the increase in the water velocity, the oil frontal velocity also increases, proving that the initial water velocity plays a role in promoting the oil frontal velocity. When the water velocity is less than 0.4 m/s, the oil frontal velocity is greatly reduced compared with the water velocity. When the initial water phase velocity is 0.4 m/s, the oil frontal velocity is about one-tenth of the initial water velocity. This also verifies that in the emptying process, because of the slow velocity of residual oil, when most of the oil is discharged, there will still be some oil within the pipeline after a period of time. When the water velocity is greater than 0.4 m/s, the oil frontal velocity increases significantly. This is because the two-phase flow interface is very unstable, resulting in the oil dispersing in the water to form oil clumps so that the oil frontal velocity is closer to the water velocity.

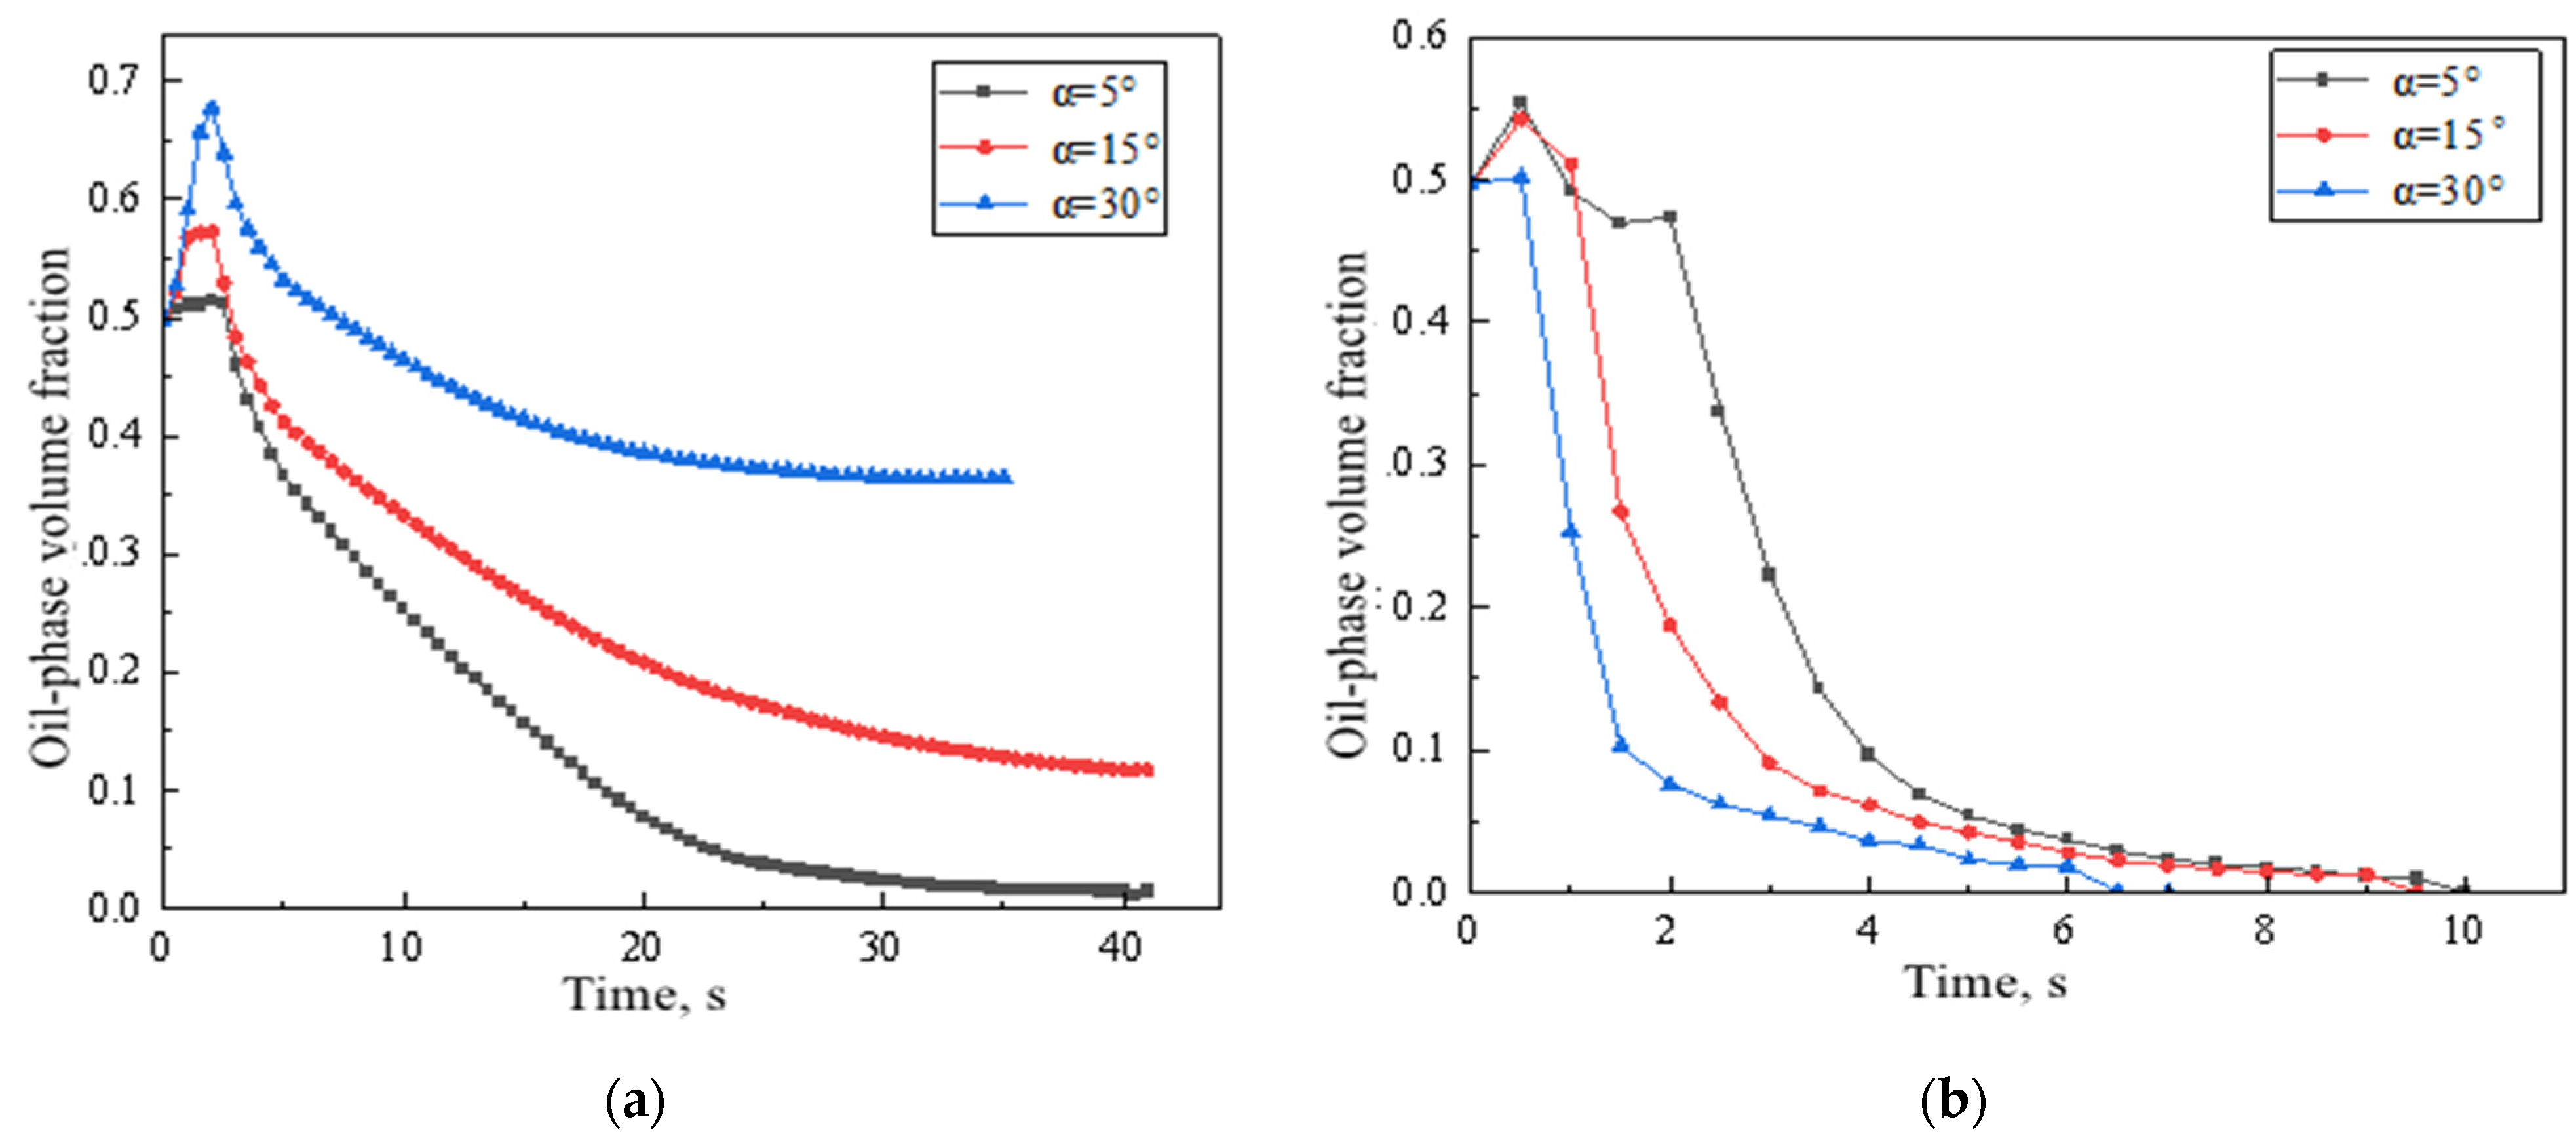
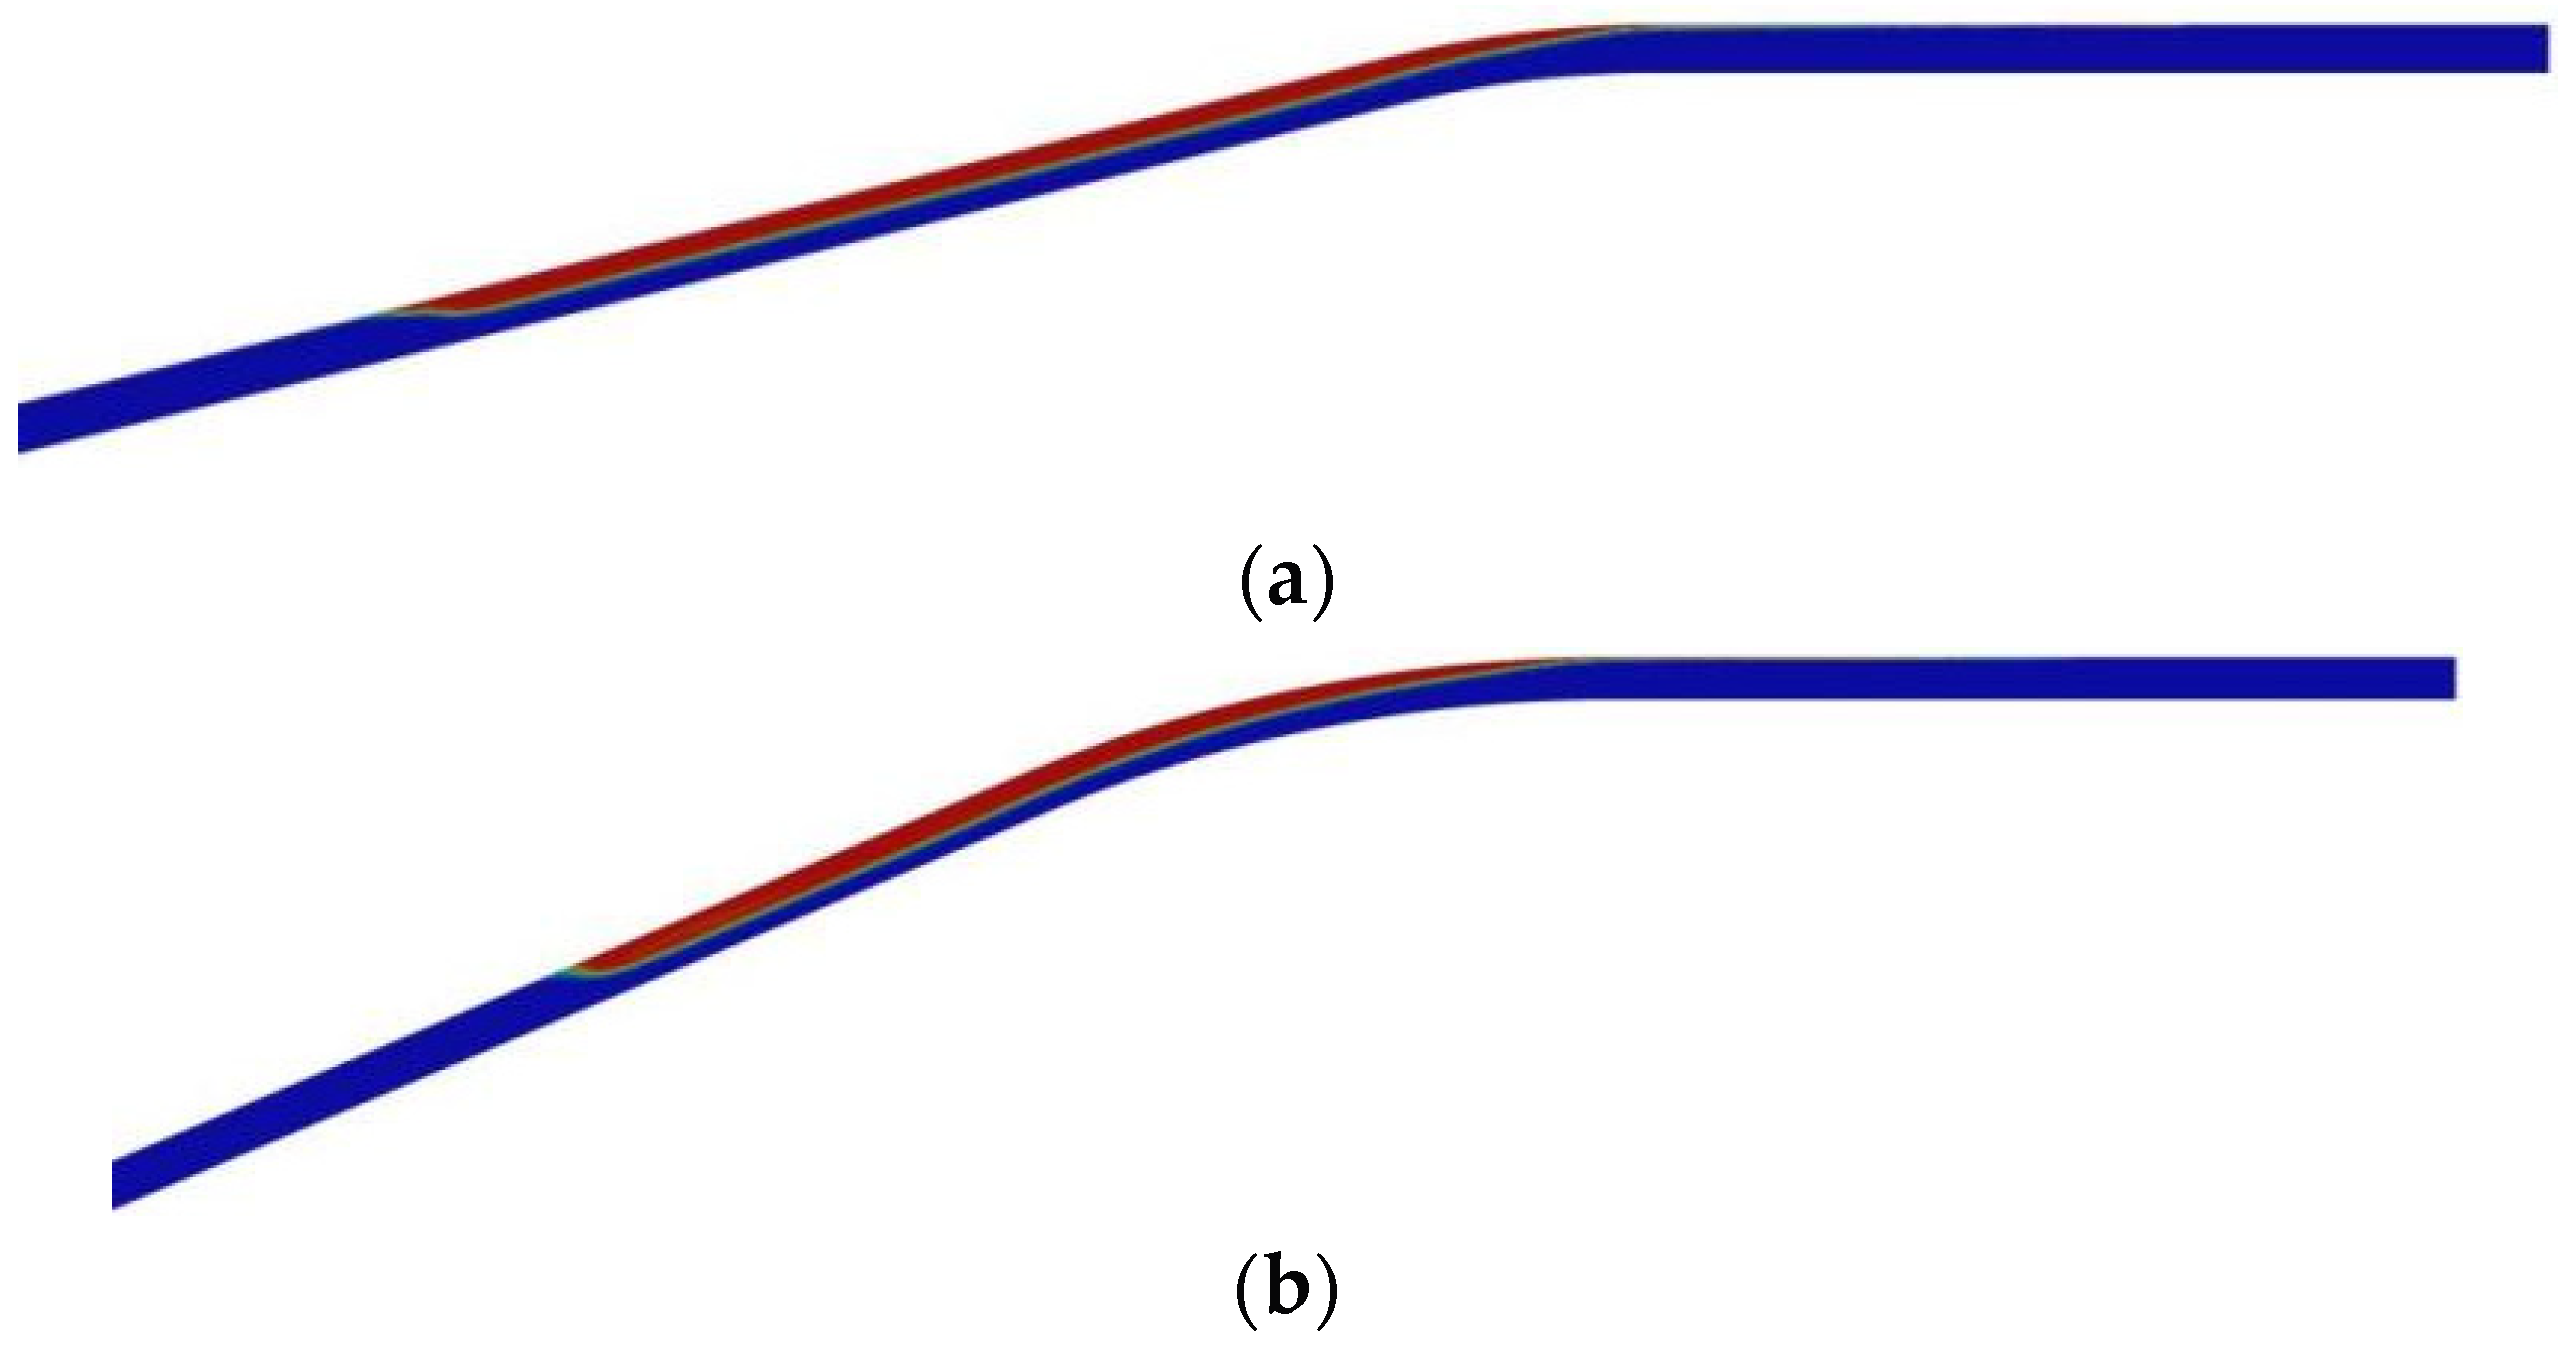
4.2. The Impact of Inclination Angle

Taking the pipe diameter of 15 mm, the oil phase thickness of 7.5 mm, and the water velocity of v = 0.1 m/s and v = 0.4 m/s as an example, Figure 14 is drawn according to the changes of oil phase volume fraction at the exit of horizontal pipe section at each time step. By analyzing Figure 14a, it can be found that when the initial water velocity is v = 0.1 m/s, it is more difficult for the oil phase in the horizontal pipe section to be carried to the downward-inclined pipe section with the increase in the angle. Conversely, it can be observed in Figure 14b that when v = 0.4 m/s, the volume fraction of the oil phase drops faster and steeper as the angle increases, indicating that the oil phase is more easily carried by the water phase to the inclined pipe section at this time. This is due to the fact that when the initial water phase flow velocity is below the critical flow velocity, the backflow of the oil phase plays a primary role. As the angle increases, the backflow intensifies, which consequently causes an increase in the obstruction of the oil phase’s front edge, making it harder to be carried away by water. However, when the initial water phase flow velocity exceeds the critical flow velocity, the shear force will be considered the primary interactive force between the oil and water phases. Additionally, when the angle increases, the flow velocity of water in the inclined pipe also increases. The obstruction to the oil phase’s front edge is reduced, which makes it easier for the oil to be carried into the inclined pipe.
Analyzing the plot above, it can be inferred that in a horizontal pipe, when the water velocity is below the critical water phase velocity, the ability of water to carry the oil layer decreases as the downward-inclined pipe angle increases. Conversely, when the water velocity is above the critical water phase velocity, increasing the angle of the downward-inclined pipe enhances the water’s oil-carrying capacity.
Figure 15 describes the variation in oil phase volume fraction at the downward-inclined pipe outlet with different angles under the condition of the pipe diameter of 15 mm, the oil phase height of 7.5 mm, and the water velocity of 0.4 m/s. It can be observed that as the inclined angle increases, the wave crest of the oil volume fraction change is higher and rises faster, which is caused by the more concentrated oil phase accumulation. When the velocity of water is 0.4 m/s, the time for oil to be discharged out of the pipeline becomes shorter with the increase in angle. The simulation was carried out under the conditions of an initial water velocity of 0.1 m/s and an inclined angle of 15° and 30°, respectively. After 60 s, there was no oil volume fraction at the downward-inclined pipe outlet, and the oil phase accumulated in the elevated section and could not be discharged, as shown in Figure 16.
By analyzing Figure 15 and Figure 16 and combining them with the phenomena observed in the experimentation, we can draw a similar conclusion as the horizontal pipe section. When the initial velocity of water is lower than the critical velocity, the capacity of water to carry oil is weakened as the inclined pipe angle increases. When the initial velocity of water is higher than the critical velocity, the capacity of water to carry oil is improved with the increase in the inclined angle.
Taking an example of the pipe diameter of 15 mm and the initial oil thickness of 7.5 mm, the impact of inclined angles on oil frontal velocity was analyzed. It can be found in Figure 17 that when the initial water phase velocity is lower than the critical water phase velocity of the inclined section, the oil phase frontal velocity gradually decreases with the increase in the inclined angle. When the initial velocity of water is higher than the critical water phase velocity of the inclined pipe, the oil frontal velocity increases gradually as the inclined angle increases.

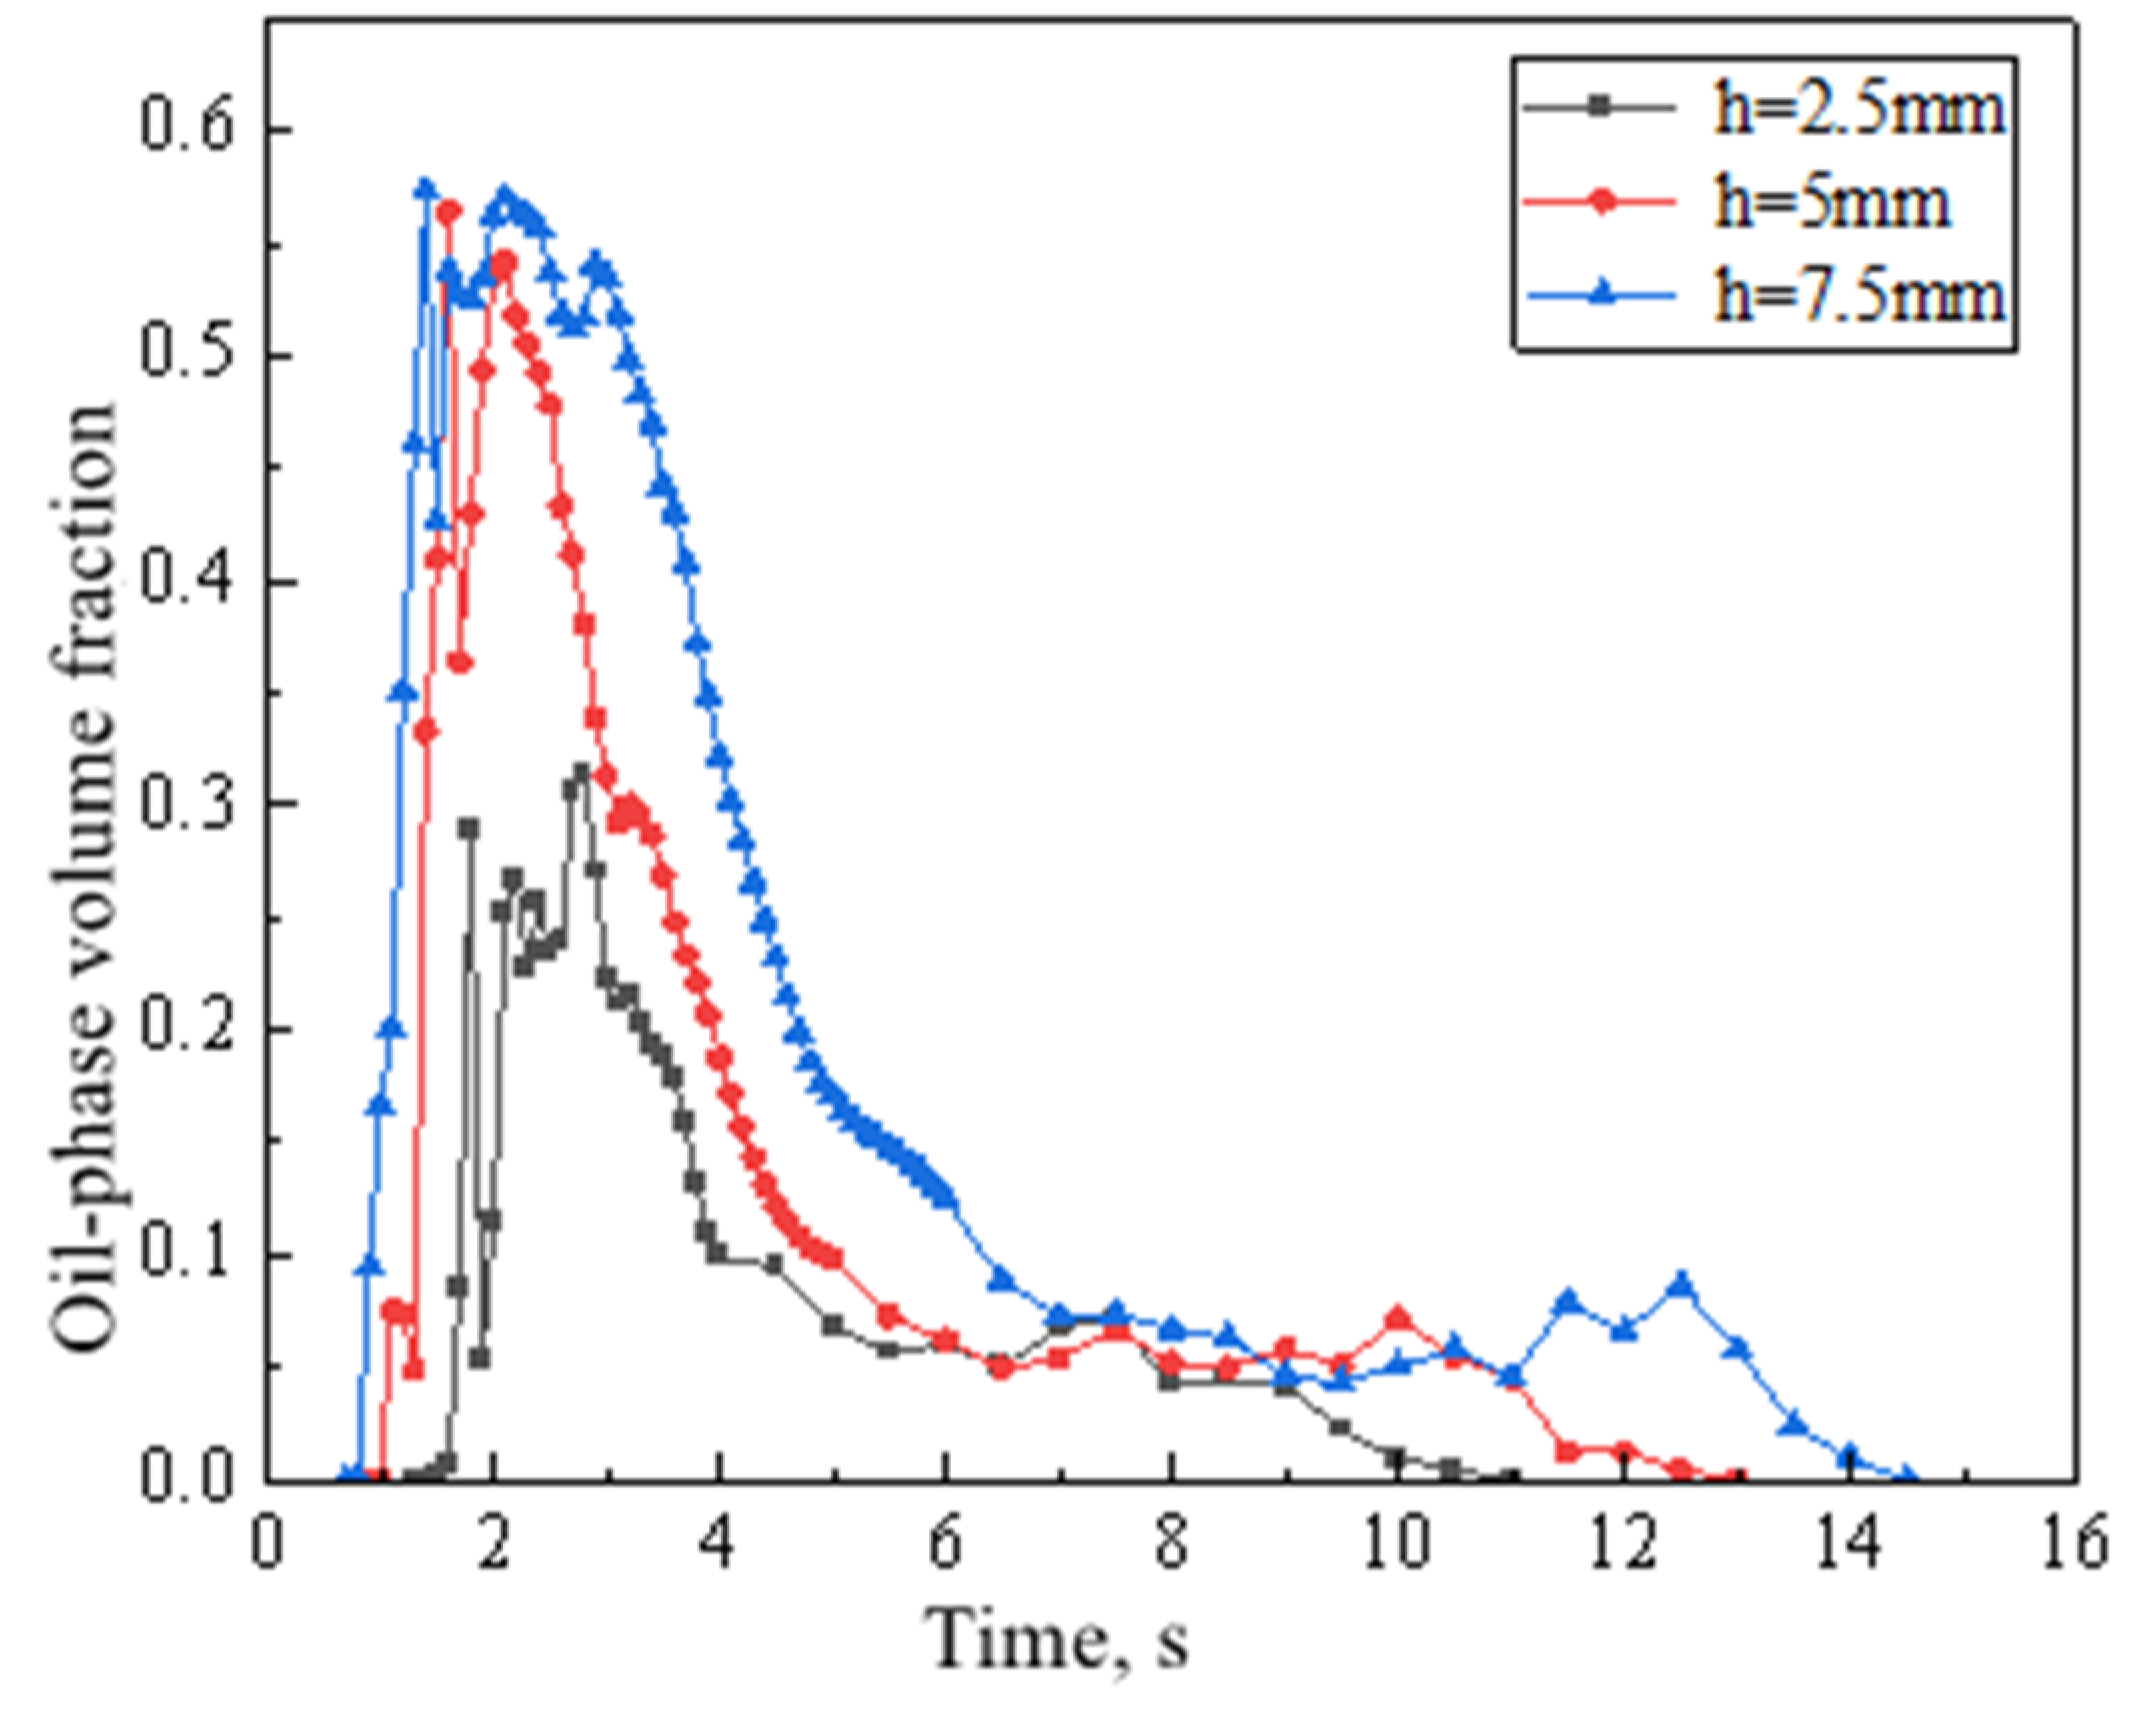
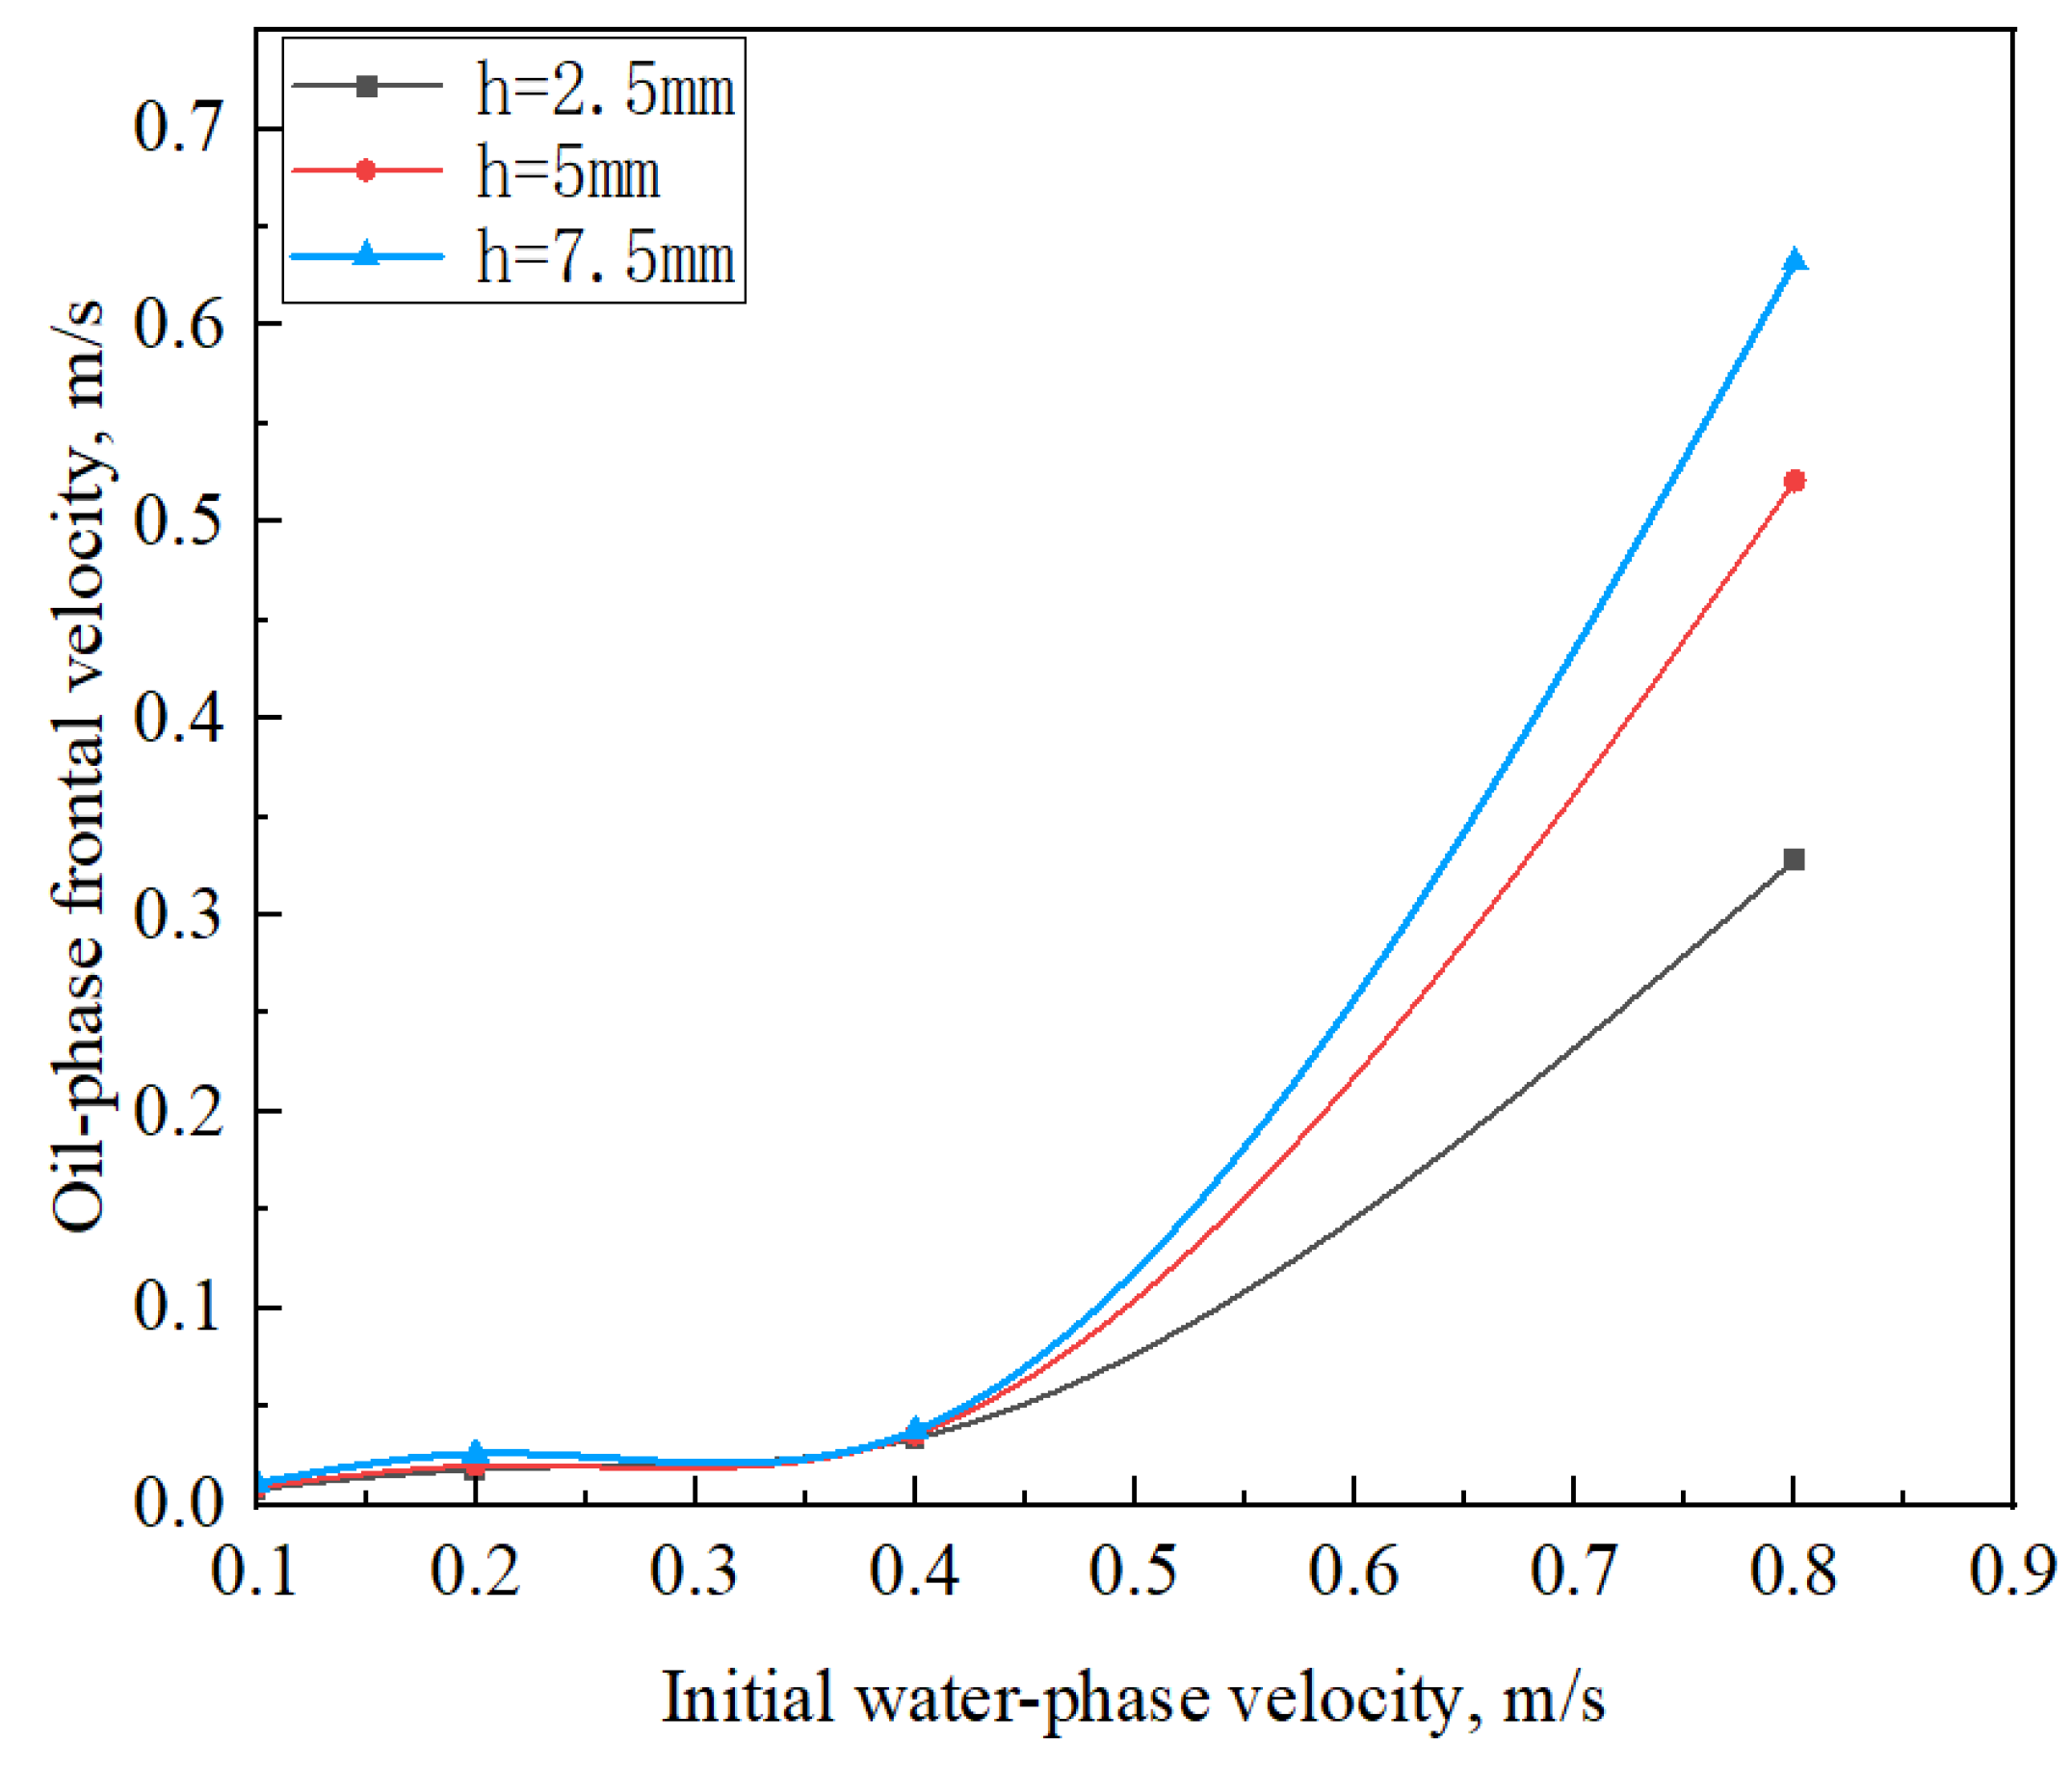
4.3. The Impact of Initial Oil Phase Thickness

Figure 18 illustrates the relationship between the volume fraction of the oil phase and time at the outlet of the horizontal pipe under the conditions of a pipe diameter of 15 mm, an inclination angle of 15 degrees, and an initial velocity of water of 0.8 m/s. It can be seen from the figure that when the initial oil phase thickness increases, it takes more time for the oil phase to be carried out of the horizontal pipe section, but it does not imply the impact of the initial oil phase thickness on the oil-carrying capacity of water. The critical water phase velocity in the horizontal pipe section under different initial oil phase thicknesses at an inclination of 15° is calculated by simulation, as shown in Table 6.
According to the variations of the critical velocity of water under the different initial thicknesses of the oil phase from the table above, we can conclude that the initial oil phase thickness does not directly affect the oil-carrying capacity of the water in the horizontal pipe. However, due to the oil phase volume contained in the pipe increasing exponentially at this time, the overall emptying time of the entire horizontal pipe section will be affected.
Under the same working conditions, an analysis was conducted on the cross-section at the outlet of the downward-inclined pipeline. The relationship between the volume fraction of oil and time for different initial oil phase thicknesses is depicted in Figure 19. According to Figure 19, it can be observed that as the oil phase thickness increases, the time for the oil front to reach the outlet of the downward-inclined pipe becomes shorter. This is because the increased oil phase thickness will cause more intense fluctuations in the two-phase interface, which makes it easier for the water to carry and transport oil forward. Similar to the phenomenon of the horizontal pipe, although the oil reaches the outlet of the downward-inclined pipe more quickly with an increase in the initial thickness of the oil phase, additional time was needed. At this time, the change in the critical velocity of water in the downward-inclined pipe is not significant. Therefore, the initial oil phase thickness has no obvious relationship with the oil-carrying capacity of water in the downward-inclined pipe.
Continuing with the same working condition, the impact of the initial oil phase thickness on the front velocity of the oil was analyzed. As shown in Figure 20, when the velocity of water increases, by comparing the changes in the oil phase front velocity under different thicknesses of the initial oil phase, it can be observed that when the initial water phase velocity is the same, increasing the thickness of the oil phase, the oil frontal velocity also increases. Therefore, under the premise of all other conditions remaining constant, the initial thickness of the oil phase has a promoting effect on the front velocity of the oil.

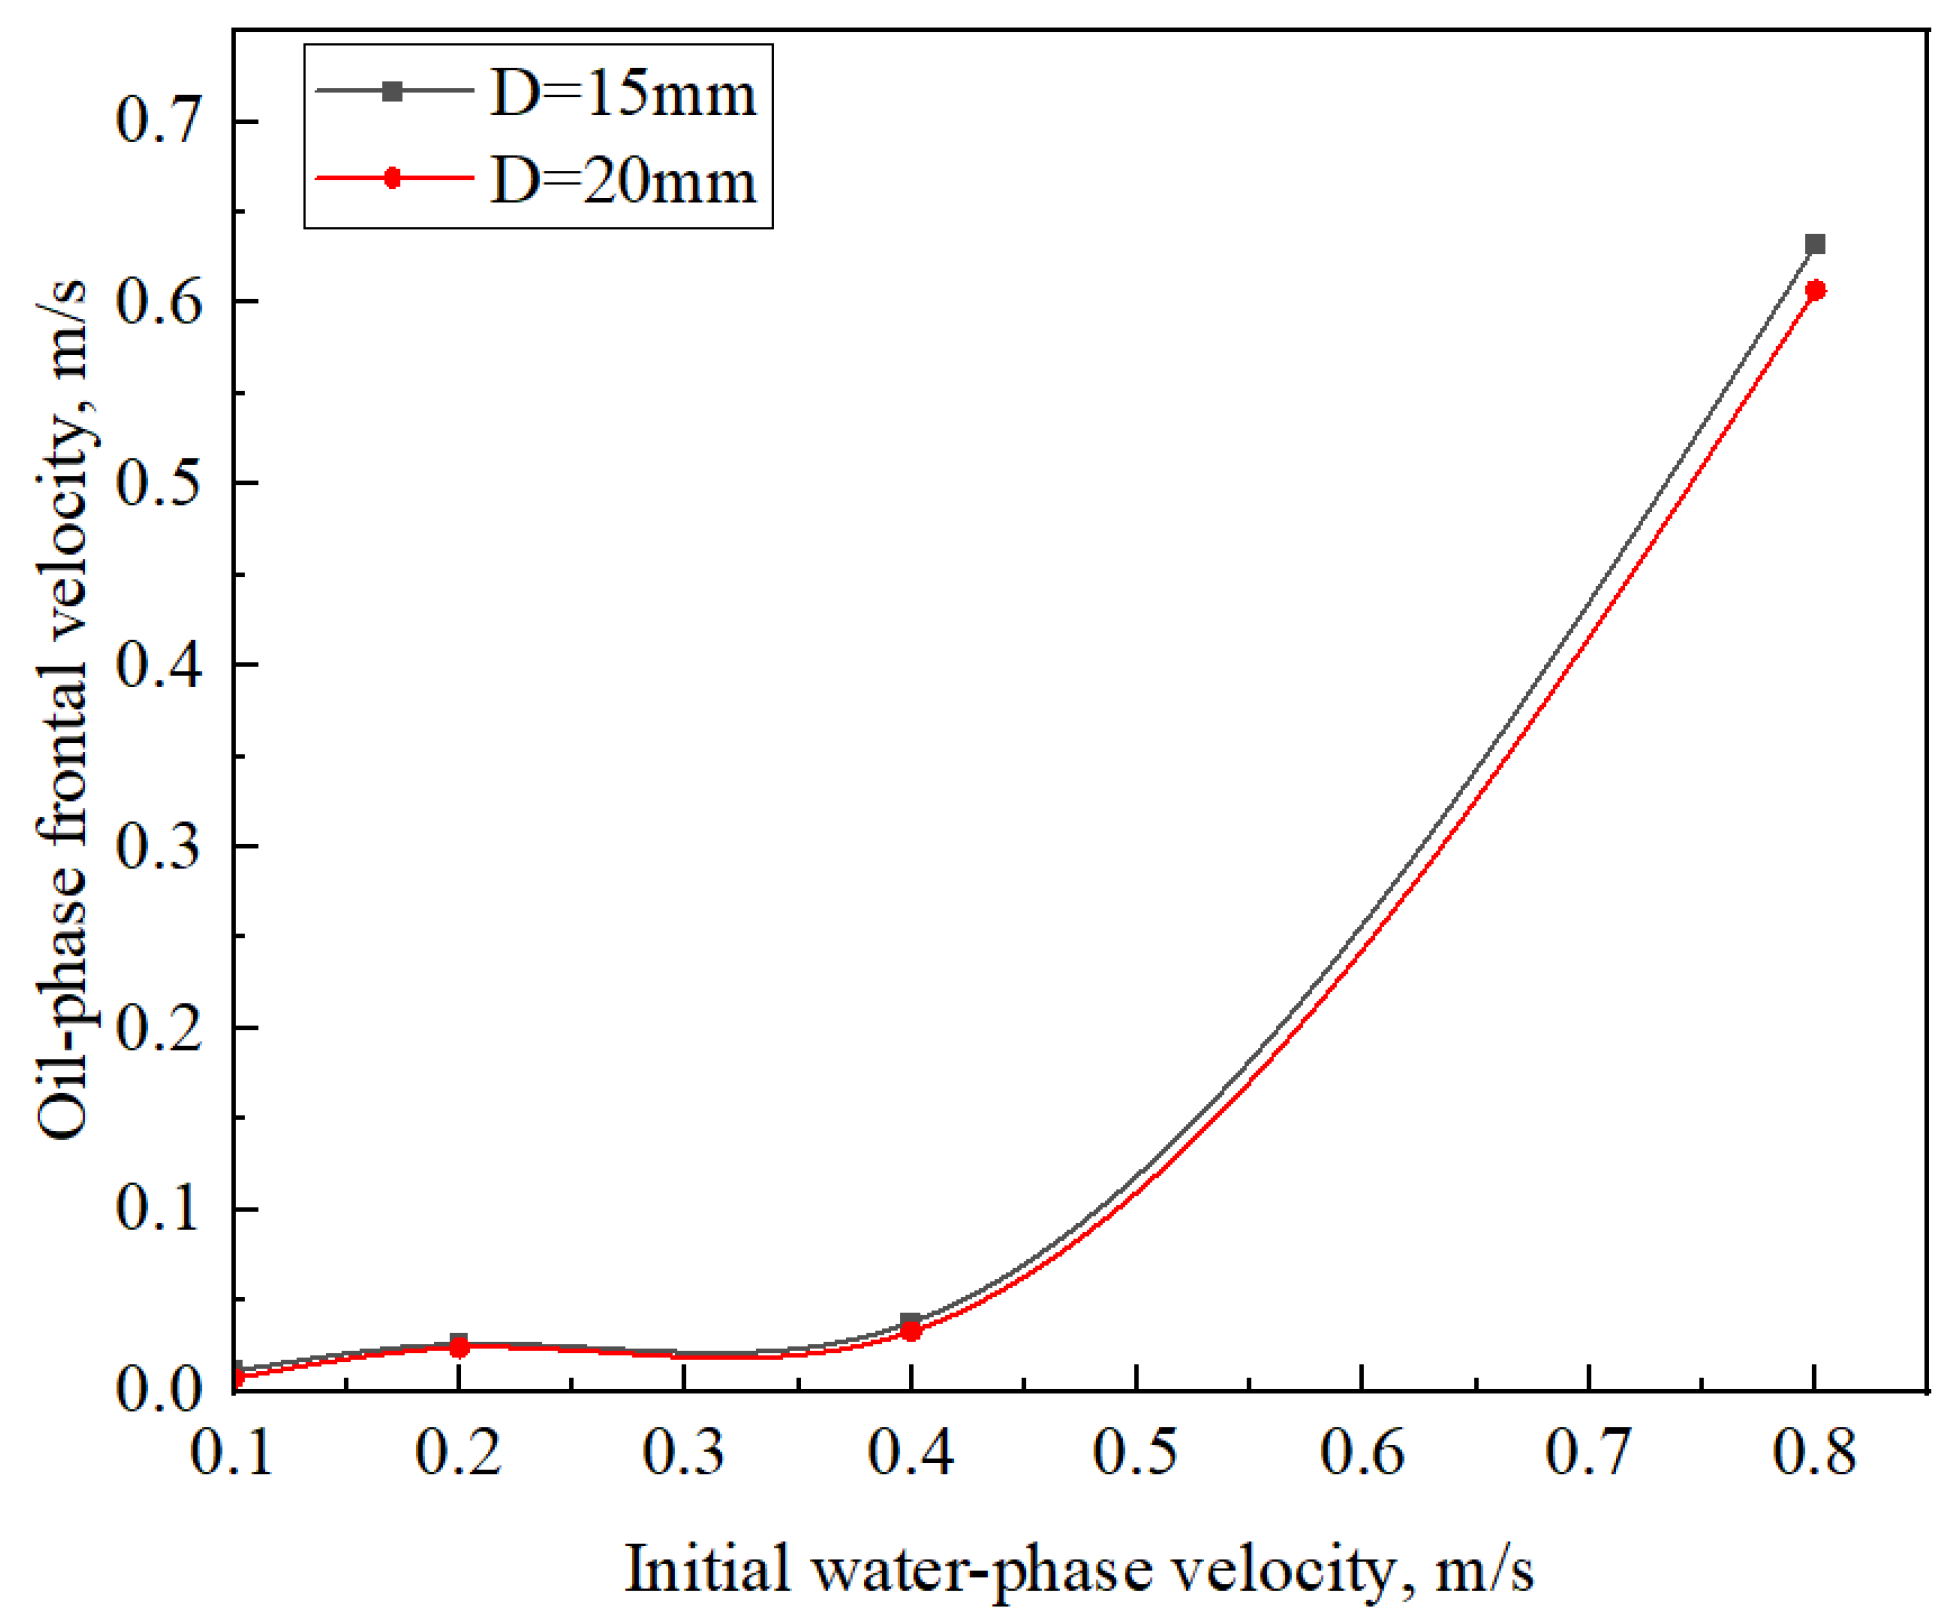
4.4. The Impact of Pipe Diameter

Figure 21a shows the variation in the oil phase volume fraction at the outlet of the horizontal pipeline under the conditions of the water velocity of 0.4 m/s and the inclination angle of 15° for pipe diameters of 15 mm and 20 mm, respectively. It can be observed that the peak of the oil volume fraction variation in the pipe with a diameter of 15 mm is higher than that in the pipe with a diameter of 20 mm. This is due to the more intense fluctuations in the oil–water interface in smaller-diameter pipes, as can be inferred from the analysis above. Additionally, it takes more time for the oil phase in the horizontal pipe section with a diameter of 20 mm to be completely carried away to the downward-inclined pipe section. Considering the changes in the critical velocity of the water under two operating conditions, it can be concluded that increasing the pipe diameter has a weakening effect on the oil-carrying capacity of water in an inclined pipe.
Similarly, by analyzing Figure 21b, it can be deduced that when the pipe diameter increases, it takes more time for the oil to reach the outlet of the inclined pipe and the time required for all the oil to be completely carried out of the inclined pipe is longer. Consequently, it can be concluded that an increase in pipe diameter will decrease the water’s ability to carry oil within the inclined pipe.
Under the condition of a downward-inclined angle of 15°, the variation in frontal velocity of the oil phase in pipelines with diameters of 15 mm and 20 mm with respect to the initial water phase velocity is shown in Figure 22. It can be observed that, whether at low or high water velocities, the oil frontal velocity decreases when the pipe diameter increases. Therefore, it can be deduced that increasing the pipe diameter will reduce the front velocity of the oil phase.

5. Conclusions

This paper investigated the characteristics of oil-carrying by water in a downward-inclined and horizontal mobile pipeline and established the relationships between the two indicators of water’s oil-carrying capacity and the oil frontal velocity with four parameters: initial velocity of water phase, pipe inclination angle, initial oil phase thickness, and pipe diameter. Here are the findings summarized:
(1)
The initial water phase velocity has a facilitating effect on water’s oil-carrying capacity and oil frontal velocity; although it is more difficult for the water flow to carry the oil phase out of the downward-inclined pipe section, there exists a critical water phase velocity under certain conditions that can completely displace the oil phase from the pipe;
(2)
When the initial velocity of the water phase is below the critical velocity, an increase in the angle of the inclined pipe will weaken the water’s oil-carrying capacity and oil frontal velocity. Conversely, when the initial velocity of the water phase exceeds the critical velocity, an increase in the angle of the inclined pipe section will enhance the oil-carrying capacity and the frontal velocity of the oil phase;
(3)
The initial oil phase thickness does not directly affect the oil-carrying capacity of the water in the downward-inclined and horizontal mobile pipeline, but it can increase the oil frontal velocity;
(4)
Increasing the pipe diameter, both the water’s oil-carrying capacity and the frontal velocity of oil will be reduced.
Therefore, in practical engineering, while meeting the flow rate requirements, the pipe diameter can be appropriately reduced, the downward-inclination angle of the pipeline can be moderately increased, and the initial water phase velocity needs to be maintained above the critical water phase velocity by methods such as increasing the pump speed, in order to enhance the efficiency of oil emptying in mobile pipelines.
During the laying process of mobile pipelines, in addition to horizontal and downward-inclined pipes, there are usually special sections such as crossing over high walls and passing through culverts. These sections may lead to intense mixing of oil and water. Therefore, further research can be conducted on the impact of special undulating pipe sections like U-shaped and Z-shaped pipes on the characteristics of oil-carrying by water during oil emptying in mobile pipelines.

Author Contributions

Conceptualization, J.D. and G.F.; methodology, G.L. and Y.C.; software, G.L.; validation, Z.K.; formal analysis, Z.K.; investigation, G.F.; resources, G.L.; data curation, Z.K.; writing—original draft preparation, G.F.; writing—review and editing, G.F. and G.L.; visualization, G.L.; supervision, J.D. and Y.C.; project administration, H.L.; funding acquisition, J.D. and H.L. All authors have read and agreed to the published version of the manuscript.

Funding

This research was funded by the Natural Science Foundation of China (52302422 and 52272338), the Natural Science Foundation of Chongqing, China (CSTB2024NSCQ-MSX1039), and a Major Project of the Science and Technology Research Program of the Chongqing Education Commission of China (KJZD-M202212901).

Data Availability Statement

The original contributions presented in the study are included in the article, further inquiries can be directed to the corresponding author.

Conflicts of Interest

The authors declare no conflict of interest.

References

  1. Li, Z.; Zhang, W.; Jia, D.; Yu, J. Study on the Manifold for Oil–water Mixture Cut during Mobile Pipeline Evacuation. J. Logist. Eng. Univ. 2013, 29, 30–35. [Google Scholar]
  2. Ming, Y.; Jiang, J.; Yong, Q.; Sun, Y. Analysis of the Current Situation of New Pipe Application and Its Implications for Motorized Pipelines Inspiration for the Development of Lightweighting. Ship Electron. Eng. 2023, 43, 134–138. [Google Scholar]
  3. Jiang, J.; Zhang, Z.; Li, J.; Chen, Y.; Chen, M.; Jiang, W. Resistance Characteristics of Oil-gas Two-phase Flow for Mobile Pipeline Evacuation Operation. Acta Armamentarii 2021, 42, 888–896. [Google Scholar]
  4. Duan, J.; Tan, G.; Ma, Z.; Liu, H.; Li, J.; Gu, K.; Lin, K.; Wang, J. Research Progress in Flow Characteristics of Liquid-carrying in the Draining Process in Mobile Pipelines. Contemp. Chem. Ind. 2021, 50, 1591–1596. [Google Scholar]
  5. Tan, G.; Xiao, D.; Li, M.; He, M.; Lin, K.; Liu, H.; Duan, J. Research Progress of Oil–water Two-phase Flow Characteristics of Displacement Flow of Oil by Water in Mobile Pipelines. Contemp. Chem. Ind. 2020, 49, 2290–2300. [Google Scholar]
  6. Guo, R.; Zhang, W.; Jiang, J.; Liu, Z. Numerical Simulation of Mobile Pipeline Gas-Gap Emptying Based on OLGA. J. Chem. Eng. Chin. Univ. 2017, 31, 337–345. [Google Scholar]
  7. Ashoorian, S.; Javadi, A.; Hosseinpour, N.; Husein, M. Evolution of adsorbed layers of asphaltenes at oil–water interfaces: A novel experimental protocol. J. Colloid Interface Sci. 2021, 594, 80–91. [Google Scholar] [CrossRef] [PubMed]
  8. Dewangan, S.K.; Senapatı, S.K.; Deshmukh, V. CFD prediction of oil–water two-phase stratified flow in a horizontal channel: Coupled level set-VOF approach. Sigma J. Eng. Nat. Sci. 2020, 38, 1–19. [Google Scholar]
  9. Li, Z.; Fan, C. A novel method to identify the flow pattern of oil–water two-phase flow. J. Pet. Explor. Prod. Technol. 2020, 10, 3723–3732. [Google Scholar] [CrossRef]
  10. Xu, G. Investigation on the Mechanism of Deposuted Water Displaced by Flowing Oil in Inclined Products Oil Pipeline. Ph.D. Thesis, China University of Petroleum, Qingdao, China, 2011. [Google Scholar]
  11. Xu, G.; Liu, T.; Niu, Z.; Cai, L.; Wang, M. Analysis of the velocity and shear stress of the local water-diesel flow system. In Proceedings of the ASME Asia Pacific Pipeline Conference, Qingdao, China, 15–19 May 2019; p. V001T11A002. [Google Scholar]
  12. Xu, G.; Cai, L.; Ullmann, A.; Brauner, N. Experiments and simulation of water displacement from lower sections of oil pipelines. J. Pet. Sci. Eng. 2016, 147, 829–842. [Google Scholar] [CrossRef]
  13. Zhang, P.; Zhang, J.; Li, W.; Jiang, H.; Gong, J. Research on Oil–Water Displacement in Upward Inclined Pipes. Nat. Gas Oil 2019, 37, 8–14. [Google Scholar]
  14. Xiong, K. Study on Two-Phase Flow Characteristics of Diesel Oil Carrying Water; Southwest Petroleum University: Chengdu, China, 2017. [Google Scholar]
  15. Song, X.; Xiong, K.; Zhu, J.; Yu, D. Influence of water carrying capacity of oil products on internal corrosion of pipelines. Oil Gas Storage Transp. 2015, 34, 834–838. [Google Scholar]
  16. Yang, W. Study on Flow Law and Position Prediction of Lowlying Water in Topographic Relief Oil Pipeline; China University of Petroleum: Qingdao, China, 2019. [Google Scholar]
  17. Xu, G.; Zhang, G.; Zhao, S. An experiment on dewatering for lower location of pipeline. Oil Gas Storage Transp. 2011, 30, 369–372. [Google Scholar]
  18. Li, G.; Fang, G.; Kou, Z.; Chen, S.; Duan, J.; Chen, Y. Oil–Water Hydrodynamics Model during Oil Displacement by Water in Down-Hill Mobile Pipeline. Processes 2024, 12, 880. [Google Scholar] [CrossRef]
  19. Brauner, N.; Maron, D.M.; Rovinsky, J. A two-fluid model for stratified flows with curved interfaces. Int. J. Multiph. Flow 1998, 24, 975–1004. [Google Scholar] [CrossRef]
  20. Ullmann, A.; Zamir, M.; Ludmer, Z.; Brauner, N. Stratified laminar countercurrent flow of two liquid phases in inclined tubes. Int. J. Multiph. Flow 2003, 29, 1583–1604. [Google Scholar] [CrossRef]
  21. Wu, Z.; Chen, H.; Cai, X.; Gou, Q.; Jiang, L.; Chen, K.; Chen, Z.; Jiang, S. Current Status and Future Trends of In Situ Catalytic Upgrading of Extra Heavy Oil. Energies 2023, 16, 4610. [Google Scholar] [CrossRef]
  22. Pang, Z.; Wang, L.; Wu, Z.; Wang, X. An investigation into propagation behavior of the steam chamber during expanding-solvent SAGP (ES-SAGP). SPE J. 2019, 24, 413–430. [Google Scholar] [CrossRef]
Figure 1. Oil–water two-phase flow in a downward-inclined mobile pipeline.
Energies 17 04779 g001
Figure 2. Simplified residual oil layer on a flat surface.
Energies 17 04779 g002
Figure 3. Numerical model of the horizontal downward-inclined pipe section.
Energies 17 04779 g003
Figure 4. Pipeline grid cross-section.
Energies 17 04779 g004
Figure 5. Contours of oil and water distribution obtained at x = 0.5 m by different grid division schemes: (a) Grid 1; (b) Grid 2; (c) Grid 3; (d) Grid 4.
Energies 17 04779 g005aEnergies 17 04779 g005b
Figure 6. Initialization with a certain thickness of oil layer.
Energies 17 04779 g006
Figure 7. Experimental platform.
Energies 17 04779 g007
Figure 8. Experimental process.
Energies 17 04779 g008
Figure 9. Comparison of simulated and experimental flow patterns: (a) smooth laminar flow (D = 15 mm, v = 0.1 m/s, α = 5°, t = 2.7 s); (b) wavy laminar flow (D = 15 mm, v = 0.2 m/s, α = 5°, t = 2.1 s); (c) wavy laminar flow with oil droplet precipitation (D = 15 mm, v = 0.4 m/s, α = 30°, t = 1.8 s); (d) intermittent flow (D = 20 mm, v = 0.8 m/s, α = 15°, t = 1.2 s); (e) double continuous flow (D = 15 mm, v = 0.8 m/s, α = 45°, t = 0.5 s).
Energies 17 04779 g009aEnergies 17 04779 g009b
Figure 10. Contour of oil phase volume fraction in cross-section at v = 0.4 m/s, t = 10 s. (a) Outlet of horizontal pipe section; (b) outlet of downward-inclined pipe section.
Energies 17 04779 g010
Figure 11. Plot of oil phase volume fraction at the outlet of pipe section with different initial water phase velocities as a function of time. (a) Outlet of horizontal pipe section; (b) outlet of downward-inclined pipe section.
Energies 17 04779 g011
Figure 12. Contour of oil phase front displacement between two time steps.
Energies 17 04779 g012
Figure 13. Plot of oil phase frontal velocity versus initial water phase velocity.
Energies 17 04779 g013
Figure 14. Oil phase volume fraction at the horizontal pipe outlet versus time for different inclined angles. (a) v = 0.1 m/s; (b) v = 0.4 m/s.
Energies 17 04779 g014
Figure 15. Oil phase volume fraction at the downward-inclined pipe outlet with time for different inclined angles.
Energies 17 04779 g015
Figure 16. Contour of oil–water distribution at v = 0.1 m/s. (a) α = 15°, t = 60 s; (b) α = 30°, t = 60 s.
Energies 17 04779 g016
Figure 17. Variation in oil frontal velocity with initial water phase velocity at different inclined angles.
Energies 17 04779 g017
Figure 18. Oil phase volume fraction at the horizontal pipe outlet with time for different initial oil phase thicknesses.
Energies 17 04779 g018
Figure 19. Oil phase volume fraction at the downward-inclined pipe outlet as a function of time for different initial oil phase thicknesses.
Energies 17 04779 g019
Figure 20. Variation in oil phase frontal velocity with initial velocity of water for different initial oil phase heights.
Energies 17 04779 g020
Figure 21. Oil phase volume fraction at the outlet of pipe section with time for different pipe diameters. (a) Outlet of horizontal pipe section; (b) outlet of downward-inclined pipe section.
Energies 17 04779 g021
Figure 22. Variation in oil phase frontal velocity with initial water phase velocity for different pipe diameters.
Energies 17 04779 g022
Table 1. Comparison of uw for different pipe diameters at Froude’s number.
uw (m/s)
(D = 15 mm)
uw (m/s)
(D = 20 mm)
uw (m/s)
(D = 100 mm)
uw (m/s)
(D = 150 mm)
0.050.060.130.16
0.100.120.260.32
0.200.230.520.63
0.400.461.031.27
0.800.922.072.53
Table 2. Grid information under four different grid division schemes.
Grid IDGrid Size (mm)Grid NumberAverage Grid Quality
10.21,478,9910.849
20.5678,3420.802
31.0225,9800.779
41.5128,9720.718
Table 3. Simulation of physical property settings.
ParametersWater0# Diesel
density (kg/m3)998.2833.5
viscosity (mPa·s)1.0033.500
Table 4. Boundary condition parameters.
Boundary TypeBoundary ConditionParameter Settings
Velocity InletInlet Velocity0.2 m/s
Turbulence Intensity5%
Turbulence Viscosity Ratio10
Flow Direction Specification MethodNormal to Boundary
Coordinate SystemAbsolute Coordinates
Pressure OutletTotal Pressure0
Turbulence Intensity5%
Turbulence Viscosity Ratio10
Flow Direction Specification MethodNormal to Boundary
Coordinate SystemAbsolute Coordinates
WallWall TypeNo-slip Wall
Shear ConditionNo-slip
Wall Roughness Height (m)0.0002
Wall Roughness Constant0.5
Table 5. Critical water phase velocity under different working conditions.
D (mm)Dip Angle (°) u w 1 (m/s) u w 2 (m/s)
1550.1660.202
150.1480.280
300.1220.326
450.1020.356
2050.1920.234
150.1720.322
300.1420.378
450.1180.412
Table 6. Variation in critical initial water velocity for different initial oil phase thicknesses.
h (mm)uw1 (m/s)uw2 (m/s)
2.5 mm0.1530.269
5 mm0.1560.274
7.5 mm0.1570.274
Disclaimer/Publisher’s Note: The statements, opinions and data contained in all publications are solely those of the individual author(s) and contributor(s) and not of MDPI and/or the editor(s). MDPI and/or the editor(s) disclaim responsibility for any injury to people or property resulting from any ideas, methods, instructions or products referred to in the content.

