
Assessing the Potential of Phase-Change Materials in Energy Retrofitting of Existing Buildings in a Mediterranean Climate


Abstract
:1. Introduction
The Use of PCMs in the Built Environment
2. Methods
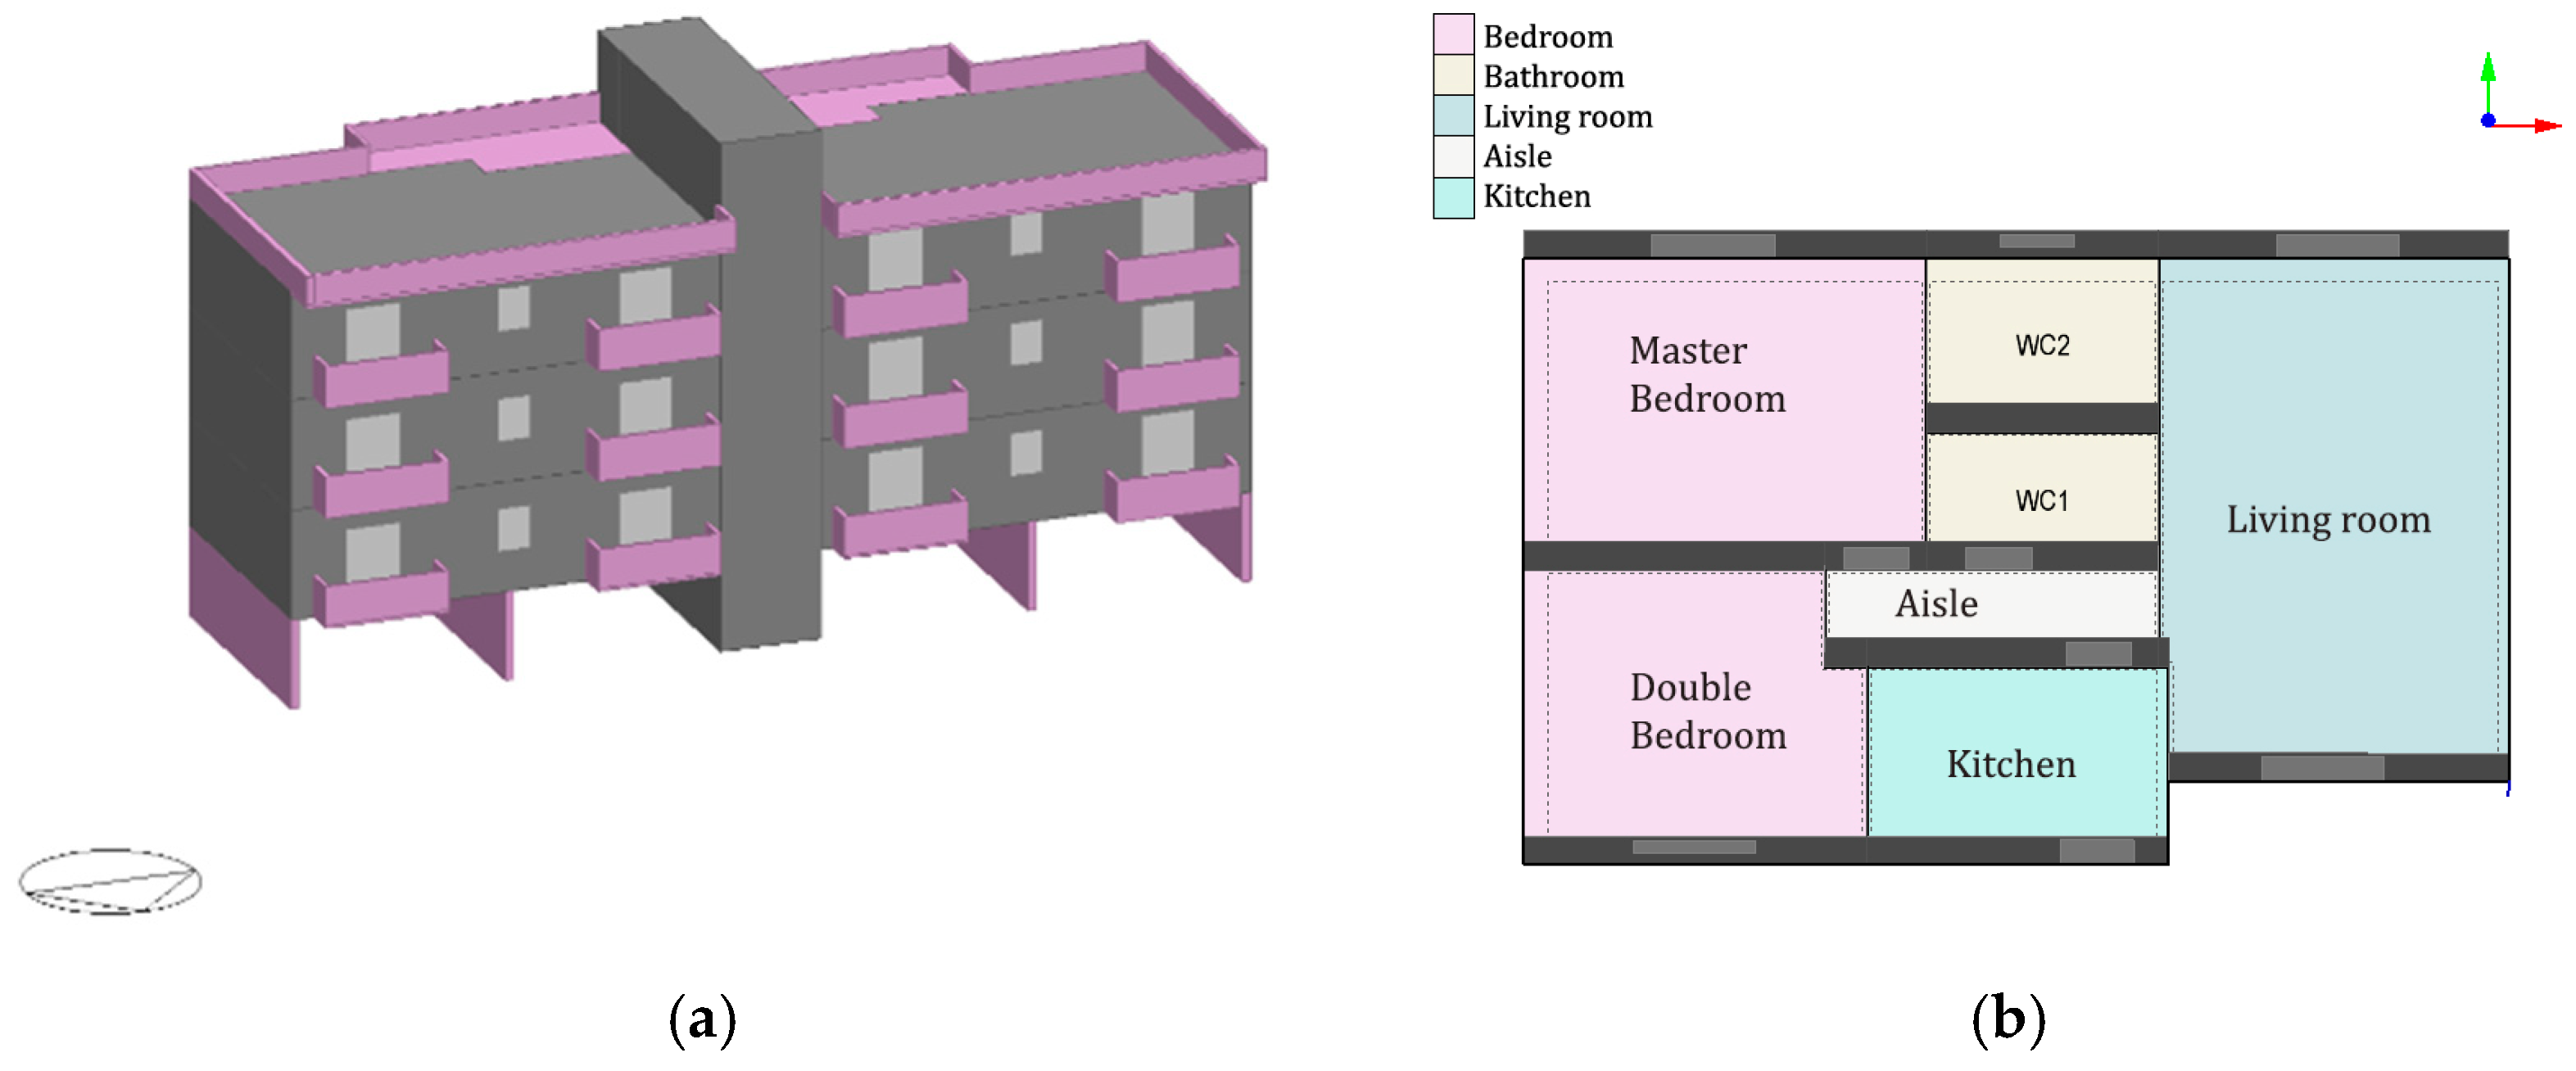
2.1. Case Study
- External walls: made of weakly insulated perforated brick blocks (U-value = 0.8 W/m2K);
- Walls to unheated zone: made of uninsulated blocks (U-value = 0.75 W/m2K);
- Indoor partitions: made of perforated brick blocks (U-value = 2.10 W/m2K);
- Floor and ceiling: made of 30 cm hollow clay floor (U-value = 1.51 W/m2K);
- Window frames: double glazing (3:6:3) with metal frame without thermal break and air gap (U-value = 3.7 W/m2K and ggl,n = 0.75).
2.2. BES Parameters
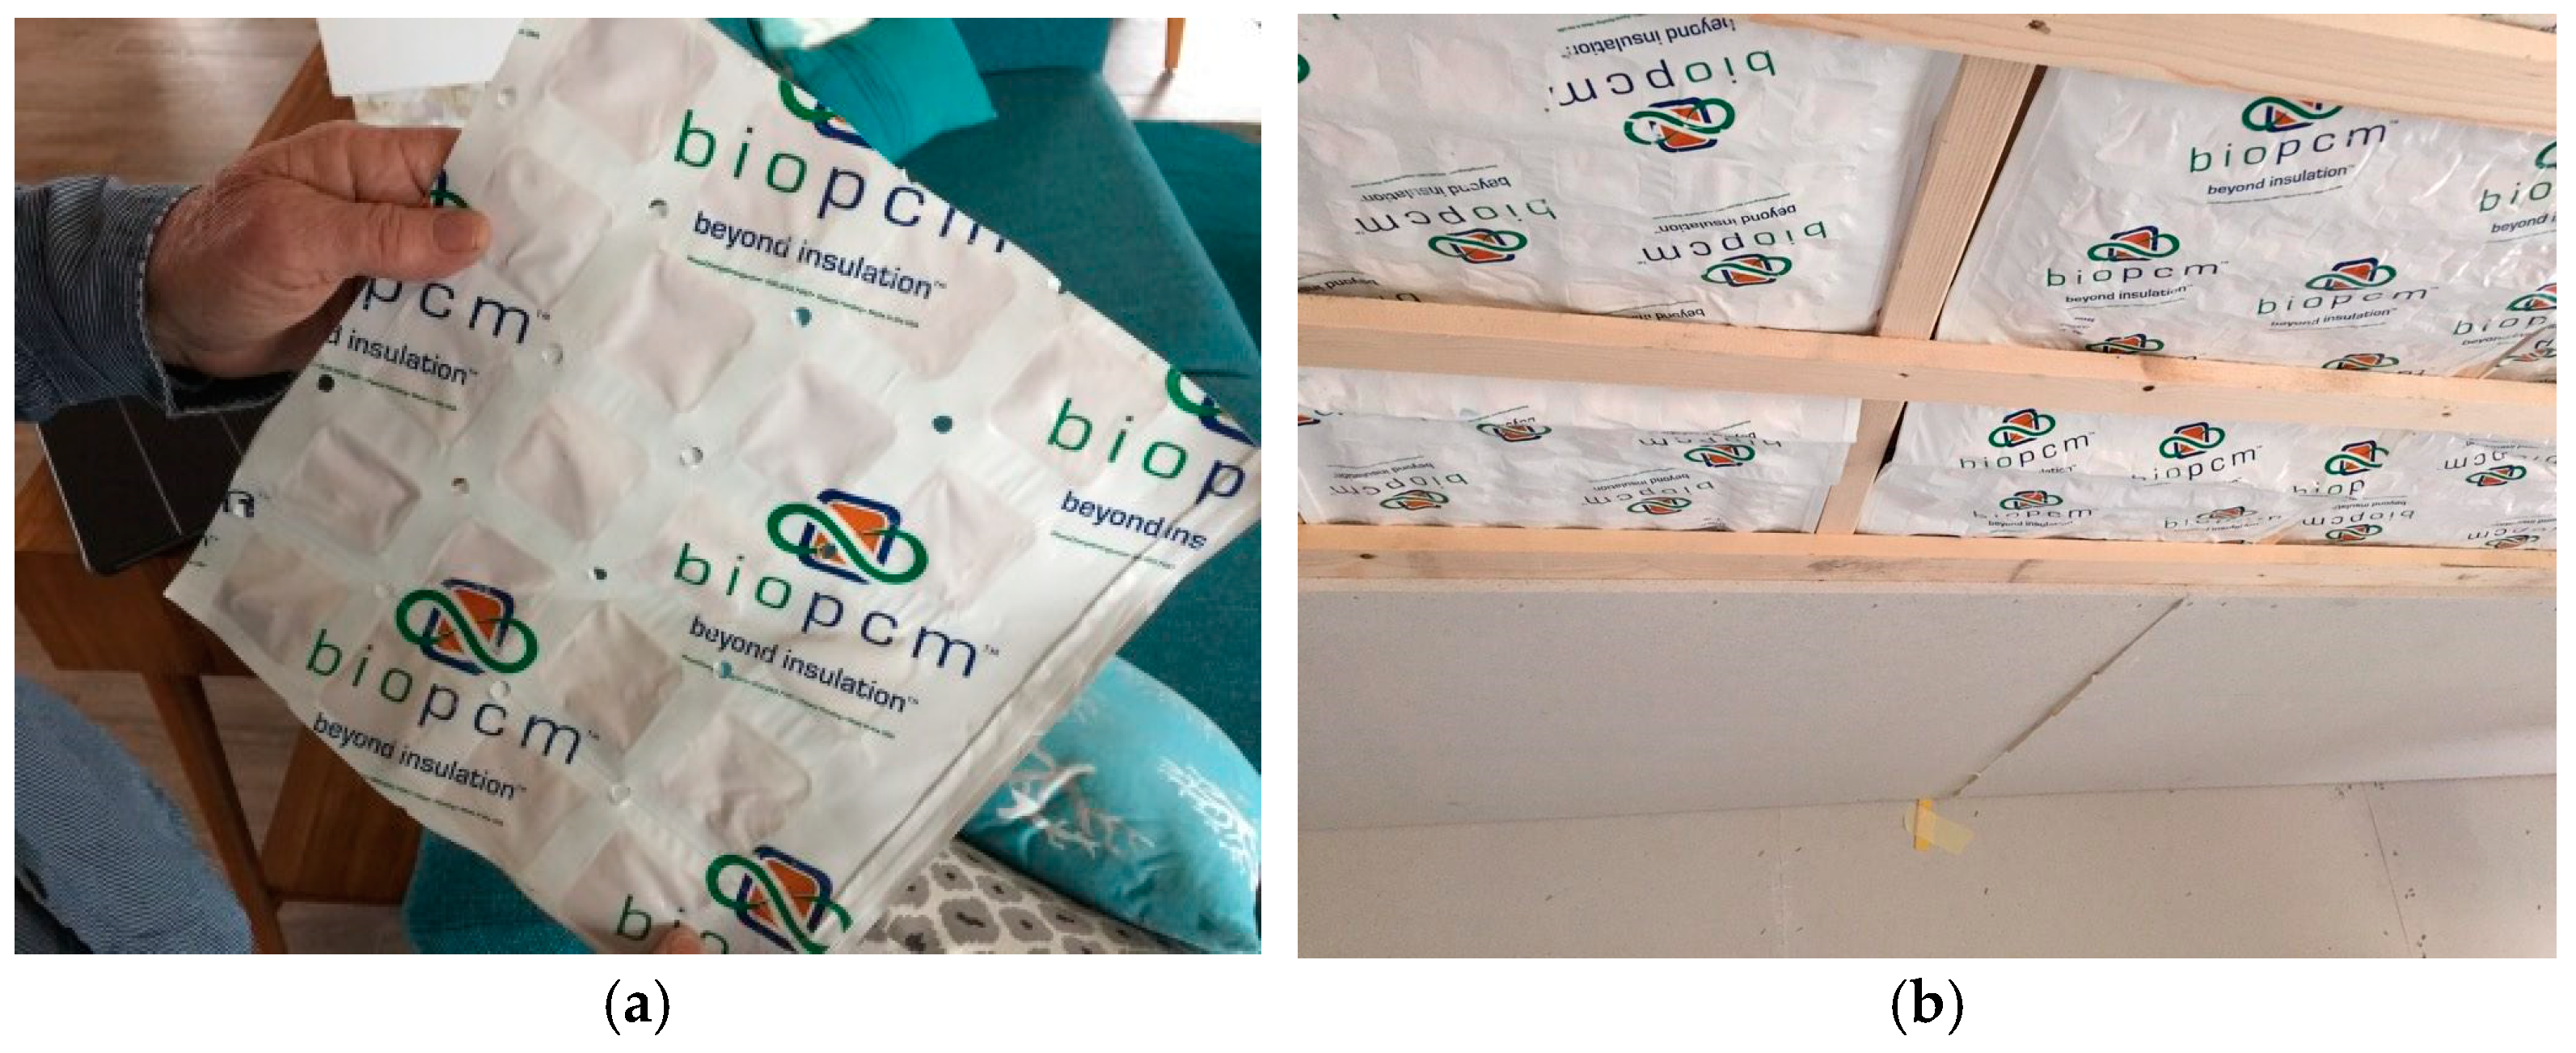
2.3. PCM Characteristics
3. Results
3.1. Energy Consumption
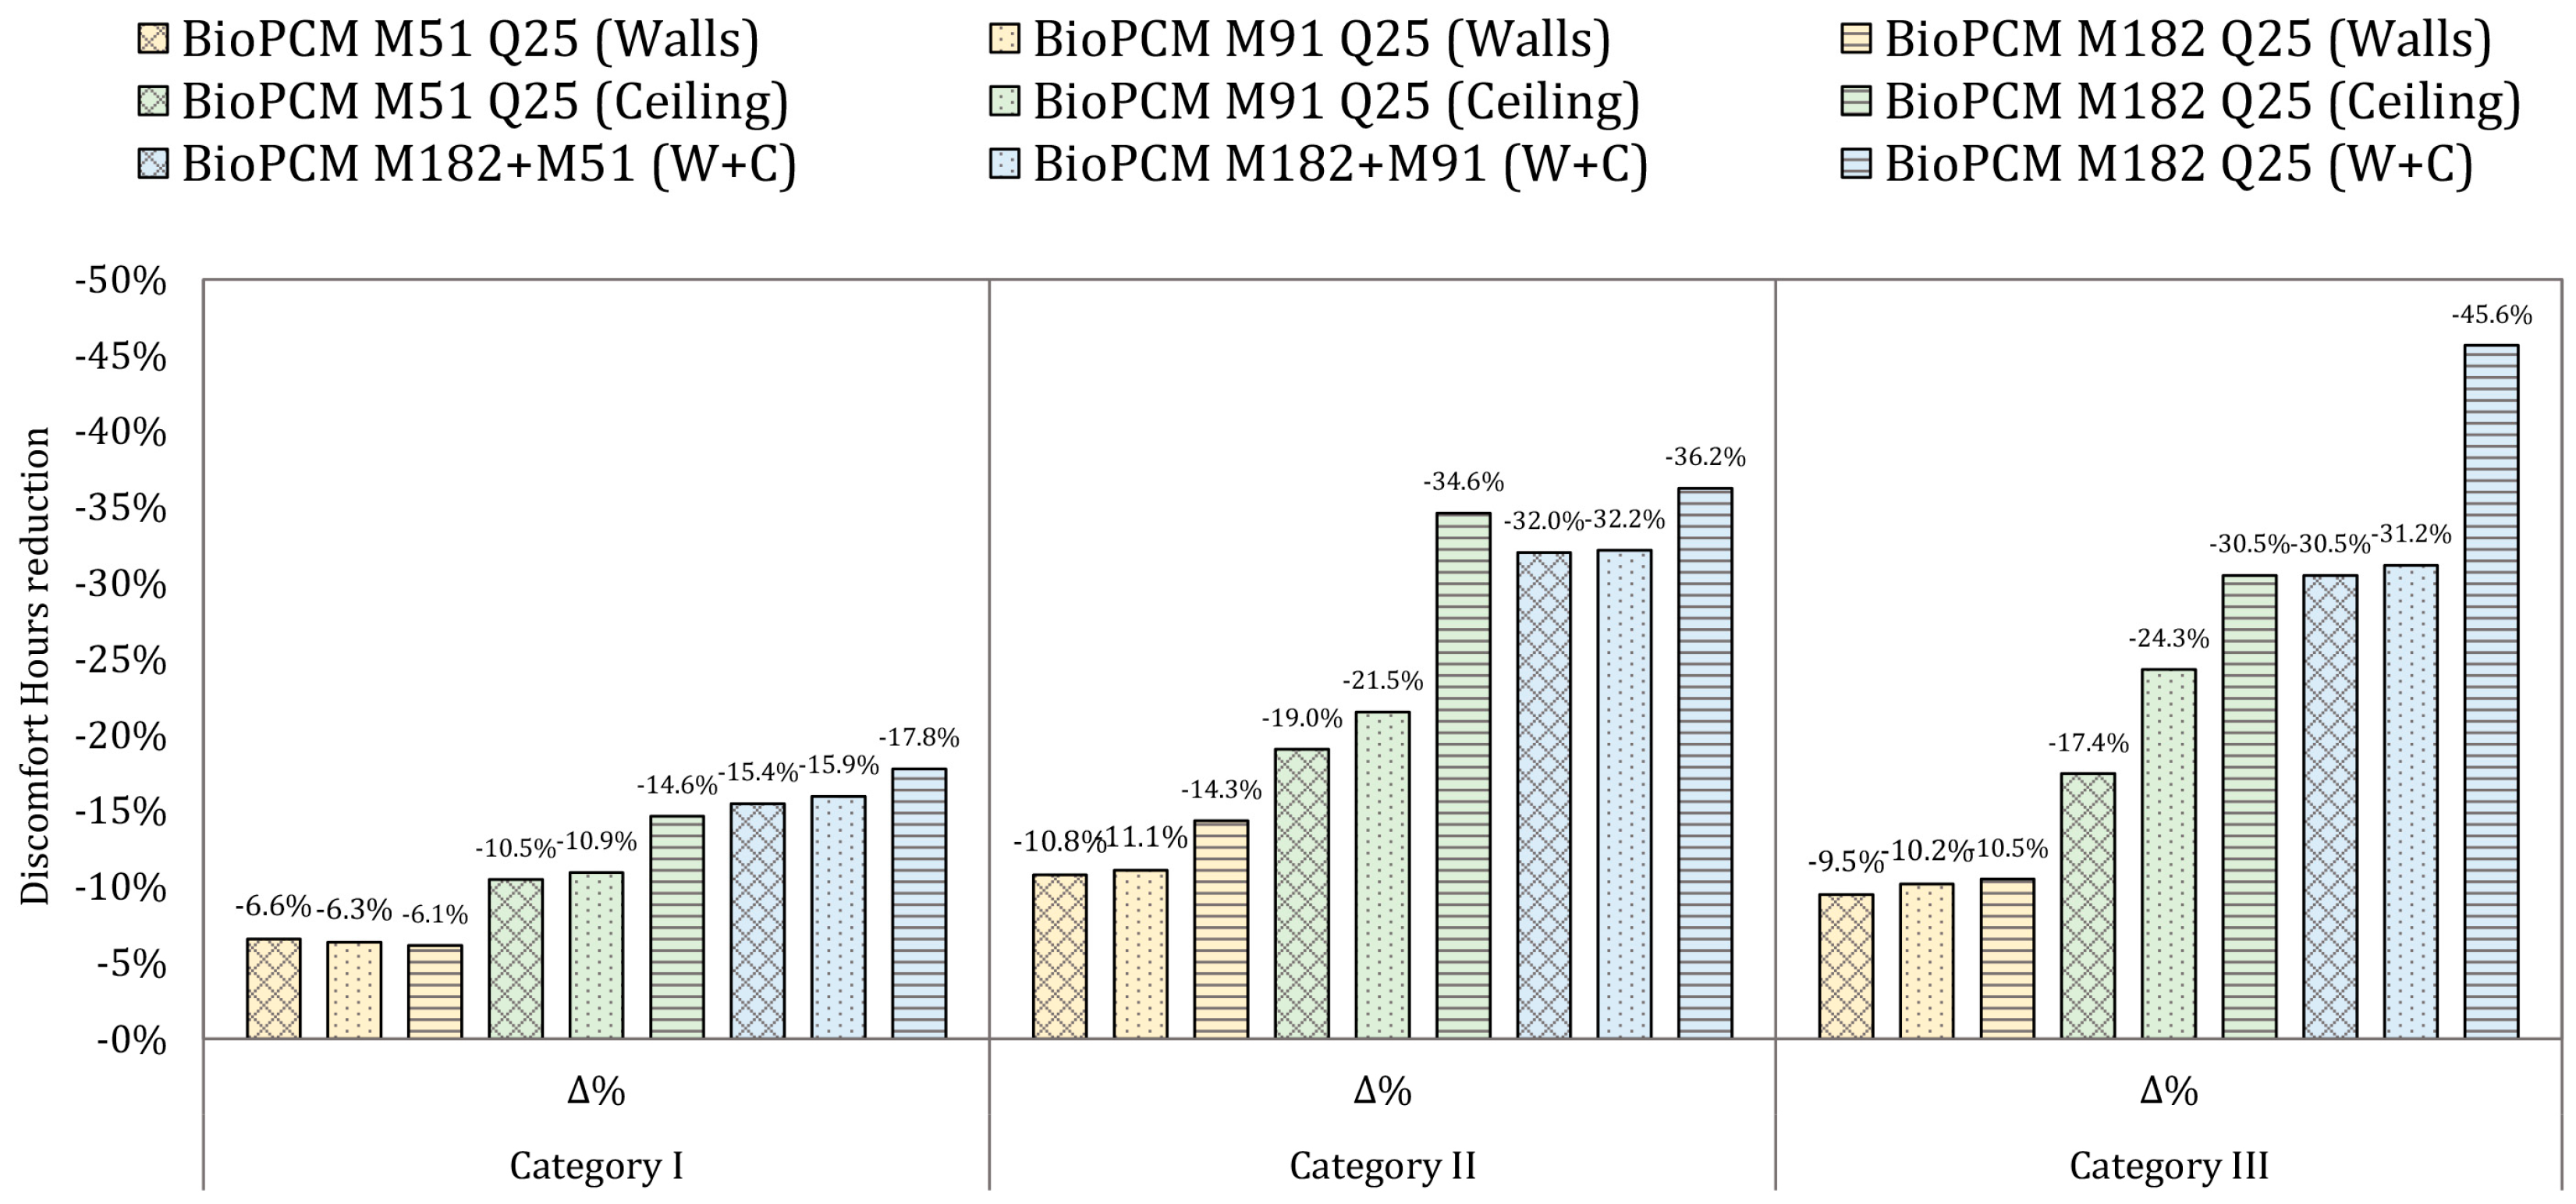
3.2. Thermal Comfort Assessment
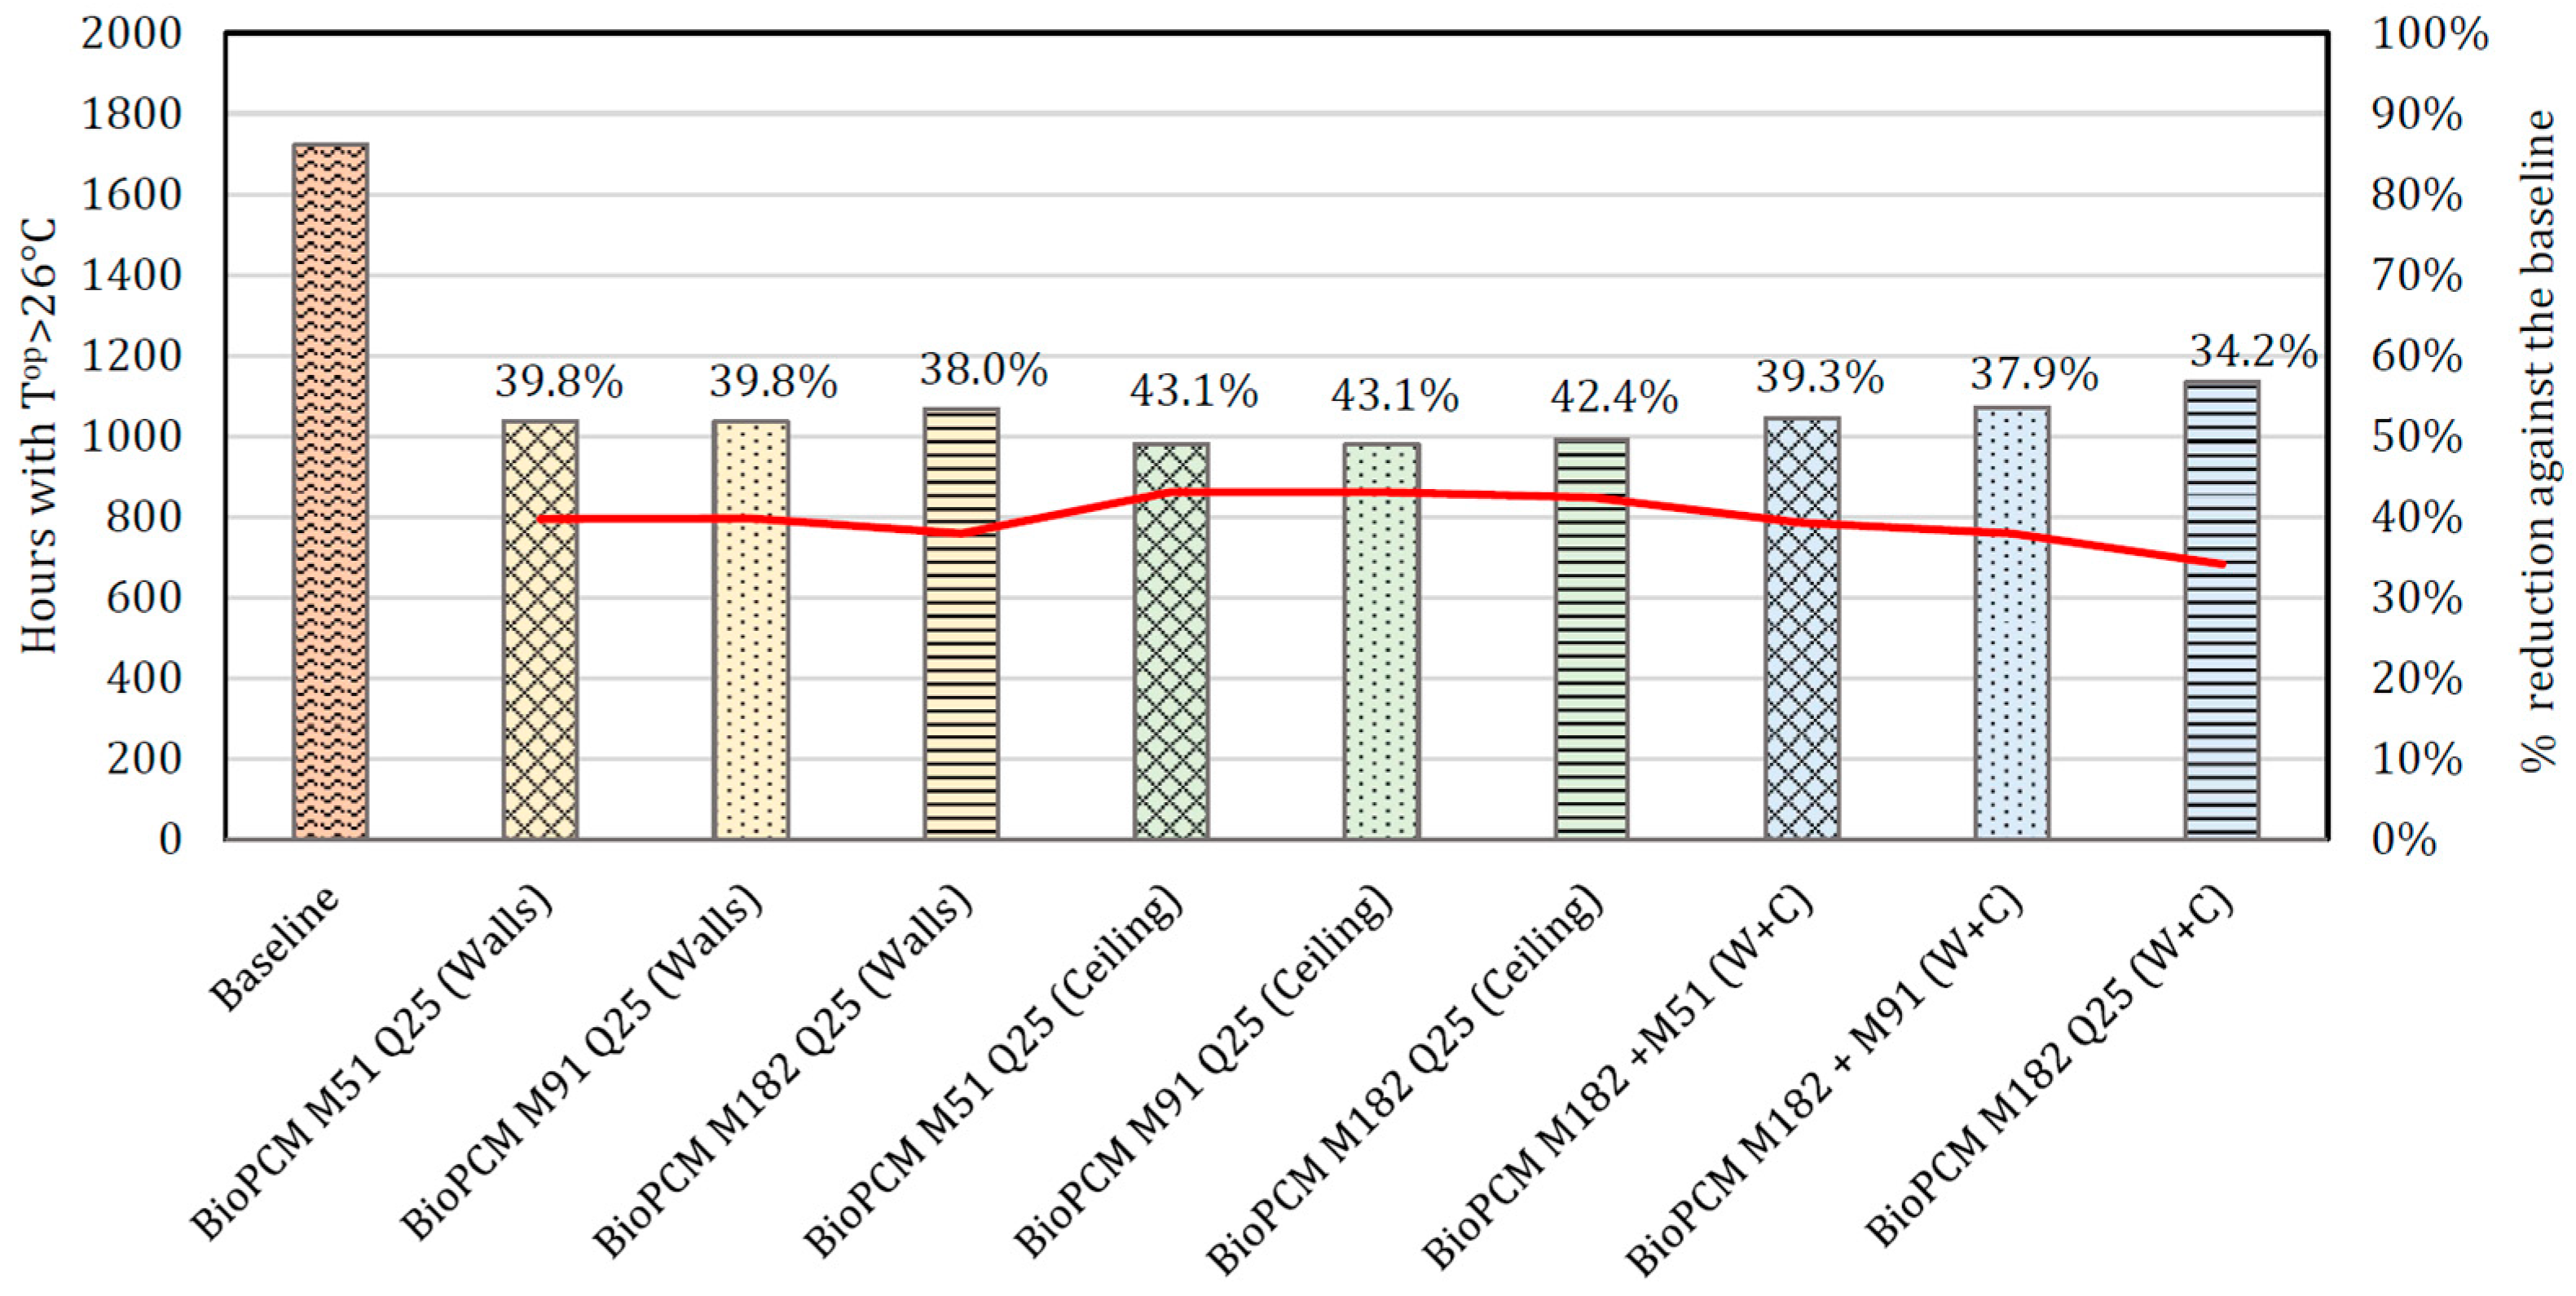
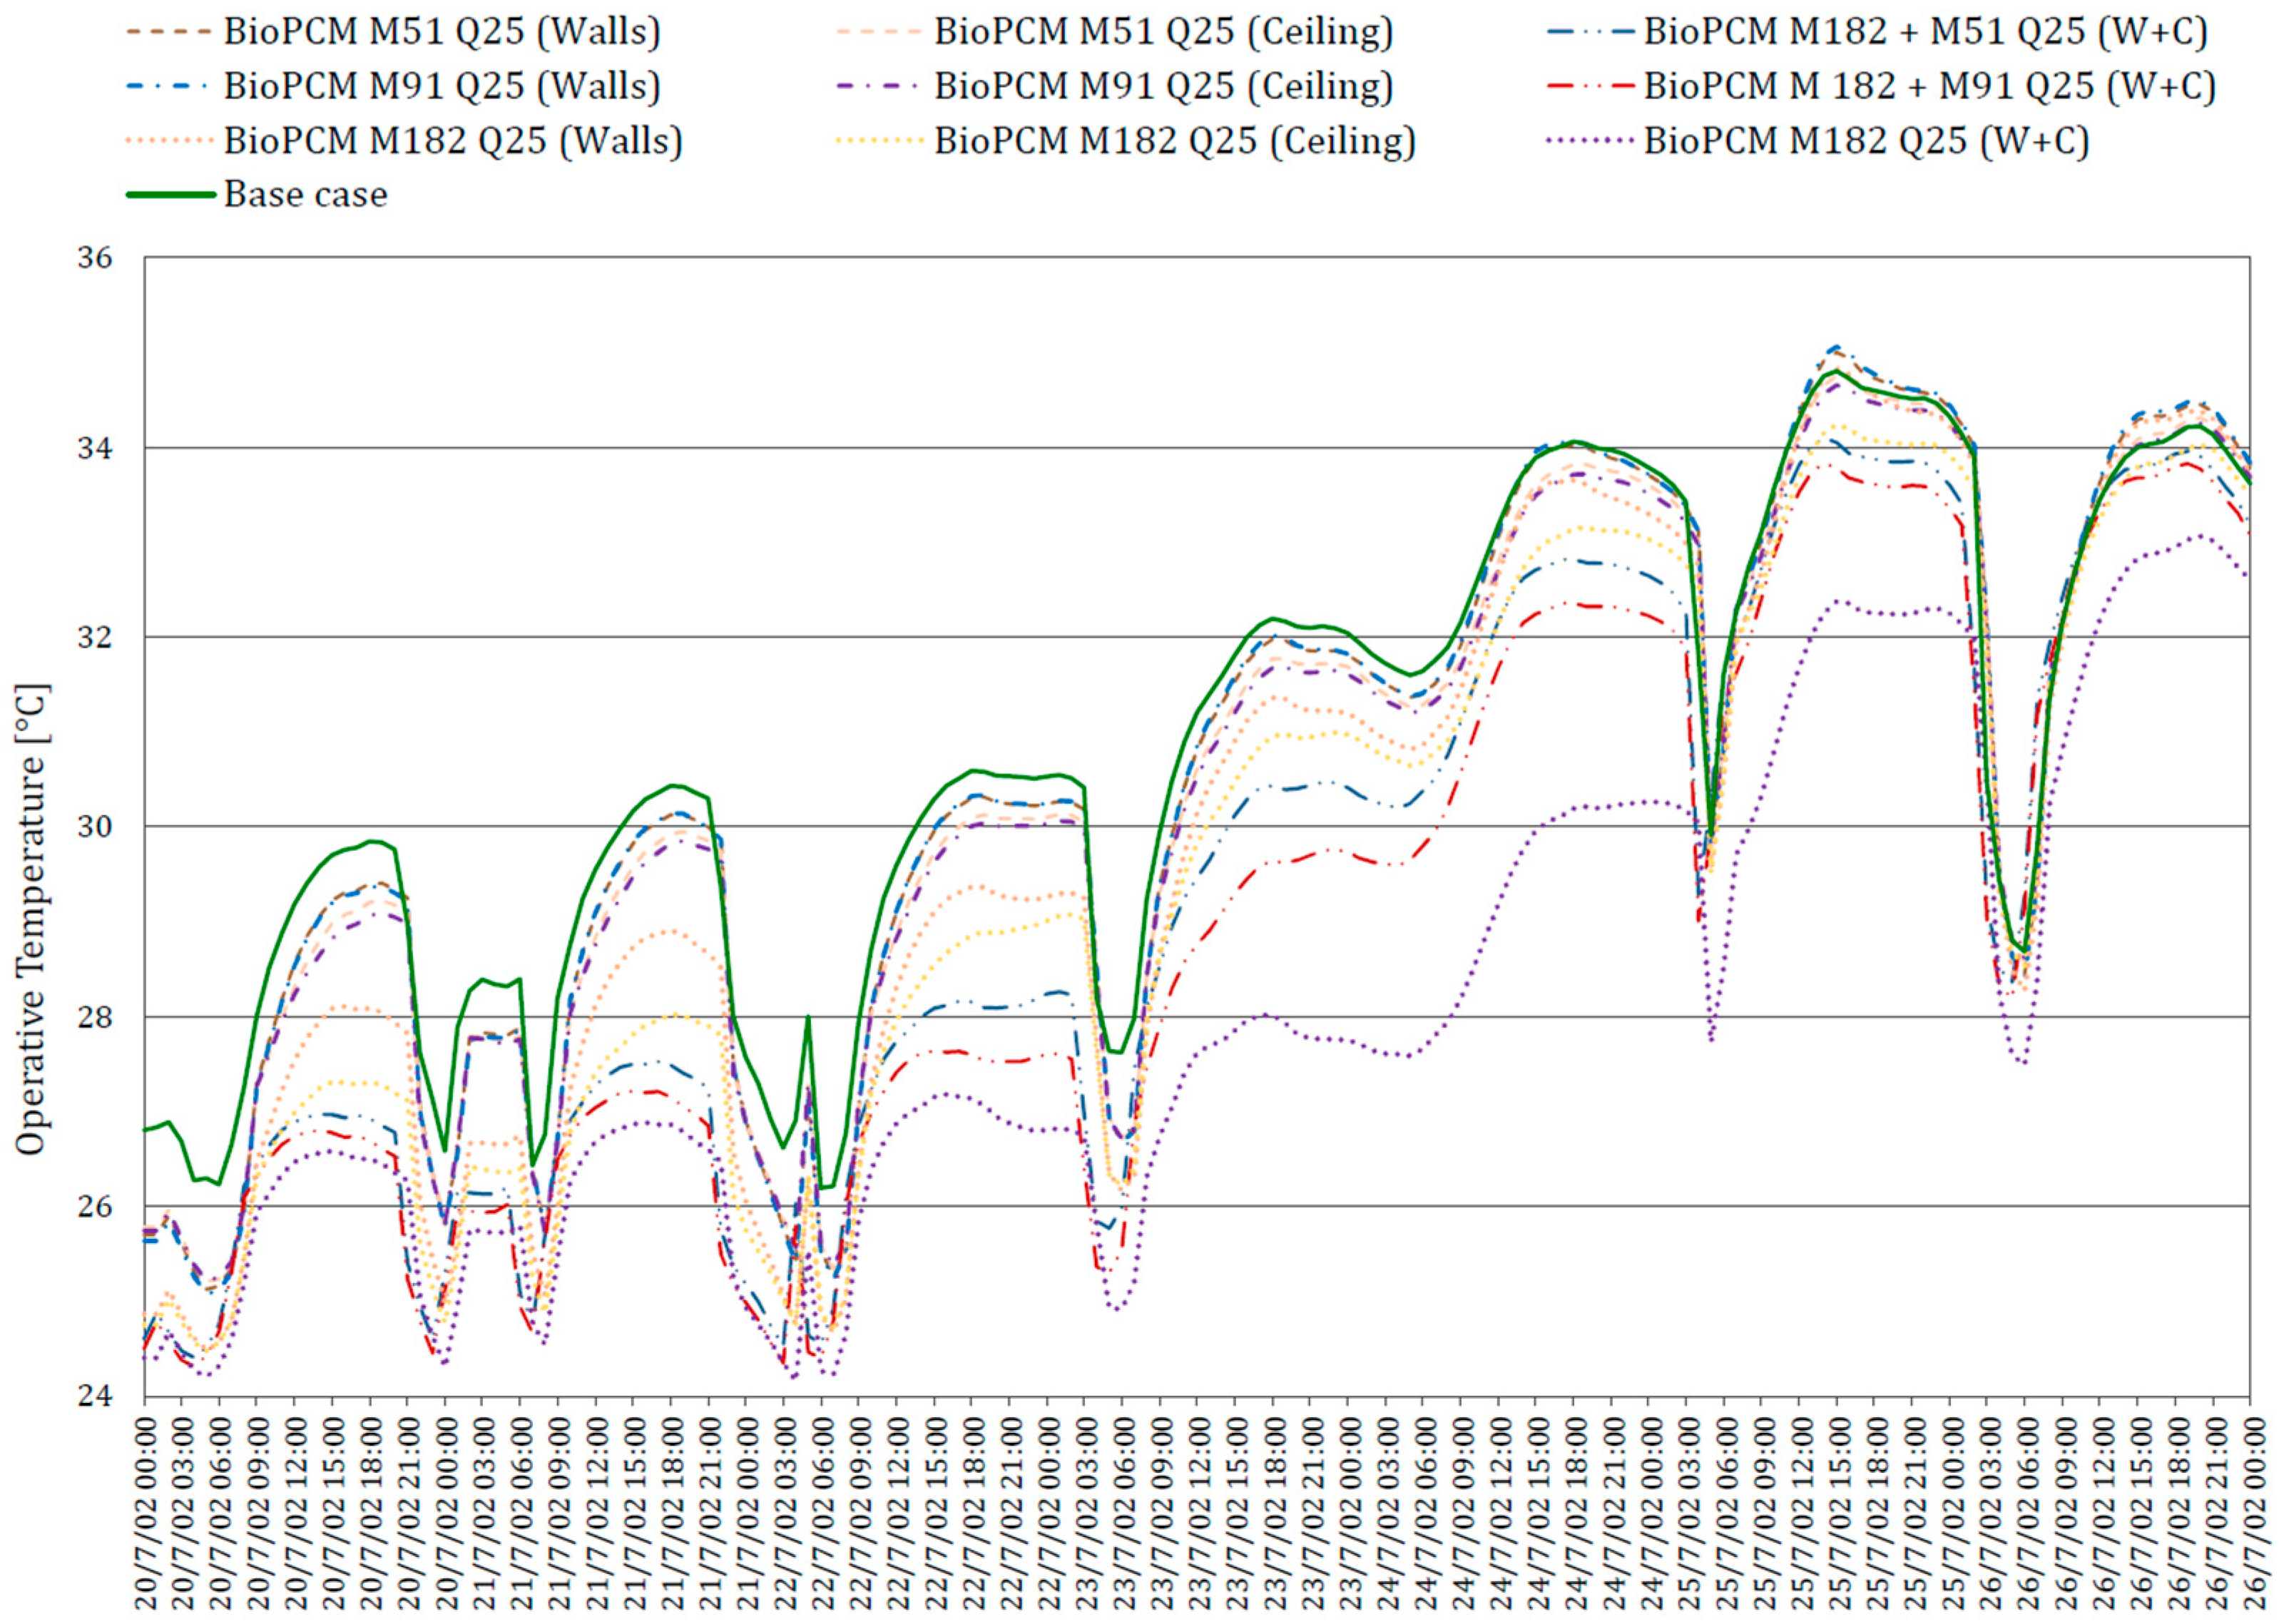
3.3. Summer Free-Floating Analysis
3.4. Economic Benefit Evaluation
4. Conclusions
Author Contributions
Funding
Data Availability Statement
Conflicts of Interest
Abbreviations
| Nomenclature | |
| cp | specific heat (J/(kg⋅K)) |
| Frelax | relaxation factor |
| ggl,n | solar factor at normal incidence |
| h | enthalpy (J/kg) |
| I*C | investment cost with state deductions (70%) |
| IC | investment cost |
| PCM | phase change materials |
| PMV | average expected vote |
| POR | percentage out of range |
| PPD | percentage of dissatisfied people |
| <PPD> | average PPD |
| SEER | seasonal energy efficiency ratio |
| T | temperature (K, °C) |
| T*R | payback time with state deductions. |
| TES | thermal energy storage |
| TR | payback time |
| U-value | thermal transmittance |
| WWR | window-to-wall ratio |
| Greek letters | |
| Δ% | percentage variation |
| λ | thermal conductivity (W/(m⋅K)) |
| Δx | step size in spatial coordinates (m) |
| Δt | step size in temporal coordinates (s) |
| ρ | density (kg/m3) |
References
- McAllister, T. Developing Guidelines and Standards for Disaster Resilience of the Built Environment: A Research Needs Assessment; US Department of Commerce, National Institute of Standards and Technology: Gaithersburg, MD, USA, 2013. [Google Scholar] [CrossRef]
- Flores-Larsen, S.; Filippín, C.; Bre, F. New Metrics for Thermal Resilience of Passive Buildings during Heat Events. Build. Environ. 2023, 230, 109990. [Google Scholar] [CrossRef]
- Vinet, L.; Zhedanov, A. A “Missing” Family of Classical Orthogonal Polynomials. Eur. Comm. 2010, 53, 24. [Google Scholar] [CrossRef]
- IEA—International Energy Agency. Energy Technology Perspectives 2023; IEA: Paris, France, 2023.
- Ciancio, V.; Salata, F.; Falasca, S.; Curci, G.; Golasi, I.; de Wilde, P. Energy Demands of Buildings in the Framework of Climate Change: An Investigation across Europe. Sustain. Cities Soc. 2020, 60, 102213. [Google Scholar] [CrossRef]
- van Daalen, K.R.; Tonne, C.; Semenza, J.C.; Rocklöv, J.; Markandya, A.; Dasandi, N.; Jankin, S.; Achebak, H.; Ballester, J.; Bechara, H.; et al. The 2024 Europe Report of the Lancet Countdown on Health and Climate Change: Unprecedented Warming Demands Unprecedented Action. Lancet Public Health 2024, 9, e495–e522. [Google Scholar] [CrossRef] [PubMed]
- Attia, S.; Levinson, R.; Ndongo, E.; Holzer, P.; Berk Kazanci, O.; Homaei, S.; Zhang, C.; Olesen, B.W.; Qi, D.; Hamdy, M.; et al. Resilient Cooling of Buildings to Protect against Heat Waves and Power Outages: Key Concepts and Definition. Energy Build. 2021, 239, 110869. [Google Scholar] [CrossRef]
- El Majd, A.; Sair, S.; Ait Ousaleh, H.; Berardi, U.; Moulakhnif, K.; Belouaggadia, N.; Younsi, Z.; El Bouari, A. Advancing PCM Research in Building Efficiency: A Comprehensive Investigation into PCM Selection and Critical Integration Strategies. J. Build. Eng. 2024, 96, 110485. [Google Scholar] [CrossRef]
- Ben Romdhane, S.; Amamou, A.; Ben Khalifa, R.; Saïd, N.M.; Younsi, Z.; Jemni, A. A Review on Thermal Energy Storage Using Phase Change Materials in Passive Building Applications. J. Build. Eng. 2020, 32, 101563. [Google Scholar] [CrossRef]
- Yin, H.; Norouziasas, A.; Hamdy, M. PCM as an Energy Flexibility Asset: How Design and Operation Can Be Optimized for Heating in Residential Buildings? Energy Build 2024, 322, 114721. [Google Scholar] [CrossRef]
- Rathore, P.K.S.; Gupta, N.K.; Yadav, D.; Shukla, S.K.; Kaul, S. Thermal Performance of the Building Envelope Integrated with Phase Change Material for Thermal Energy Storage: An Updated Review. Sustain. Cities Soc. 2022, 79, 103690. [Google Scholar] [CrossRef]
- Lachheb, M.; Younsi, Z.; Youssef, N.; Bouadila, S. Enhancing Building Energy Efficiency and Thermal Performance with PCM-Integrated Brick Walls: A Comprehensive Review. Build. Environ. 2024, 256, 111476. [Google Scholar] [CrossRef]
- Berardi, U.; Soudian, S. Experimental Investigation of Latent Heat Thermal Energy Storage Using PCMs with Different Melting Temperatures for Building Retrofit. Energy Build. 2019, 185, 180–195. [Google Scholar] [CrossRef]
- Sawadogo, M.; Duquesne, M.; Belarbi, R.; Hamami, A.E.A.; Godin, A. Review on the Integration of Phase Change Materials in Building Envelopes for Passive Latent Heat Storage. Appl. Sci. 2021, 11, 9305. [Google Scholar] [CrossRef]
- Navarro, L.; De Gracia, A.; Niall, D.; Castell, A.; Browne, M.; Mccormack, S.J.; Griffiths, P.; Cabeza, L.F. Thermal Energy Storage in Building Integrated Thermal Systems: A Review. Part 2. Integration as Passive System. Renew. Energy 2015, 85, 1334–1356. [Google Scholar] [CrossRef]
- Zeinelabdein, R.; Omer, S.; Gan, G. Critical Review of Latent Heat Storage Systems for Free Cooling in Buildings. Renew. Sustain. Energy Rev. 2018, 82, 2843–2868. [Google Scholar] [CrossRef]
- Piselli, C.; Prabhakar, M.; de Gracia, A.; Saffari, M.; Pisello, A.L.; Cabeza, L.F. Optimal Control of Natural Ventilation as Passive Cooling Strategy for Improving the Energy Performance of Building Envelope with PCM Integration. Renew. Energy 2020, 162, 171–181. [Google Scholar] [CrossRef]
- De Gracia, A.; Cabeza, L.F. Engineering Advance Phase Change Materials and Thermal Energy Storage for Buildings. Energy Build. 2015, 103, 414–419. [Google Scholar] [CrossRef]
- Kulumkanov, N.; Memon, S.A.; Khawaja, S.A. Evaluating Future Building Energy Efficiency and Environmental Sustainability with PCM Integration in Building Envelope. J. Build. Eng. 2024, 93, 109413. [Google Scholar] [CrossRef]
- Li, N.; Dai, J.; Zhang, W.; Li, Z.; Faraj, K.; Khaled, M.; Faraj, J.; Hachem, F.; Castelain, C. A Summary Review on Experimental Studies for PCM Building Applications: Towards Advanced Modular Prototype. Energies 2022, 15, 1459. [Google Scholar] [CrossRef]
- Delcroix, B.; Kummert, M.; Daoud, A. Building-Scale Experimental Validation of a New Model for Walls with Phase Change Materials. Sci. Technol. Built. Environ. 2017, 23, 1049–1062. [Google Scholar] [CrossRef]
- Chen, X.; Zhang, Q.; Zhai, Z.J.; Ma, X. Potential of Ventilation Systems with Thermal Energy Storage Using PCMs Applied to Air Conditioned Buildings. Renew. Energy 2019, 138, 39–53. [Google Scholar] [CrossRef]
- Behzadi, A.; Sadrizadeh, S. Advanced Smart HVAC System Utilizing Borehole Thermal Energy Storage: Detailed Analysis of a Uppsala Case Study Focused on the Deep Green Cooling Innovation. J. Energy Storage 2024, 99, 113470. [Google Scholar] [CrossRef]
- Masood, U.; Haggag, M.; Hassan, A.; Laghari, M. A Review of Phase Change Materials as a Heat Storage Medium for Cooling Applications in the Built Environment. Buildings 2023, 13, 1595. [Google Scholar] [CrossRef]
- Berardi, U.; Manca, M. The Energy Saving and Indoor Comfort Improvements with Latent Thermal Energy Storage in Building Retrofits in Canada. Energy Procedia 2017, 111, 462–471. [Google Scholar] [CrossRef]
- Arumugam, P.; Ramalingam, V.; Vellaichamy, P. Effective PCM, Insulation, Natural and/or Night Ventilation Techniques to Enhance the Thermal Performance of Buildings Located in Various Climates—A Review. Energy Build. 2022, 258, 111840. [Google Scholar] [CrossRef]
- Ahmad, I.; Ghosh, U.; Bhargav, A.; Bennacer, R.; Ganaoui, M. El Phase Change with Inner Ventilation for Energy Management: Roofs Buildings in Hot & Dry Climates Case. Int. J. Heat Mass Transf. 2024, 222, 125165. [Google Scholar] [CrossRef]
- Zahir, M.H.; Irshad, K.; Shafiullah, M.; Ibrahim, N.I.; Kausarul Islam, A.K.M.; Mohaisen, K.O.; Sulaiman, F.A.A. Challenges of the Application of PCMs to Achieve Zero Energy Buildings under Hot Weather Conditions: A Review. J. Energy Storage 2023, 64, 107156. [Google Scholar] [CrossRef]
- Salihi, M.; Chhiti, Y.; El Fiti, M.; Harmen, Y.; Chebak, A.; Jama, C. Enhancement of Buildings Energy Efficiency Using Passive PCM Coupled with Natural Ventilation in the Moroccan Climate Zones. Energy Build. 2024, 315, 114322. [Google Scholar] [CrossRef]
- Stasi, R.; Ruggiero, F.; Berardi, U. Evaluation of Mixed Mode Ventilation Cooling Energy Saving Potential in NZEB: A Case Study in Southern Italy. E3S Web Conf. 2022, 343, 01004. [Google Scholar] [CrossRef]
- Stasi, R.; Ruggiero, F.; Berardi, U. Natural Ventilation Effectiveness in Low-Income Housing to Challenge Energy Poverty. Energy Build. 2024, 304, 113836. [Google Scholar] [CrossRef]
- Ballarini, I.; Corgnati, S.P.; Corrado, V. Use of Reference Buildings to Assess the Energy Saving Potentials of the Residential Building Stock: The Experience of TABULA Project. Energy Policy 2014, 68, 273–284. [Google Scholar] [CrossRef]
- UNI/TS 11300-1; Prestazioni Energetiche Degli Edifici—Parte 1: Determinazione del Fabbisogno di Energia Termica Dell’edificio per la Climatizzazione Estiva ed Invernale. Italian Unification Authority: Rome, Italy, 2014.
- Tunçbilek, E.; Arıcı, M.; Krajčík, M.; Nižetić, S.; Karabay, H. Thermal Performance Based Optimization of an Office Wall Containing PCM under Intermittent Cooling Operation. Appl. Therm. Eng. 2020, 179, 115750. [Google Scholar] [CrossRef]
- ISO 7730:2005; Ergonomics of the Thermal Environment—Analytical Determination and Interpretation of Thermal Comfort Using Calculation of the PMV and PPD Indices and Local Thermal Comfort. IOS: Geneva, Switzerland, 2005.
- EN Standard 16798-1; Indoor Environmental Input Parameters for Design and Assessment of Energy Performance of Buildings Addressing Indoor Air Quality, Thermal Environment, Lighting and Acoustics—Module M1-6. CTI—Comitato Termotecnico Italiano: Milano, Italy, 2019.
- Carlucci, S.; Pagliano, L. A Review of Indices for the Long-Term Evaluation of the General Thermal Comfort Conditions in Buildings. Energy Build. 2012, 53, 194–205. [Google Scholar] [CrossRef]
- Carlucci, S. A Review of Long-Term Discomfort Indices. In Thermal Comfort Assessment of Buildings; Springer Briefs in Applied Sciences and Technology; Springer: Berlin/Heidelberg, Germany, 2013; pp. 1–20. [Google Scholar] [CrossRef]


| M51 | M91 | M182 | |
|---|---|---|---|
| Thickness (s) | 2.08 cm | 3.71 cm | 7.42 cm |
| Thermal conductivity (λ) | 0.2 W/m K | ||
| Density (ρ) | 235 Kg/m3 | ||
| Specific heat (c) | 1.97 kJ/Kg K | ||
| Melting temperature (Q) | 25 °C | ||
| Enthalpy (h) | Figure 3 | ||
| ID | Heating | Cooling | ||||||
|---|---|---|---|---|---|---|---|---|
| Δ% | Δ% | |||||||
| BL | Baseline | 41.11 | kWh/m2 | - | 12.86 | kWh/m2 | - | |
| Wall | PCM 1 | BioPCM M51 Q25 | 37.54 | kWh/m2 | −8.7% | 10.76 | kWh/m2 | −16.4% |
| PCM 2 | BioPCM M91 Q25 | 35.29 | kWh/m2 | −14.2% | 11.50 | kWh/m2 | −10.6% | |
| PCM 3 | BioPCM M182 Q25 | 30.64 | kWh/m2 | −25.5% | 11.68 | kWh/m2 | −9.2% | |
| Ceiling | PCM 4 | BioPCM M51 Q25 | 41.18 | kWh/m2 | 0.2% | 10.93 | kWh/m2 | −15.1% |
| PCM 5 | BioPCM M91 Q25 | 41.08 | kWh/m2 | −0.1% | 10.80 | kWh/m2 | −16.0% | |
| PCM 6 | BioPCM M182 Q25 | 40.90 | kWh/m2 | −0.5% | 10.61 | kWh/m2 | −17.5% | |
| Heating | Cooling | |||||||
|---|---|---|---|---|---|---|---|---|
| Δ% | Δ% | |||||||
| BL | Baseline | 41.11 | kWh/m2 | - | 12.86 | kWh/m2 | ||
| W + C | PCM 6 + PCM 1 | BioPCM M182 + M51 | 37.34 | kWh/m2 | −9.2% | 10.65 | kWh/m2 | −17.2% |
| PCM 6 + PCM 2 | BioPCM M182 + M91 | 34.85 | kWh/m2 | −15.2% | 10.69 | kWh/m2 | −16.9% | |
| PCM 6 + PCM 3 | BioPCM M182 + M182 | 30.17 | kWh/m2 | −26.6% | 10.80 | kWh/m2 | −16.0% | |
| Cooling Period | Heating Period | |||||||||
|---|---|---|---|---|---|---|---|---|---|---|
| POR | <PPD> | POR | <PPD> | |||||||
| BL | Baseline | 4.9% | 6.65 | 24.6% | 8.38 | |||||
| Walls | PCM 1 | BioPCM M51 Q25 | 3.2% | −34.7% | 6.12 | −8.0% | 22.6% | −8.1% | 8.35 | −0.4% |
| PCM 2 | BioPCM M91 Q25 | 3.3% | −32.7% | 6.11 | −8.1% | 23.1% | −5.9% | 8.31 | −0.9% | |
| PCM 3 | BioPCM M182 Q25 | 4.7% | −4.1% | 6.09 | −8.4% | 22.7% | −7.5% | 8.20 | −2.2% | |
| Ceiling | PCM 4 | BioPCM M51 Q25 | 3.1% | −36.7% | 6.44 | −3.2% | 23.7% | −3.5% | 8.22 | −2.0% |
| PCM 5 | BioPCM M91 Q25 | 3.2% | −34.7% | 6.31 | −5.2% | 23.6% | −3.9% | 8.10 | −3.3% | |
| PCM 6 | BioPCM M182 Q25 | 3.3% | −32.7% | 6.24 | −6.1% | 23.8% | −3.3% | 8.05 | −4.0% | |
| W + C | PCM 6 + PCM 1 | BioPCM M182 + M51 | 3.0% | −38.8% | 6.12 | −8.0% | 23.1% | −6.1% | 8.10 | −3.4% |
| PCM 6 + PCM 2 | BioPCM M182 + M91 | 3.2% | −34.7% | 6.06 | −8.8% | 22.8% | −7.3% | 8.11 | −3.3% | |
| PCM 6 + PCM 3 | BioPCM M182 + M182 | 4.0% | −18.4% | 5.98 | −10.1% | 23.2% | −5.5% | 8.07 | −3.7% | |
| Category I EN 16798-1 | Category II EN 16798-1 | Category III EN 16798-1 | ||||||
|---|---|---|---|---|---|---|---|---|
| ID | Δ% | Δ% | Δ% | |||||
| BL | Baseline | 458.0 | 338.5 | 162.0 | ||||
| Walls | PCM 1 | BioPCM M51 Q25 | 428.0 | −6.6% | 302.0 | −10.8% | 146.7 | −9.5% |
| PCM 2 | BioPCM M91 Q25 | 429.0 | −6.3% | 301.0 | −11.1% | 145.5 | −10.2% | |
| PCM 3 | BioPCM M182 Q25 | 430.0 | −6.1% | 290.0 | −14.3% | 145.0 | −10.5% | |
| Ceiling | PCM 4 | BioPCM M51 Q25 | 410.0 | −10.5% | 274.1 | −19.0% | 133.8 | −17.4% |
| PCM 5 | BioPCM M91 Q25 | 408.0 | −10.9% | 265.8 | −21.5% | 122.6 | −24.3% | |
| PCM 6 | BioPCM M182 Q25 | 391.0 | −14.6% | 221.4 | −34.6% | 112.6 | −30.5% | |
| W + C | PCM 6 + PCM 1 | BioPCM M182 + M51 | 387.3 | −15.4% | 230.1 | −32.0% | 112.6 | −30.5% |
| PCM 6 + PCM 2 | BioPCM M182 + M91 | 385.0 | −15.9% | 229.7 | −32.2% | 111.5 | −31.2% | |
| PCM 6 + PCM 3 | BioPCM M182 + M182 | 376.7 | −17.8% | 215.8 | −36.2% | 88.1 | −45.6% | |
| Money Saving | Payback PERIOD | ||||||||||||||||
|---|---|---|---|---|---|---|---|---|---|---|---|---|---|---|---|---|---|
| Heating | Cooling | Tot. | IC | TR | I*C | T*R | |||||||||||
| Walls | PCM 1 | 269.4 | kWh/y | EUR | 29.6 | 158.7 | kWh/y | EUR | 39.7 | EUR | 69.3 | EUR | 1997.0 | 28.8 | EUR | 599.0 | 8.6 |
| PCM 2 | 439.1 | kWh/y | EUR | 48.3 | 102.6 | kWh/y | EUR | 25.7 | EUR | 74.0 | EUR | 3238.0 | 43.8 | EUR | 971.0 | 13.1 | |
| PCM 3 | 789.8 | kWh/y | EUR | 86.9 | 89.5 | kWh/y | EUR | 22.4 | EUR | 109.3 | EUR | 6070.0 | 55.6 | EUR | 1821.0 | 16.7 | |
| Ceiling | PCM 4 | −5.2 | kWh/y | EUR | −0.6 | 146.2 | kWh/y | EUR | 36.5 | EUR | 36.0 | EUR | 2121.0 | 59.0 | EUR | 636.0 | 17.7 |
| PCM 5 | 2.0 | kWh/y | EUR | 0.2 | 155.4 | kWh/y | EUR | 38.9 | EUR | 39.1 | EUR | 3439.0 | 88.0 | EUR | 1032.0 | 26.4 | |
| PCM 6 | 16.0 | kWh/y | EUR | 1.8 | 169.8 | kWh/y | EUR | 42.4 | EUR | 44.2 | EUR | 6447.0 | 145.9 | EUR | 1934.0 | 43.8 | |
| W + C | PCM 6 + PCM 1 | 284.6 | kWh/y | EUR | 31.3 | 167.1 | kWh/y | EUR | 41.8 | EUR | 73.1 | EUR | 8446.0 | 115.6 | EUR | 2534.0 | 34.7 |
| PCM 6 + PCM 2 | 471.9 | kWh/y | EUR | 51.9 | 163.7 | kWh/y | EUR | 40.9 | EUR | 92.8 | EUR | 9687.0 | 104.3 | EUR | 2906.0 | 31.3 | |
| PCM 6 + PCM 3 | 825.1 | kWh/y | EUR | 90.8 | 155.4 | kWh/y | EUR | 38.8 | EUR | 129.6 | EUR | 12,519.0 | 96.6 | EUR | 3756.0 | 29.0 | |
Disclaimer/Publisher’s Note: The statements, opinions and data contained in all publications are solely those of the individual author(s) and contributor(s) and not of MDPI and/or the editor(s). MDPI and/or the editor(s) disclaim responsibility for any injury to people or property resulting from any ideas, methods, instructions or products referred to in the content. |
© 2024 by the authors. Licensee MDPI, Basel, Switzerland. This article is an open access article distributed under the terms and conditions of the Creative Commons Attribution (CC BY) license (https://creativecommons.org/licenses/by/4.0/).
Share and Cite
Stasi, R.; Ruggiero, F.; Berardi, U. Assessing the Potential of Phase-Change Materials in Energy Retrofitting of Existing Buildings in a Mediterranean Climate. Energies 2024, 17, 4839. https://doi.org/10.3390/en17194839
Stasi R, Ruggiero F, Berardi U. Assessing the Potential of Phase-Change Materials in Energy Retrofitting of Existing Buildings in a Mediterranean Climate. Energies. 2024; 17(19):4839. https://doi.org/10.3390/en17194839
Chicago/Turabian StyleStasi, Roberto, Francesco Ruggiero, and Umberto Berardi. 2024. "Assessing the Potential of Phase-Change Materials in Energy Retrofitting of Existing Buildings in a Mediterranean Climate" Energies 17, no. 19: 4839. https://doi.org/10.3390/en17194839