Article

Analysis of a New Liquefaction Combined with Desublimation System for CO2 Separation Based on N2/CO2 Phase Equilibrium

1
School of Energy and Environment, Southeast University, No 2 Si Pai Lou, Nanjing 210096, Jiangsu, China
2
9M Architectural Design Co. Ltd., No 2 Zi Jing Hua Road, Hangzhou 310012, Zhejiang, China
*
Author to whom correspondence should be addressed.
Energies 2015, 8(9), 9495-9508; https://doi.org/10.3390/en8099495
Submission received: 22 May 2015 / Revised: 30 June 2015 / Accepted: 28 July 2015 / Published: 1 September 2015

Abstract

:
Cryogenic CO2 capture is considered as a promising CO2 capture method due to its energy saving and environmental friendliness. The phase equilibrium analysis of CO2-mixtures at low temperature is crucial for the design and operation of a cryogenic system because it plays an important role in analysis of recovery and purity of the captured CO2. After removal of water and toxic gas, the main components in typical boiler gases are N2/CO2. Therefore, this paper evaluates the reliabilities of different cubic equations of state (EOS) and mixing rules for N2/CO2. The results show that Peng-Robinson (PR) and Soave-Redlich-Kwong (SRK) fit the experimental data well, PR combined with the van der Waals (vdW) mixing rule is more accurate than the other models. With temperature decrease, the accuracy of the model improves and the deviation of the N2 vapor fraction is 0.43% at 220 K. Based on the selected calculation model, the thermodynamic properties of N2/CO2 at low temperature are analyzed. According to the results, a new liquefaction combined with a desublimation system is proposed. The total recovery and purity of CO2 production of the new system are satisfactory enough for engineering applications. Additionally, the total energy required by the new system to capture the CO2 is about 3.108 MJ·kg−1 CO2, which appears to be at least 9% lower than desublimation separation when the initial concentration of CO2 is 40%.

Graphical Abstract

1. Introduction

Carbon dioxide capture and storage (CCS), which involves capture, transport and storage, is proposed as an important strategy to reduce greenhouse gas emissions significantly [1]. Of these three steps, CO2 capture is recognized as a promising and relatively quick solution to reduce global CO2 emissions. Many different types of CO2 capture methods have been studied by researchers all over the world. The main CO2 capture methods contain chemical absorption, physical adsorption, membrane separation, and cryogenic distillation. Among these technologies, cryogenic CO2 capture is attracting increased attention due to its energy saving and environmental friendliness [2]. Kelley et al. [3] proposed the Controlled Freeze Zone™ technology which is capable of removing CO2 and H2S from natural gas. In the process, CO2 is frozen out and remelted in a distillation tower. Song et al. [2] developed a novel CO2 capture process based on Stirling coolers (SC); the CO2 in the gas stream can be captured in solid form under the cryogenic condition, and frosted on the cold head of an SC. Theunissen et al. [4] reported condensed rotational separations for CO2 removal from contaminated natural gas. Zanganeh et al. [5] designed a CO2 cryogenic separate system where flue gas is compressed, cooled and dried, then the CO2 is condensed into a liquid. The above strategies capture CO
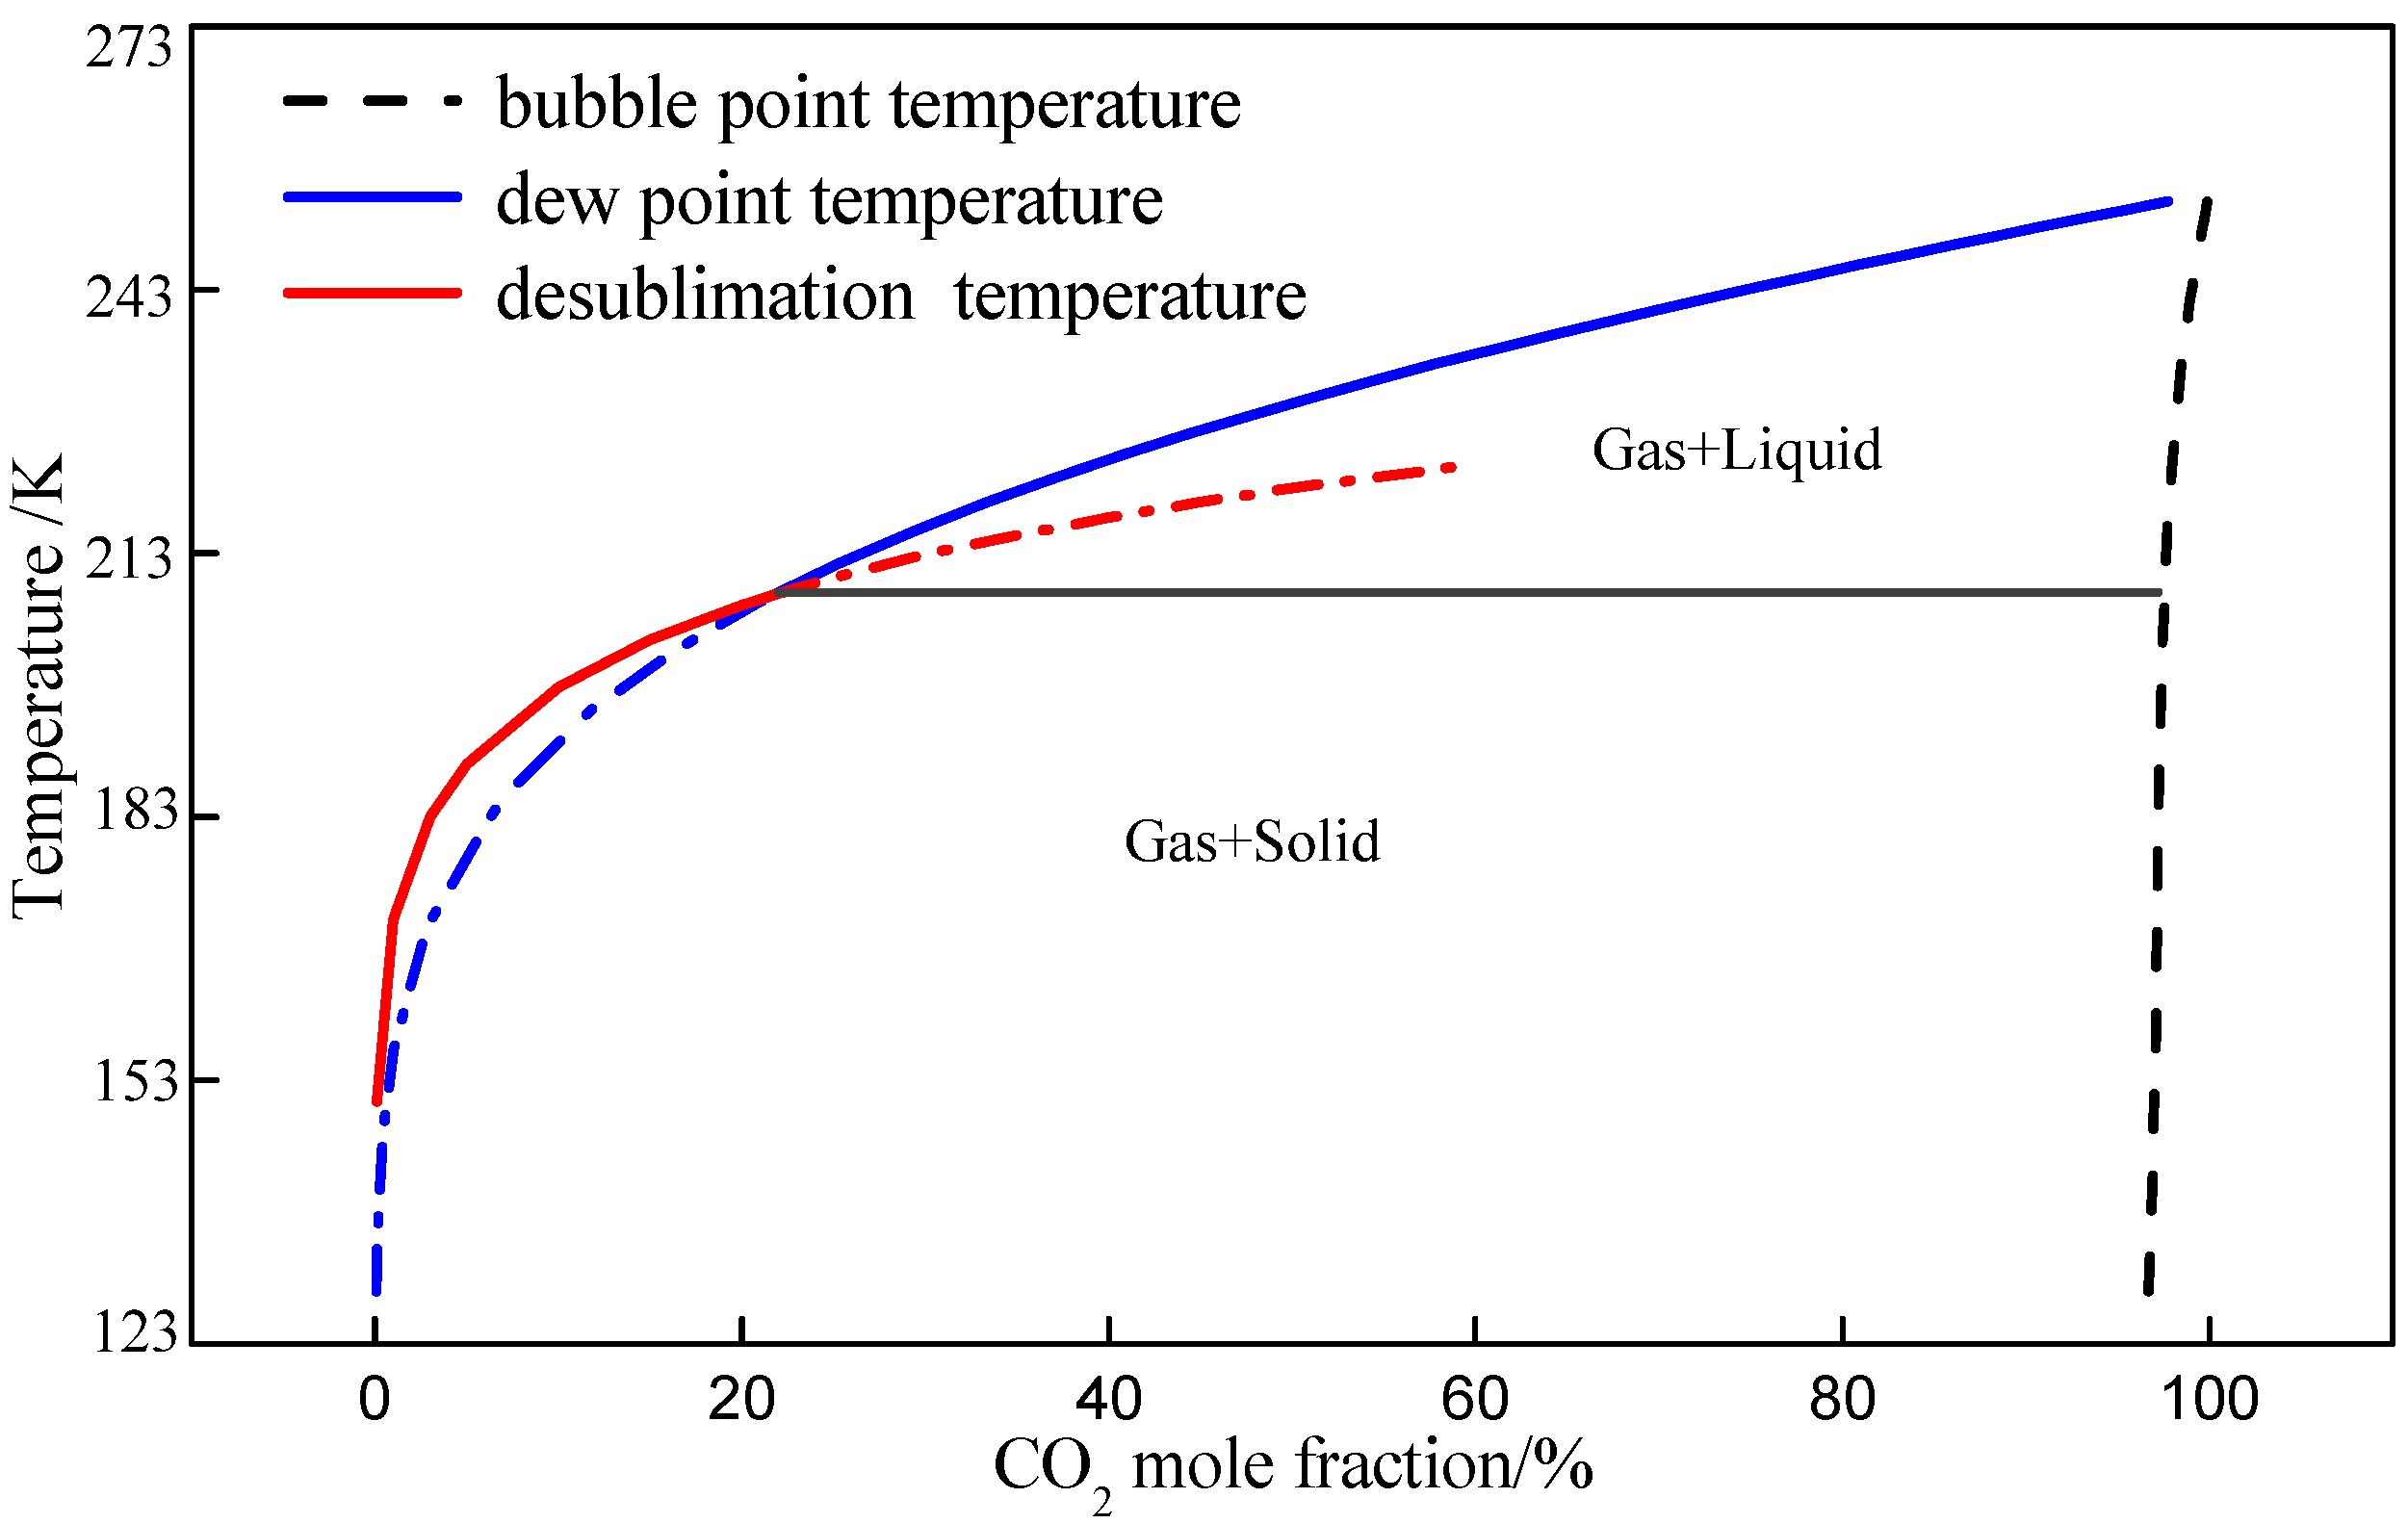
2 by liquefaction or desublimation separately, however, at a nominal 14% CO
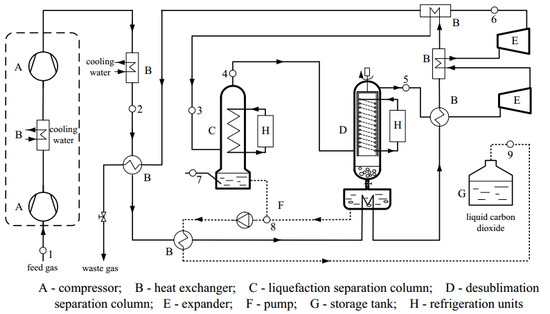
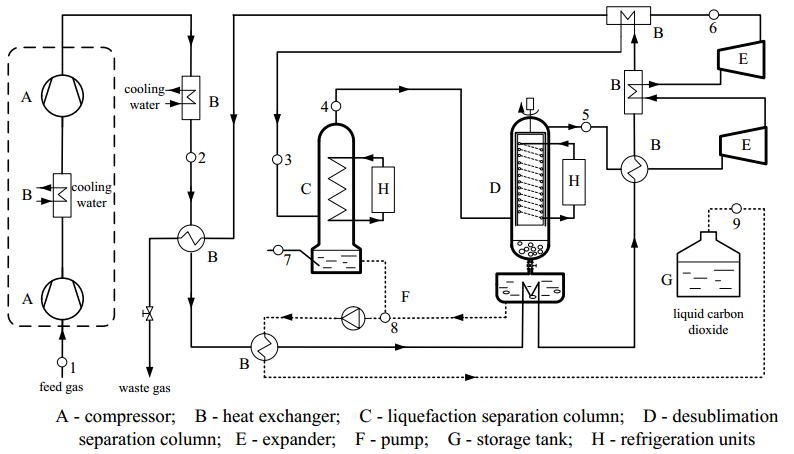
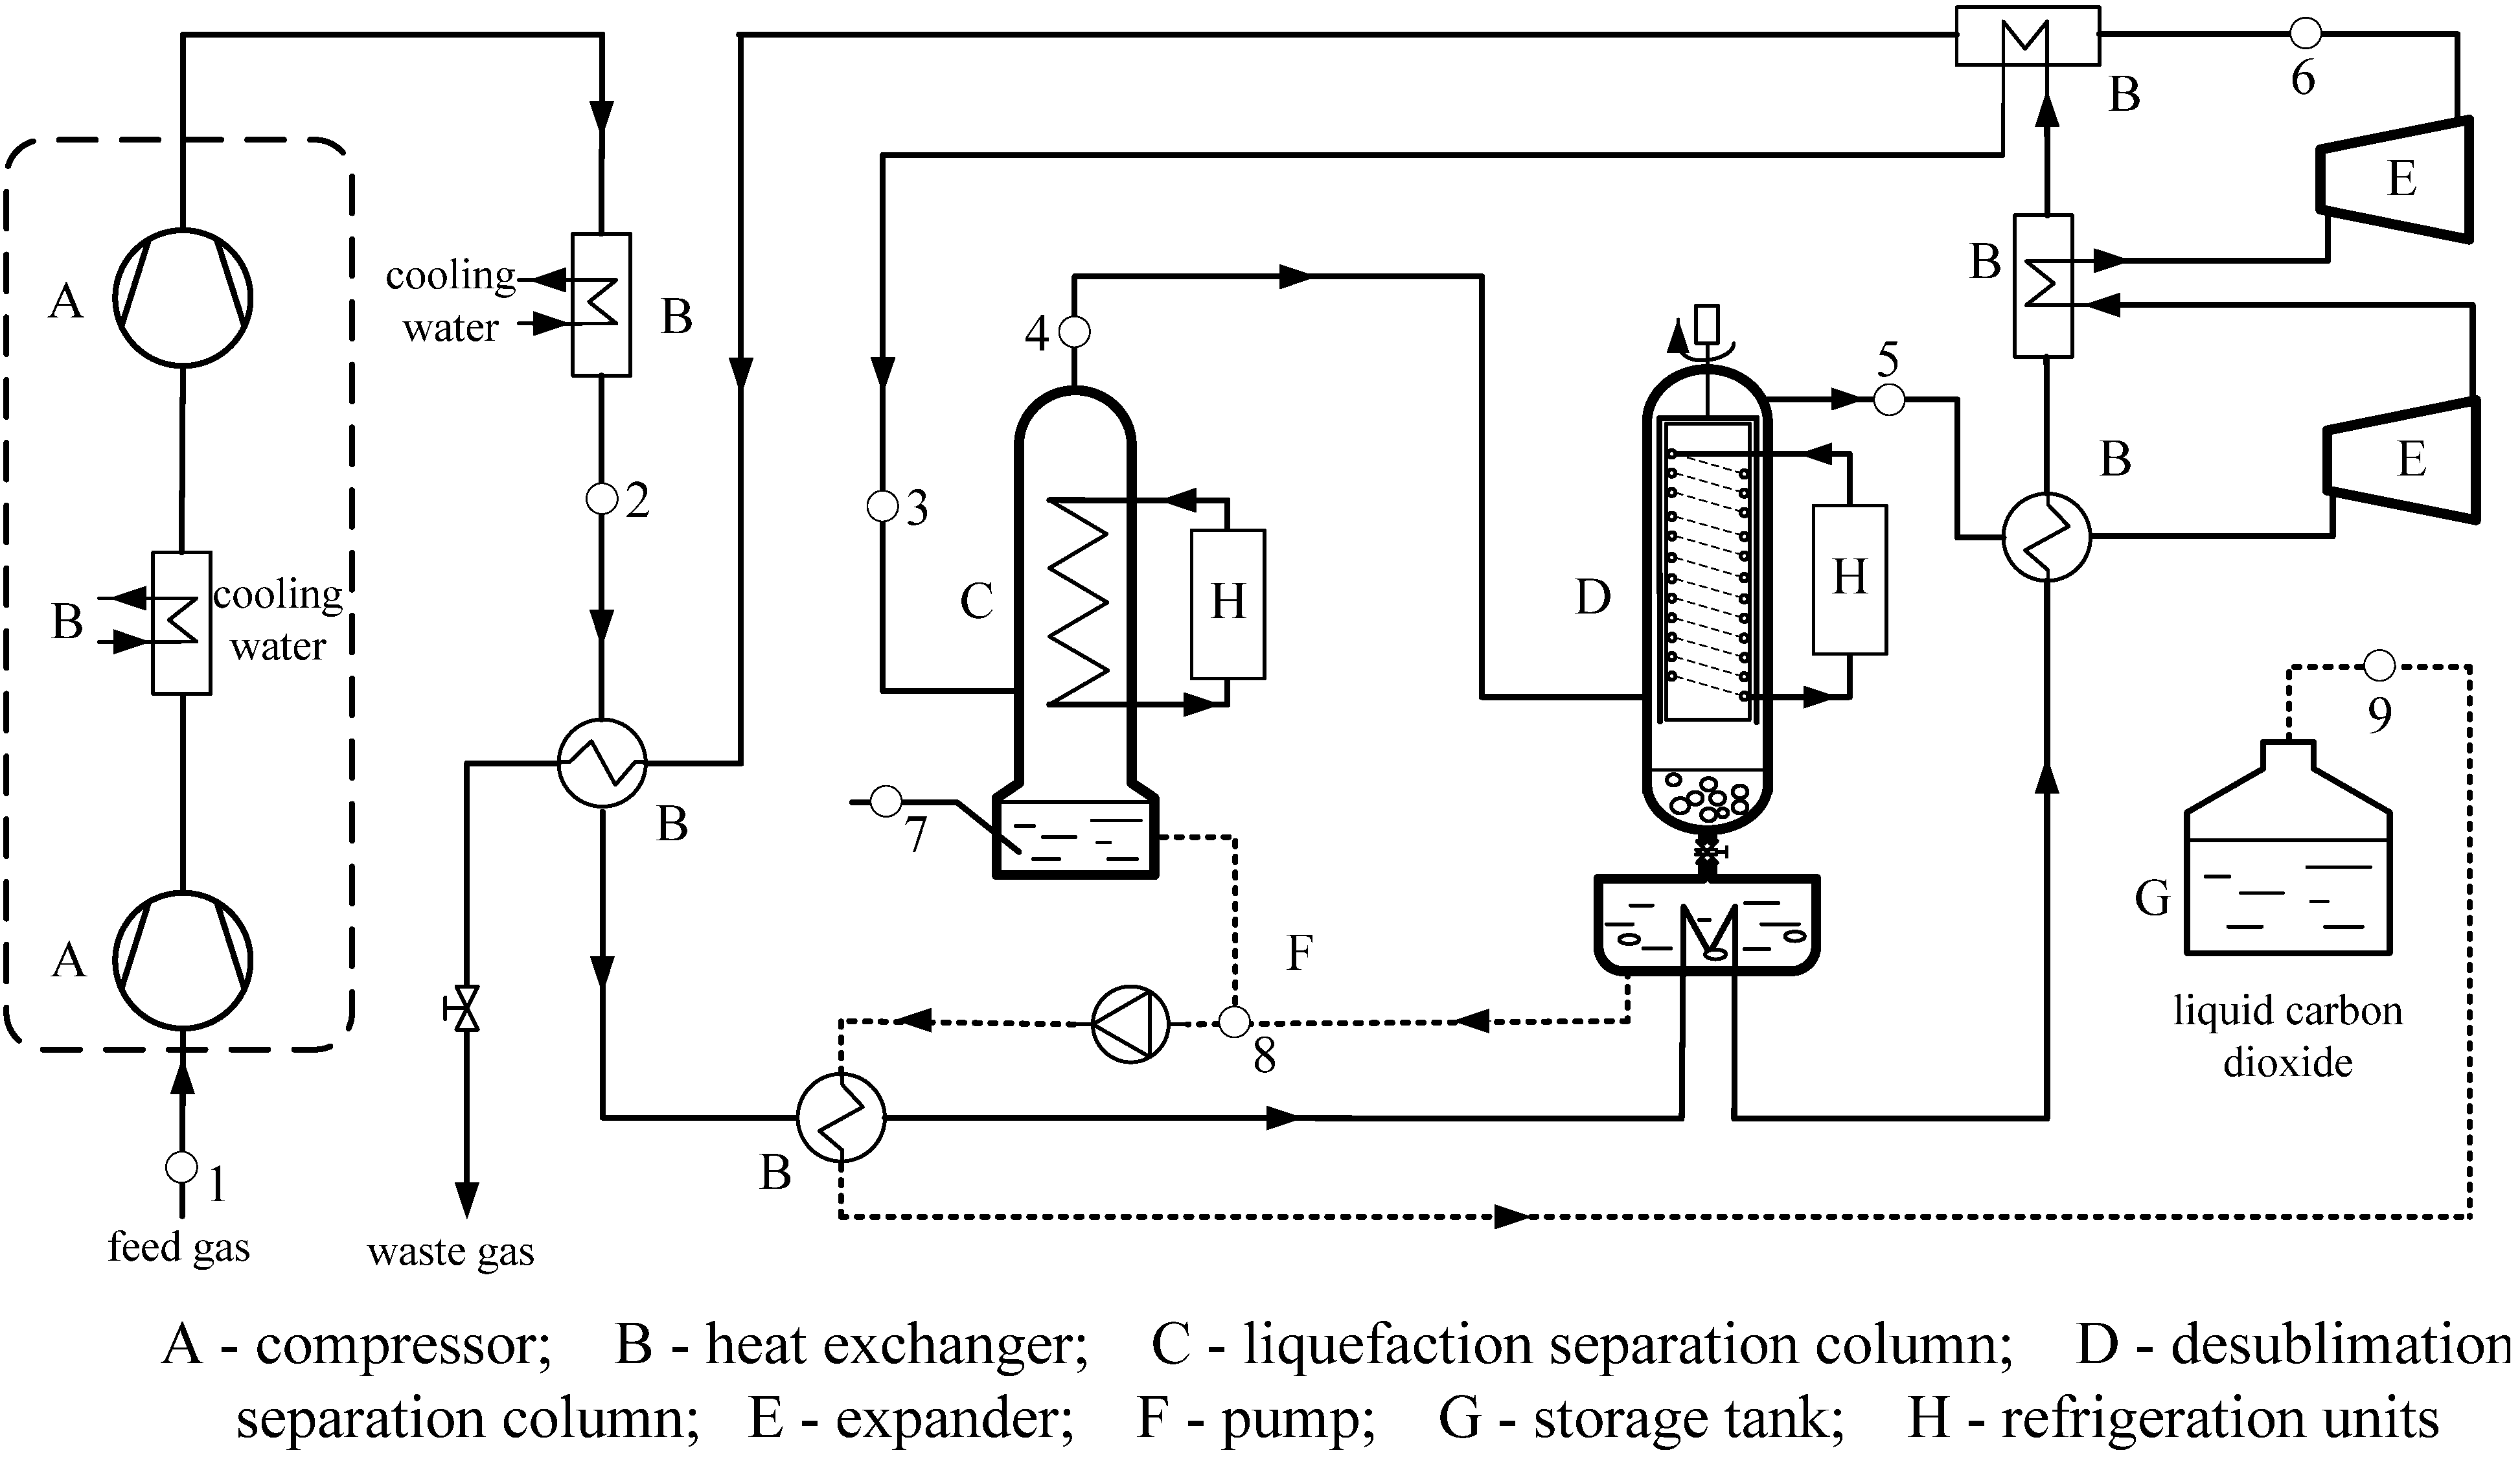
2 in typical flue gas, no liquid forms at any temperature or pressure occur, and desublimation separation is too energy-intensive to apply alone. For these reasons, a new liquefaction combined with desublimation system is proposed. The phase equilibrium of CO2-mixtures is of great importance to the design and operation of a cryogenic system. Depending on the sources of CO2-mixtures, the purity of CO2 stream is varied. Generally, the common impurities in flue gas include N2, O2, Ar, CH4, H2S, SO2 and H2O [6]. After removal of water and toxic gas, the main impurity in typical boiler gases is N2 [7], the permanent gas N2 is the main obstacle in the separation of CO2. Therefore, N2/CO2 phase equilibrium analysis at a low temperature is crucial for the investigation and design of a cryogenic CO2 capture system. The experimental data of N2/CO2 covers pressures from 0.6 MPa to 13.95 MPa and temperatures from 218.15 K to 403.15 K, with CO2 liquid mole fractions ranging from 0.43 to 1, and CO2 gas mole fractions ranging from 0.153 to 1 [8]. However, the experimental data are not continuous, there are some gaps between the available experimental data and the requirements of engineering applications. Therefore, semi-empirical equations of state (EOS) are usually used to satisfy the requirements with respect to the design and operation of cryogenic CO2 capture system. Cubic EOS offer a compromise between the generality and simplicity that are often used for many technical applications [9].
For N2/CO2 phase equilibrium calculations, different cubic EOSs and their reliability have been studied by some investigators. Dorau et al. [10] conducted N2/CO2 equilibrium experiments and the results showed the Peng-Robinson (PR) EOS correlates the experimental data well. However, the concrete accuracy was not given and experiments were conducted only at 223.15 K and 273.15 K. Thiery et al. [11] investigated Soave-Redlich-Kwong (SRK) EOS for the vapor liquid equilibrium (VLE) calculations of N2/CO2. The results indicated that the average deviation for the saturated pressures was around 4% in the temperature range of 218.15–273.15 K. Duan and Hu [12] developed a new cubic EOS, modeling the VLE properties of natural fluids based on SRK EOS. The calculations of the VLE were in good agreement with experiments for the N2/CO2 mixture. Li and Yan [13] evaluated the reliabilities of seven cubic EOS for predicting volumes of binary CO2 mixtures. Comparatively, the calculated results of PR and Patel-Teja (PT) are in good agreement with the experimental data especially in the liquid phase for the N2/CO2 mixture, the PR is superior in the calculation of liquid volumes, where the absolute average deviations is 1.74%, but the analysis was only carried out at 270 K. Ahmad et al. [14] stated that SRK provides satisfactory predictions that match well with the experimental data, especially with high concentration of CO2 (97.5%) in the case of N2/CO2 mixtures. For O2/CO2 mixtures, the SRK can correctly predict the dew-point line and the bubble point line with high concentrations of CO2.
Due to the semi-empirical EOS that were developed by using pure component data, the application of EOSs for multi-component is based on different mixing rules. Some EOS are not of sufficient accuracy, mainly because of inadequate use of the mixing rules. In general, the same equation of state, combining different mixing rules, may lead to different results. Raabe and Köhler [15] investigated the performances of SRK and PR cubic EOS with different types of mixing rules (including van der Waals (vdW) mixing rule and some Gibbs energy (GE) mixing rules that incorporate an activity coefficient model into the EOS model by equating the excess GE) in the N2/C2H6 system. The results showed that the vdW2 mixing rule, which introduced two variable parameters, was able to achieve high accuracy. Faúndez and Valderrama [16] used PR EOS combined with the Wong-Sandler (WS) mixing rule to study the hydrocarbon + alcohol mixtures at low and moderate pressure. It was concluded that the model could correlate equilibrium data in complex mixtures with accuracy similar to that of other models. However, it is difficult to evaluate precisely and systematically the relative merits of different mixing rules from existing papers for N2/CO2 mixture, since there is no widely used basis of comparison. In general, all of the studied EOS and mixing rules have various performances for various mixtures.
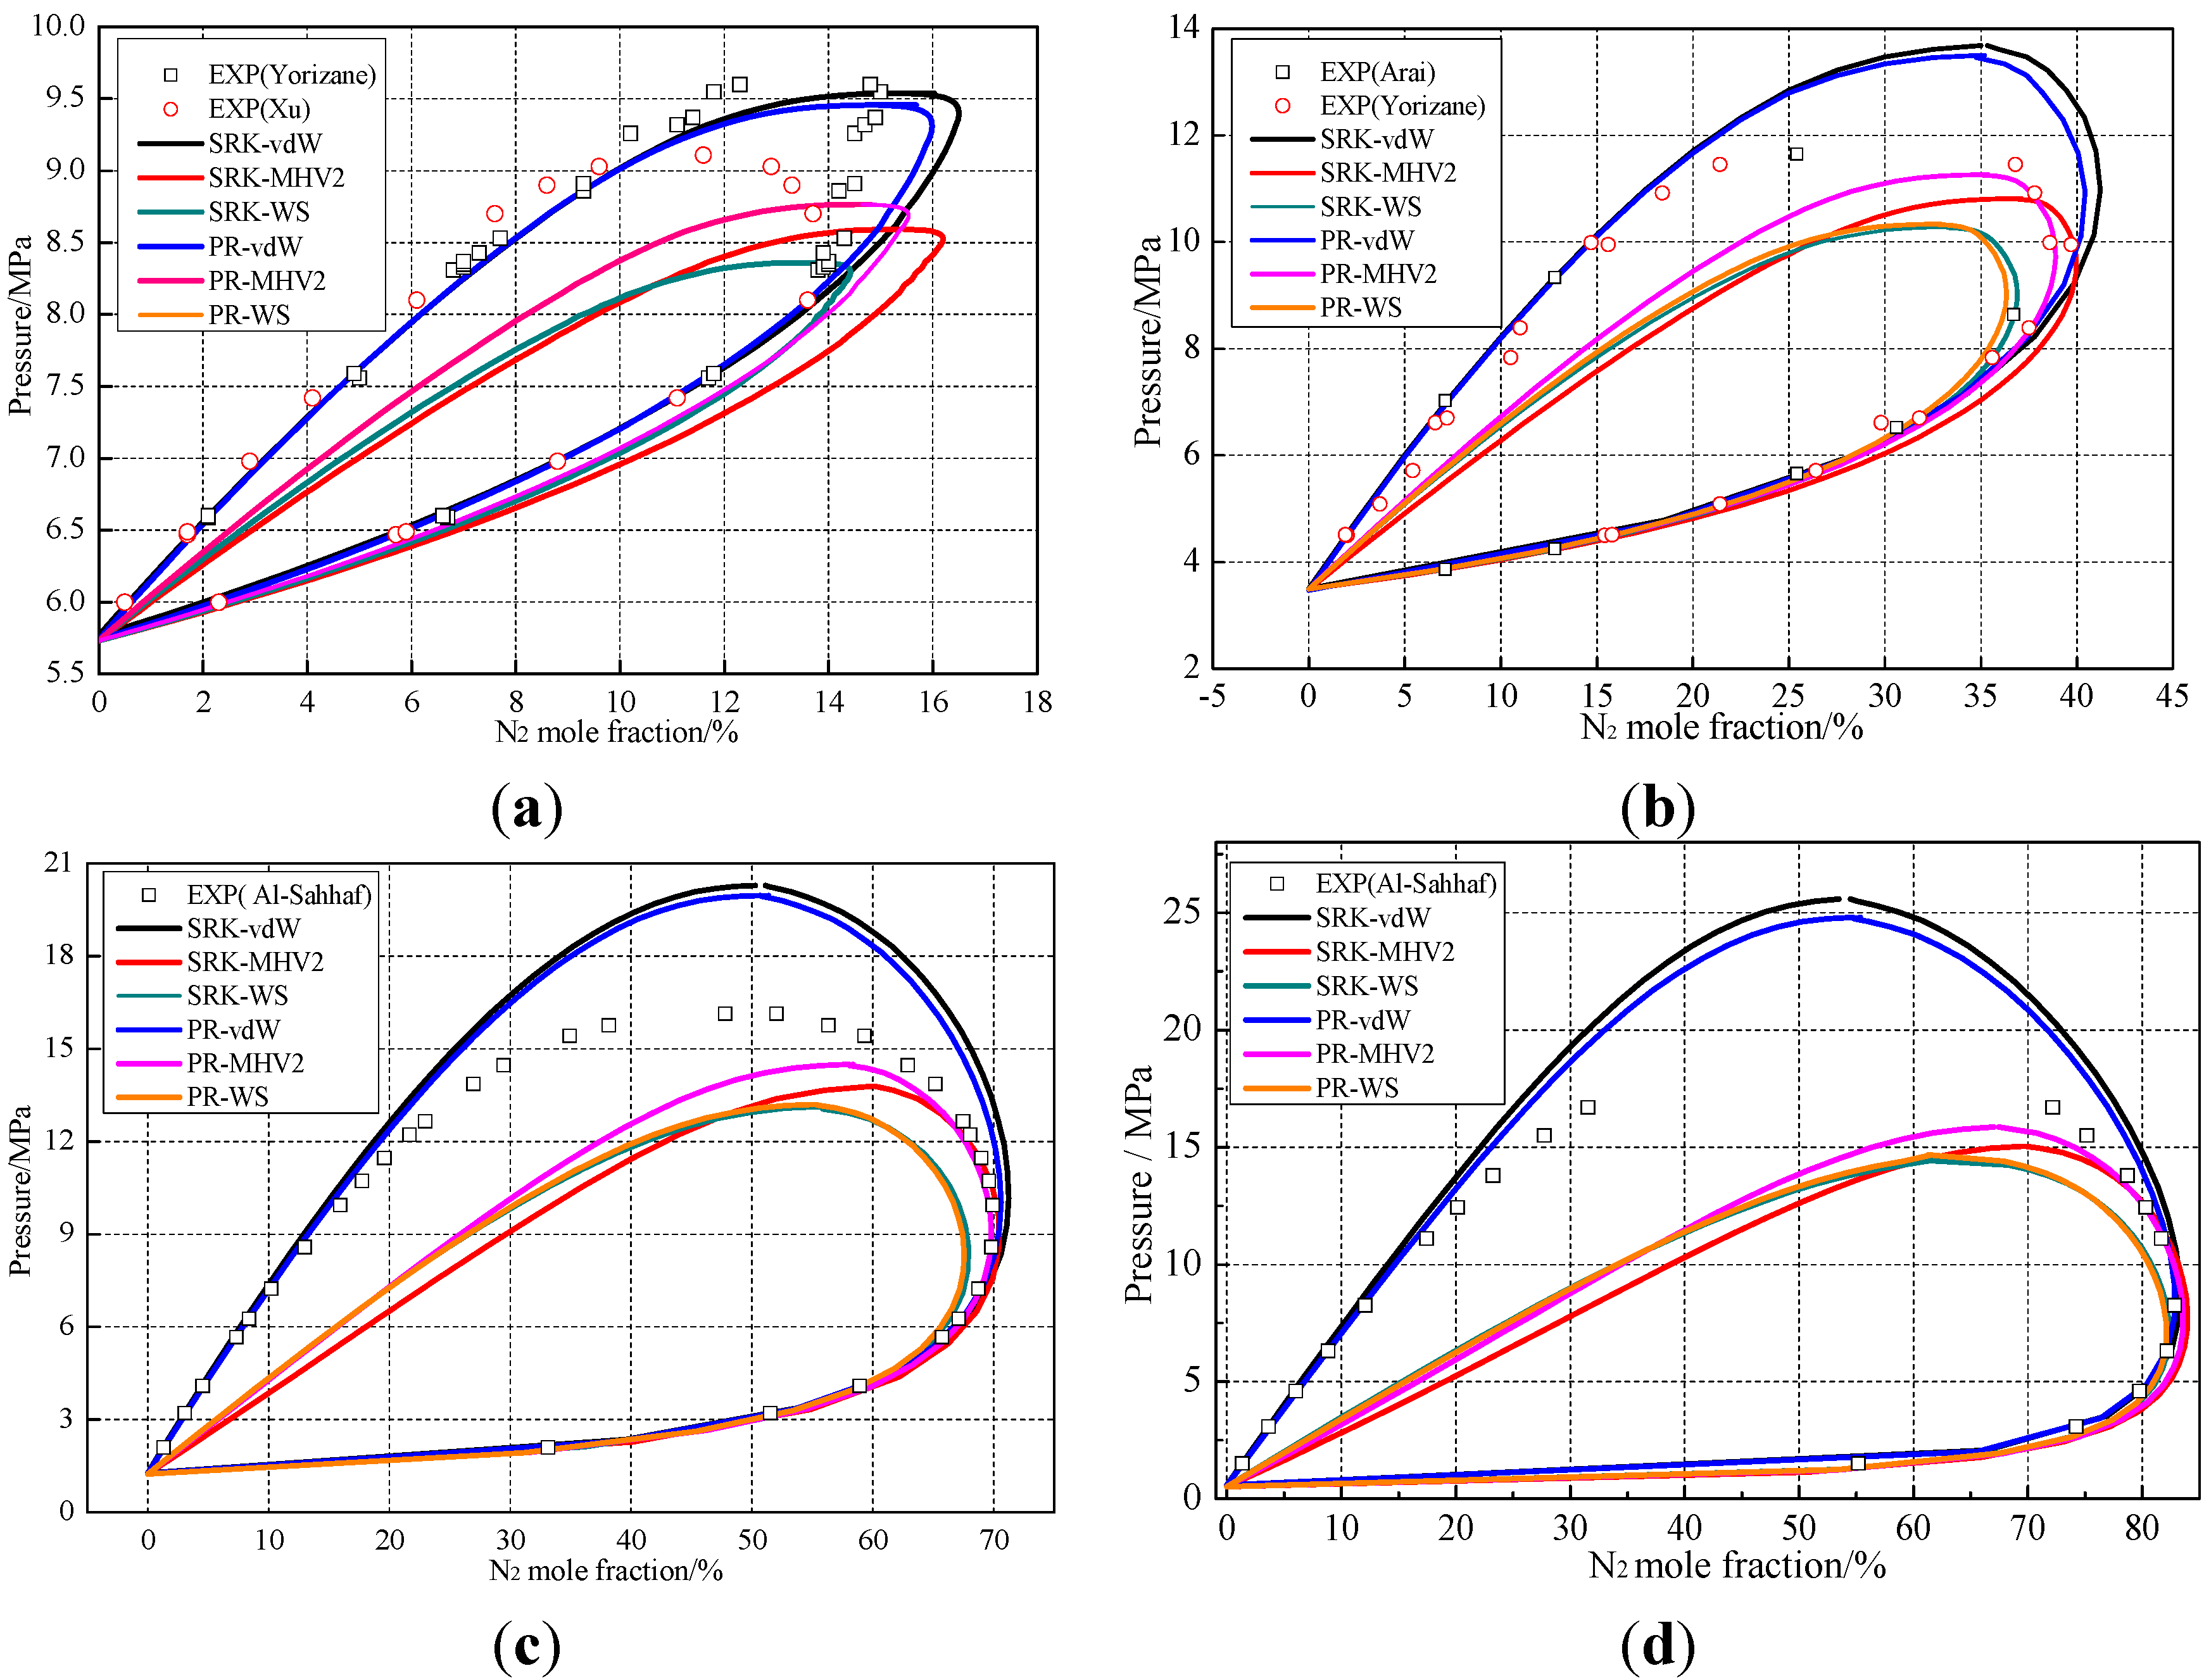
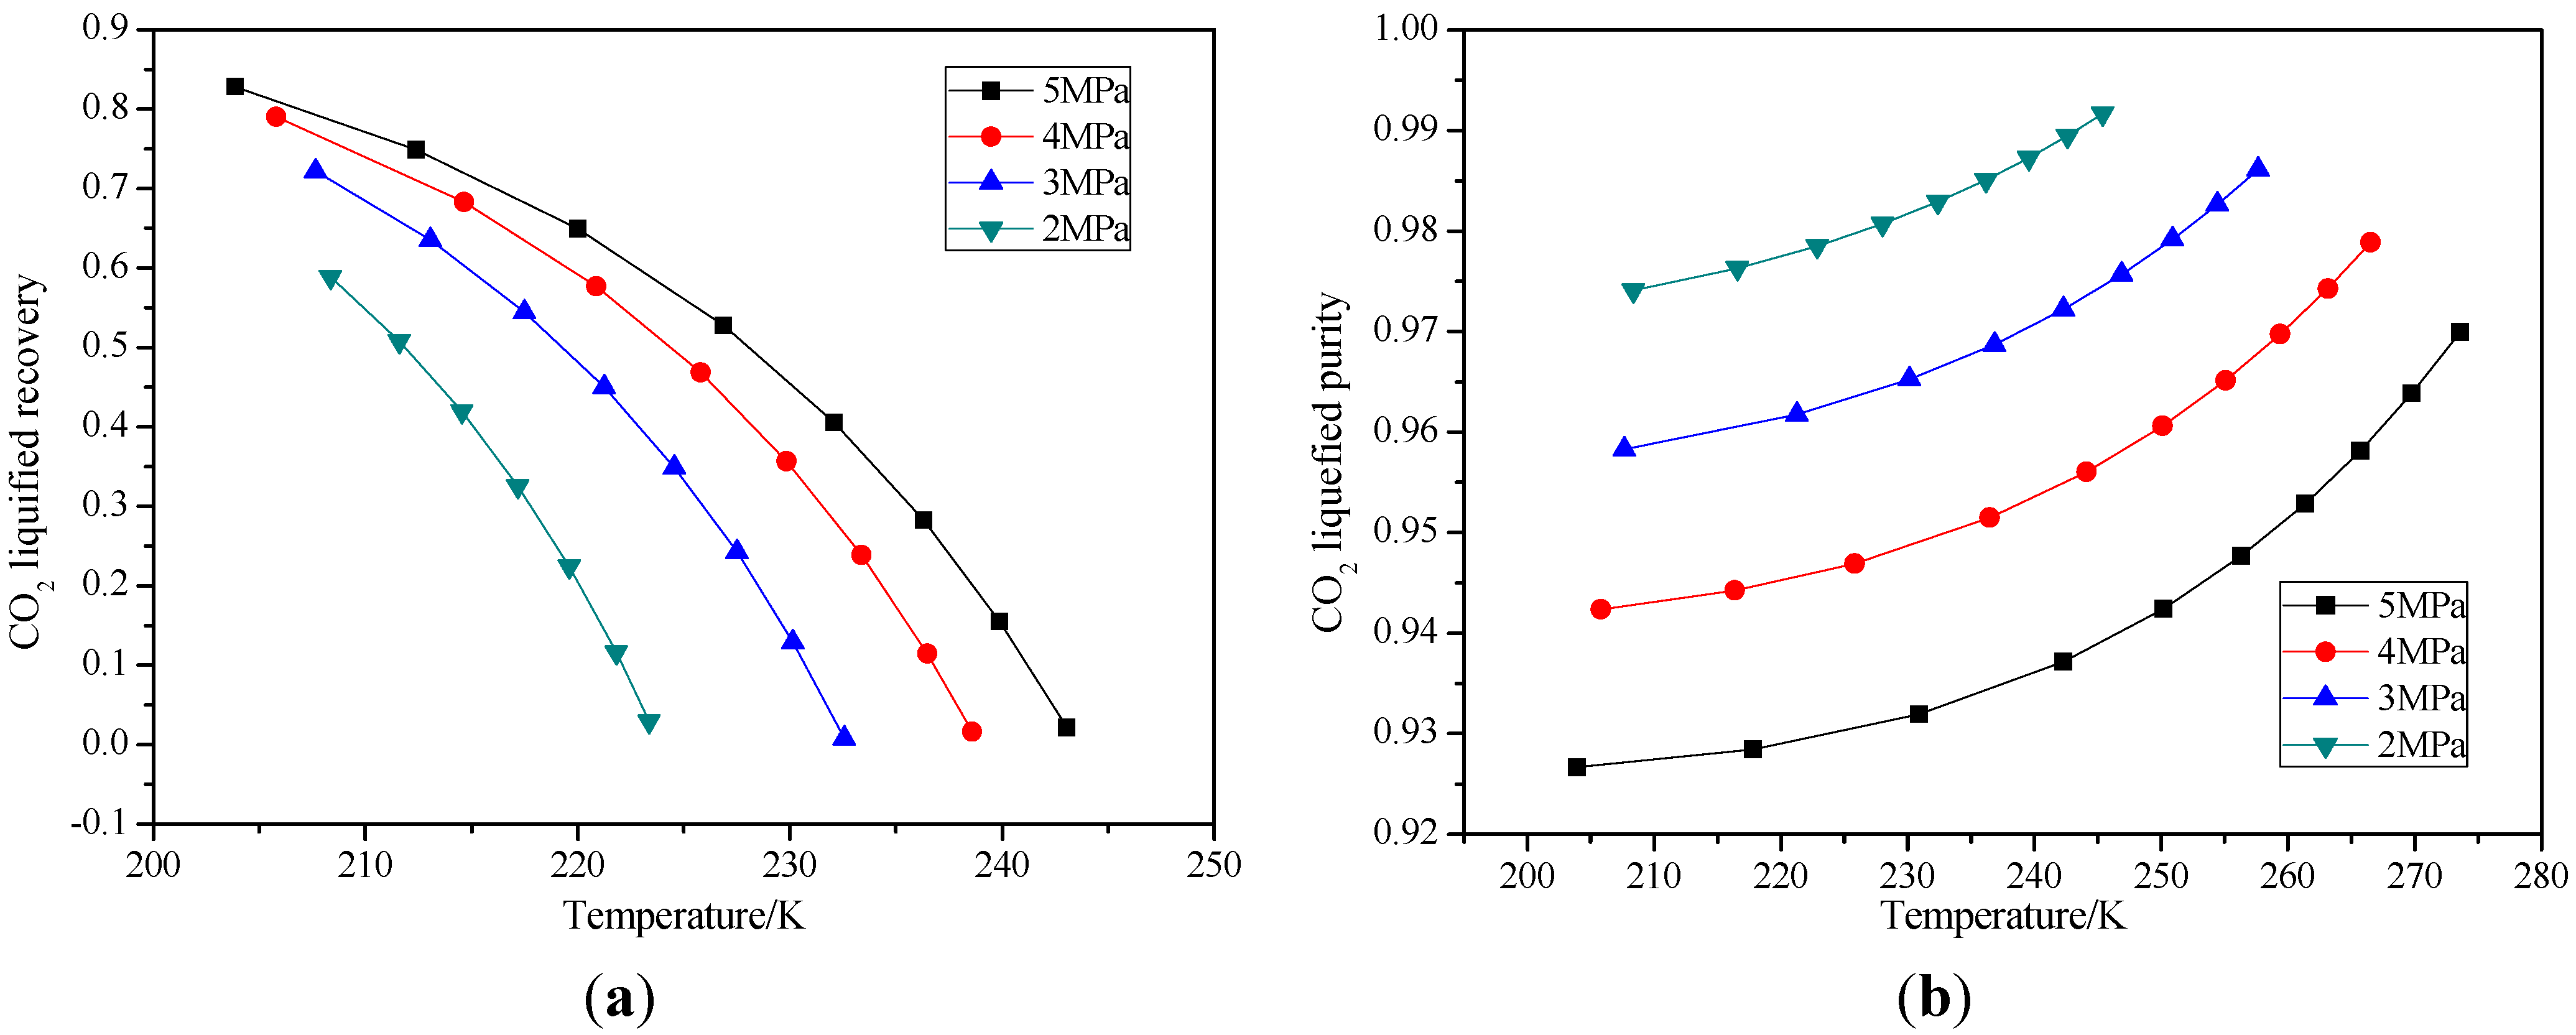
In this paper, the reliability of different cubic EOS combined with various mixing rules for the VLE properties of N2/CO2 mixture are evaluated. Based on the comparison with the collected experimental data, the most accurate model to conduct N2/CO2 phase equilibrium analysis at low temperature is identified. Additionally, the thermodynamic properties of N2/CO2 at low temperature are analyzed based on the selected calculation model. According to the results, a new liquefaction combined with desublimation system is proposed. Finally, the recovery and purity of CO2 and the energy consumption of the new system are analyzed.

2. Thermodynamic Models

2.1. Cubic Equations of State

The structure of cubic equations is simple, which makes them popular in engineering applications. The cubic equations used for N2/CO2 phase equilibrium calculations in this study are the Redlich-Kwong (RK) [17], the SRK [18] and the PR [19]. All studied EOS are summarized in Table 1.
RK EOS is the earliest modification of van der Waals EOS. Its precision of vapor phase property predictions is improved, but the temperature function is too simple, thus, the application scope is limited. SRK EOS is a modification of RK EOS by introducing a temperature-dependent function. It improves the accuracy of liquid phase properties prediction and its application range becomes wider, it is the first widely accepted cubic equation in the engineering field. PR EOS is modified on the basis of SRK EOS, which turns the hard sphere model from a cubic equation to a general form and analyzes the relationship between gravity and molecular density elaborately.
Table 1. Summary of studied equations of state (EOS) for N2/CO2. RK: Redlich-Kwong; SRK: Soave-Redlich-Kwong; and PR: Peng-Robinson.
EOSFunction formCoefficient
RK P = R T v b a T 0.5 v ( v + b ) a = 0.42748 R 2 T C 2.5 / P C
b = 0.08664 R T C / P C
SRK P = R T v b a v ( v + b ) a = 0.42748 R 2 T C 2 α ( T ) / P C
b = 0.08664 R T C / P C
α ( T ) = [ 1 + m ( 1 T R 0.5 ) ] 2 ,   T R = T / T C
m = 0.48 + 1.574 ω 0.176 ω 2
PR P = R T v b a v ( v + b ) + b ( v b ) a = 0.45724 R 2 T C 2 α ( T ) / P C
b = 0.07780 R T C / P C
α ( T ) = [ 1 + m ( 1 T R 0.5 ) ] 2 ,   T R = T / T C
m = 0.3746 + 1.5423 ω 0.2699 ω 2

2.2. Mixing Rules

Three mixing rules widely used in industry are included in this study: vdW, modified Huron-Vidal second-order model (MHV2) [20], and WS [21] mixing rules. These three mixing rules are summarized in Table 2.
Table 2. Summary of studied mixing rules. vdW: van der Waals; WS: Wong-Sandler; and MHV2: modified Huron-Vidal second-order model.
Mixing rulesab
vdW a = i j x i x j a i j ,   a i j = ( 1 k i j ) a i a j b = i x i b i
WS a = R T ( Σ i Σ j x i x j ( b ( a / R T ) ) i j ) ( Σ i x i ( a i / b i R T ) + ( G ex / C R T ) ) 1 ( Σ i x i ( a i / b i R T ) + ( G ex / C R T ) ) b = Σ i Σ j x i x j ( b ( a / R T ) ) i j 1 ( Σ i x i ( a i / b i R T ) + ( G ex / C R T ) )
MHV2 G m E ( p = 0 ) R T + i x i ln ( b i b ) = q ( a ) i x i q ( a i )
The vdW mixing rule is the simplest mixing rule, it can be applied for non-polar and weak polar substances, but it is not suitable for highly non-ideal systems. The MHV2 mixing rule could directly associate the parameters obtained from low-pressure phase equilibrium by the GE model; however, with the extrapolation model, the error will be larger. The WS mixing rule can be used for phase equilibrium calculation in high and low pressures, it has good extrapolation performance and is suitable for polar and non-polar system.

3. The New Liquefaction Combined with Desublimation System

The schematic of the liquefaction combined with desublimation CO2 capture process is shown in Figure 1. The whole capture process can be described as follows: firstly, the flue gas, mainly including N2/CO2, is compressed to a certain pressure, about 2–5 MPa, by the compressors; then the gas is cooled to a temperature slightly above the dew point of CO2 by cooling with water, low temperature effluent streams, and the liquid CO2 sequentially. After the pre-chilling step, the gas stream is introduced into the gas-liquid separator, the temperature of separator, which depends on various components, is in the range of 210–283 K. In this section, the CO2 in the flue gas is condensed into a liquid and then the residual gas (mainly as N2) is fed into the desublimation separation tower. The pressure of this unit is equal to gas-liquid separator, but the temperature is lower. In the desublimation separation tower, the CO2 in the mixture is frosted into dry ice, which is melted into a liquid by cooling the incoming gases. Additionally, the dry ice can provide cooling capacity for the low-temperature condensation of the cascade refrigerating machine and reduce the energy consumption. In this way, the CO2 is recovered from flue gas and finally changes into a liquid phase and a gaseous nitrogen stream. The liquid CO2, which is formed by dry ice melting and liquefaction, is compressed to about 10 MPa by a pump and is stored in the storage tank at a normal temperature (about 293 K).
Figure 1. Schematic diagram of liquefaction combined with desublimation CO2 capture process.
Energies 08 09495 g001

4. Method of Analysis

4.1. Thermo Model

From thermodynamics, a system of multiple components at a given temperature and pressure is in equilibrium when the fugacities of each component, in all phases, are equal. According to this principle, gas-liquid and gas-solid phase equilibrium calculations can be conducted [22].
In the phase equilibrium calculations, the EOS are usually rewritten into the form of the compressibility factor z. The i component’s fugacity coefficient derived by the RK and SRK EOS is as follows:
lnφ i = b i b ( z 1 ) ln ( z B ) A B ( 2 j x j a i j a b i b ) ln ( 1 + B z )
The i component’s fugacity coefficient derived by the PR equation of state is as follows:
φ i ( T , p , x i ) = exp [ b i b ( z 1 ) ln ( z B ) A 2.828 B × ( 2 j x j ( a i a j ) 0.5 ( 1 k i j ) a b i b ) × ln ( z + 2.414 B z 0.414 B ) ]
where z is the compressibility factor, z = PV/RT, z may have three real roots, assumption: z1 > z2 > z3; for gas, gas compressibility factor zV = z1; for liquid, liquid compressibility factor zL = z3, when there is only one real root, it is the required compression factor; A = ap/(R2T2); B = bp/RT; p represents the system pressure; and T represents the system temperature.

4.2. The Separation Performance

The separation performance of the cryogenic CO2 capture system can be expressed in two parameters: the CO2 purity and the CO2 recovery. The CO2 purity is the concentration of CO2 in the liquid production. The recovery is defined as the fraction of the total amount of CO2 in the feed that ends up in the liquid product. The recovery can be calculated by the vapor-liquid equilibrium and material balance equation at various initial conditions. An expression for the CO2 recovery of a binary gas mixture is given as:
ξ = ( z CO 2 y CO 2 ) × x CO 2 ( x CO 2 y CO 2 ) × z CO 2
where ξ denotes the CO2 recovery; x CO 2 , y CO 2 , and z CO 2 represent the mole fraction of CO2 in the liquid product, residual gas, and feed stream, respectively.

4.3. Energy Consumption

The energy consumption of the cryogenic CO2 capture system mainly includes compression and refrigeration. The whole energy consumption can be calculated by the following formula:
W = W 1 + W 2 W 3 W 4 + W 5
where W1 is the compression work; W2 is external work of refrigeration; W3 is expansion recovery work; W4 is refrigeration work, which is saved by recycling cooling capacity; and W5 is pump power.
The cooling capacity and heat transfer process can be analyzed by the way of the enthalpy difference. The calculation formula of enthalpy can be obtained by the PR EOS:
h = h 0 h r
h 0 = h 0 0 + T 0 T C p 0 d T
h r = a r + T s r + R T p v
where excess free energy, and excess entropy equations are as Equations (8) and (9) show:
a r = R ln v b v a 2 2 b ln v 0.414 b v + 2.414 b + R ln v v 0
s r = R ln v b v + β 2 2 b ln v 0.414 b v + 2.414 b R ln v v 0 s
where v0 is the specific volume of ideal gas; h0 and s0 are the specific enthalpy and entropy of ideal gas; p0 and T0 are the pressure and temperature of reference state; h00 is the specific enthalpy of reference state; and Cp0 is the specific heat of ideal gas.
The work consumption of unit CO2 separation and liquefaction can be calculated by the following formula:
W 0 = W / m
where W0 is work consumption of unit CO2 separation and liquefaction; and m is the whole mass of the obtained CO2.
Assuming the primary energy conversion rate is 30%, the primary energy consumption can be calculated by the Equation (11):
Q 0 = W 0 / η
where Q0 is energy consumption of unit CO2 separation and liquefaction; and η is the primary energy conversion rate, its value is 30%.

5. Result and Discussion

5.1. Selection and Calculation of the Equations of State

This section mainly discusses the accuracy of different EOS. Due to the fact that the classical vdW mixing rule is widely used to model gas processing systems, it is selected to eliminate the differences caused by the various mixing rules. The liquid N2 concentration is kept constant in the phase equilibrium calculations.
In Figure 2, the calculated results are compared with experimental data [23,24,25] at 273.2 K and 220 K. Along with the increment of pressure, the performance of all equations decreases. Comparatively, RK has the worst accuracy. It is clear that the calculated results of PR and SRK fit the experimental data well, and, comparatively, PR has a better accuracy. Therefore, further analysis should be carried out using PR or SRK EOS.
Figure 2. Comparison of p-x curves diagram of N2-CO2 system at different temperatures: (a) 273.2 K; and (b) 220 K.
Energies 08 09495 g002

5.2. Selection and Calculation of the Mixing Rules

Due to the fact that PR and SRK EOS have better accuracies, this section combines PR and SRK EOS with three kinds of mixing rules to predict VLE properties. The comparisons between calculated results and experimental data [23,24,25,26] at 293.2 K, 273.2 K, 240 K and 220 K are shown in Figure 3.
Figure 3. Comparison of varied mixing rules at different temperatures: (a) 293.2 K; (b) 273.2 K; (c) 240 K; and (d) 220 K.
Energies 08 09495 g003
Table 3 summarizes the average relative deviation between calculated results and experimental data on Ps and the N2 vapor fraction of N2/CO2.
Table 3. Average relative deviation between calculated results and experimental data (%).
Models293.2 K273.2 K240 K220 K
PsVapor fractionPsVapor fractionPsVapor fractionPsVapor fraction
SRK-vdW0.925.543.836.958.882.388.450.84
SRK-MHV29.939.0917.6015.2239.1015.5555.7813.17
SRK-WS9.429.0715.0913.3033.6411.2247.419.52
PR-vdW1.373.462.695.157.371.436.310.43
PR-MHV27.116.4912.7411.3332.9912.7650.7411.51
PR-WS8.7610.2814.4313.8833.6011.3148.119.76
It can be seen that the same equation of state, combining different mixing rules, could lead to different results. The performances of models are normally getting worse as the conditions are approaching the critical points of the mixtures.
Comparatively, PR and SRK EOS, combined with the vdW mixing rule, have better performances. The average deviations on Ps or the N2 vapor fraction are within 9%. In general, PR EOS combined with the vdW mixing rule is more accurate than the other models, where the maximum deviation is 7.37% in the calculations on Ps. With a temperature decrease, the accuracy of the model (PR EOS combined with the vdW mixing rule) improving, the deviation of N2 vapor fraction is 0.43% at 220 K.
Therefore, in this paper, we select PR EOS, combined with the vdW mixing rule, to analyze the new cryogenic CO2 capture system. In addition, we assume the dry ice as a pure CO2 solid phase. The gas-solid phase equilibrium calculation focuses on the gas phase, thus, we also use the selected model to calculate gas-solid phase equilibrium [22].

5.3. Thermodynamic Properties of N2/CO2 at Low Temperature

Recent work indicates that a combination of oxy-fuel and post-combustion strategies can produce a CO2-rich flue gas stream that can be passed through a cryogenic separation process to capture CO2 [27,28]. Zanganeh et al. [29] proposed an approach that allows air to be partially used in oxy-fired coal power plants, the concentration of CO2 in flue gas is about 30%–90%. In this paper, 40% CO2 concentration is selected as an example to analyze the new liquefaction, combined with desublimation system. After the CO2 is separated from flue gas, the product is compressed to pipeline pressure (typically 10 MPa). Generally, increasing the condensing pressure will allow the CO2 to condense at higher temperatures. However, the higher pressures would quite severely constrain suitable materials of construction, thus, 2–5 MPa is preferable to separate CO2.
The bubble point, dew point, and desublimation temperature of the N2/CO2 binary system are calculated by PR EOS combined with the vdW mixing rule. In the case of 2 MPa, the calculated results are presented in Figure 4.
When the temperature is dropped to the dew point, CO2 is firstly condensed to a liquid phase. However, when the concentration of CO2 is reduced to 21.7%, the dew point temperature is equal to the desublimation temperature. Along with a decreasing of CO2 mole fraction, the desublimation temperature is higher than the dew point temperature, thus, the CO2 will not form a liquid phase at any temperature at 2 MPa. Rather, the CO2 desublimation forms an essentially pure solid phase rather than a liquid solution.
Figure 4. T-x curves of N2/CO2 binary system at a pressure of 2 MPa.
Energies 08 09495 g004
Figure 5 indicates the influences of temperature and pressure on the recovery and purity of CO2 liquefied in the case of a 40% CO2 initial concentration. From the results, it can be concluded that the recovery of liquid CO2 decreases and purity increases with the increase of temperature. With an increase of pressure, CO2 liquefied recovery increases while the purity decreases. Thus, it is difficult to achieve a high recovery and purity simultaneously by liquefaction. However, desublimation separation is too energy-intensive to apply alone. In this paper, the liquefaction and desublimation process are combined together to avoid the energy penalty and to achieve high recovery and purity.
Figure 5. (a) Recovery of liquid CO2 at different conditions; and (b) purity of liquid CO2 at different conditions.
Energies 08 09495 g005
In the studied case, the total flow rate for the flue gas is 143.33 kg/s and initial CO2 concentration is 40%. A total of 58.89% of CO2 can be separated by liquefaction at 2 MPa when the temperature is 208.37 K. The residual CO2 can be captured by the desublimation separation tower. The total CO2 recovery of the studied system can reach 90% when the desublimation capture temperature is 192.02 K.
According to the results above, a new liquefaction combined with a desublimation system is proposed, as shown in Figure 1. Table 4 shows the parameters of key state points in the studied system. In the process, a three-stage compression with intercooling is used to avoid high exhaust temperatures and decrease the compression work. In order to improve the efficiency of the expansion and avoid dry ice formed through the expansion process, two stages of expansion are conducted in the process.
Table 4. The parameters of key state point.
No.CO2 mole fraction (%)T (K)P (MPa)
140298.150.1
240298.152
340223.852
421.69208.372
56.31192.022
66.31170.170.1
797.41208.372
898.29211.952
998.29293.1510

5.4. The Results of Energy Calculations

The energy consumptions of each part are listed in Table 5.
Table 5. Energy consumptions for CO2 separation system.
ParametersValueDimension
Compression work44,036.9kW
Expansion work10,715.9kW
Cold consumption by liquefaction16,139.01kW
Power consumption by liquefaction15,979.22kW
Cold consumption by desublimation13,841.99kW
Power consumption by desublimation17,814.66kW
Save power from cold energy recovery6171.31kW
Pump work604.92kW
Total work61,548.5kW
Unit power consumption0.9326MJ·kg−1
Unit energy consumption3.108MJ·kg−1
The calculated results show that the total energy required by the system to capture the CO2 is about 3.108 MJ/kgCO2. In order to compare the energy consumptions of various capture processes, three separation methods are analyzed in the case of an initial 40% CO2 concentration, which include desublimation, liquefaction combined with desublimation, and liquefaction. The results are listed in Table 6.
When the liquefaction separation is applied alone, the biggest liquefied recovery of CO2 is 85.44% with a purity 90.44% at 6 MPa. The energy consumption is lower than other methods, but the total recovery and purity of CO2 production are not satisfactory enough for engineering applications. When the desublimation method is used alone, the dry ice can be regarded as a pure CO2 solid, thus, pure CO2 liquid will be produced after melting. The CO2 could freeze at a lower pressure while the total recovery and purity of CO2 are high enough. However, the process is energy-intensive. As for the new method, which combines liquefaction with desublimation, the calculated results indicate clear advantages for this system. The total recovery and purity of CO2 are highly favorable. In addition, the new process appears to be at least 9% lower than desublimation separation.
Table 6. Energy consumption comparisons of three separation methods.
Separation methodsPressure (MPa)Liquefied recovery (%)Liquid CO2 purity (%)Solid CO2 recovery (%)Total recovery (%)Energy consumption (MJ·kg−1)
Desublimation0.55010090903.416
Liquefaction combined desublimation258.8997.4131.11903.108
Liquefaction combined desublimation373.0495.8216.96903.162
Liquefaction combined desublimation479.2794.2310.73903.193
Liquefaction separation685.4490.44085.44-

6. Conclusions

(1) For N2/CO2 phase equilibrium calculations, the calculated results of PR and SRK fit the experimental data well, PR EOS combined with the vdW mixing rule is more accurate than the other models. With temperature decrease, the accuracy of the selected model improves and the deviation of the N2 vapor fraction is 0.43% at 220 K.
(2) It is difficult to achieve a high recovery and purity simultaneously by liquefaction.
(3) The total recovery and purity of CO2 production of the new method, which is combined with liquefaction and desublimation, are satisfactory. Additionally, the total energy required by the new system to capture the CO2 is about 3.108 MJ·kg−1 CO2, which appears to be at least 9% lower than desublimation separation when the initial concentration of CO2 is 40%.

Acknowledgments

This study was jointly funded by the 12th Five Year National Science and Technology Support Key Project of China (Nos. 2011BAJ03B05 and 2014BAJ01B0503), Foundation for Combination of Industry and Scientific Research of Jiangsu Province (No. BY2015070-14) and Six Talent Peaks Project in Jiangsu Province (No. 2013-JNHB-014).

Author Contributions

Wenchao Yang and Shuhong Li designed the research; Wenchao Yang, Xianliang Li and Shuhong Li performed the research; Wenchao Yang, Shuhong Li, Yuanyuan Liang and Xiaosong Zhang wrote the paper. All authors read and approved the final manuscript.

Conflicts of Interest

The authors declare no conflict of interest.

References

  1. Minchener, A.J.; McMullan, J.T. Sustainable clean coal power generation within a European context-the view in 2006. Fuel 2007, 86, 2124–2133. [Google Scholar] [CrossRef]
  2. Song, C.F.; Kitamura, Y.; Li, S.H.; Jiang, W.Z. Analysis of CO2 frost formation properties in cryogenic capture process. Int. J. Greenh. Gas Control 2013, 13, 26–33. [Google Scholar] [CrossRef] [Green Version]
  3. Kelley, B.T.; Valencia, J.A.; Northrop, P.S. Controlled Freeze Zone (TM) for developing sour gas reserves. Energy Procedia 2011, 4, 824–829. [Google Scholar] [CrossRef]
  4. Theunissen, T.; Golombok, M.; Brouwers, J.J.H.; Bansal, G.; Benthum, R. Liquid CO2 droplet extraction from gases. Energy 2011, 36, 2961–2967. [Google Scholar] [CrossRef]
  5. Zanganeh, K.E.; Shafeen, A.; Salvador, C. CO2 Capture and Development of an Advanced PilotScale Cryogenic Separation and Compression Unit. Energy Procedia 2009, 1, 247–252. [Google Scholar] [CrossRef]
  6. Li, H.; Yan, J. Evaluating cubic equations of state for calculation of vapor-liquid equilibrium of CO2 and CO2-mixtures for CO2 capture and storage processes. Appl. Energy 2009, 86, 826–836. [Google Scholar] [CrossRef]
  7. Clodic, D.; Younes, M. A new method for CO2 capture: Frosting CO2 at atmospheric pressure. In Proceedings of the 6th International Conference on Greenhouse Gas Control Technologies, Kyoto, Japan, 1–4 October 2002; pp. 155–160.
  8. Li, H.; Jakobsen, J.P.; Wilhelmsen, Ø.; Yan, J. PVTxy properties of CO2 mixtures relevant for CO2 capture, transport and storage: Review of available experimental data and theoretical models. Appl. Energy 2011, 88, 3567–3579. [Google Scholar] [CrossRef]
  9. Vrabec, J.; Kedia, G.K.; Buchhauser, U.; Meyer-Pittroff, R.; Hasse, H. Thermodynamic models for vapor-liquid equilibria of nitrogen + oxygen + carbon dioxide at low temperatures. Cryogenics 2009, 49, 72–79. [Google Scholar] [CrossRef]
  10. Dorau, W.; Al-Wakeel, I.M.; Knapp, H. VLE data for CO2-CF2Cl2, N2-CO2, N2-CF2Cl2 and N2-CO2-CF2Cl. Cryogenics 1983, 23, 29–35. [Google Scholar] [CrossRef]
  11. Thiery, R.; Vidal, J.; Dubessy, J. Phase equilibria modelling applied to fluid inclusions: Liquid-vapor equilibria and calculation of the molar volume in the CO2-CH4-N2 system. Geochim. Cosmochim. Acta 1994, 58, 1073–1082. [Google Scholar] [CrossRef]
  12. Duan, Z.; Hu, J. A new cubic equation of state and its applications to the modeling of vapor-liquid equilibria and volumetric properties of natural fluids. Geochim. Cosmochim. Acta 2004, 68, 2997–3009. [Google Scholar] [CrossRef]
  13. Li, H.; Yan, J. Impacts of equations of state (EOS) and impurities on the volume calculation of CO2 mixtures in the applications of CO2 capture and storage (CCS) processes. Appl. Energy 2009, 86, 2760–2770. [Google Scholar] [CrossRef]
  14. Ahmad, M.; Gernert, J.; Wilbers, E. Effect of impurities in captured CO2 on liquid-vapor equilibrium. Fluid Phase Equilibria 2013, 363, 149–155. [Google Scholar] [CrossRef]
  15. Raabe, G.; Köhler, J. Phase equilibria in the system nitrogen-ethane and their prediction using cubic equations of state with different types of mixing rules. Fluid Phase Equilibria 2004, 222, 3–9. [Google Scholar] [CrossRef]
  16. Faúndez, C.A.; Valderrama, J.O. Modeling associating hydrocarbon + alcohol mixtures using the Peng-Robinson equation of state and the Wong-Sandler mixing rules. Comptes Rendus Chim. 2013, 16, 135–143. [Google Scholar] [CrossRef]
  17. Redlich, O.; Kwong, J.N.S. On the thermodynamics of solutions. V. An equation of state. Fugacities of gaseous solutions. Chem. Rev. 1949, 44, 233–244. [Google Scholar] [CrossRef] [PubMed]
  18. Soave, G. Equilibrium constants from a modified Redlich-Kwong equation of state. Chem. Eng. Sci. 1972, 27, 1197–1203. [Google Scholar] [CrossRef]
  19. Peng, D.Y.; Robinson, D.B. A new two-constant equation of state. Ind. Eng. Chem. Fundam. 1976, 15, 59–64. [Google Scholar] [CrossRef]
  20. Huron, M.J.; Vidal, J. New mixing rules in simple equations of state for representing vapour-liquid equilibria of strongly non-ideal mixtures. Fluid Phase Equilibria 1979, 3, 255–271. [Google Scholar] [CrossRef]
  21. Lee, M.T.; Lin, S.T. Prediction of mixture vapor-liquid equilibrium from the combined use of Peng-Robinson equation of state and COSMO-SAC activity coefficient model through the Wong-Sandler mixing rule. Fluid Phase Equilibria 2007, 254, 28–34. [Google Scholar] [CrossRef]
  22. Eggeman, T.; Chafin, S. Pitfalls of CO2 freezing prediction. In Proceedings of the 82nd Annual Convention of the Gas Processors Association, San Antonio, TX, USA, 10–12 March 2003.
  23. Yorizane, M.; Yoshimura, S.; Masuoka, H.; Miyano, Y.; Kakimoto, Y. New procedure for vapor-liquid equilibria. Nitrogen + Carbon dioxide, Methane + Freon22, and Methane + Freon12. J. Chem. Eng. Data 1985, 30, 174–176. [Google Scholar] [CrossRef]
  24. Al-Sahhaf, T.A.; Kidnay, A.J.; Sloan, E.D. Liquid + vapor equilibria in the N2 + CO2 + CH4 system. Ind. Eng. Chem. Fundam. 1983, 22, 372–380. [Google Scholar] [CrossRef]
  25. Arai, Y.; Kaminishi, G.I.; Saito, S. The experimental determination of the PVTX relations for the carbon dioxide-nitrogen and the carbon dioxide-methane systems. J. Chem. Eng. Jpn. 1971, 4, 113–122. [Google Scholar] [CrossRef]
  26. Xu, N.; Dong, J.; Wang, Y.; Shi, J. High pressure vapor-liquid equilibria at 293 K for systems containing nitrogen, methane and carbon dioxide. Fluid Phase Equilibria 1992, 81, 175–186. [Google Scholar] [CrossRef]
  27. Favre, E.; Bounanceur, R.; Roizard, D. A hybrid process combining oxygen enriched air combustion and membrane separation for post-combustion carbon dioxide capture. Sep. Purif. Technol. 2009, 68, 30–36. [Google Scholar] [CrossRef]
  28. Zanganeh, K.E.; Shafeen, A. A novel process integration, optimization and design approach for large-scale implementation of oxy-fired coal power plants with CO2 capture. Int. J. Greenh. Gas Control 2007, 1, 47–54. [Google Scholar] [CrossRef]
  29. Zanganeh, K.; Shafeen, A.; Salvador, C.; Beigzadeh, A.; Abbassi, M. CO2 processing and multi-pollutant control for oxy-fuel combustion systems using an advanced CO2 capture and compression unit (CO2CCU). Energy Procedia 2011, 4, 1018–1025. [Google Scholar] [CrossRef]

