1. Introduction
With oil resources dwindling and the detrimental effects of burning traditional fuel on the environment, new energy vehicles have become an important research direction for the vehicle industry. Because electrical energy is easily obtained and stored, it was possible to rapidly develop both pure electric vehicles (EVs) and the hybrid electric vehicles (HEVs). Both EVs and HEVs need energy storage systems that store and supply electrical energy. The performance of the electrical energy storage components becomes a key factor in constructing EVs and HEVs.
Vehicles require electrical energy storage systems with high specific power, high energy density and a long cycle life. Due to the characteristics of high specific energy density, batteries have been widely used in EVs and HEVs [
1]. However, the large current impact of battery cycle life is still a difficult problem that remains to be resolved [
2]. Although ultracapacitors (UCs) have higher specific power and longer cycle life, their specific energy is much lower than that of batteries [
3]. Thus, researchers have combined batteries and UCs together in hybrid energy storage systems (HESSs), which provide an easy and feasible approach for avoiding the disadvantages of single energy storage elements [
4,
5,
6,
7,
8,
9,
10].
One main research problem related to HESSs is distributing the power between different energy storage components. Several power management strategies have been proposed for HESSs. In [
11,
12], the model predictive controller (MPC) for a hybrid battery-UC power source was proposed. Two bi-directional dc/dc converters were used to connect the battery bank and UC bank to the vehicle DC bus, which increases the cost, weight and volume associated with the HESS. Moreover, MPC depends on the exact mathematical model of the HESS, which is hard to obtain in most cases.
Different fuzzy logic strategies for HESS are proposed in [
13,
14,
15]. Fuzzy logic is suitable for nonlinear systems, and the battery model for the HESS has strongly nonlinear characteristics. Fuzzy logic strategies do not use an exact mathematical model and are easy to implement on hardware. Because fuzzy logic strategies are based on rules, they are strongly robust. Therefore, fuzzy logic is a good choice for use in HESS power management strategies. In the literature, the inputs of fuzzy logic strategies are power demand, state of charge (SOC) of the battery bank and voltage/SOC of the UC bank, which all provide current information on the vehicle and HESS.
In this paper, a fuzzy logic power management strategy based on Markov random prediction of HESS is proposed. By introducing the predictive electrical demand of the vehicle, the power of the HESS is distributed more reasonably. The remainder of this paper is organized as follows.
Section 2 provides a general description of the structure of HESS and Electro-mechanical Transmission (EMT) used in this paper, and in
Section 3, a simulation study of battery-only ESS and HESS with a logic threshold power management strategy is performed. In
Section 4, a fuzzy logic power management strategy based on Markov random prediction is proposed. The simulation results of the HESS with the proposed strategy, in comparison with the simulation results of battery-only ESS and HESS with a fuzzy logic strategy, demonstrate the applicability and superiority of the proposed power management strategy. To confirm the feasibility of the proposed power management strategy, two sets of experiments are performed in
Section 5. Finally, conclusions are provided in
Section 6.
4. A Fuzzy-Logic Power Management Strategy Based on Markov Random Prediction
In the existing literature, most of the power distribution strategies use the previous and present information of the vehicle and HESS. Even if the strategies ensure the rationality of the power allocation at the current time, it could happen that the power demand is not satisfied in the following period. Because the UC bank has limited storage capacity, it is important for the HESS power distribution strategy that the UC bank can supply enough energy when the vehicle needs high-power electricity.
In this paper, a fuzzy logic power management strategy based on Markov random prediction is proposed. While the vehicle is running, the driving power demand is expressed through the pedals. The electrical driving power demand at the next moment is only relevant to the current vehicle speed and the current driving power, and therefore, the electric power of the vehicles can be modelled as a Markov random process.
Figure 14 clearly shows the structure frame of the proposed power distribution strategy. The proposed strategy contains two main parts: the state transition probability matrices and the fuzzy logic controller. The inputs of the proposed strategy include current vehicle speed
v, the current electrical power demand
P and the current voltage of the UC bank
VUC. The output is the proportion of the battery power of the total electrical power demand
Pbatt.
Figure 14.
The structure of the proposed power distribution strategy for HESS.
Figure 14.
The structure of the proposed power distribution strategy for HESS.
Based on the driving cycle statistics, the state transition probabilities for the electric power can be obtained for different vehicle speeds. The electrical power demand at the next moment P* can be predicted by the current vehicle speed v and electrical power demand P through the state transition probability matrix. Then, the prediction is regarded as one of the inputs of the fuzzy logic controller, wherethe power for the hybrid energy storage system is assigned.
4.1. The State Transition Probability Matrices
In brief, Markov property can be expressed as that the next state of a system is only depended on the current state but independent of its earlier states. Markov process describes a random system with Markov property. Markov process with discrete time and states is Markov chain. Markov chain has two elements, the states and transfer probability. Equation (6) presents one time step transfer probability from state
Ei at current time t to state
Ej at next time t + 1. If the random system includes the states
E = {
E1,E2,……,
En}, the one-time step transfer probabilitymatrix from
Ei to
Ej can be expressed as Equation (7):
In this paper, both the vehicle speed
v and the electrical power
P are chosen as the states.
P and
v are discretized to two sets of states:
The state transition probability
Pimj refers to the probability of electric power demand
Pej at time
when the vehicle velocity is
and electric power demand is
Pej at the current moment k:
where,
i,
j = 1,2,…,n;
m = 1,2,…,q, and
.
For each vehicle speed discrete point , there is a transfer probability matrix, so we can get q transfer probability matrices totally.
The data on the vehicle speed and electric power demand are required to be discrete. The discrete results of the electrical power demand are shown in
Figure 15 in steps of 10 kW, and the discrete results of the vehicle speed are shown in
Figure 16 in steps of 5 km/h.
Figure 15.
The discrete results of electrical power.
Figure 15.
The discrete results of electrical power.
Figure 16.
The discrete results of vehicle speed.
Figure 16.
The discrete results of vehicle speed.
Figure 17 shows the state transition probability matrix for electric power demand for the speed of 55 km/h. Each discrete vehicle speed has a state transition probability matrix similar to that shown in
Figure 17. These matrices are stored in the controller and will be called when the controller distributes the HESS power.
Figure 17.
The state transition probability matrix for electric power demand for a 55 km/h vehicle speed.
Figure 17.
The state transition probability matrix for electric power demand for a 55 km/h vehicle speed.
The corresponding state transition probability matrix can be found for the current speed and electrical power demand, and the electrical power demand and its probability can be obtained from the matrix. Based on the probability-weight method, the predicted electrical power demand is defined in Equation (9):
where,
is the electrical power demand at the next moment and
is the probability of
.
4.2. Design of the Fuzzy Logic Power Management Strategy
Fuzzy logic can be applied to a complex system for which it is difficult to build an accurate model. Fuzzy logic has strong adaptability to nonlinear systems and good robustness. The structure of a fuzzy logic controller is simple and easy to implement. In the proposed power distribution strategy, the predicted electrical power demand
P*, the current electrical power demand
P and the voltage of UC bank
VUC are the inputs for the fuzzy logic, and the output is the proportion of the battery power in the total electrical power demand
Pbatt. According to the signs of
P* and
P, the power distribution strategy is divided into four modes as shown in
Figure 18. Each mode has an associated fuzzy logic. When
P* and
P are positive, the hybrid energy storage system outputs electric power to the bus. When
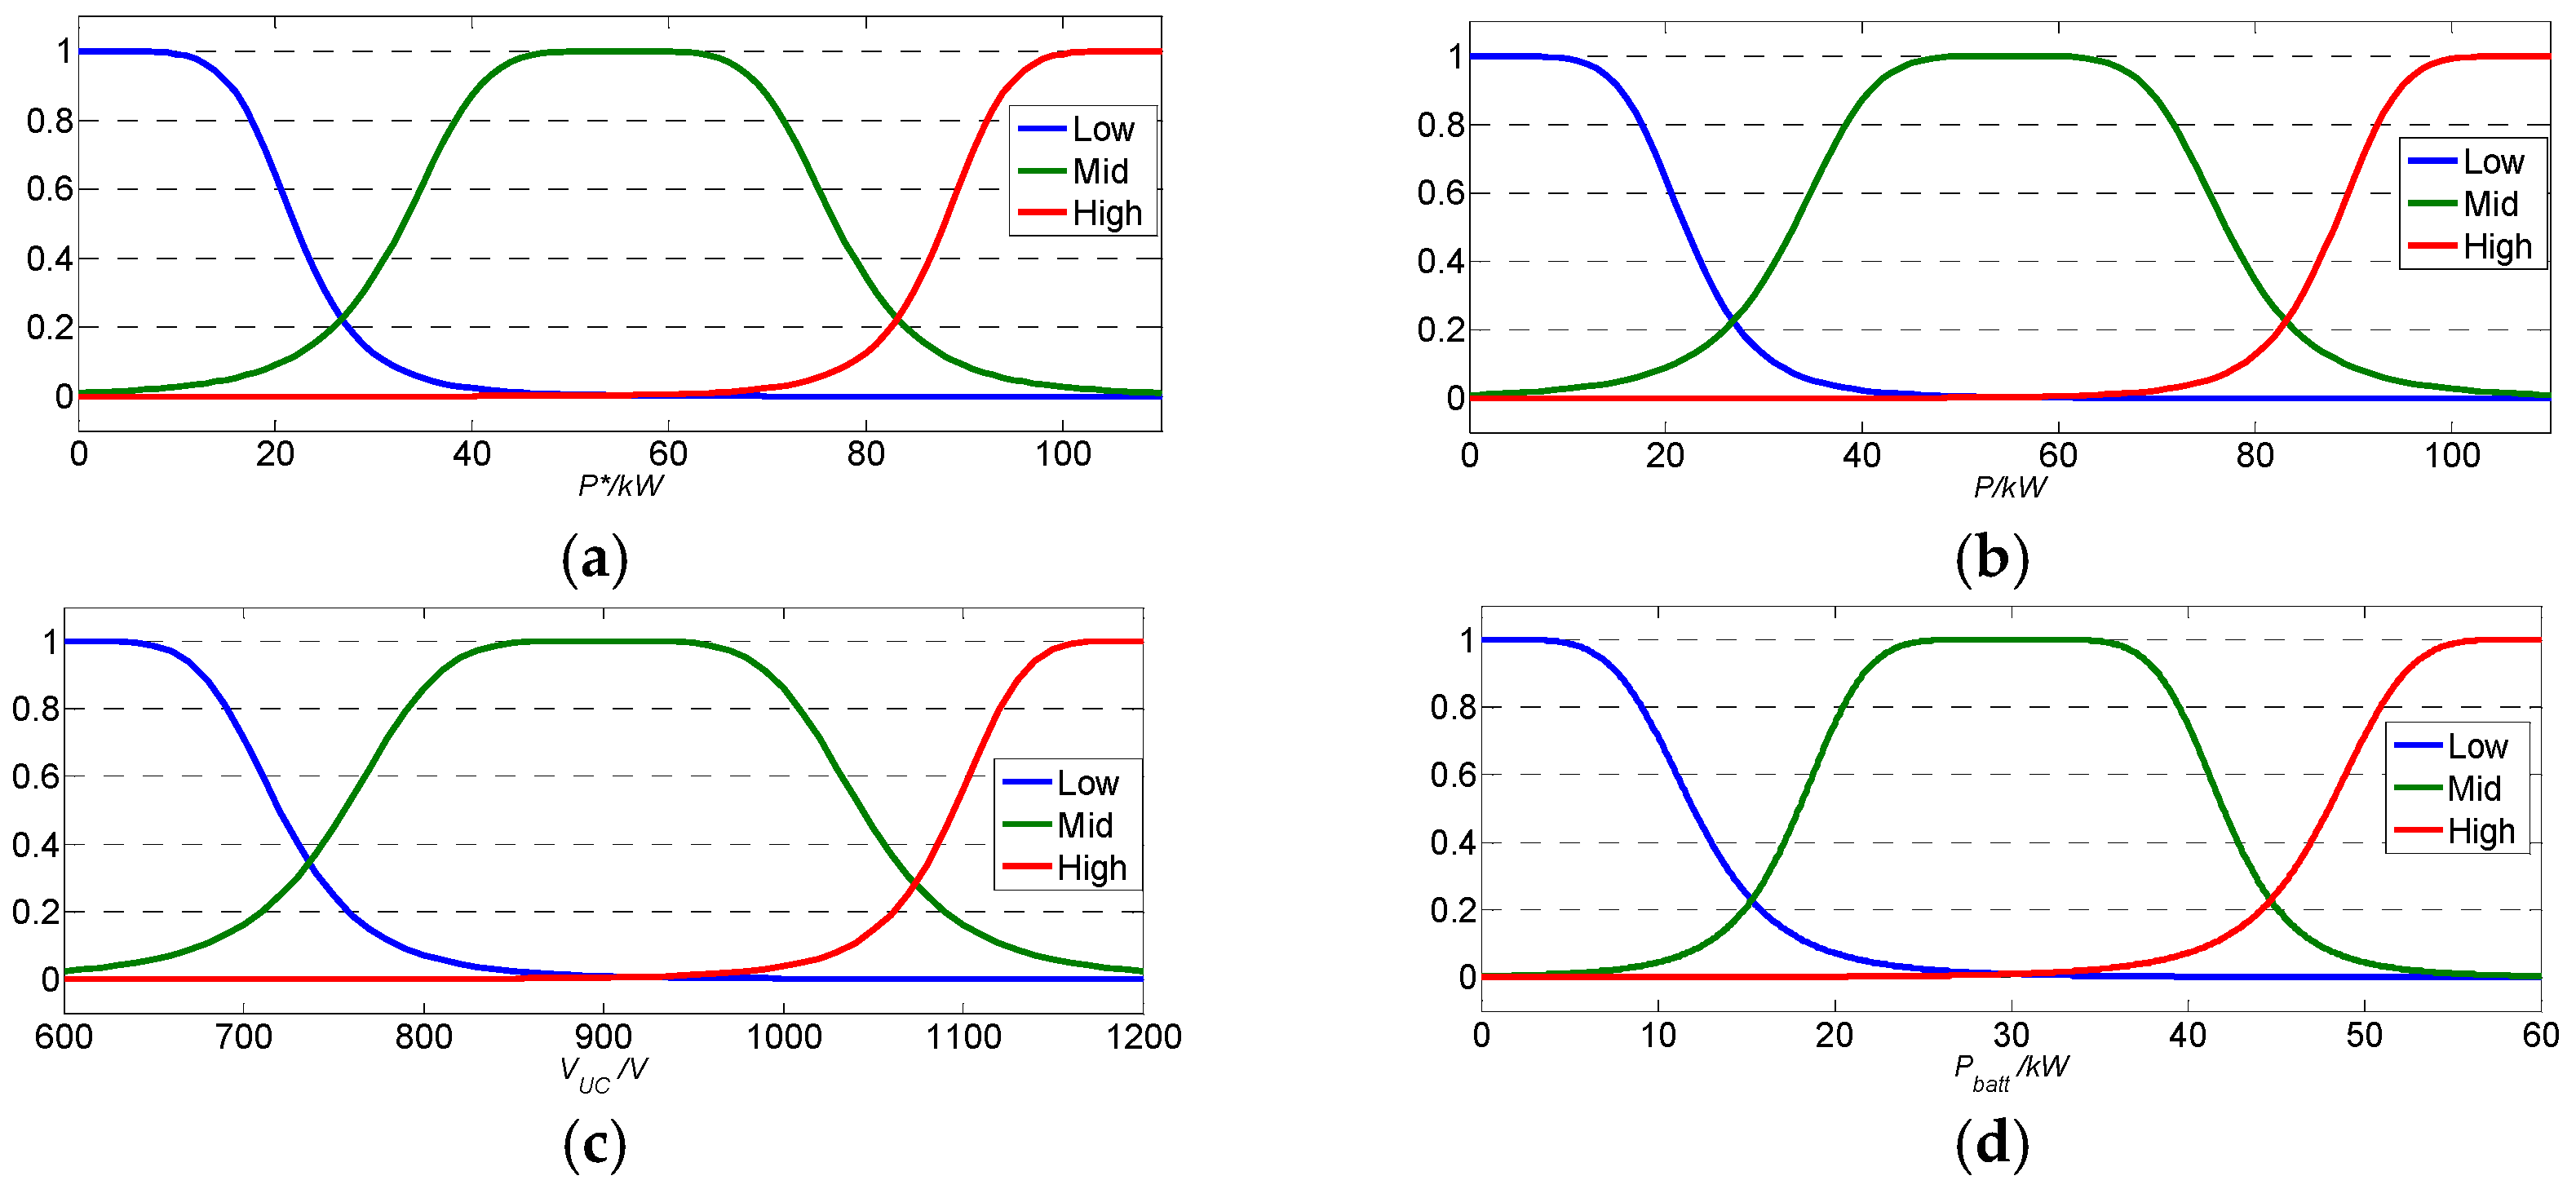
P* and P are negative, the hybrid energy storage system absorbs the electrical energy. The fuzzy logic input and output membership functions are shown in
Figure 19.
Figure 18.
Four modes of the proposed strategy.
Figure 18.
Four modes of the proposed strategy.
Figure 19.
Input and output membership functions. (a) P*; (b) P; (c) VUC; (d) Pbatt.
Figure 19.
Input and output membership functions. (a) P*; (b) P; (c) VUC; (d) Pbatt.
The fuzzy logic rules are set following the principles below:
(1) In mode I, the hybrid energy storage system outputs the electrical power at both the current and next moments. If the voltage of the UC bank is relatively high, the UC bank provides more electric power to the load. If the voltage of the UC bank is relatively low, the UC bank provides less electrical power to the bus. The relationship between the inputs and output of the controller in mode I is shown in
Figure 20.
Figure 20.
The relationship between the input and output of mode I.
Figure 20.
The relationship between the input and output of mode I.
(2) In mode II, the HESS outputs electrical power at the next moment, while it absorbs electrical power at current moment. If the voltage of the UC bank is relatively high, the UC bank should decrease its power recovery to maintain the voltage within a rational range. If the predicted output power of the next moment is relatively high, the UC bank should hold the voltage relatively high in order to supply sufficient electrical power. The relationship between the inputs and output of the controller in mode II is shown in
Figure 21.
Figure 21.
The relationship between the input and output of mode II.
Figure 21.
The relationship between the input and output of mode II.
(3) In mode III, the HESS absorbs electrical power at the next moment, while it outputs electrical power at the current moment. If the voltage of the UC bank is relatively high, the UC bank should provide more power at the current moment to enable recovery of the electrical energy. The relationship between the inputs and output of the controller in mode III is shown in
Figure 22.
Figure 22.
The relationship between the input and output of mode III.
Figure 22.
The relationship between the input and output of mode III.
(4) In mode IV, HESS recovers the electrical power at both the current and the next moments. If the voltage of the UC bank is relatively high, the battery bank should recover more power to reduce the voltage of the UC bank. If the recovery power of the next moment is relatively high, the UC bank should decrease the current recycling power to enable greater energy recovery at the next moment. The relationship between the inputs and output of the controller in mode IV is shown in
Figure 23.
Figure 23.
The relationship between the input and output of mode IV.
Figure 23.
The relationship between the input and output of mode IV.
4.3. Simulation Results
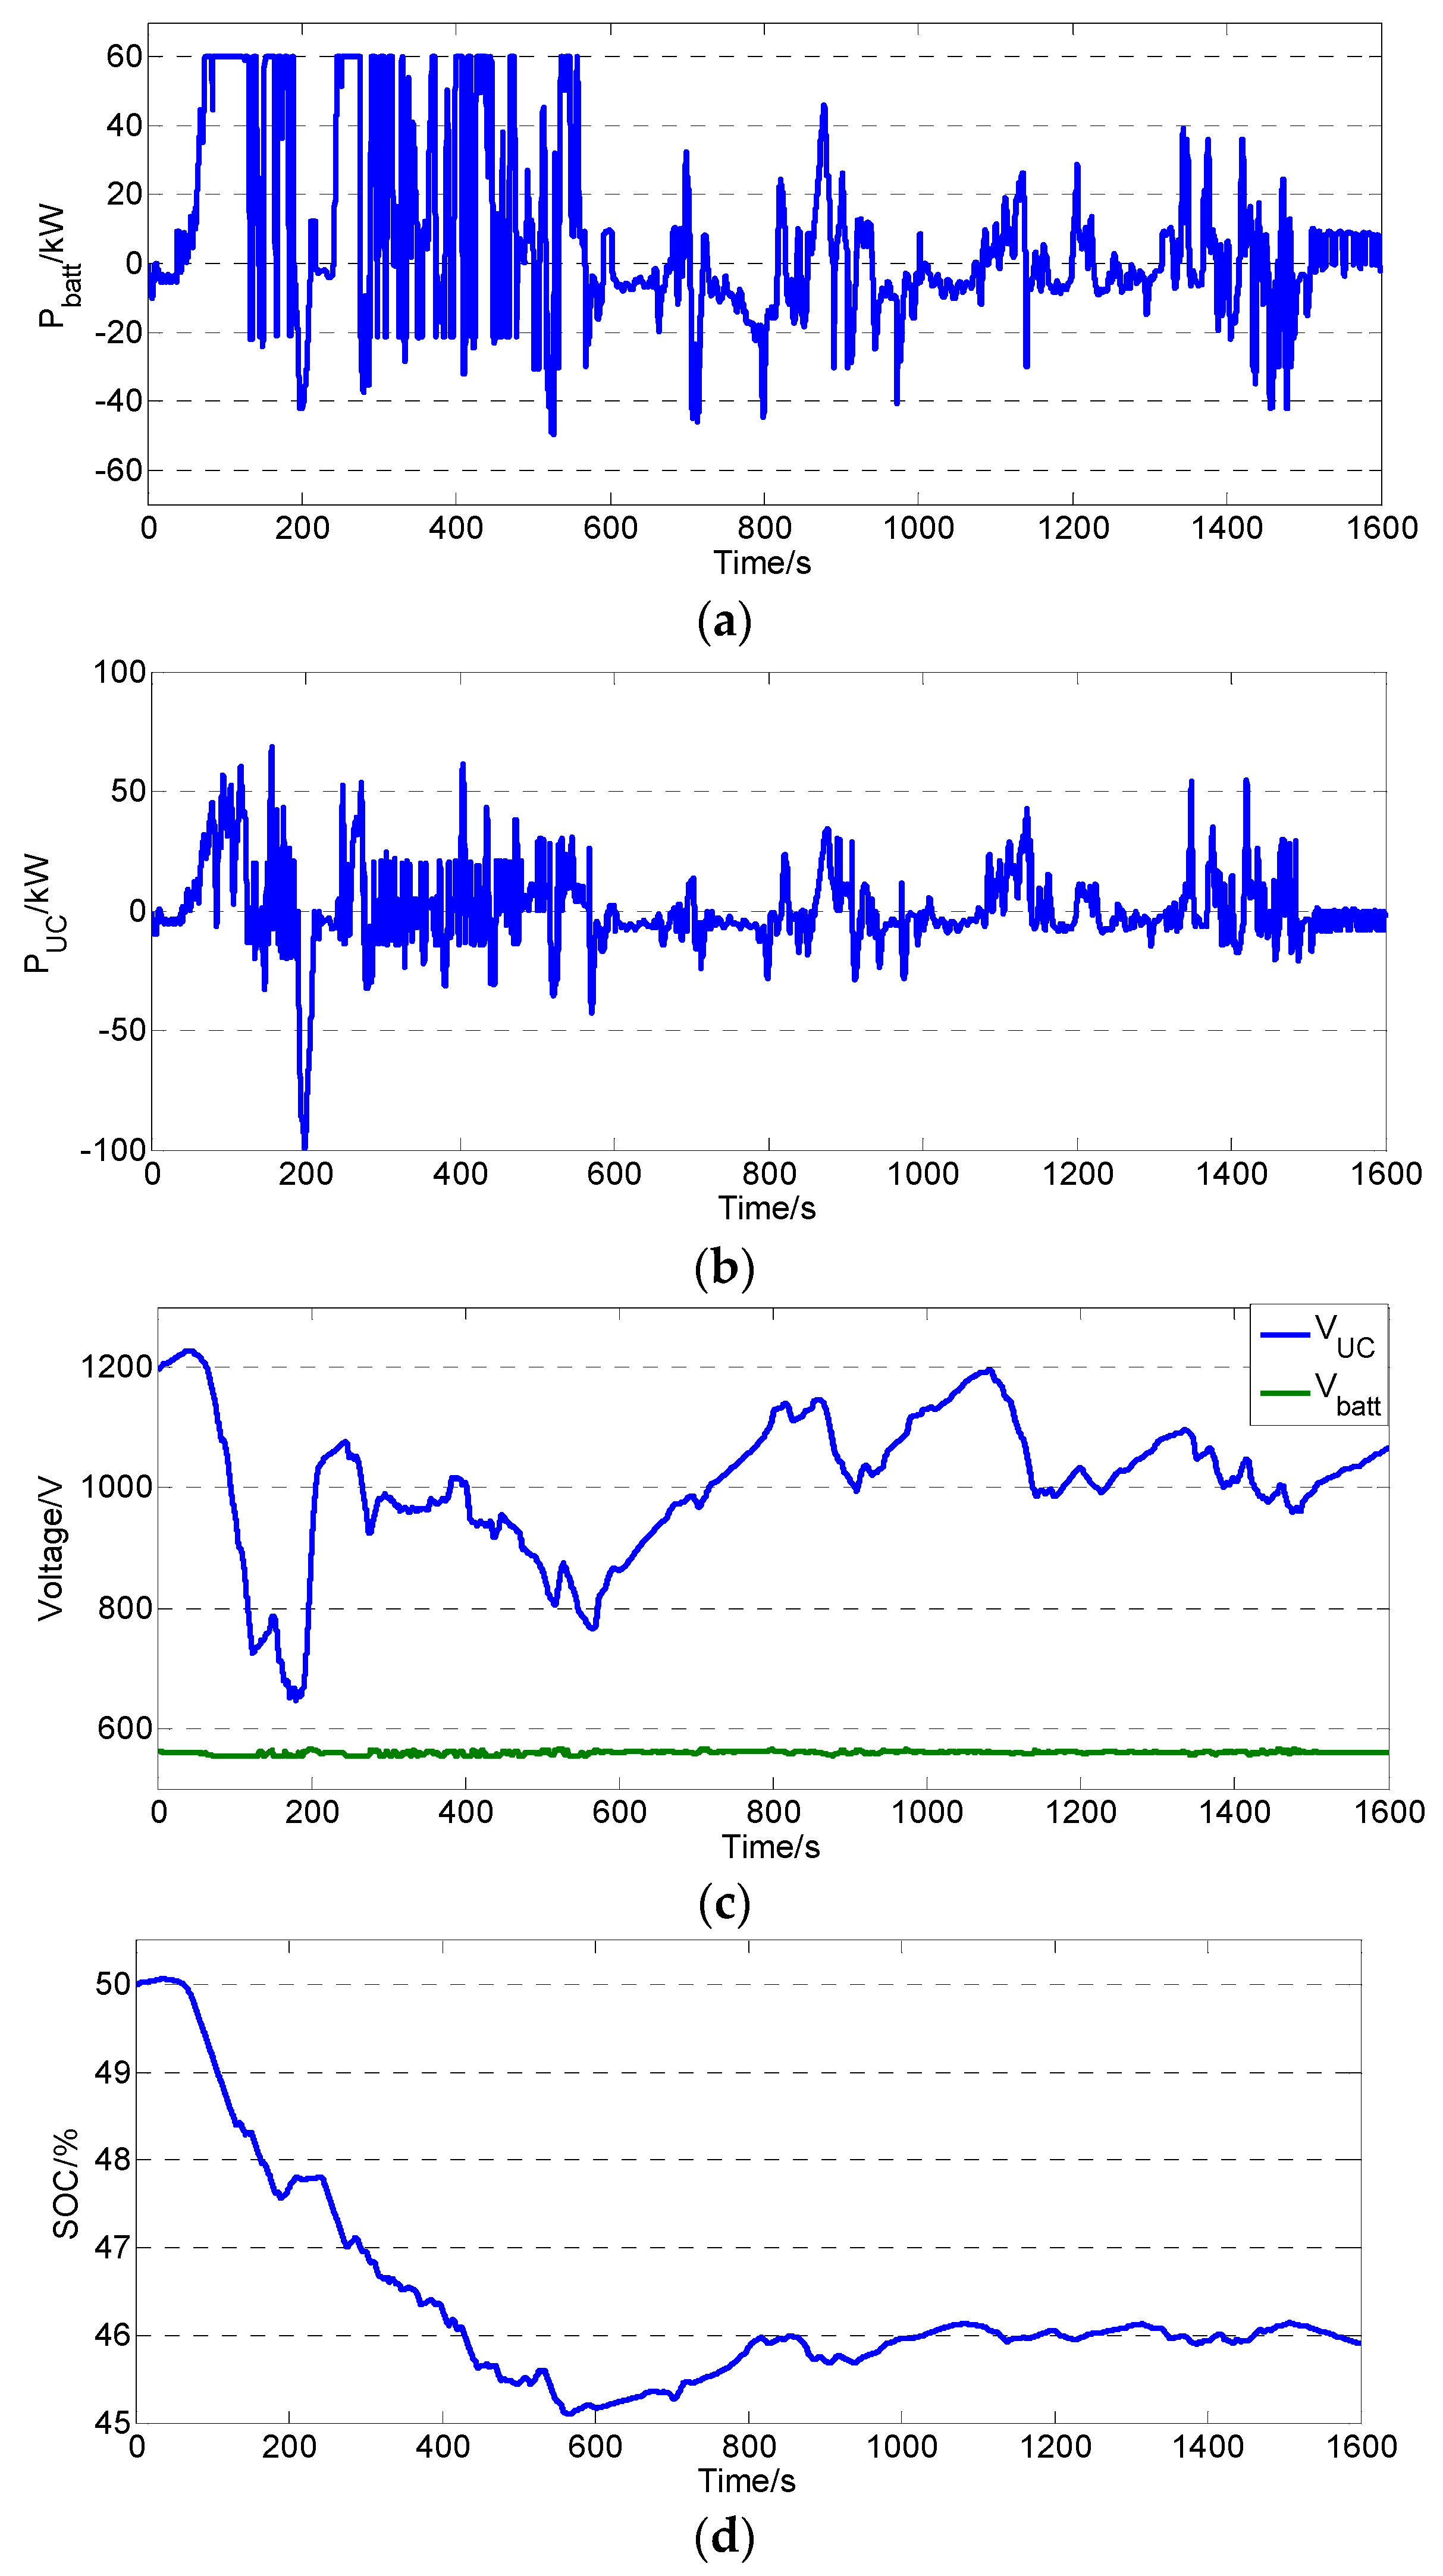
Simulations are performed to verify the feasibility of the power management strategy proposed in this paper. The electrical power under the heavy-duty vehicle driving cycles shown in
Figure 11 is allocated based on the proposed strategy. The simulation results are shown in
Figure 24.
Figure 24.
Simulation results of the proposed power management strategy: (a) Power of the battery bank; (b) Power of the UC bank; (c) Voltage of the battery bank and UC bank; (d) SOC of the battery bank.
Figure 24.
Simulation results of the proposed power management strategy: (a) Power of the battery bank; (b) Power of the UC bank; (c) Voltage of the battery bank and UC bank; (d) SOC of the battery bank.
Table 5.
Performance comparison of the battery-only ESS and HESS with different power management strategies.
Table 5.
Performance comparison of the battery-only ESS and HESS with different power management strategies.
| | Battery-Only ESS | HESS |
|---|
| Logic Threshold Strategy | Fuzzy-Logic Strategy Based on Markov Random Prediction |
|---|
| Loss/kJ | 465.54 | 338.29 | 292.5746 |
| Average charge/discharge rate of battery bank/C | 0.3745 | 0.3146 | 0.2617 |
| Peak power of battery bank/kW | 141.27 | 60 | 60 |
Table 5 shows that for battery-only ESS, the values of the loss, average charge/discharge rate and the peak power are larger than those for HESS. After applying HESS, the peak power of the battery is restricted within the threshold. Compared with the logic threshold power management strategy, the proposed power management strategy can effectively reduce the loss of HESS and the average charge/discharge rate of battery bank, which is reduced by approximately 20%.
5. Experiments and Results
In order to validate the proposed power management strategy for HESS, a small-scale experimental platform was built and is shown in
Figure 25. The main components of the experimental platform are listed in
Table 6.
Figure 25.
HESS test platform.
Figure 25.
HESS test platform.
Table 6.
Equipment used in the test platform.
Table 6.
Equipment used in the test platform.
| | Item | Manufacturer/Model Number |
|---|
| A | Battery bank | 20 Ah Li-ion Battery ×2 |
| B | UC bank | Maxwell, 48 V, 110F |
| C | Bi-directional dc/dc converter | Low voltage terminal: 0–10 V; High voltage terminal: 20–50 V; Power: 2 kW |
| D | dSPACE | MicroAutoBox |
| E | Battery Testing Equipment | 0–10 V, 2 kW |
| F | PC1 | Controls the battery testing equipment |
| G | PC2 | Controls the dSPACE |
dSPACE is used as the real-time controller on the platform. The model of the proposed strategy built in MATLAB/Simulink is loaded into dSPACE through PC2.
The battery test equipment is used as the load of the HESS. The input/output power of the battery test equipment is controlled in real time by PC1 through the RS232 bus. The battery bank is composed of two 20 Ah cells in series. The maximum voltage of the battery bank is 7.2 V, while the minimum voltage is 5.2 V. The highest voltage of the UC bank is 48 V, while the minimum voltage is 24 V.
The bi-directional dc/dc converter is connected to dSPACE via CAN bus. The dSPACE controls the value and direction of the electric power flowing through the dc/dc converter and also receives the voltage and current signal from the dc/dc convertor. The ControlDesk software monitors the experimental results.
The inputs of the proposed strategy are the vehicle speed, voltage of the UC bank and the current electric power, and the output is the proportion of the battery bank power in the total electrical power. In this section, two sets of experiments are performed under different voltage conditions of the UC bank to validate the proposed strategy. In the first experiment, the voltage of the UC bank is higher than 40 V, and it is used to simulate a real voltage of 1000 V of the UC bank. In another experiment, the voltage of the UC bank is lower than 35 V, and it is used to simulate a real voltage of 600 V of the UC bank.
Two sets of experiments with different UC bank voltages are performed under the same experimental conditions, shown in
Figure 26. During the period of 0~120 s, the HESS discharges to the load. The speed of the vehicle is 40 km/h during 0~60 s and then changes to 80 km/h from 60 s to 120 s. From 0 s to 30 s, the load power is 25 kW; from 30 s to 90 s, the load power is 90 kW; and from 90 s to 120 s, the load power is 25 kW.
Figure 26.
The experimental conditions of the HESS test.
Figure 26.
The experimental conditions of the HESS test.
During 120 s ~ 180 s, the HESS remains in a static state, and both the vehicle speed and load power are 0 in value. From 180 s to 300 s, the HESS absorbs electrical power from the load. Before 240 s, the vehicle speed is 40 km/hand then becomes 80 km/h. From 180 s to 210 s, the load power is 25 kW; from 210 s to 270 s, the load power is 90 s; and from 270 s to 300 s, the load power is 25 kW. On the experimental platform, the load power is shrunk by a factor of 200. This means that when the load power is 25 kW in the simulation, the load power on the experimental platform is 125 W; when the load power is 90 kW in the simulation, the load power on the experimental platform is 450 W.
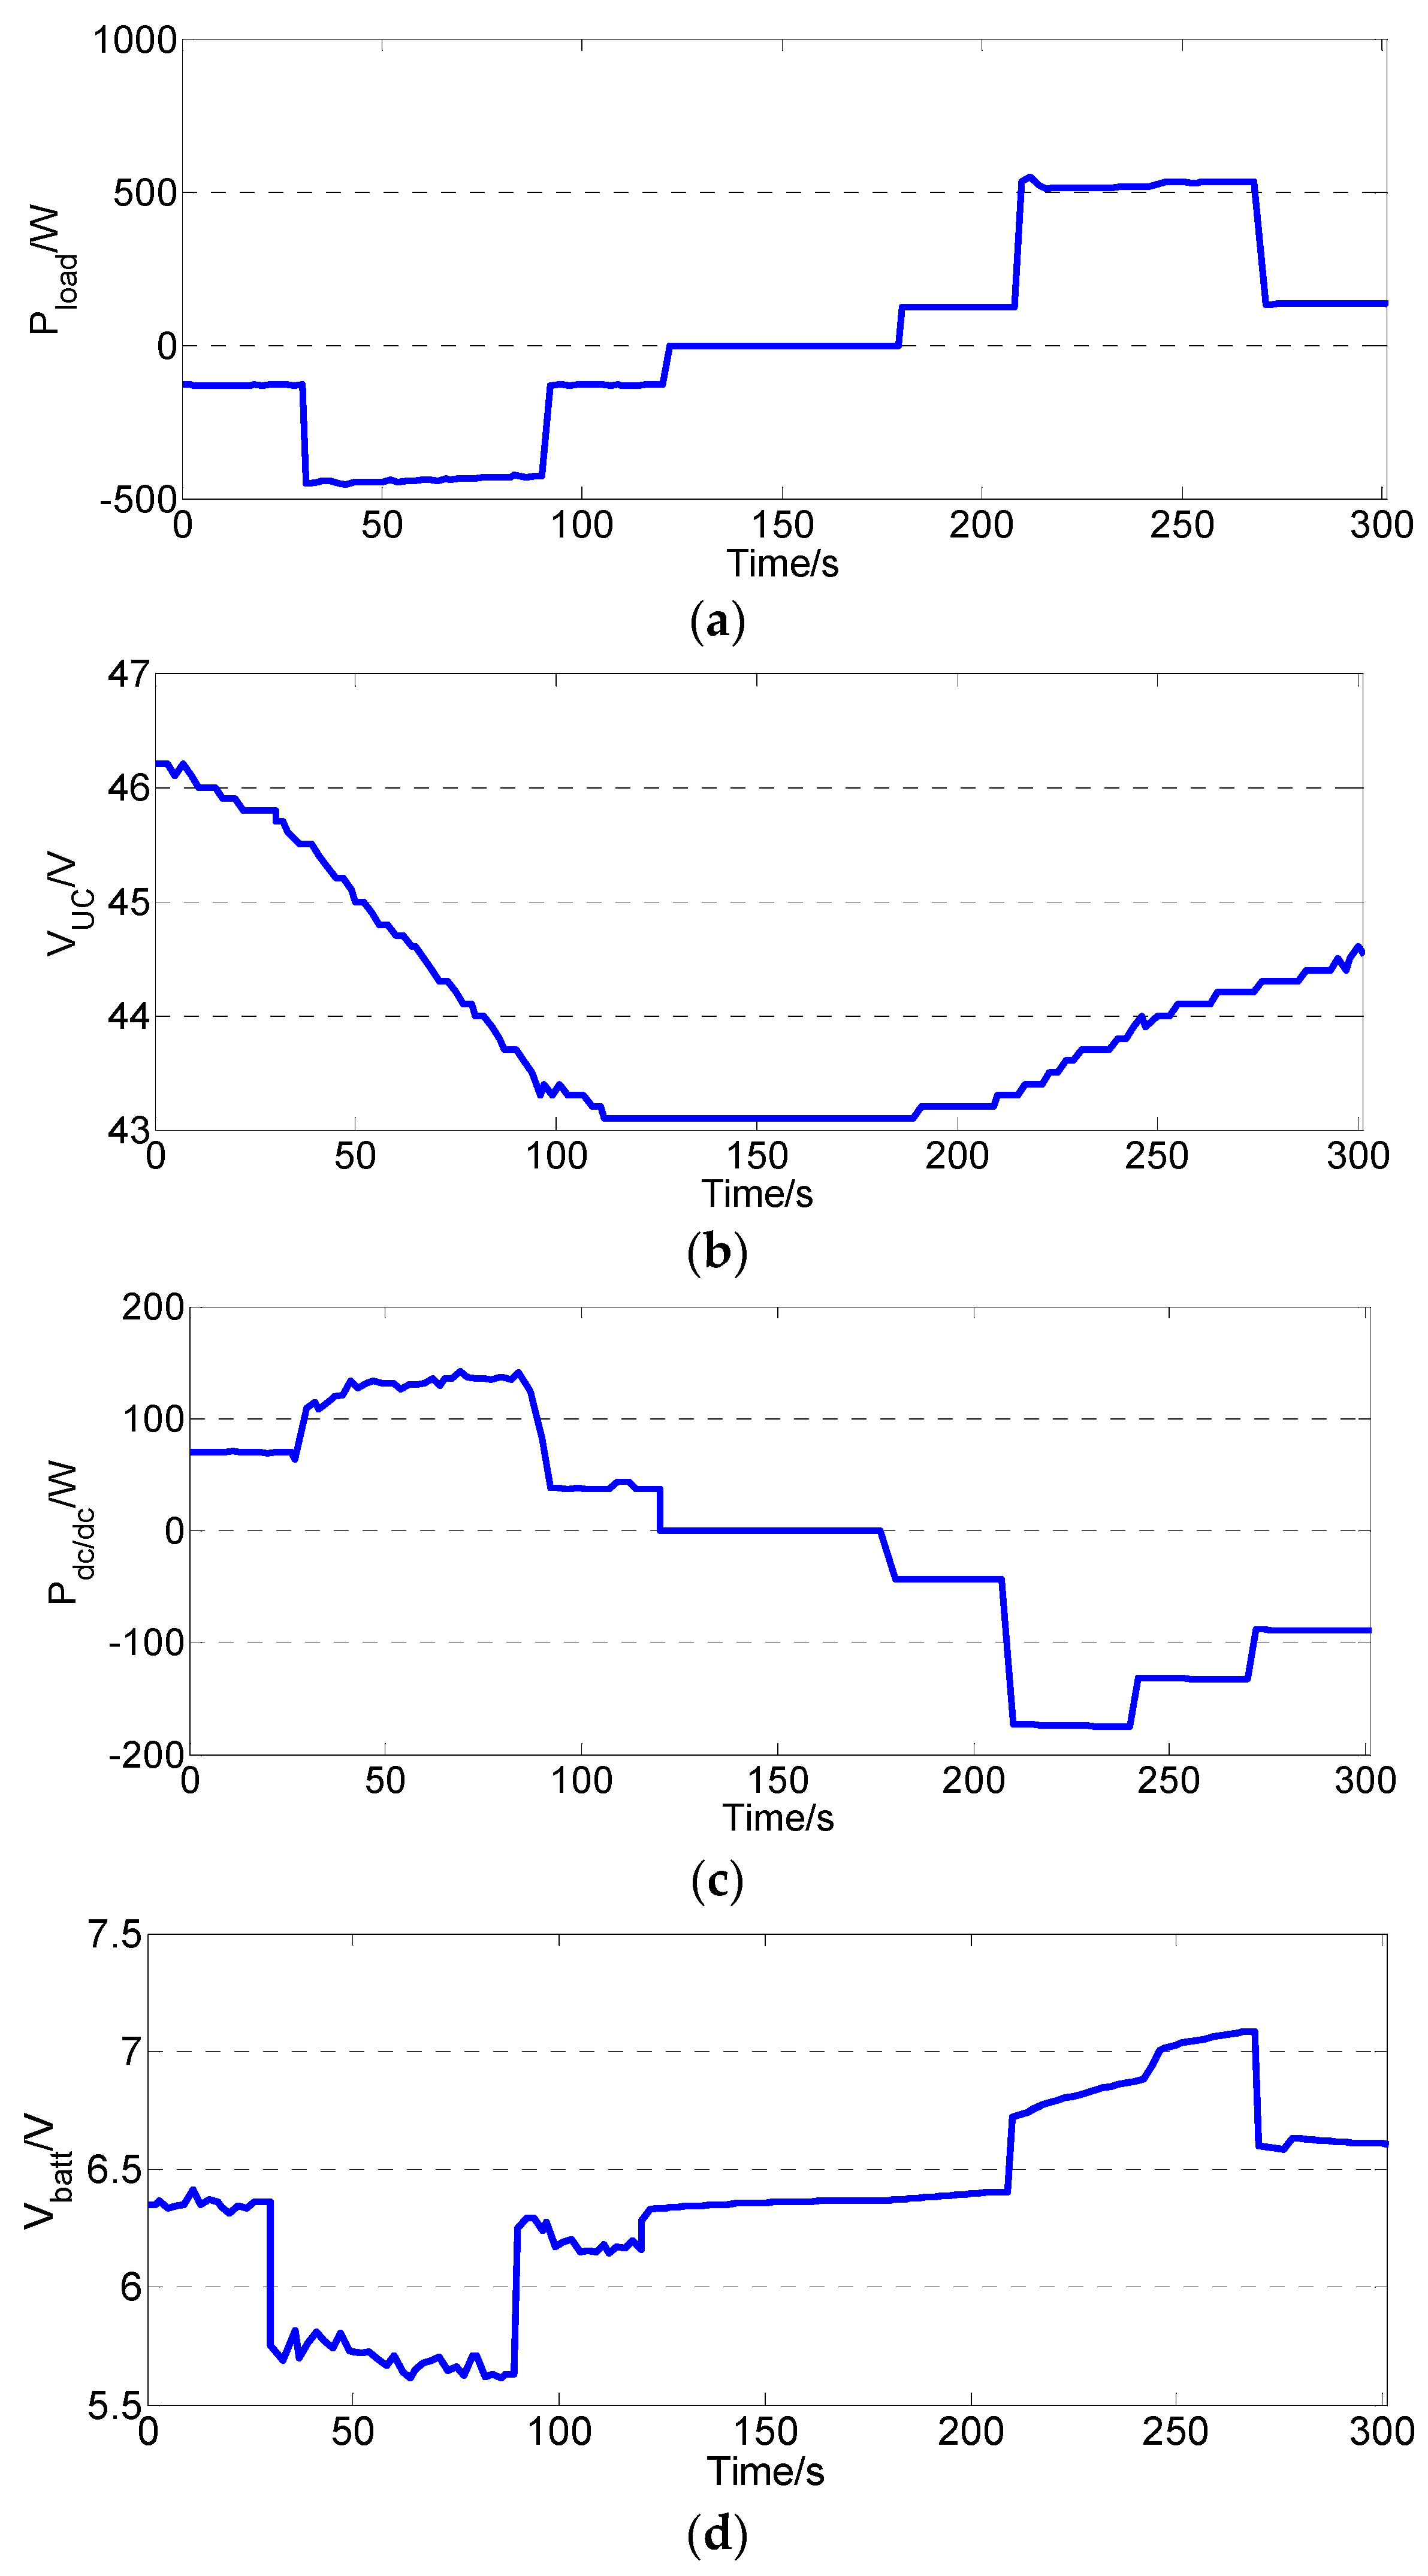
(1) Voltage of the UC bank is 1000 V
A UC bank voltage higher than 40 V in the experiments corresponds to a real UC bank voltage of 1000 V. The simulation results of the bi-directional dc/dc converter when the UC bank voltage is 1000 V are shown in
Figure 27.
When the HESS outputs electrical power to the load with the same power and the same voltage as that of the UC bank because the predicted load power is different, the power of the bi-directional dc/dc converter under 40 km/h is higher than that under 80 km/h. When the HESS absorbs electrical power, the responding power of the dc/dc converter under 80 km/h is higher than that under 40 km/h. The experimental data of the dc/dc converter in
Figure 28 is consistent with the simulation results in
Figure 27.
Figure 27.
The simulation results when the UC bank is 1000 V.
Figure 27.
The simulation results when the UC bank is 1000 V.
Figure 28.
The experimental results when the UC bank voltage is higher than 40 V. (a) Power of the load; (b) Voltage of the UC bank; (c) Power of the bi-directional dc/dc converter; (d) Voltage of the battery bank.
Figure 28.
The experimental results when the UC bank voltage is higher than 40 V. (a) Power of the load; (b) Voltage of the UC bank; (c) Power of the bi-directional dc/dc converter; (d) Voltage of the battery bank.
(2) Voltage of the UC bank is 600 V
When the voltage of the UC bank in the experiments is lower than 35 V, it simulates a real voltage of 600 V of the UC bank. The simulation results of the dc/dc converter are shown in
Figure 29.
Figure 29.
The simulation results when the UC bank voltage is 600 V.
Figure 29.
The simulation results when the UC bank voltage is 600 V.
The experimental results are shown in
Figure 30, and they are consistent with the simulation results. When the HESS outputs electrical power, compared with the simulation results when the UC voltage is 1000 V, the power of the bi-directional dc/dc converter decreases with a decrease in the voltage of the UC bank. When HESS absorbs electrical power, for storing more energy, the power of the dc/dc converter increases with a decrease in the voltage of the UC bank. The fuzzy logic principles are reflected from the experimental results.
Figure 30.
The experimental results when the UC bank is higher than 40 V. (a) Power of the load; (b) Voltage of the UC bank; (c) Power of the bi-directional dc/dc converter; (d) Voltage of the battery bank.
Figure 30.
The experimental results when the UC bank is higher than 40 V. (a) Power of the load; (b) Voltage of the UC bank; (c) Power of the bi-directional dc/dc converter; (d) Voltage of the battery bank.
6. Conclusions
In this paper, a fuzzy-logic power management strategy based on Markov random prediction is investigated for an active parallel HESS. The electrical power of the EV and HEV can be considered to have the Markov property. Based on the statistics of the vehicle speed and the electrical power from the heavy-duty vehicles driving cycle, the state transition probability matrices of the electrical power with different vehicle speeds are calculated. The electric power demand at the next moment can be predicted by the state transition probability matrices with the vehicle speed and electrical power demand of the current moment. Using the current vehicle speed, the current electric power and the predicted electric power as inputs, the fuzzy logic controller distributes the electrical power between the battery bank and the UC bank.
In this paper, both simulations and experiments are performed. The simulation model is created using MATLAB/Simulink. Compared with the battery-only ESS and HESS with a logic threshold, the proposed power management strategy not only limits the battery bank power to a certain range but also reduces the peak and average charge/discharge power of the battery bank and overall loss incurred by the whole ESS.
A scaled-down experimental platform was constructed to verify the proposed fuzzy-logic power management strategy based on Markov random prediction for an active parallel HESS. The experimental results showed that the proposed strategy is feasible.


