1. Introduction
Over the past few years there has been a dramatic increase in the deployment of grid-connected photovoltaics (PV) in countries across the globe. The uptake of PV at a national level initially triggered by the introduction of market-pull policies [
1] has helped global reductions in PV system prices which, in turn, fostered further deployment worldwide [
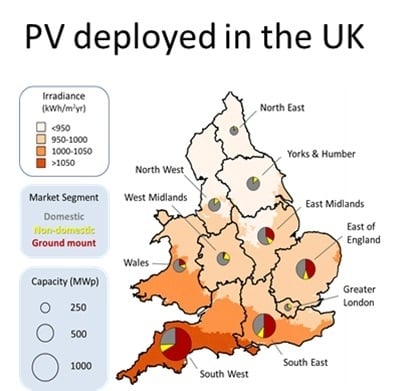
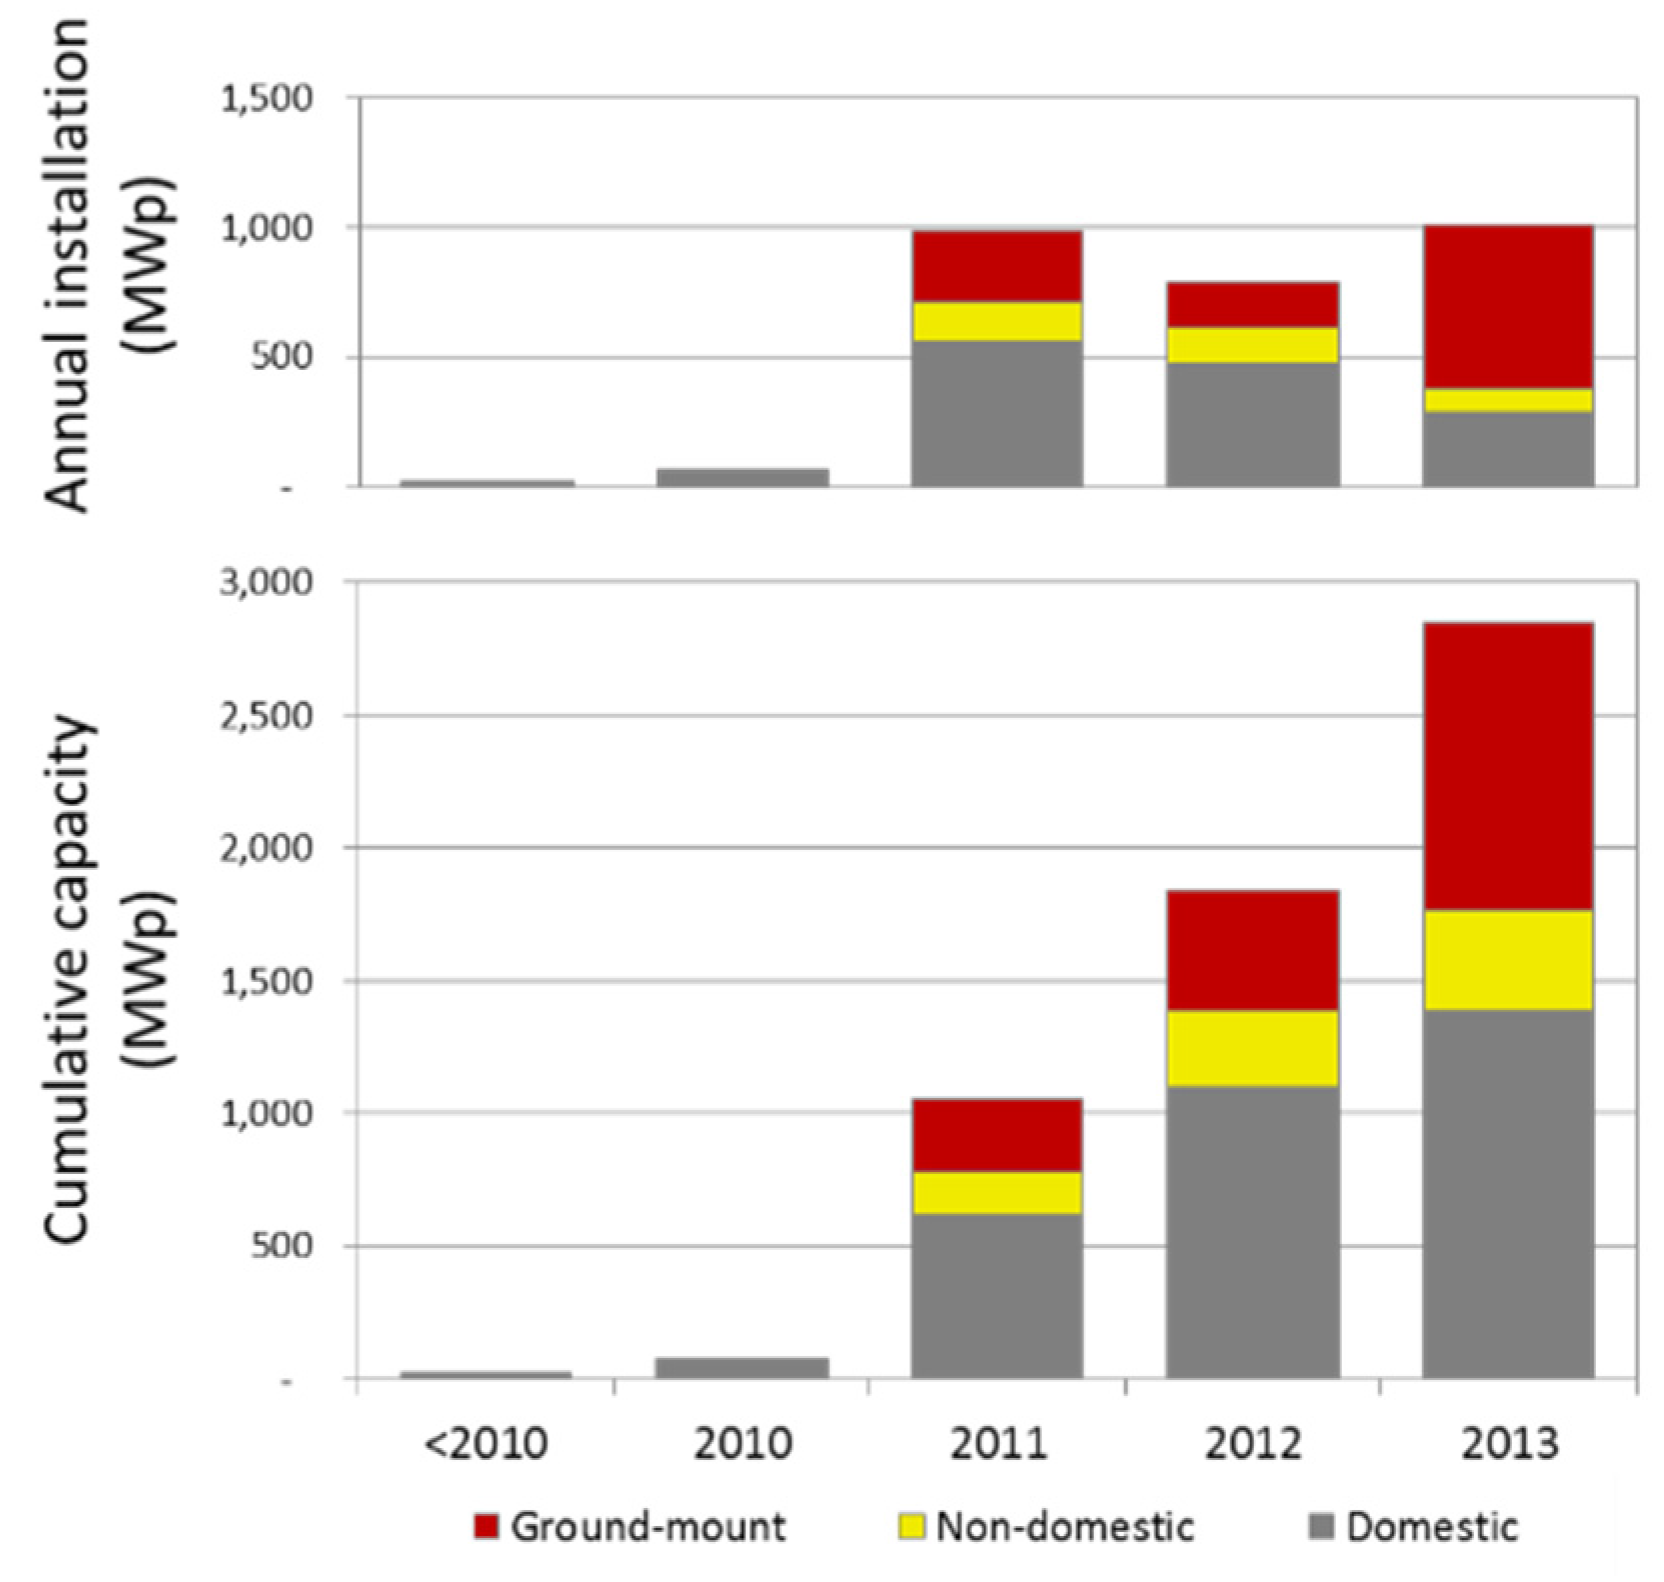
2]. In the United Kingdom in particular, installed capacity, grew from 32 MWp at the end of 2009 to over 2800 MWp (comprising around 500,000 installations) by the end of 2013 [
3]. However, unlike conventional “centralized” electricity generation, PV systems are typically characterized by: smaller installation size (with generator capacity ranging from a few kWp to tens of MWp); numerous installation locations and the ability to be installed in the different market segments of: domestic rooftop, non-domestic rooftop and ground-mounted systems. The former two typically being connected “behind the meter” on electricity consumer’s premises, whilst the latter are generally connected directly to the distribution network at higher voltage levels [
4]. These features in conjunction with their variable electrical output can present new challenges and opportunities for the electricity networks and market [
5]. For example, embedded generators have the potential to cause local voltage constraints (challenge) or reduce losses within the network (opportunity) [
6]. These impacts will be strongly related to the amount of electricity exported into the network by sites with PV installed [
7], which in turn depends upon the on-site PV generation and electricity consumption. Therefore it is expected to vary significantly across geographic locations and market segments. For example in the domestic market, greater value is expected from self-consumption of generated electricity (
i.e., minimizing electricity import), whereas, in the ground-mount market the aim is to maximize electricity export.
In order to assess the potential impacts of PV deployment on the electricity network it is very important to firstly gain a detailed understanding of what grid-connected PV deployment looks like—both spatially and by market segment. For example, where PV has been installed, which PV system size, or by whom (i.e., is it domestic, non-domestic or ground mounted)? This paper aims at providing answers to these questions by developing a novel framework to analyze PV deployment trends in the UK.
A number of reports within the literature have considered UK PV deployment and examined how certain drivers have influenced it. For example, Cherrington
et al. [
8] and Muhammad-Sukki
et al. [
9] investigated the level of subsidy provided through a government market-pull policy and how it impacted on uptake of PV in the domestic sector. These reports demonstrated the clear influence of government policy in driving UK deployment in the domestic market. Along similar lines, the Department for Energy and Climate Change (DECC) published analysis comparing domestic PV deployment to a number of socio-economic indicators, including level of income deprivation and rurality [
10]. Rurality is a measure of how dispersed domestic properties are, ranging from isolated dwellings to dense urban areas with populations over 10,000. These analyses provided a solid basis to consider the nationally aggregated trends in the domestic PV market, but did not explore in detail the influences of market segmentation or spatial variation, e.g., are these trends the same in the ground-mounted market as the domestic market? Do they differ in different geographical areas of the UK?
More recently, work by Gooding
et al. [
11] began to consider the importance of spatial disaggregation of the UK PV deployment. Their approach estimated the feasible PV potential of different UK cities, based upon solar resource (e.g., irradiation and appropriate roof-area) and socio-economic factors, such as income, where higher income was considered as a variable that would increase a household’s ability to install PV. The research highlighted how spatial disaggregation enabled a clearer understanding of the interplay between different variables that is lost at higher levels of aggregation. In an international context, an approach adopted by Kwan [
12], provided a much finer level of spatial disaggregation to study the uptake of domestic PV deployment in the US, within a geographical information system (GIS)-framework. This work probed the links between spatial deployment of PV and a range of social, economic and political variables (including level of education; household income and local governmental membership to national sustainability organizations). It demonstrated a methodology capable of distinguishing deployment at a local-level and provided new insights into the interaction between different variables shaping deployment.
In the UK context, an approach adopted by Richter [
13] analyzed domestic PV deployment at post-code level to understand if social learning effects (e.g., the observation of local PV installations) influenced the deployment rate of further installations in that area. While this analysis was disaggregated spatially (
i.e., it considered trends in individual post-code areas) the authors noted the limitations of assessing such areas in isolation (e.g., by not considering how deployment in one area related to that in an adjacent one), and discussed the value of future work to investigate deployment across adjacent areas. More recently, Ozkan
et al. [
14] investigated how trends in the UK domestic market relates to a number of variables (including the population density, proportion of detached houses and irradiation), spatially disaggregating the UK to 134 areas. This research highlighted the importance of both local features of the built-environment (e.g., percentage of detached housing) and wider geographical characteristics (such as aggregate population density) influencing the amount of PV deployed. The authors also discussed that further refinement of the analysis would be possible by investigating trends at a finer level of spatial disaggregation.
Clearly, a number of the studies described above have begun to consider how PV deployment varies in a spatially disaggregated manner as well as some of the underlying drivers influencing this. However, they often employ relatively coarse grained analysis, or have considered each spatial area in isolation (e.g., they don’t investigate relationships of deployment in adjacent areas). Crucially, of the studies identified the focus has been almost entirely upon the domestic sector, therefore missing out a significant portion of the total installed PV, e.g., the ground-mount and non-domestic rooftop market segments. It is anticipated that PV deployment in these market segments—similar to the domestic market—will also be significantly influenced by a range of variables. For example, it would seem likely that ground-mounted PV would be more prevalent in areas of low population density (such as rural ones), or that non-domestic PV may be installed to a greater extent in areas with larger coverage of non-domestic buildings. Moreover, despite existing literature provides convincing evidence on the positive correlation between solar irradiance and PV deployment in the domestic sector [
14] such evidence still has to be given for non-domestic and ground mounted market segments.
Thus it is the intention of this research to provide a framework to consider PV deployment trends disaggregated to a fine level of spatial detail and enabling comparison across all market segments. Firstly, it develops a novel GIS-based framework, the United Kingdom photovoltaics database (UKPVD), which draws together PV deployment data for over half a million installations within the UK including all market segments. PV deployment in the UK is then mapped to high spatial resolution across all market segments, with specific geographical case studies presented to capture variations within the local area. We next compare the influence of the national PV support policy, irradiation, and characteristics of the built environment on PV deployment across all market segments. These variables have been selected as they are expected to have an impact on PV deployment and are available at the required level of spatial disaggregation. Moreover, it is interesting to analyze how they have influenced deployment across market segments. These variables are intended to provide comparison between market segments opposed to an exhaustive list of all variables that shape deployment. A qualitative discussion on the role of some additional factors, which are not available at such spatial disaggregation (such as property tenure) is next presented.
This paper presents the initial outputs of the techno-economic work package of the PV2025 project, an Engineering and Physical Science Research Council (EPSRC) consortium focused on understanding the potential costs and benefits of PV for UK infrastructure and society. The framework developed here has been structured as a basis from which further work will be developed, specifically to understand: future PV deployment scenarios; potential impacts on the electricity networks; and possible mitigation measures.
The reminder of this paper is arranged as follows.
Section 2 outlines the methodology developed covering both the development of the GIS-framework and analytical approach used to examine trends in deployment.
Section 3 provides an overview of UK policy supporting the deployment of PV, as a key driver for uptake.
Section 4 discusses trends in PV deployment and how it has been affected by UK PV policy and other variables both quantitative and qualitative.
Section 5 concludes and outlines the direction of future work.
2. Overview of Developed Geographical Information Systems Framework and Analytical Approach
The UKPVD framework developed here is a GIS based tool to map the deployment of PV across the UK. A GIS is a computer-based tool to enable the visualization and analysis of data that contains spatial information. In the context of the PV2025 project it is valuable to identify deployment trends, consider the amount of electricity fed into the grid, implications for the electricity network and possible mitigation measures.
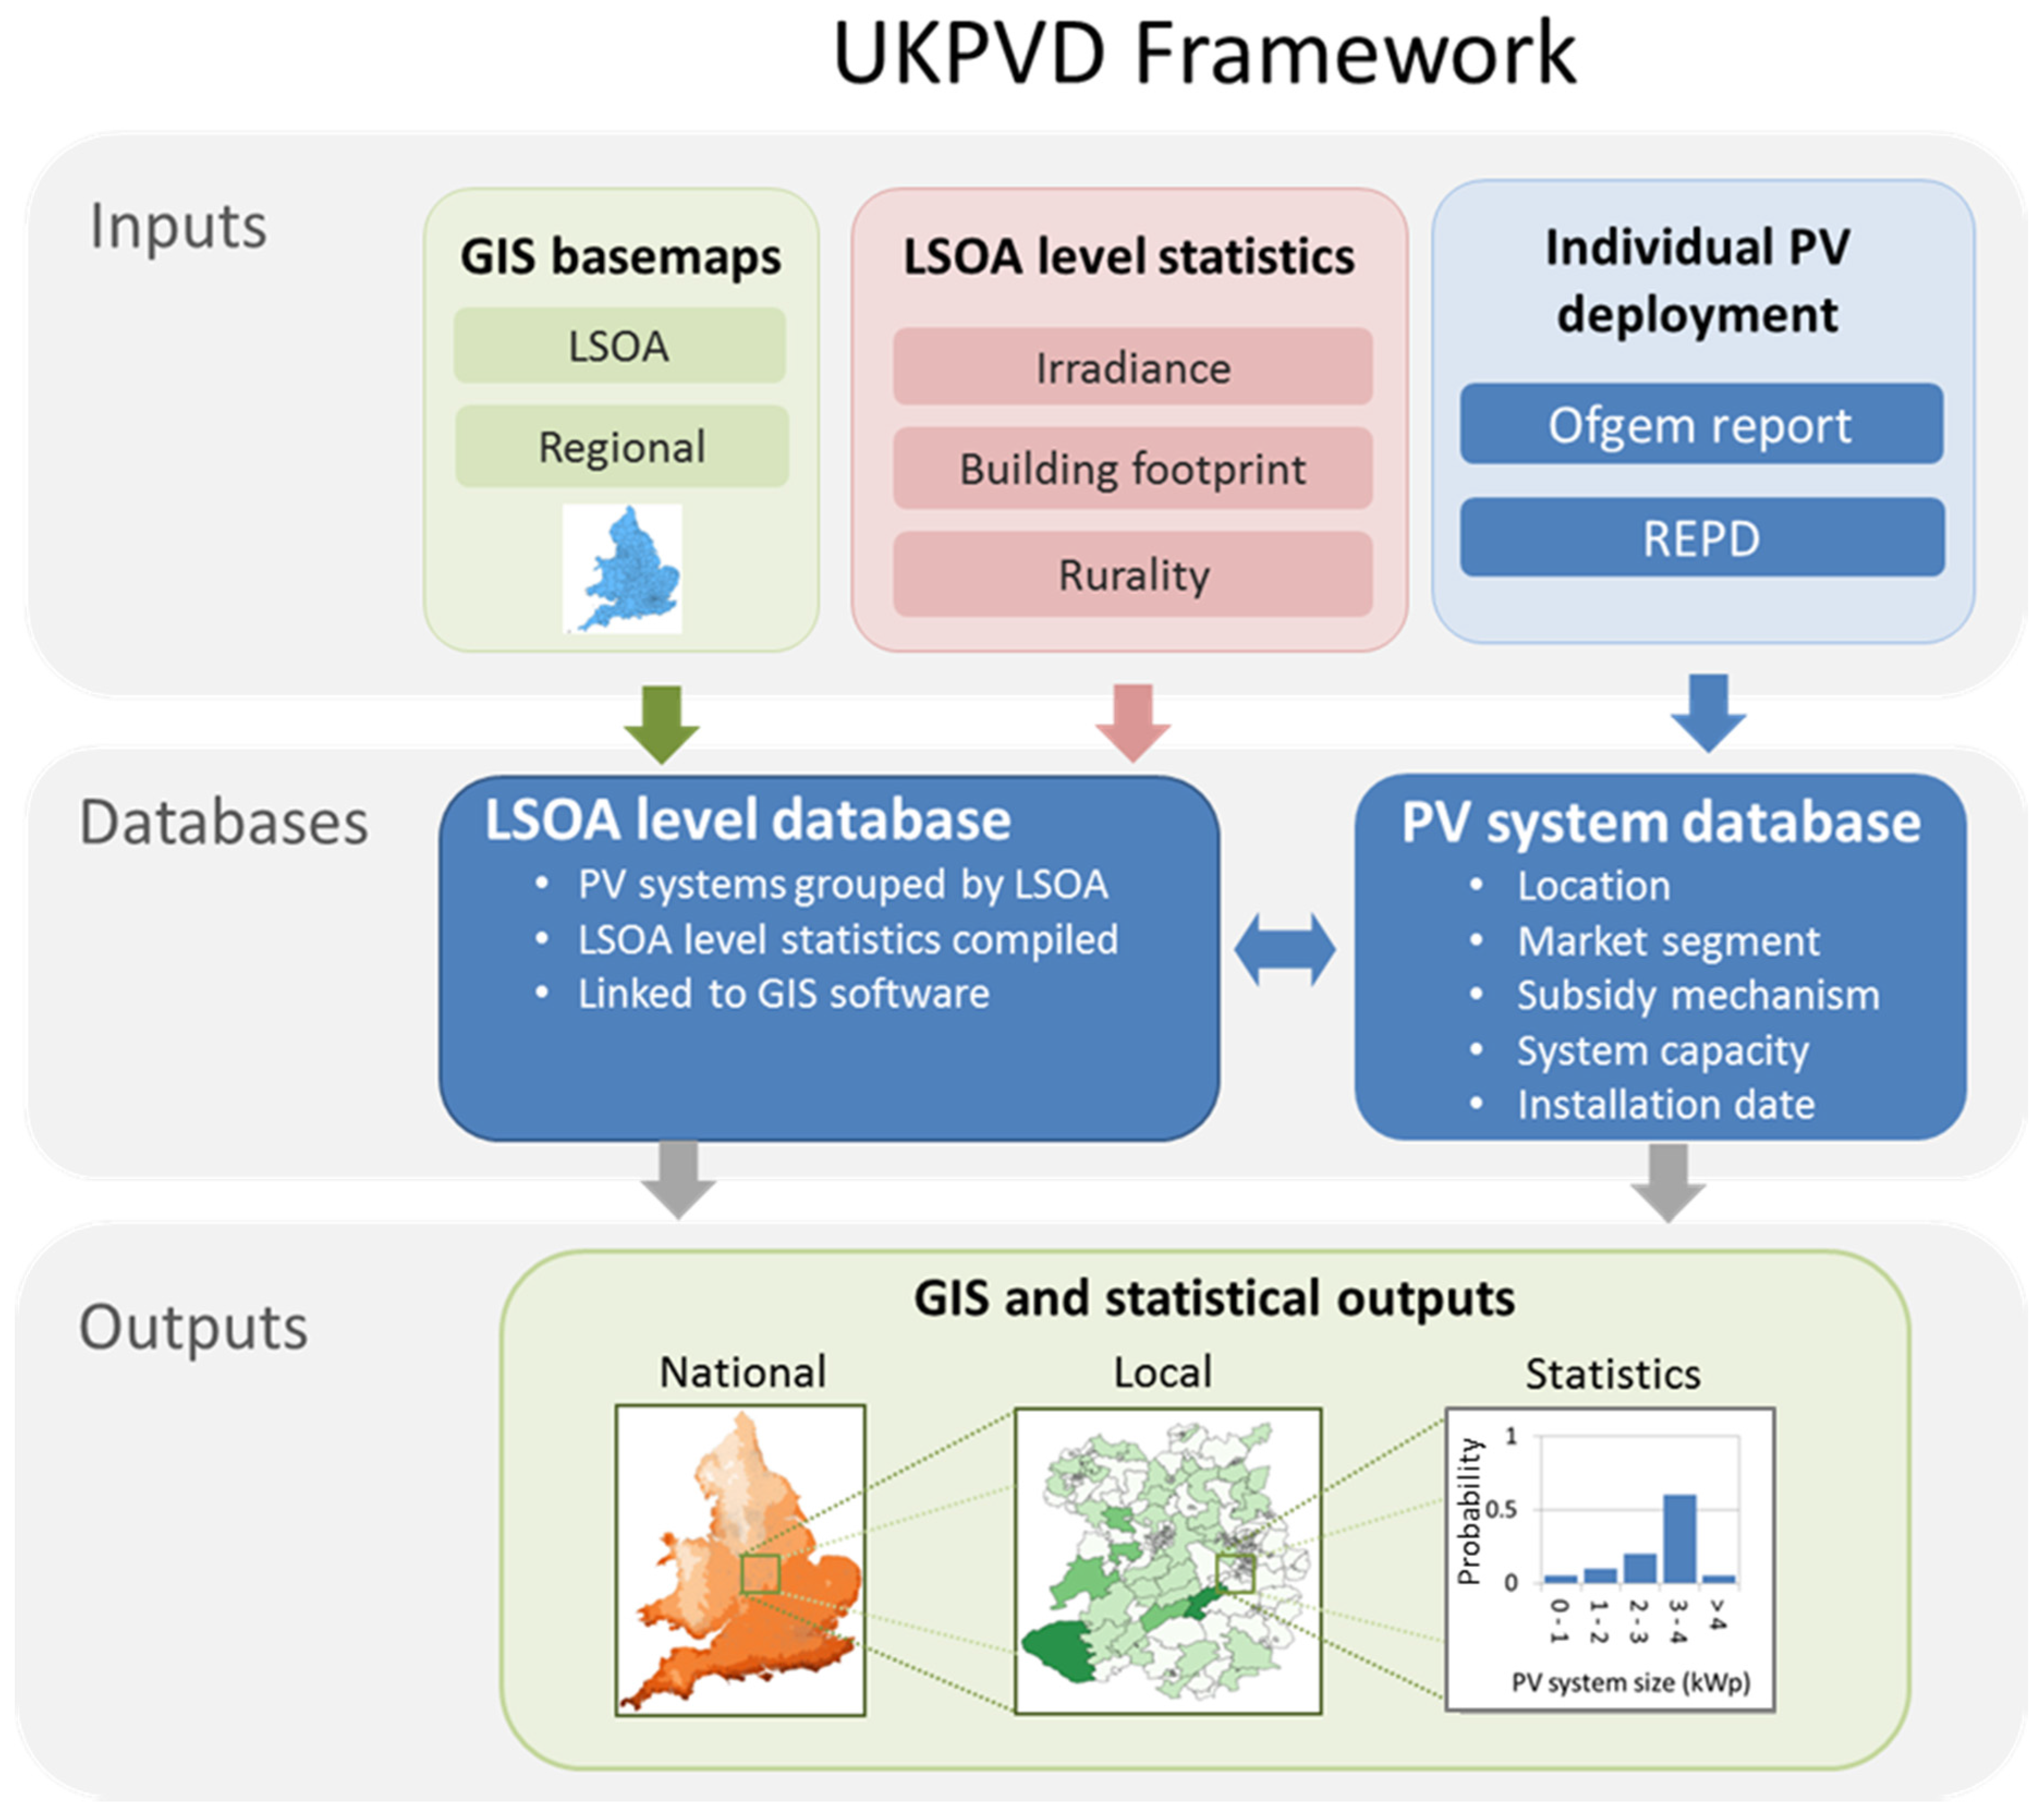
The UKPVD framework is arranged into three layers (shown in
Figure 1): inputs (top), databases (middle) and outputs (bottom). The inputs are the data-sources brought together within this framework. The first of these is the GIS basemaps, which provide a “blank canvas” dividing the UK into smaller spatial areas. The other inputs into the framework include PV deployment and statistical datasets that can be matched to the GIS basemaps (these are: average annual irradiation, rurality and building footprint). These inputs are then joined together to create two new databases, the PV systems database and the lower-layer super output area (LSOA) level database (
Figure 1, middle). The information and relationships within these can be viewed and exported as GIS maps and statistical formats, which comprise the outputs from the framework (
Figure 1, bottom). These outputs can then be analyzed in order to understand the trends in deployment. The following sections explain in more detail the data-sources and rationale for building the framework.
Figure 1.
Schematic of the United Kingdom photovoltaics deployment (UKPVD) framework.
Figure 1.
Schematic of the United Kingdom photovoltaics deployment (UKPVD) framework.
2.1. Geographical Information Systems Basemaps: The Mapping Framework for Photovoltaics Deployment
When designing the framework, the first input selected was the GIS basemap of highest spatial disaggregation, or in other words that which offers the greatest spatial resolution. In this study we use the LSOA basemap. An LSOA is a spatial unit of analysis containing on average 600 households that form spatially adjacent, socio-economically similar clusters [
15]. As population characteristics (e.g., number of households) are maintained, the size (km
2) and shape of LSOAs can vary widely. The GIS input boundary map of all LSOAs in England and Wales (approximately 34,000) was obtained from the Office of National Statistics (ONS) Geoportal [
16] and utilized 2001 census geography. We selected to use the LSOA for two reasons: firstly, it is the most detailed spatial disaggregation available for PV deployment data. Secondly, the LSOA is a standard area for many census-based and other geographical datasets, thus making available a broad range of compatible national datasets.
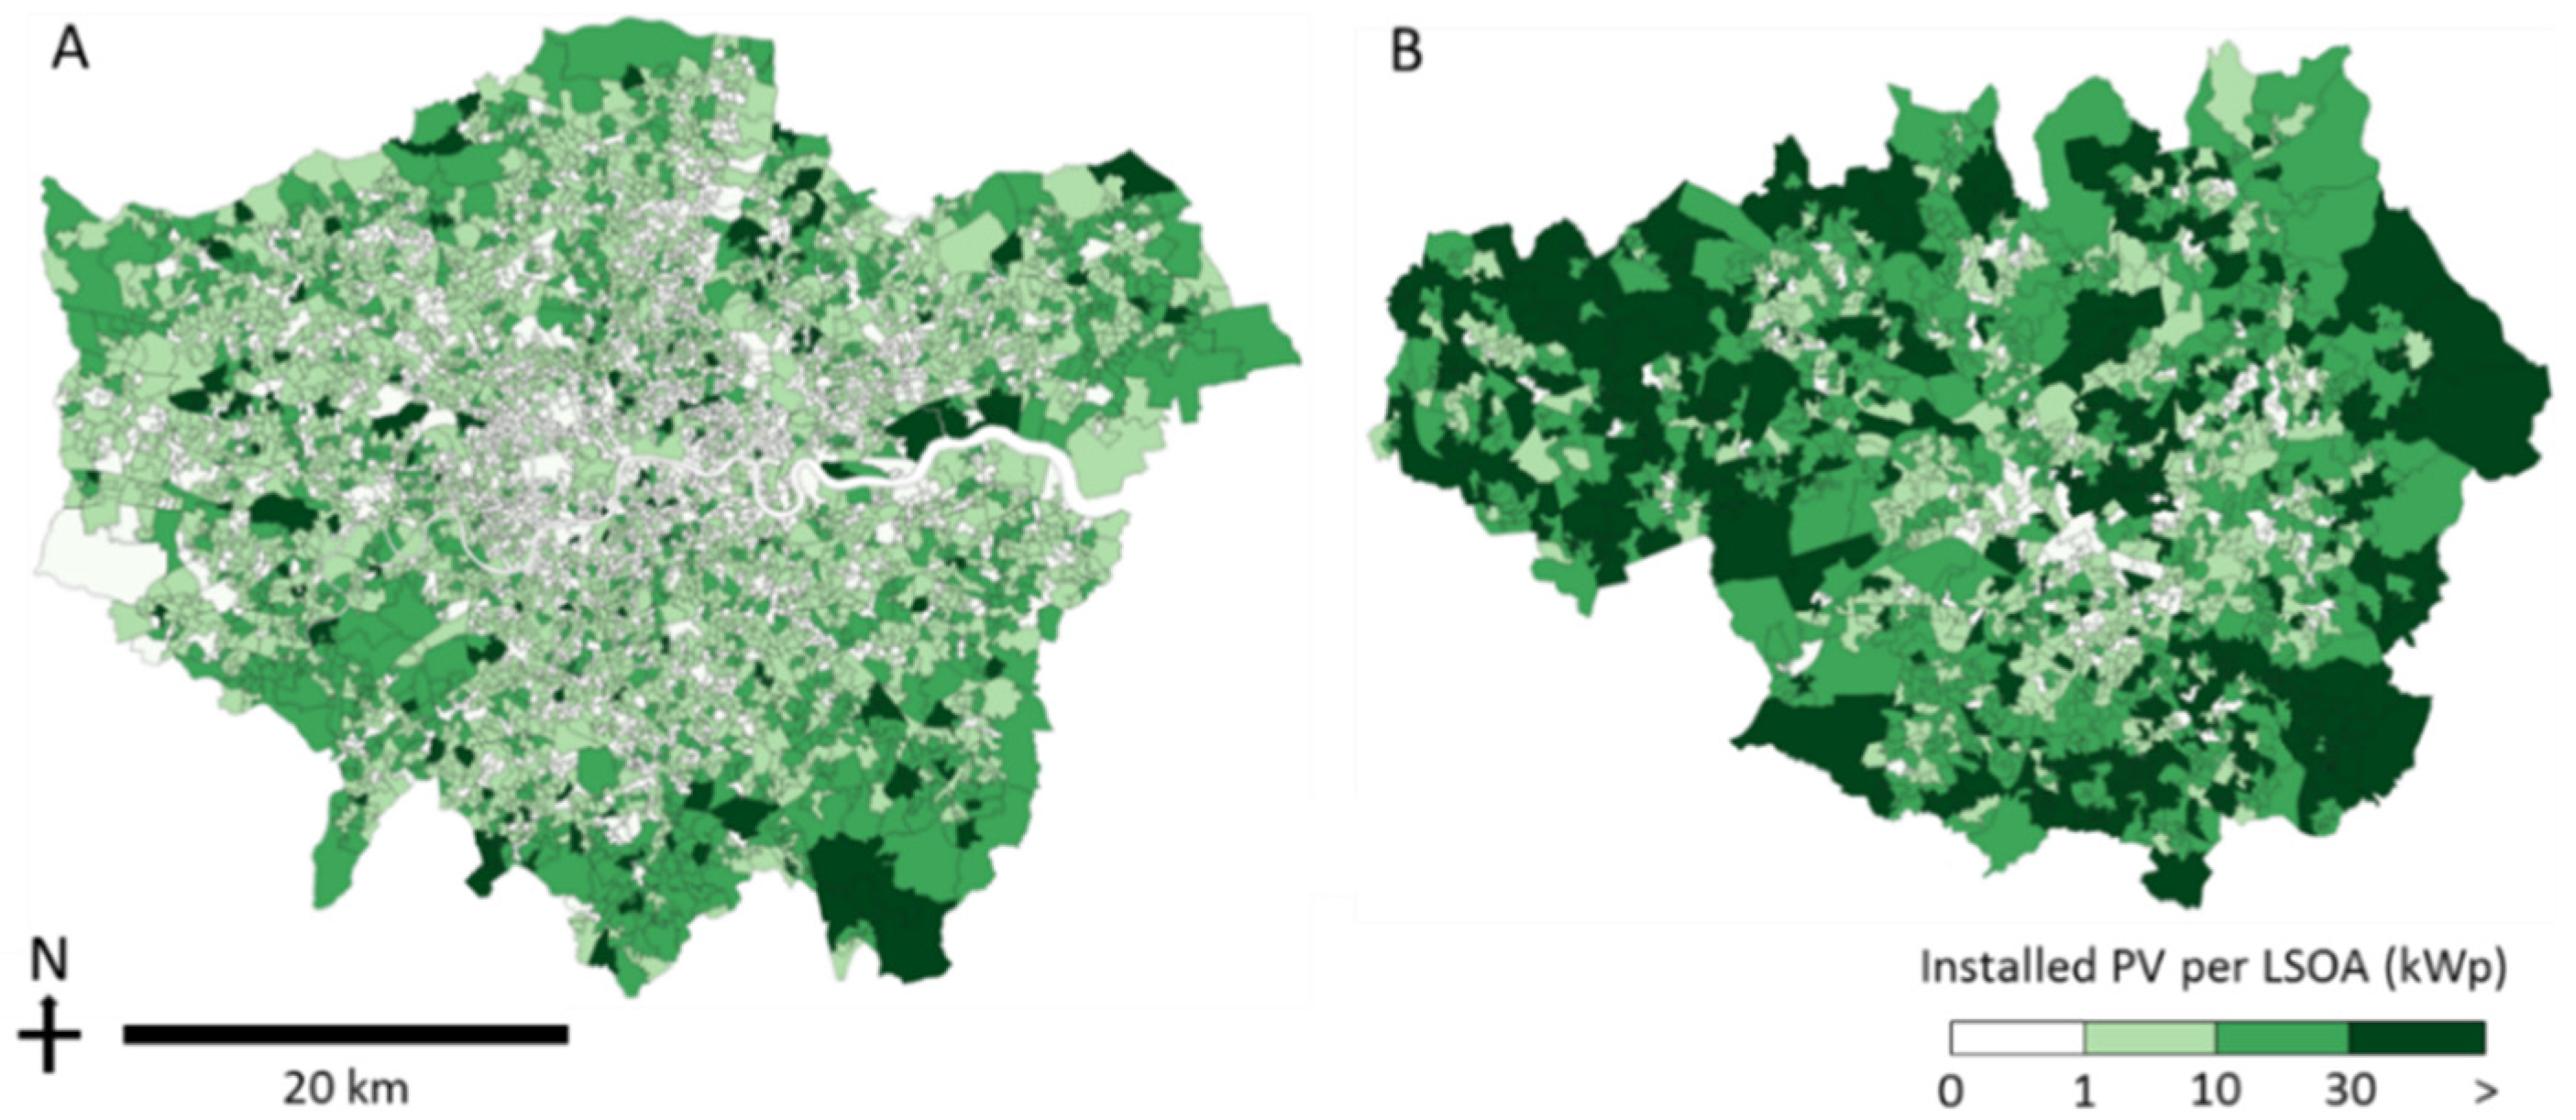
The analysis carried out here utilised Quantum-GIS (QGIS), an open source desktop GIS package. This software was used to link the GIS basemaps to the databases created. Color maps were created in the software package to visualize spatial distribution of LSOAs and amount of PV installed, with higher deployment areas appearing darker. Statistical summaries of this data were exported for analysis in appropriate analytical software, such as Microsoft Excel.
2.2. Lower-Layer Super Output Area Level Statistics: Variables Influencing Photovoltaics Deployment
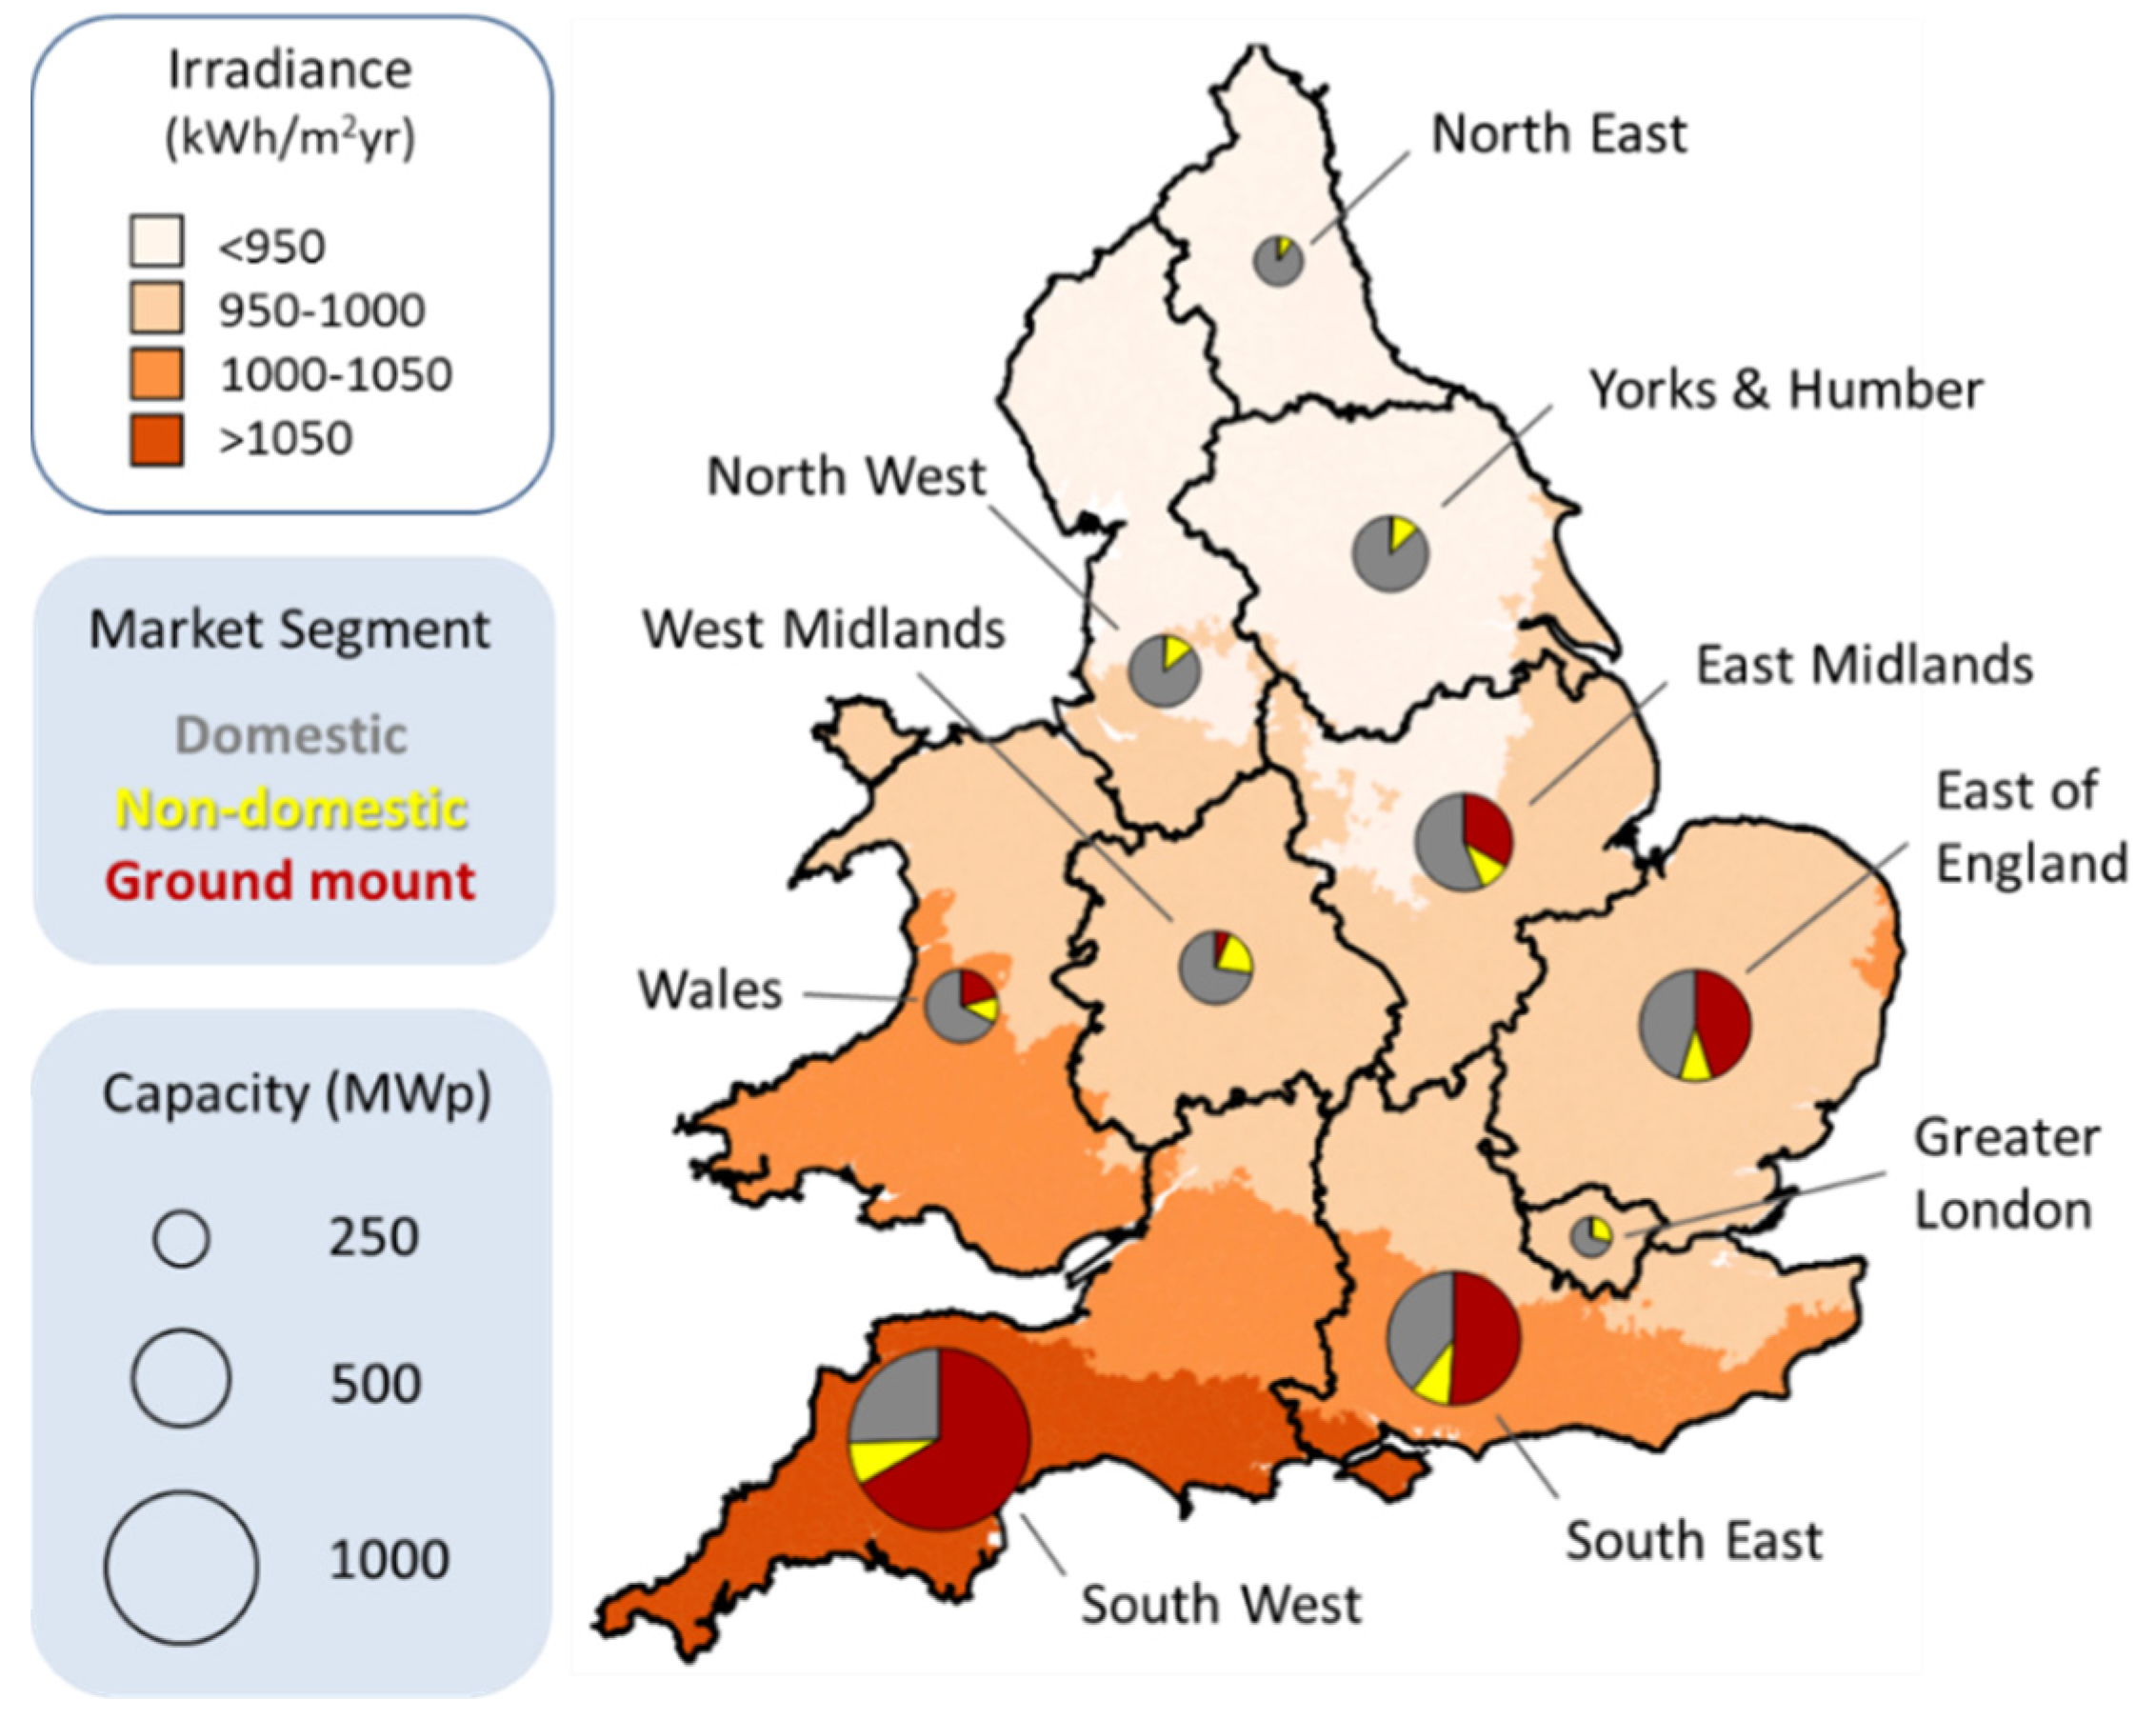
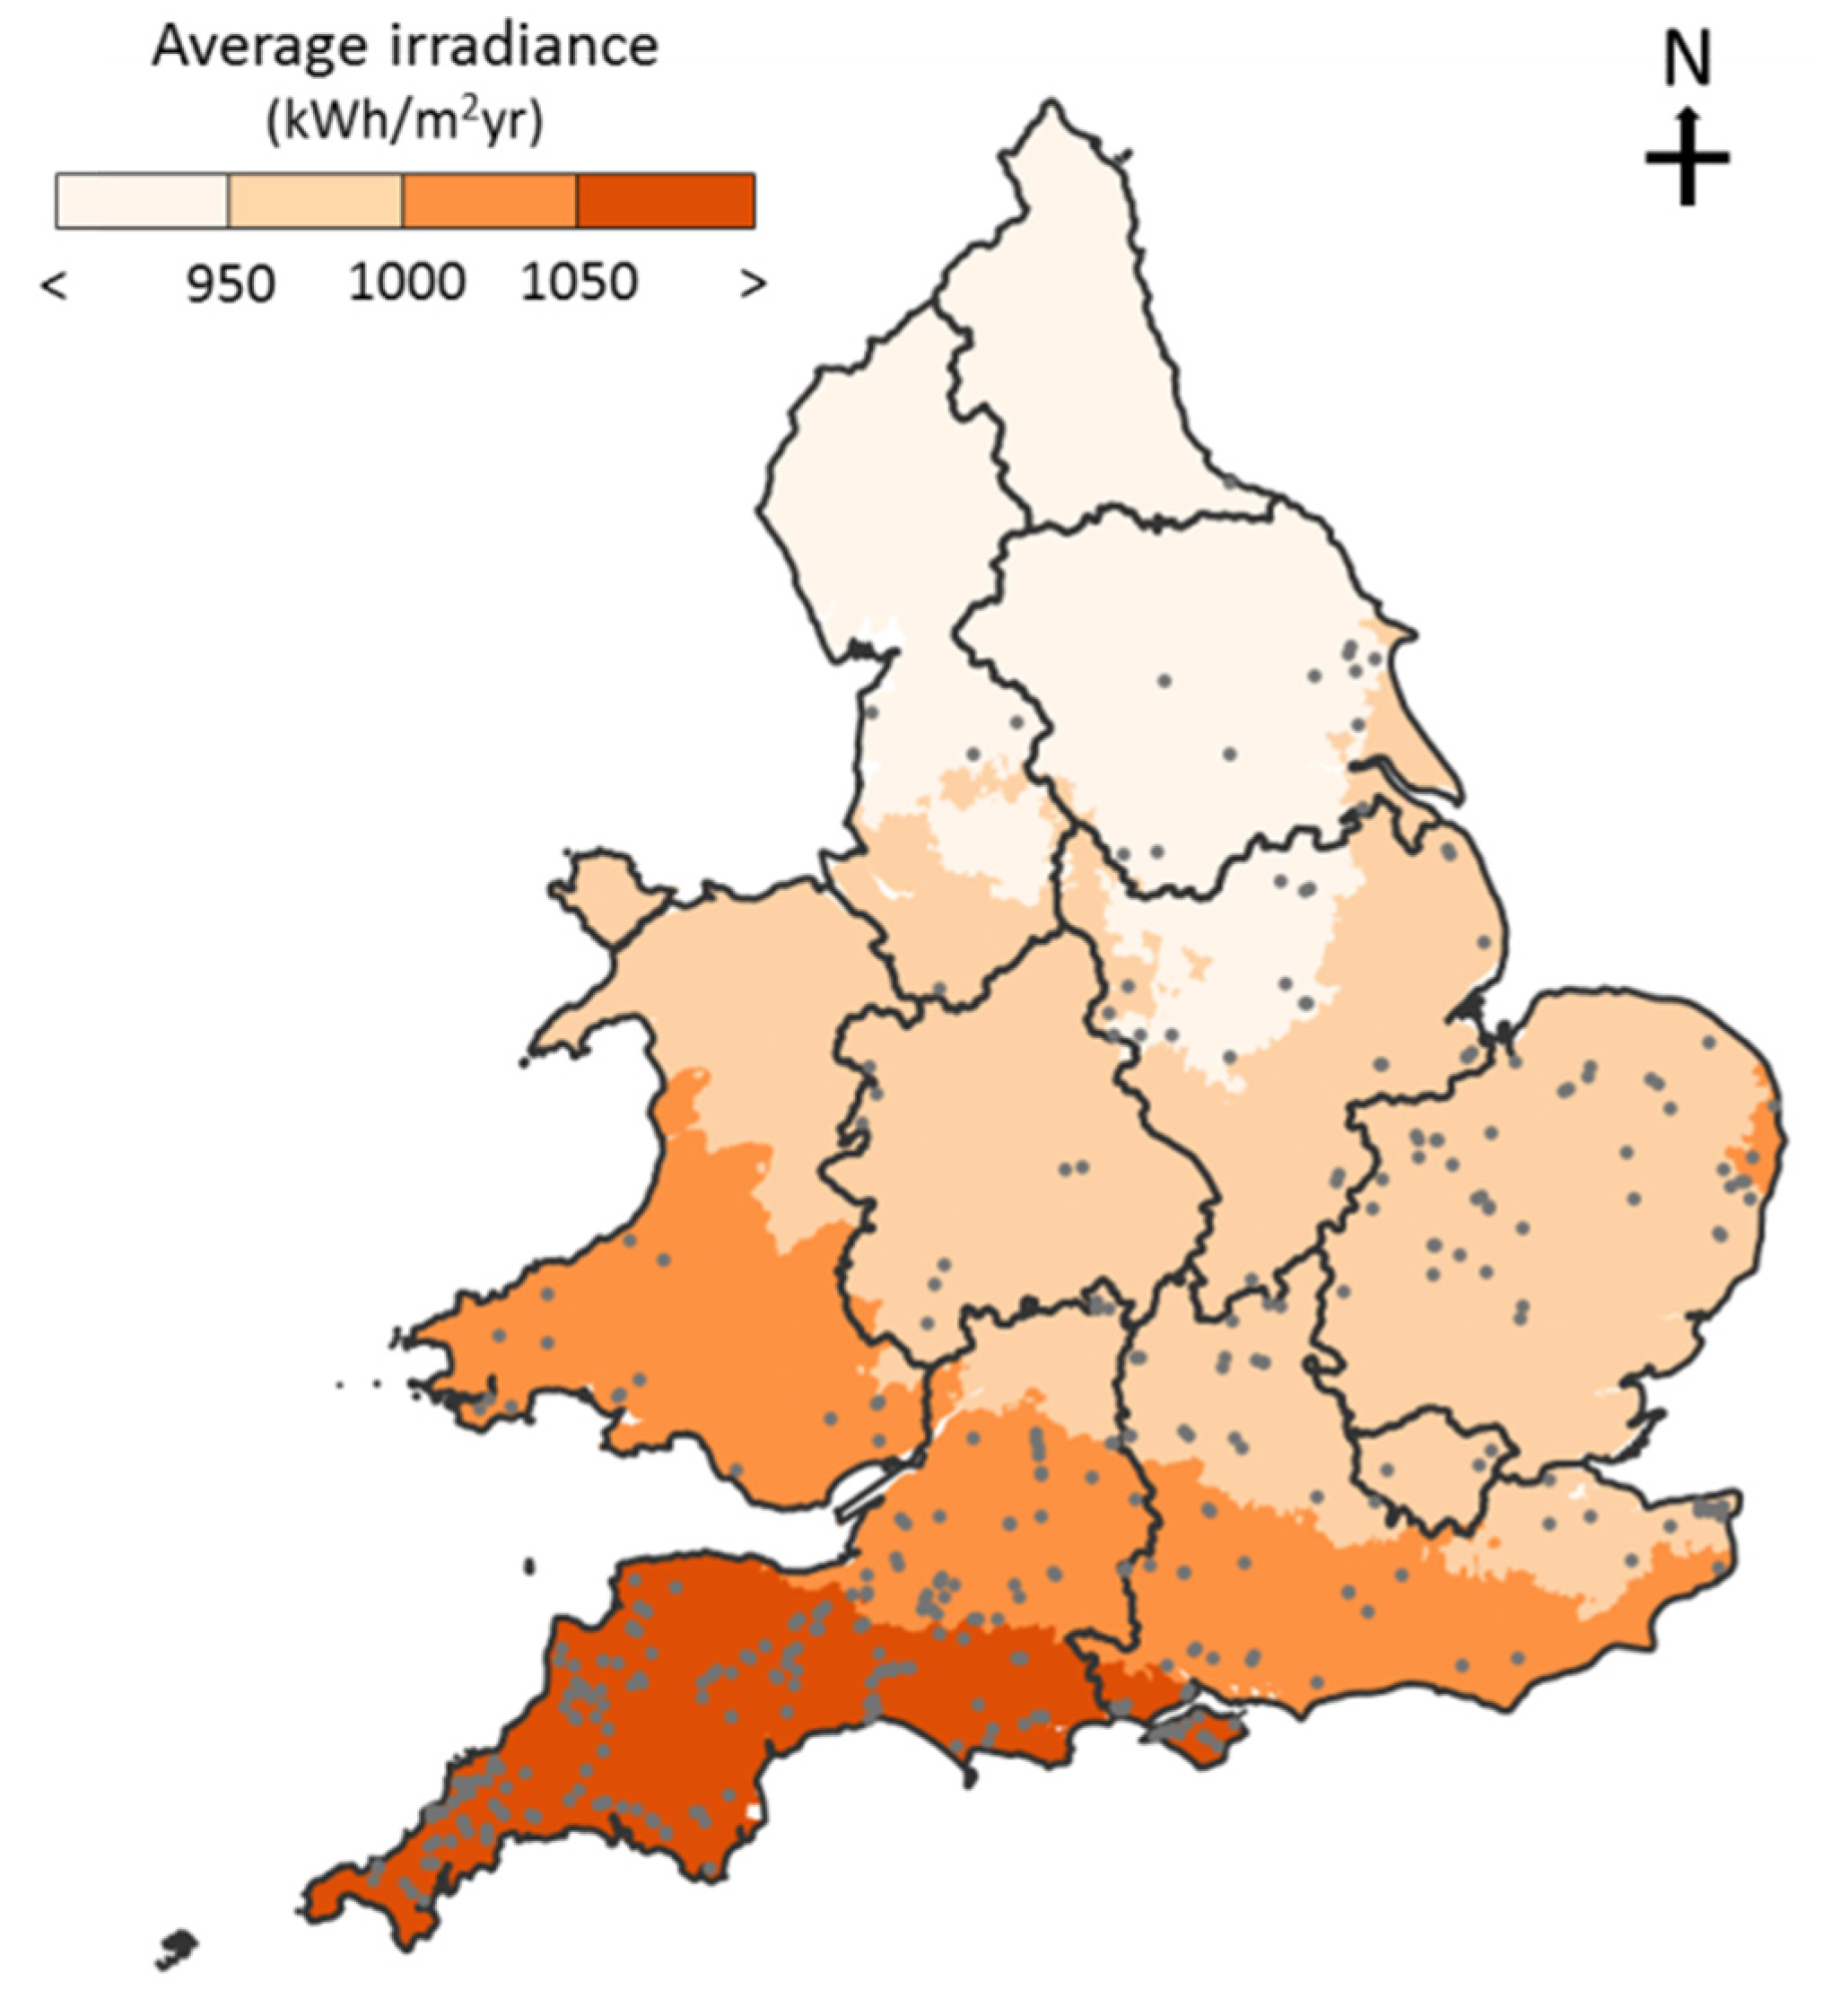
We selected to examine three sets of LSOA level statistics: average annual irradiation, building footprint area and rurality. These variables were selected as they have an impact on all PV deployment and enable comparisons between market segments, for example, how does the difference in irradiance across the UK influence domestic deployment relative to ground-mount? Annual irradiation is expected to have strong impact on PV deployment as it varies significantly across the UK and it affects the annual return on investment from a PV system (as higher annual irradiation will generally result in higher electricity generation, providing a higher return). Rurality is investigated to provide insights into how PV is distributed across the country, i.e., if more installed in dense urban or sparsely populated rural areas. Finally, building footprint is investigated (as proxy for roof-area) as to date no evidence has been provided comparing domestic and non-domestic buildings.
Average annual irradiation, was obtained from the PVGIS database ground-station average annual irradiation (1981–1990) on a horizontal surface [
17], and a mean value per LSOA was derived (in kWh/m
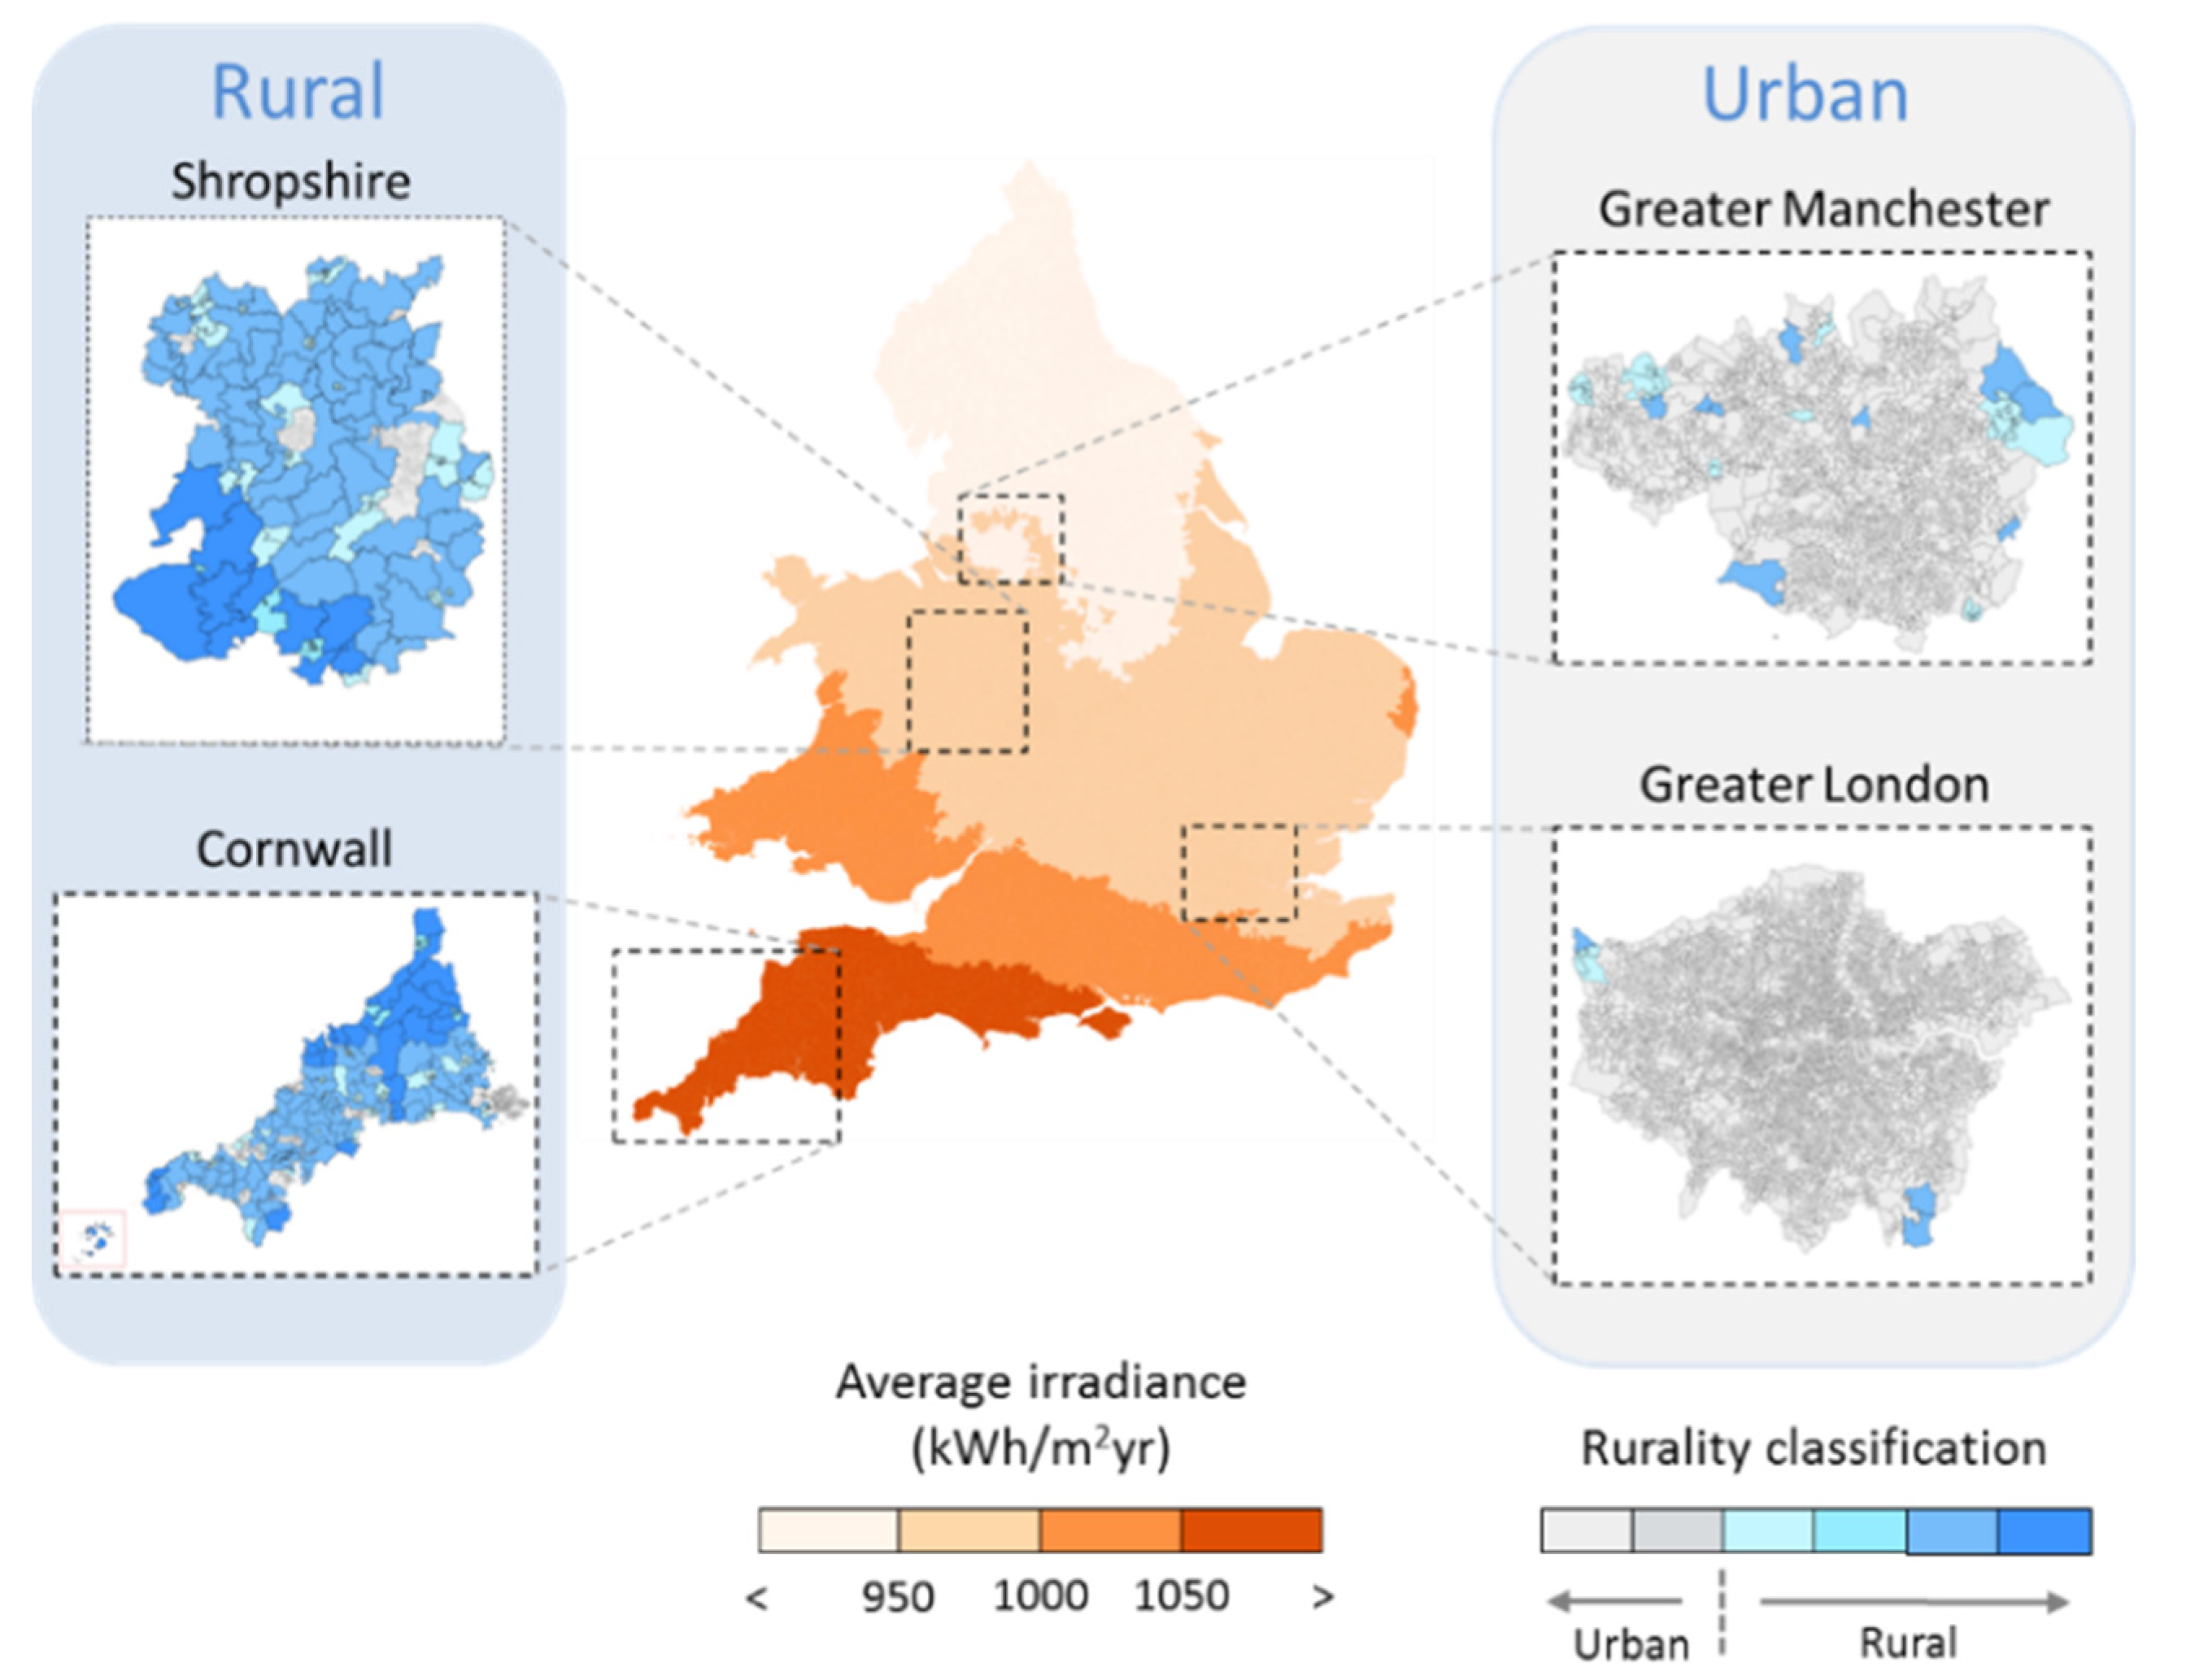
2). Across England and Wales irradiation is highest in the South-West of England and gradually decreases moving further North-East, shown in
Figure 2, meaning LSOAs that are close to each other spatially tend to have similar irradiation.
Figure 2.
Selection of case study areas for domestic and non-domestic photovoltaics (PV).
Figure 2.
Selection of case study areas for domestic and non-domestic photovoltaics (PV).
Building footprint data was utilized (
i.e., m
2 coverage of domestic and non-domestic buildings per LSOA), as we are not currently aware of a national dataset for roof-area dis-aggregated to LSOA level, distinguishing domestic and non-domestic buildings. The building footprint area is expected to have a significant role in determining how much PV may be deployed,
i.e., larger building coverage will correlate with a larger rooftop area over which to deploy PV. The dataset was acquired from the generalized land-use database of the ONS [
18], we use the most recent dataset, which at time of writing was measured in 2005. Clearly changes in land-use over time (such as urbanization) will influence the validity of this data-set, and as such we have designed the framework to be updateable when new data becomes available.
Building footprint is also a quantity that may vary significantly between LSOAs, depending on the types of building present and their size. Therefore to enable comparison of PV deployment in areas with different building footprint, we propose a utilization factor. This is calculated by dividing the installed capacity of PV (kWp) by the building footprint (m
2), hence providing a value of PV capacity “normalized” by building area (Wp/m
2). The term is useful to compare areas dissimilar in terms of building coverage (e.g., rural and urban) and also to compare trends between the different market segments (e.g., domestic and non-domestic). Rurality, which is defined here using the ONS standard classification [
19], categorizes LSOAs depending on the type of settlements within them. These settlements cover: urban (population over 10,000); town and fringe; village, hamlet and isolated dwellings. In this report the latter two of these classifications are considered as rural to aid simplicity.
2.3. Individual Photovoltaics Deployment: Photovoltaics System Data-Sources
The final inputs into the framework are PV deployment data, gathered from two data-sources of PV installation: the Ofgem feed-in tariff (FiT) installation report [
20] and the renewable energy planning database (REPD) [
21]. The Ofgem report contains records of all PV systems within the UK benefiting from the FiT scheme, which was introduced in April 2010. The FiT scheme has been an important driver for PV deployment within the UK. PV systems installed prior to the FiT are likely to be encompassed into this database, as they probably applied for FiT following the schemes introduction in April 2010, in order to qualify for the significant financial benefits accruing from it. The REPD records all PV projects over 50 kWp regardless of subsidy mechanism. Due to the potential of double-counting PV installations appearing within both the Ofgem report and REPD reports (
i.e., systems between 50 kWp and 5000 kWp receiving FiT), duplicate records in REPD were removed. All remaining records in the REPD were assumed to be subsidized through the only other available PV policy support, the renewables obligation (RO). We believe this assumption to be reasonable as grid parity in the UK has not yet been achieved; meaning that installing a PV system without a subsidy provides a very low return on investment. In line with this assertion, a discussion of UK subsidies for PV is presented in
Section 3. The analysis presented in this paper covers trends in PV deployment up to the end of 2013.
2.4. Databases
All of the data collected as inputs is then consolidated into two databases, the PV system database and the LSOA level database (shown in
Figure 1). The PV system database contains information on each PV system that has been installed, characterized by: location, market segment, subsidy mechanism, system capacity (e.g., kWp) and installation date. The PV systems database contains records of over 500,000 PV installations.
The LSOA level database provides a summary of the characteristics of each LSOA, including the total domestic and non-domestic building footprint areas (m2), the average annual irradiance, rurality classification and also a summary of the PV installed. The latter is derived from the PV systems database, and provides the total number and installed capacity (kWp) of PV for each market segment.
It is worthwhile to note that a number of the characteristics investigated at LSOA level, such as the amount of PV and building footprint coverage could change over time (as more PV is installed and new buildings are constructed). As such one important characteristics of this framework is the ability to update it. We update the PV system database quarterly as new information is released by Ofgem, this updated data is then used to refresh the LSOA level characteristics. Similarly as new land-use data becomes available (which currently only occurs every decade) we are able to include this into the database.
2.5. Outputs and Analytical Approach
The UKPVD enables investigation of both temporal and spatial trends in PV deployment. Irradiation, rurality and building-footprint are considered to be spatial variables (
i.e., they vary geographically), whereas policy—which has changed dynamically year-on-year (see
Section 3)—is considered as a temporal variable.
The temporal evolution of PV deployment is investigated on an annual basis for each market segment. This is then examined in conjunction with the introduction and evolution of the market pull policies outlined in
Section 3.
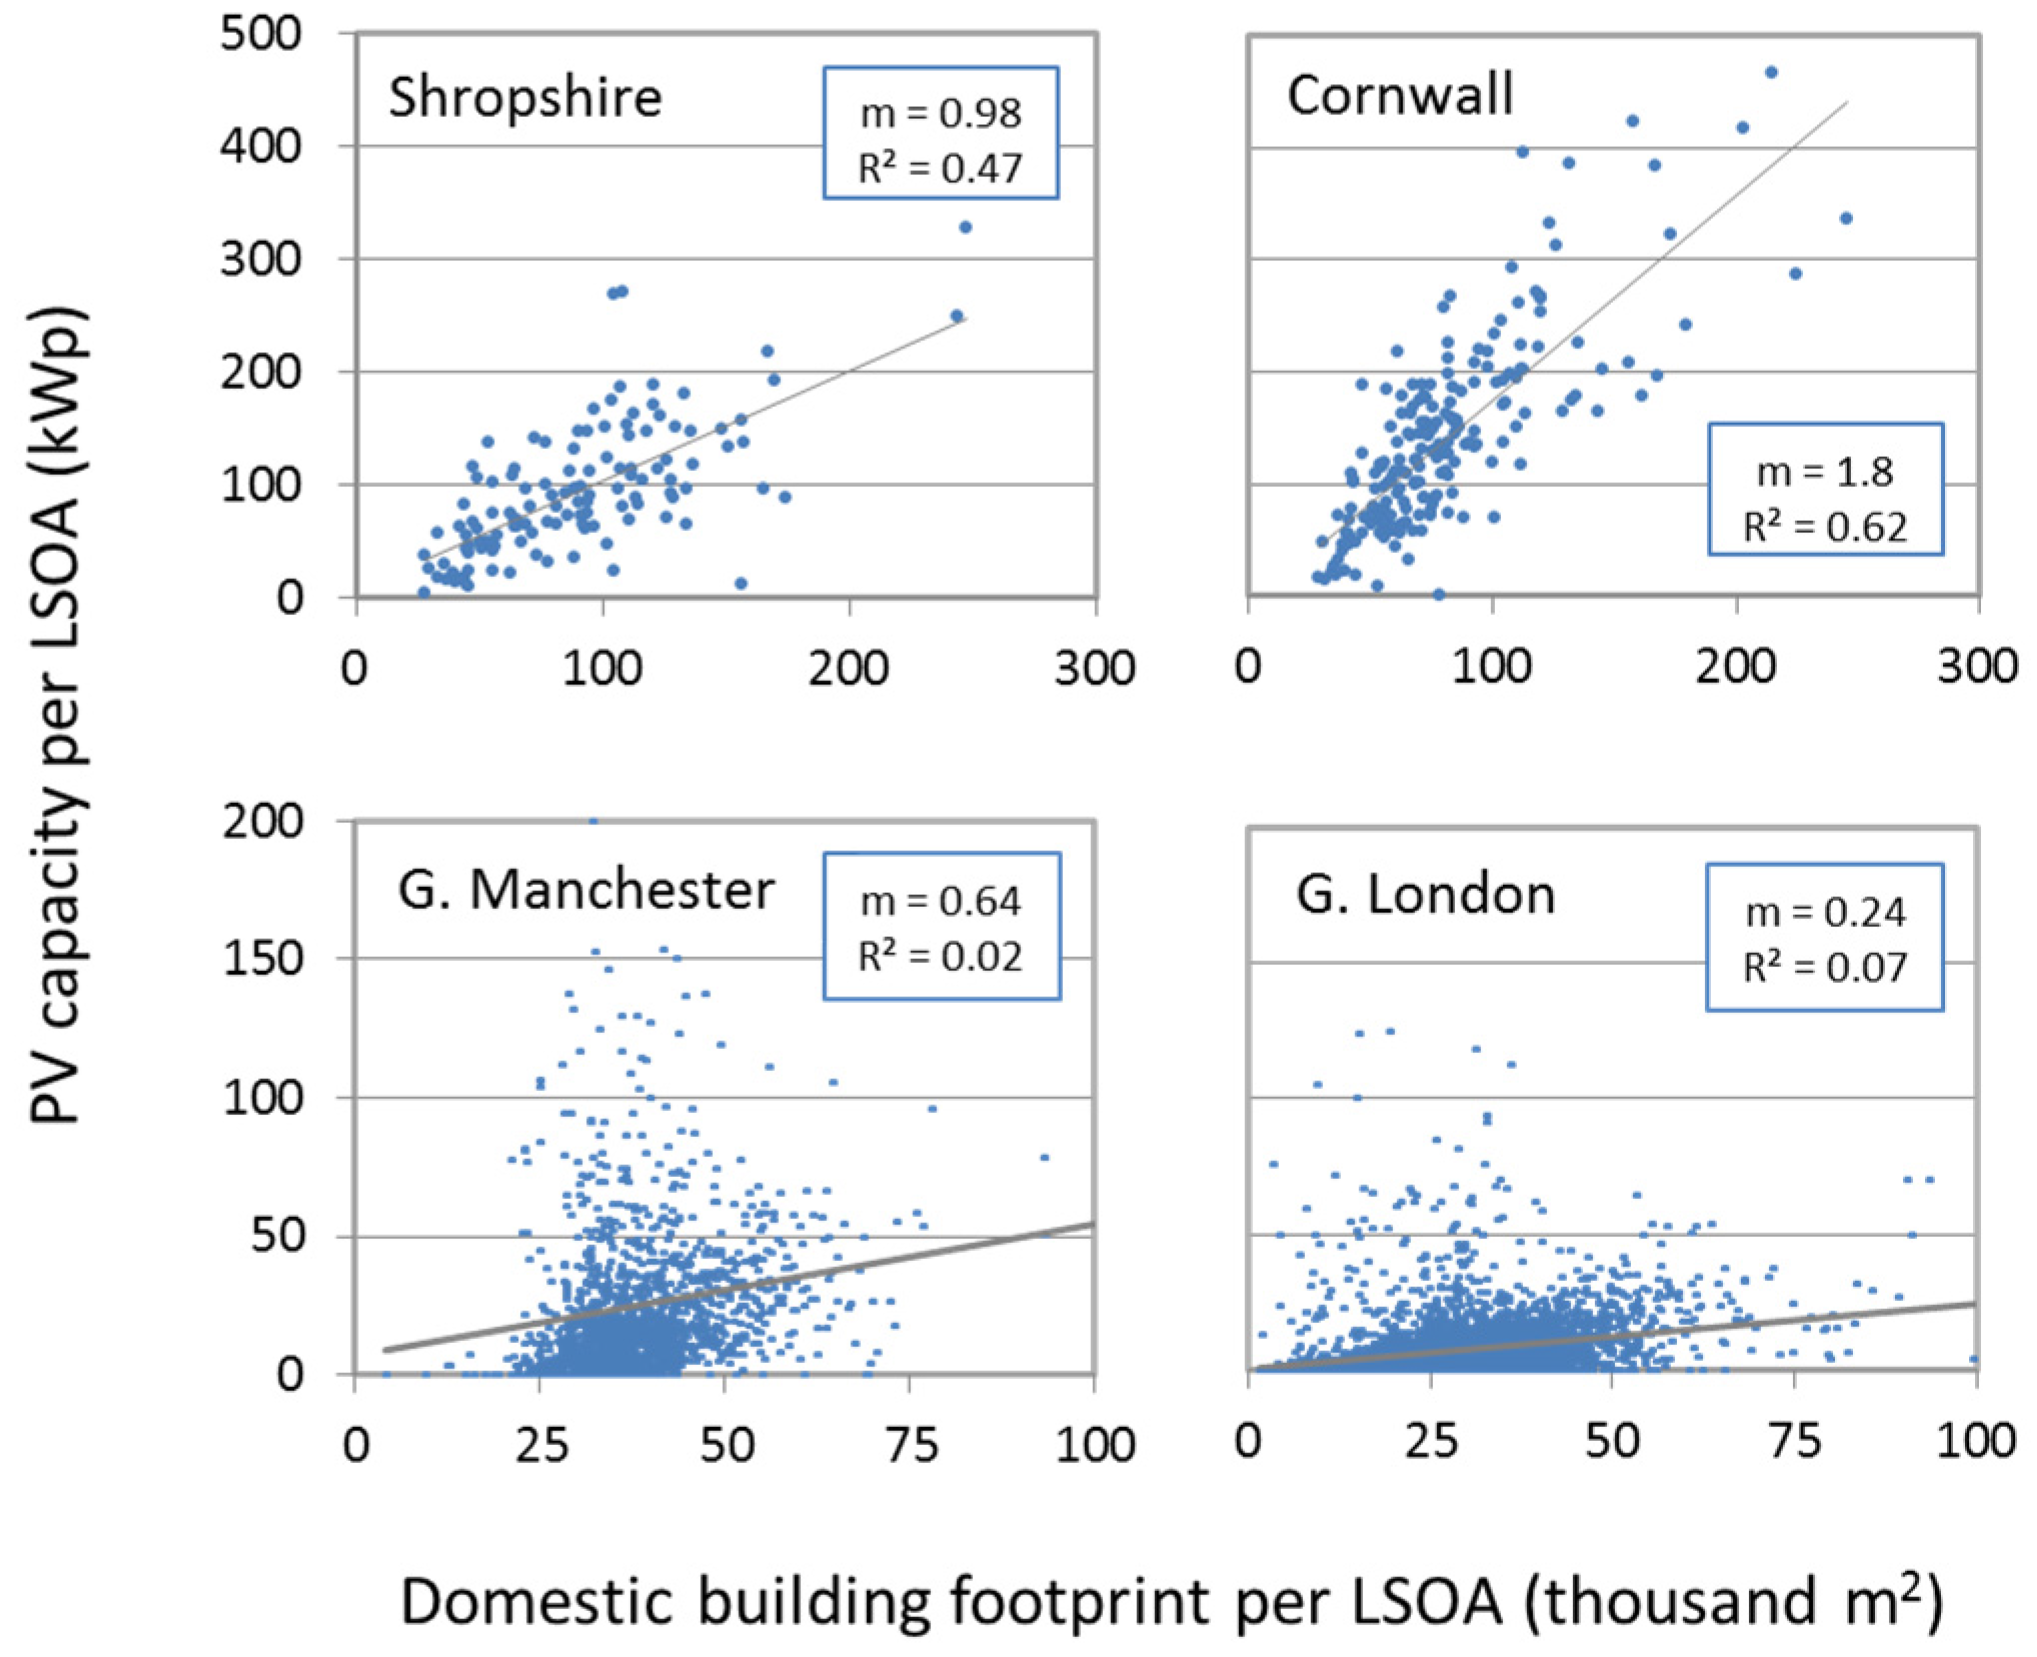
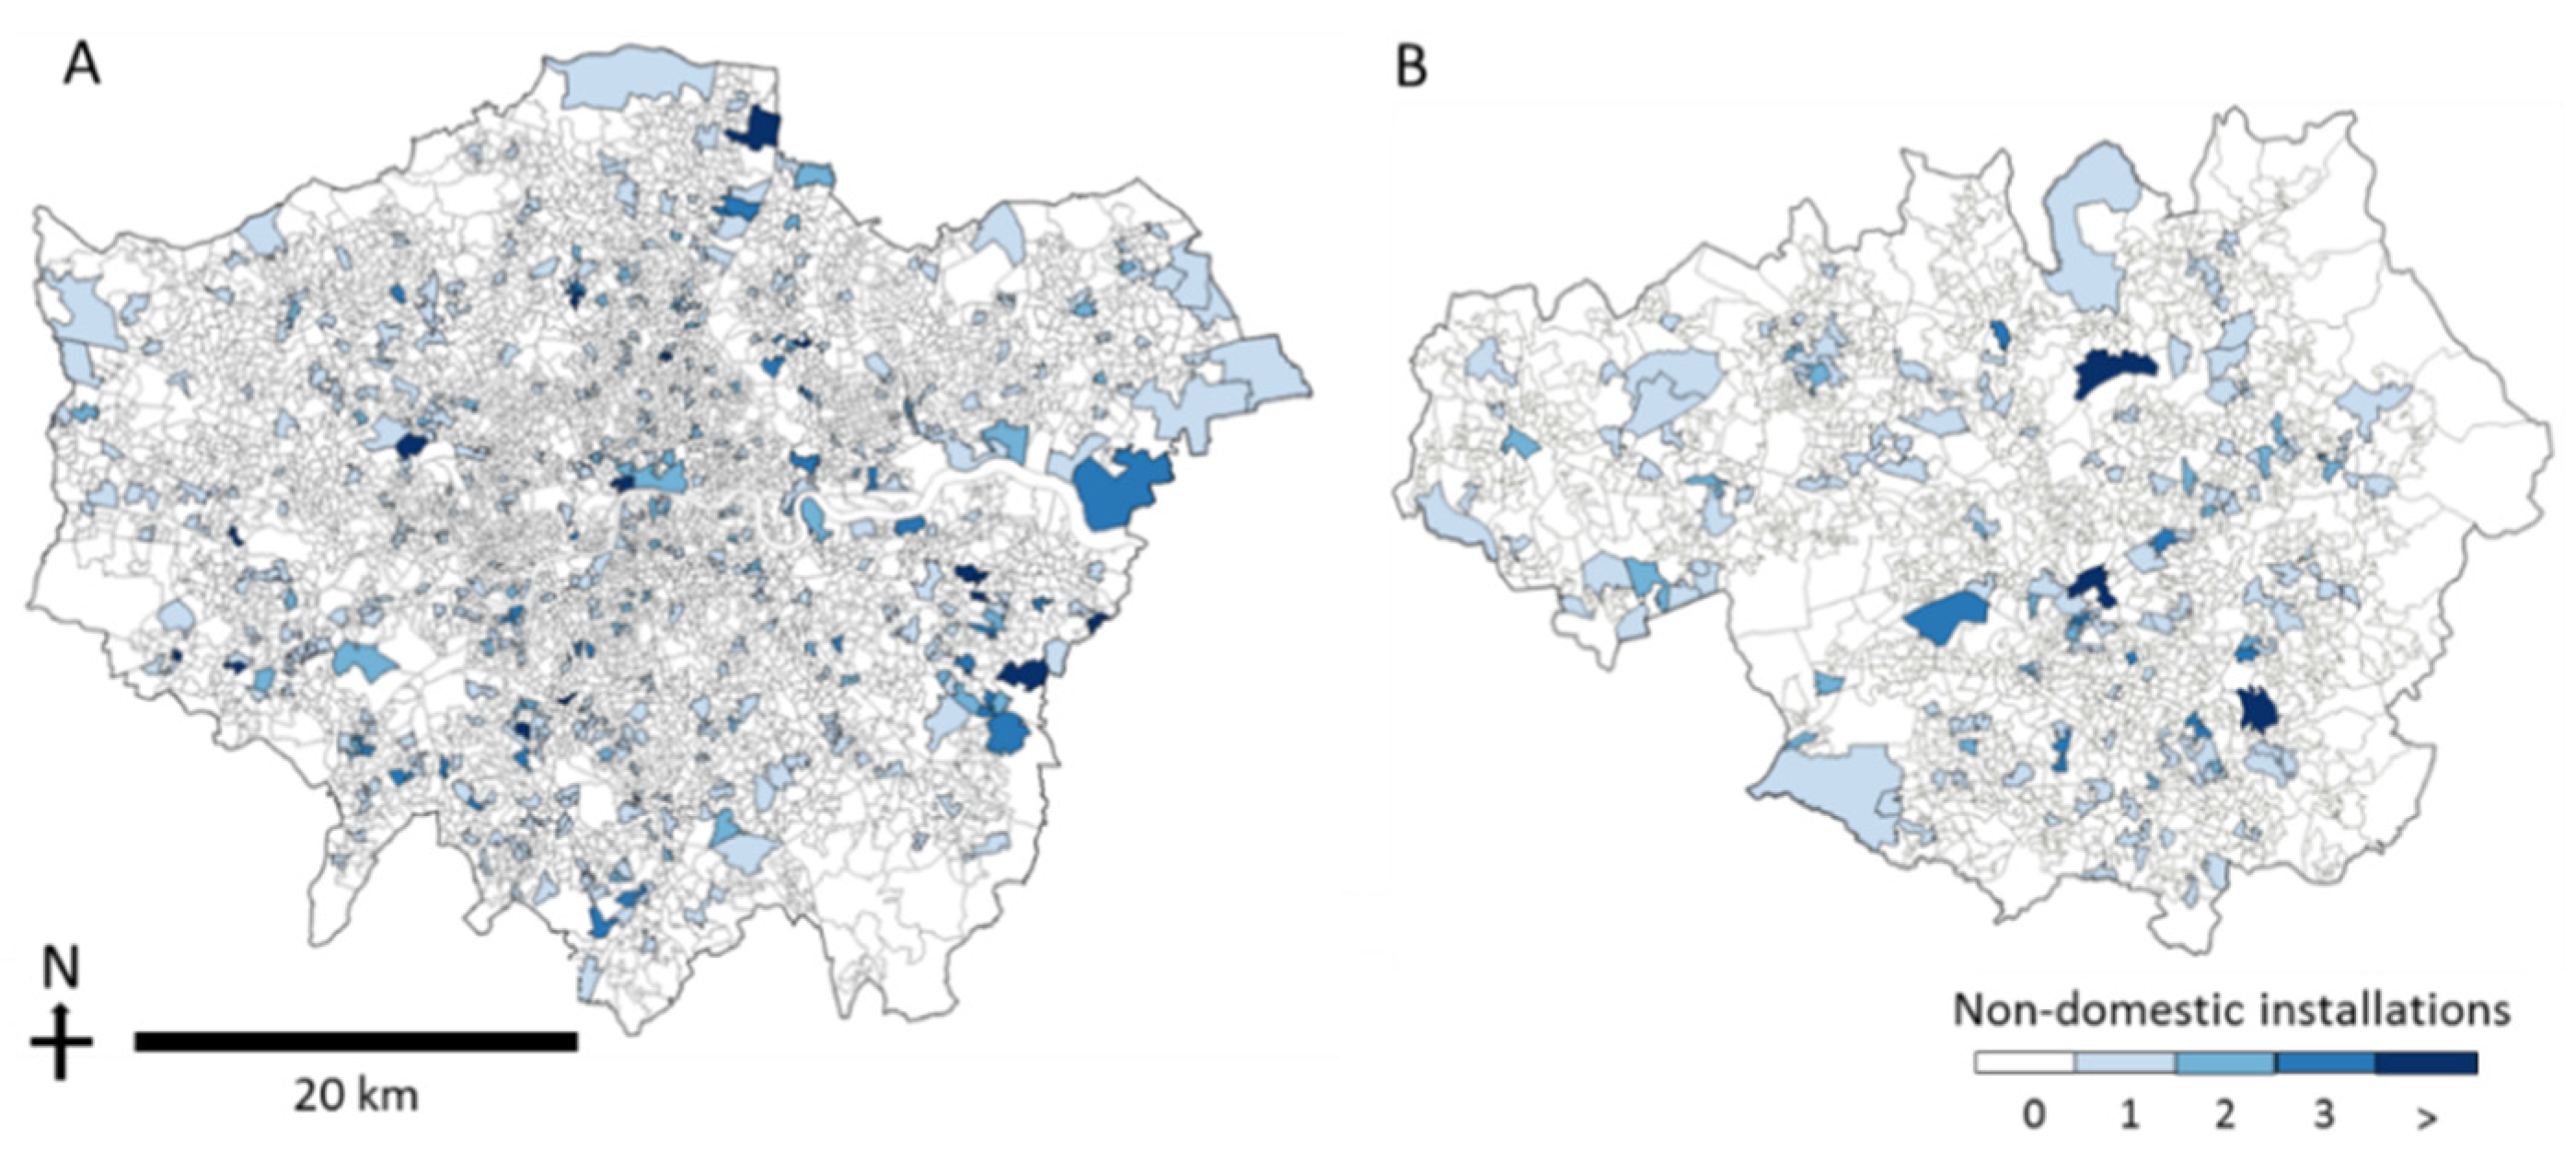
To investigate the spatial variation in deployment we use case study areas instead, as this enables more localized trends to be identified. In the case of the domestic and non-domestic PV markets we select four case studies to examine how PV deployment varied between rural/urban and high/low irradiation areas. The case studies are displayed in
Figure 2, two urban and two rural areas, for different levels of irradiation (the colour scheme on the central map denotes average annual irradiation and the colour scheme of left and right panels distinguishes urban and rural LSOA classification) We selected two highly urban case study regions, Greater London and Greater Manchester, as these are two of the largest metropolitan areas within England and Wales and collectively account for just under 17% of its total population [
22]. Greater London is significantly further south than Greater Manchester and as a result has higher annual irradiation (as demonstrated in
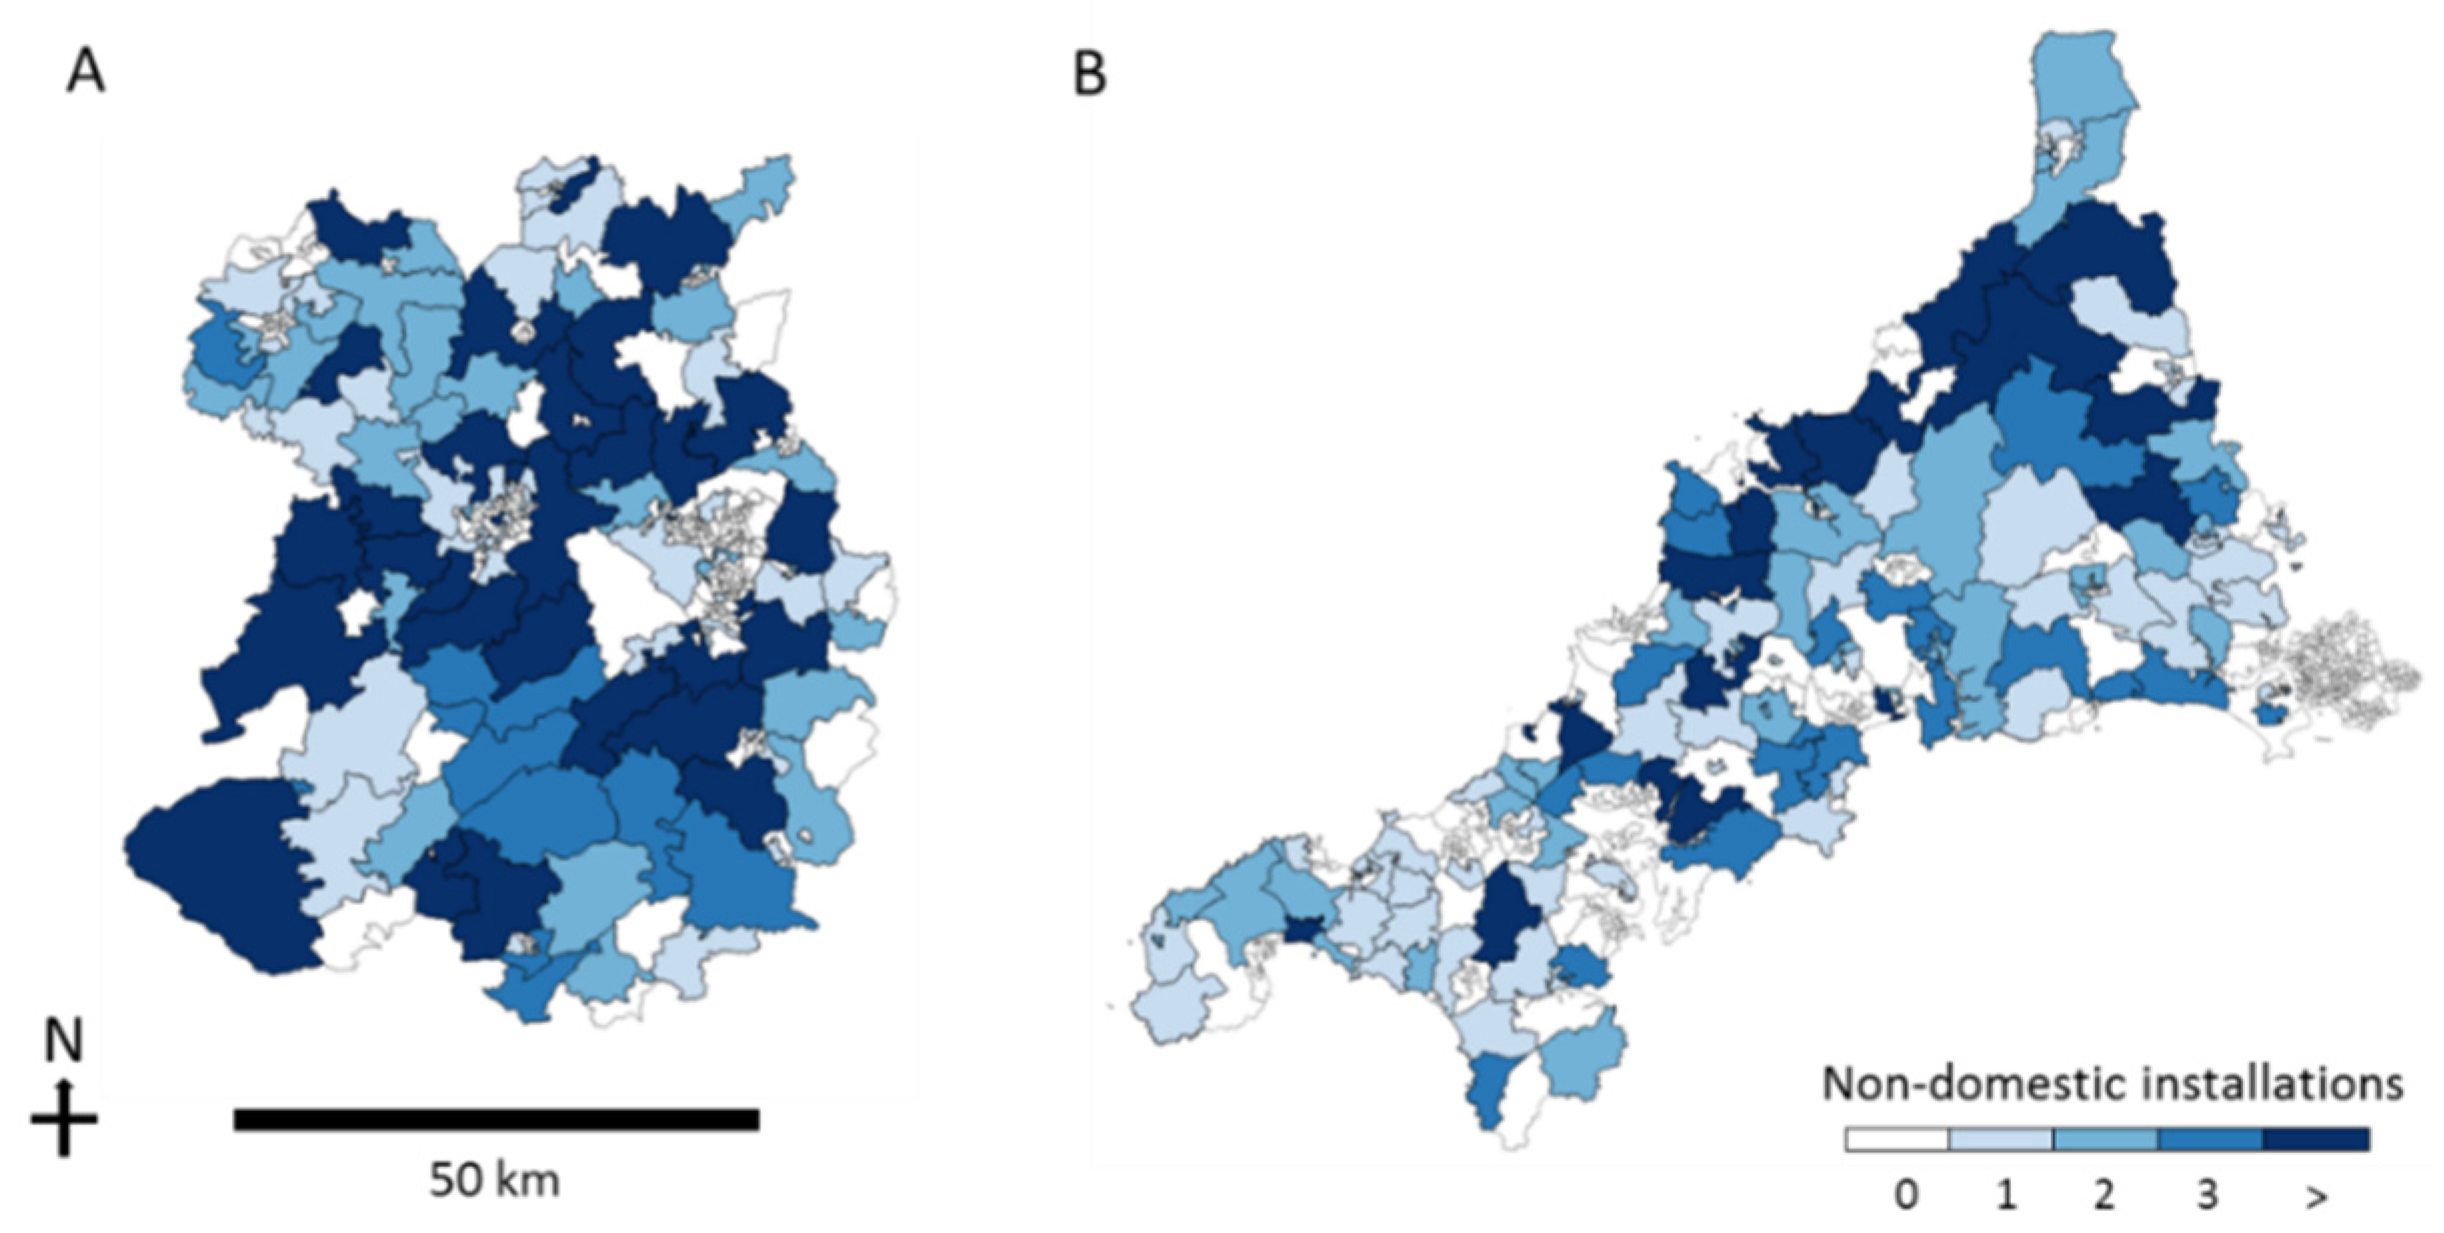
Figure 2) thus allowing us to compare PV deployment in similar urban areas but with different levels of irradiation. The selected rural regions are Cornwall and Shropshire. Cornwall was chosen as it has the highest irradiation in the UK (as shown in
Figure 2) and hence any effects of irradiation on PV deployment are expected to be most pronounced here. Shropshire was selected because of its lower irradiation, but similar distribution of LSOA rurality to Cornwall (shown by the similar range of colours in
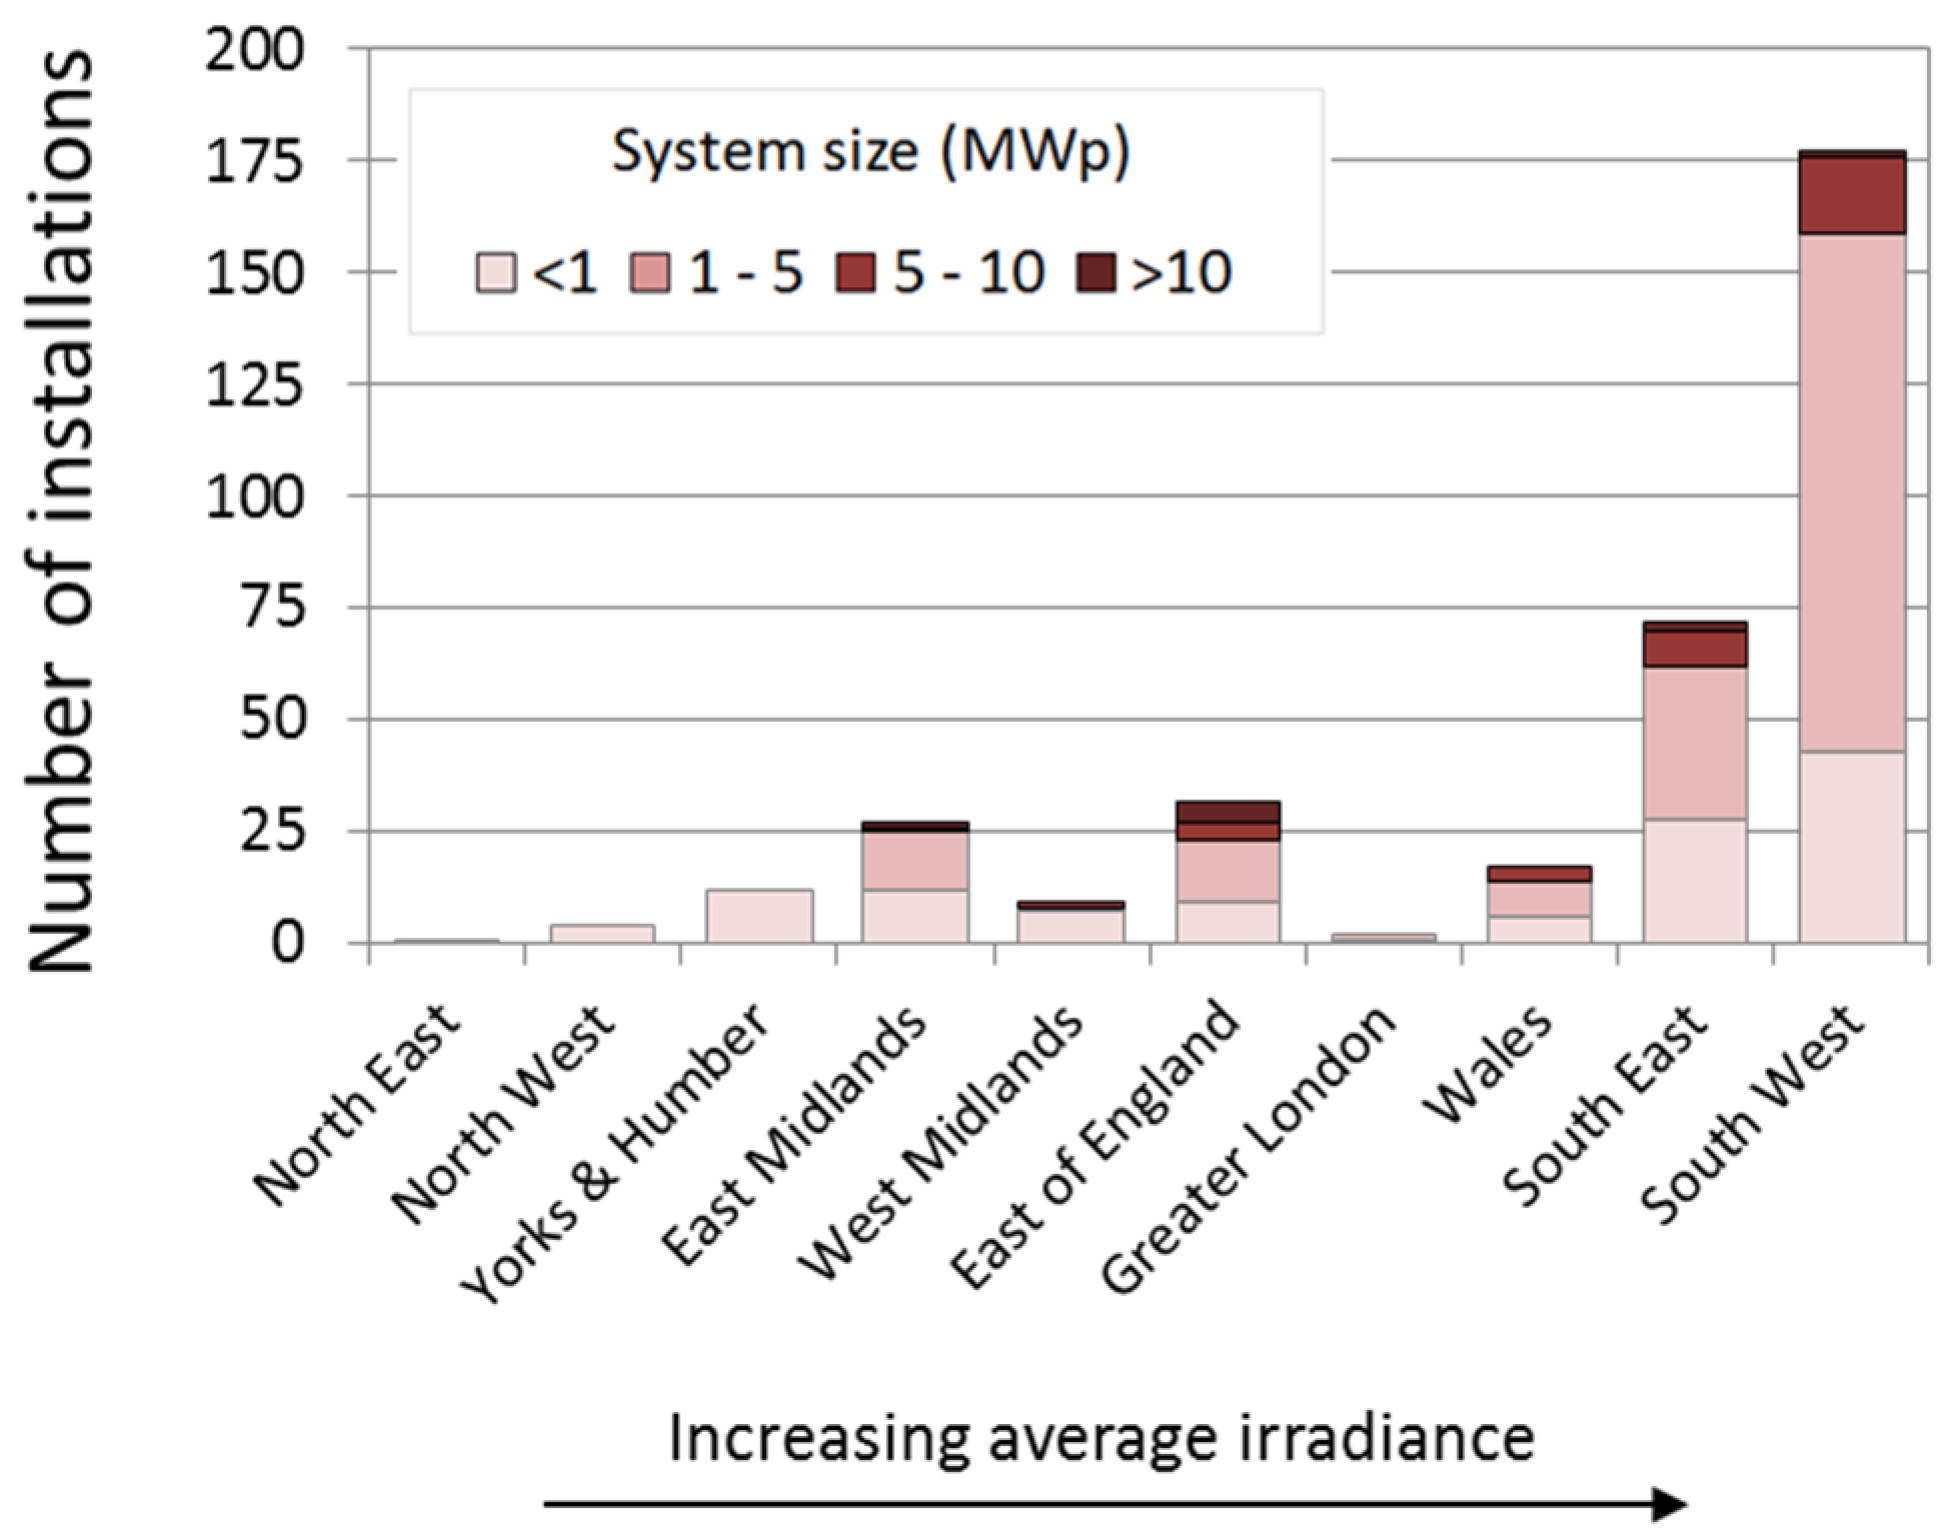
Figure 2, left), thus providing a spatial distribution of population comparable to Cornwall. The rural case studies incorporated the full counties of Cornwall and Shropshire with all urban LSOAs filtered out. In the case of ground-mounted PV we compare the deployment at a regional rather than LSOA level as the number of ground-mounted installations is significantly lower than the rooftop markets (see
Section 4). Thus the larger geographical areas provide a higher number of data per region, enabling a clearer comparison. For completeness and comparison of PV deployment across all market segments, domestic and non-domestic deployment is also mapped at a regional level. ONS definition of regions are used [
16]. PV system sizes (kWp) in the non-domestic and ground mount markets may vary significantly, due to the large possible variation in non-domestic building size and available land-area for ground mount PV. As a consequence of this we also characterize the sizes of PV systems in these markets within the spatially disaggregated analysis.
3. Policy Support for Photovoltaics in the UK
To date, policy support has been the main driver for PV deployment in the UK and, despite the dramatic reduction of PV prices in the recent years, PV grid parity has not yet been achieved and policy incentives are still needed for further PV uptake [
1,
23]. Hence, understanding UK PV deployment requires an understanding of the main PV policy support mechanisms introduced and their evolution over time (we here focus on the national policies implemented, as analysis of local government policy is outside the scope of this initial study). Their impact on PV deployment is then discussed in the
Section 4.
Initial policy support to PV deployment was introduced in 2000 through the domestic and large-scale field trails, then followed by the major demonstration programme (2002–2006) and the low carbon building programme (2006) [
24,
25]. In 2002 a policy to support a number of renewable technologies (including onshore wind and PV), known as the RO was introduced. The RO was introduced as a technology neutral support mechanism, meaning that generators of all eligible low-carbon technologies were able to claim one RO certificate (ROC) per MWh of generated electricity. Electricity suppliers were required to obtain a certain amount of ROCs relative to their total annual electricity supply, thereby creating demand for the certificates. However, the RO had relatively little uptake from less established technologies (e.g., PV) due in part to the complexity of the mechanism, which was ill-suited to less established, higher-risk technologies and industries comprised of smaller players [
26]. Following this relatively low uptake, the RO was re-banded in 2009, with less established technologies, including PV, receiving two ROCs per MWh, which was fixed until April 2013, an overview of the evolution of the RO is provided in
Table 1.
Table 1.
Renewables obligation (RO) policy evolution, number of ROC/MWh available for PV and ROC buy-out price (£/ROC). RO certificate: ROC.
Table 1.
Renewables obligation (RO) policy evolution, number of ROC/MWh available for PV and ROC buy-out price (£/ROC). RO certificate: ROC.
| Band | April 2002 | April 2009 | April 2013 | April 2014 | April 2015 | April 2016 |
|---|
| RO Introduced | Technology Specific | Split by Market Segment | <5 MWp |
|---|
| Ground-mount (Stand-alone) | 1 | 2 | 1.6 | 1.4 | 1.3 | 1.2 |
| Rooftop | 1 | 2 | 1.7 | 1.6 | 1.5 | 1.4 |
| Buy-out Price (£/ROC) | - | £ 37.19 | £ 42.02 | £ 43.30 | - | - |
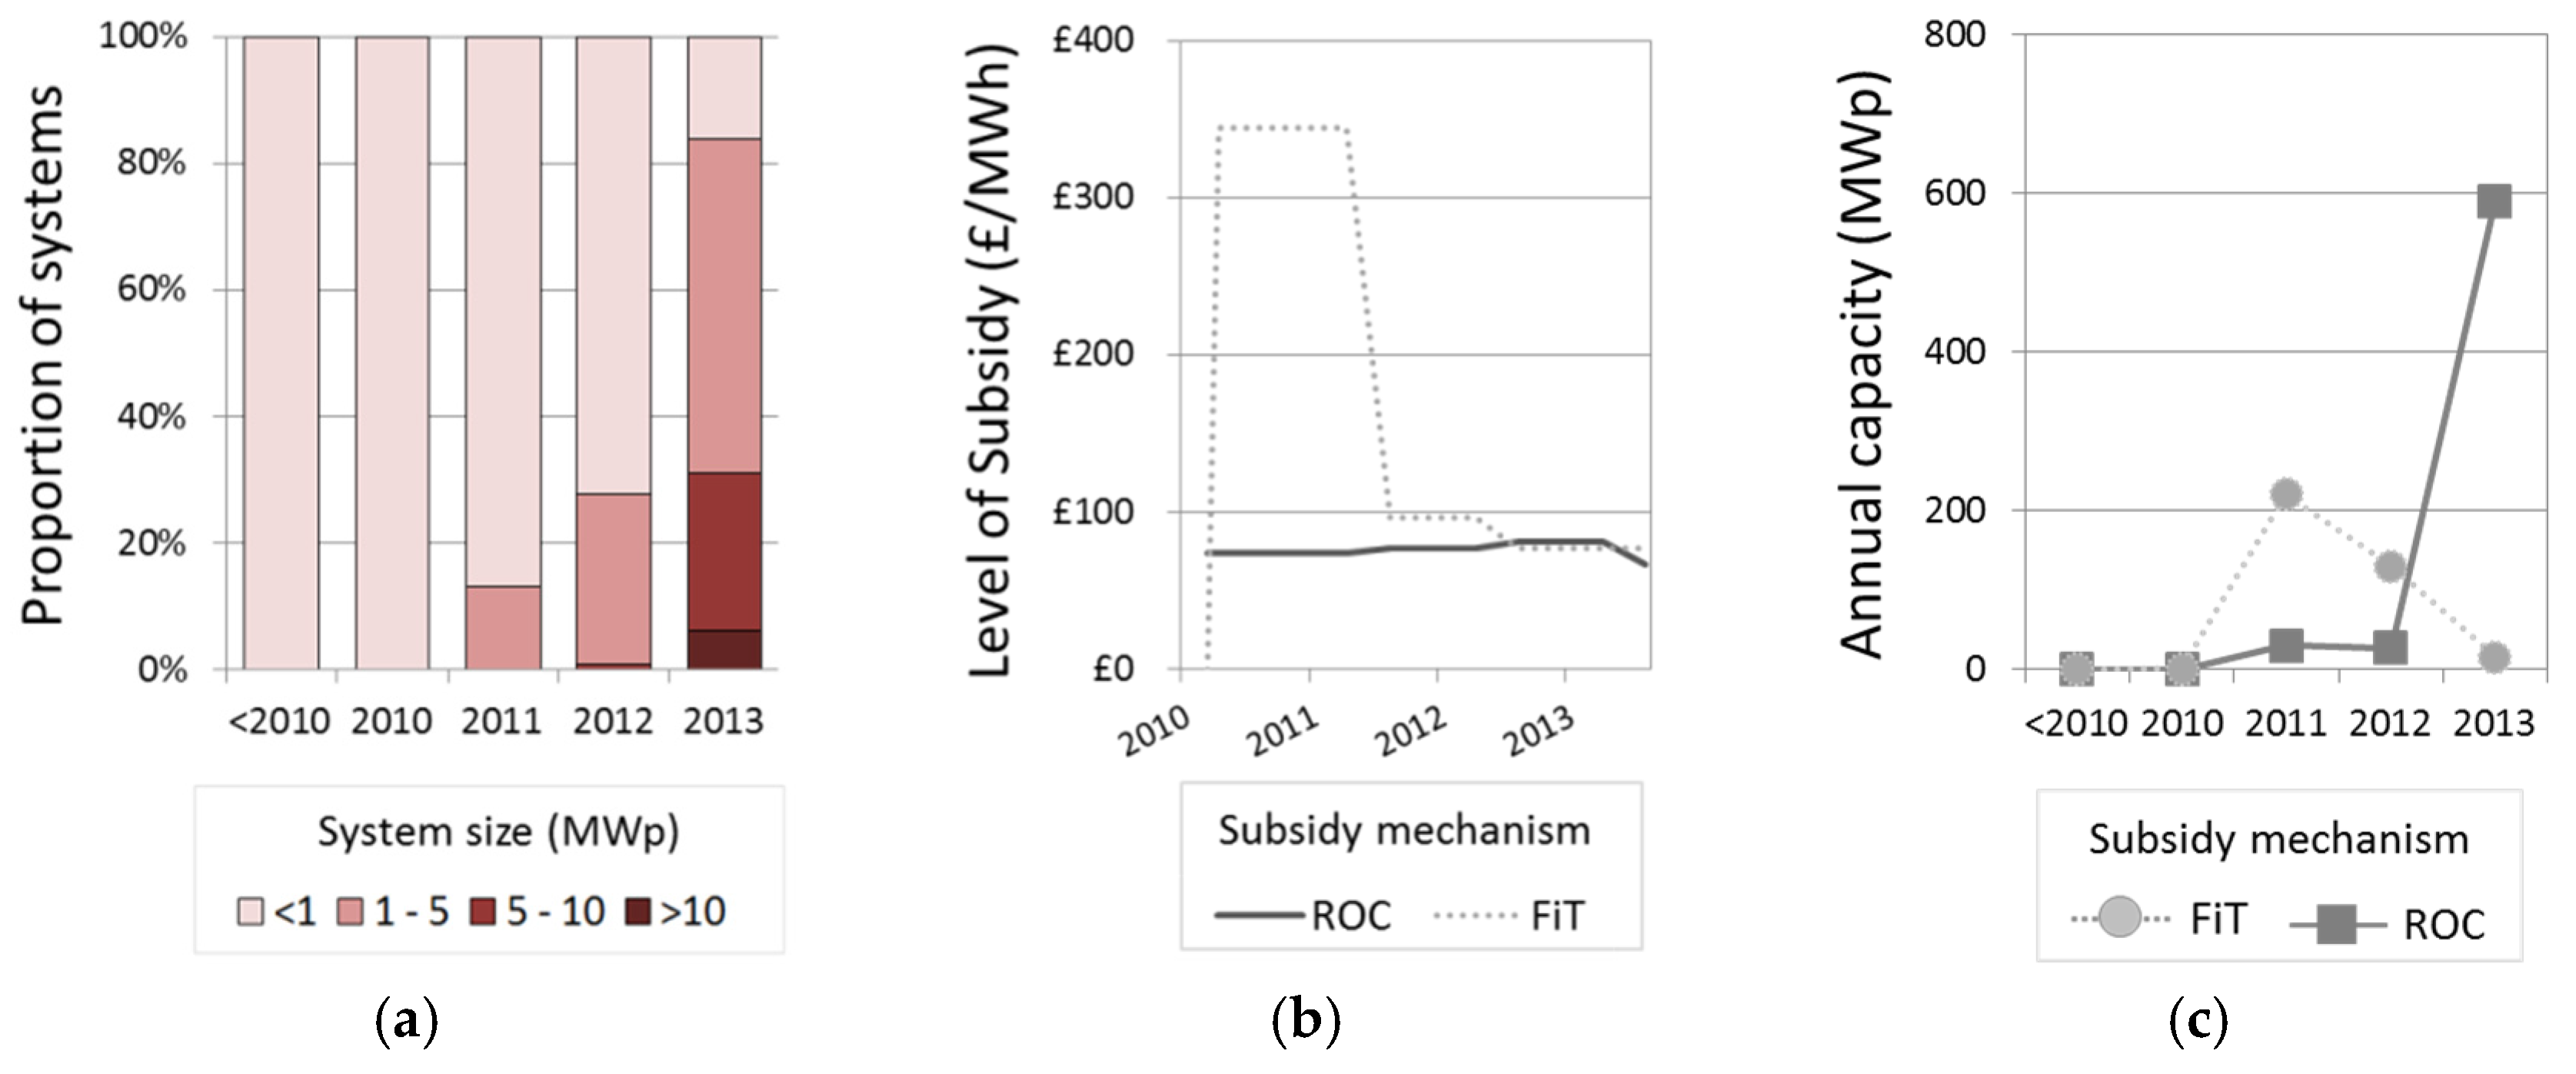
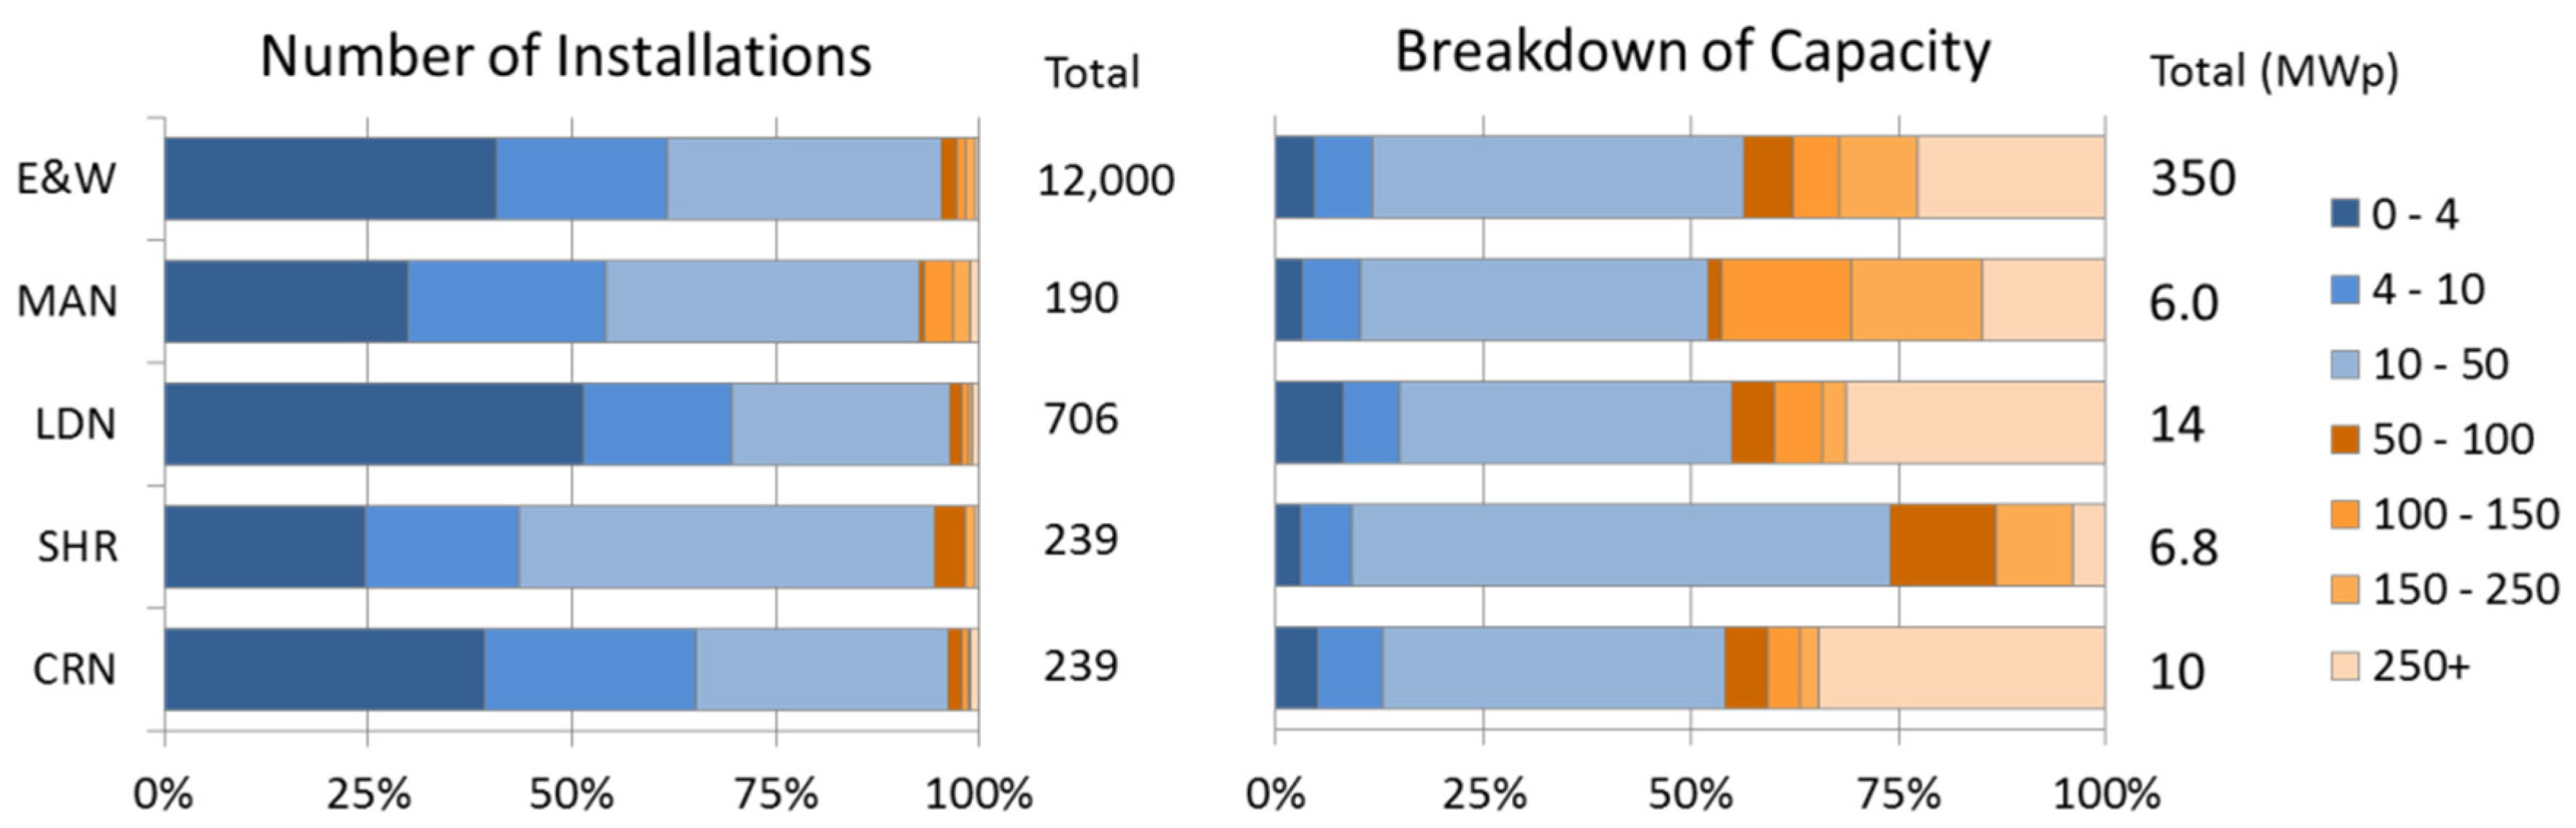
However, despite the re-banding of the RO, it was not until the introduction of the FiT scheme in April 2010 that PV deployment experienced significant growth. The FiT was designed to promote the deployment of PV systems below 5 MWp in capacity, it worked by paying electricity generators a premium tariff for each kWh of electricity they produced. The tariff paid is banded and dependent upon the capacity (kWp) of the generator, with the largest systems receiving the lowest tariff rate. The banding within the FiT is shown in
Table 2, along with the authors interpretation of how tariff bands relate to the market segments considered herein. The smallest band, 0–4 kWp, is expected to be the focus of the domestic market [
8]. The non-domestic rooftop market can encompass the entire range, e.g., 0–5000 kWp of system capacity (evidence of the actual break-down is in presented in
Section 4). Ground-mount PV systems are also eligible for the FiT, and are distinguished through a separate stand-alone banding.
Table 2.
Feed-in tariff banding and revisions for PV. Feed-in tariff: FiT.
Table 2.
Feed-in tariff banding and revisions for PV. Feed-in tariff: FiT.
| Tariff Band (kWp) | Proposed Market Segment a | April 2010 FiT Introduced Tariff (p/kWh) | August 2011 Fast-Track Review (% change) | February 2012 Comprehensive Review Phase 1 (% change) | August 2012 Comprehensive Review Phase 2A (% change) |
|---|
| 0–4 | Domestic | 48.07 | N/A | −54% | −24% |
| 4–10 | Domestic/non-domestic | 41.93 | N/A | −58% | −14% |
| 10–50 | Non-domestic | 36.53 | N/A | −56% | −11% |
| 50–100 | Non-domestic | 36.53 | −42% | −35% | −11% |
| 100–150 | Non-domestic | 34.10 | −38% | −35% | −11% |
| 150–250 | Non-domestic | 34.10 | −51% | −18% | −15% |
| 250–05000 | Non-domestic | 34.10 | −72% | N/A | −20% |
| Stand-alone | Ground-mount | 34.10 | −72% | N/A | −20% |
Further to the generation tariff, PV system owners were also paid for the electricity they exported back to the grid [
8]. Both components of the pricing were contracted for 25 years, with payments being made by the electricity supplier, who passed these costs onto their customers. Following the introduction of the FiT, the PV deployment across the UK was significantly higher than had initially been anticipated [
27], meaning the annual cost of supporting PV deployment was also higher than expected, presenting a challenge for government in the context of budgetary control. The high deployment was in part due to declining module prices, reducing the capital cost of PV systems [
2]. In February 2011 a review of the FiT was announced. This terminally comprised four separate stages, three of which were relevant to PV: the Fast-Track Review [
27] and Comprehensive Review Phase 1 [
28] and Comprehensive Review Phase 2A [
29].
The Fast-Track Review, implemented in August 2011, reduced considerably the level of FiT tariffs for systems above 50 kWp. This reduction was between 38% and 72%, with the biggest reductions for larger capacity bands.
Table 2 displays in the initial rates of FiT and the percentage reduction, based on previous rate. The reduction was rationalised by DECC as “ensuring that the scheme continues to support the range of small- scale installations for which it was designed” [
27] and was implemented six months after the initial review announcement.
In February 2012 Comprehensive Review Phase 1 came into effect, reducing the FiT tariffs for all PV systems below 250 kWp in capacity, with reductions of up to 58% for systems under 4 kWp (i.e., predominantly domestic PV). In addition, the review linked FiT rate to the buildings energy efficiency, whereby only more efficient buildings could claim the highest FiT rate.
Comprehensive Review Phase 2A, implemented 1 August 2012, reduced the length of the FiT from 25 years to 20 years, and importantly, introduced a triggered degression mechanism. In this mechanism, market activity, not policy intervention provided the degression of the tariff. For example, if quarterly deployment in a certain band (e.g., 0–4 kWp) surpasses a deployment threshold, then a percentage decrease in FiT rate for the subsequent period will occur, thereby providing a degree of self-regulation, which is more visible to the market.
Amidst FiT reviews, in 2013 the RO was also reformed [
30] with the banding for PV was split into distinct categories for ground-mount and rooftop PV, with the rooftop systems receiving a higher ROC rate. This decision was based on the acknowledgement by DECC that building mounted systems requires higher levels of support when compared to ground-mounted ones. Additionally, as of April 2015, recent amendments to ROC eligibility criteria mean that only PV systems below 5 MWp will be eligible for the RO [
31]. After this amendment large PV systems (>5 MWp), will be eligible to bid into the new contract for difference (CfD) mechanism, where they will compete in a technology neutral auction process to acquire contracts for electricity generation at a fixed “strike” price.
This changing landscape currently leaves PV with various potential subsidy mechanisms, depending on the system size and market segment. For example, all systems below 50 kWp in size are eligible for FiT. Whereas systems between 50 kWp and 5 MWp are eligible for FiT or RO; in the case of FiT the level of support depends on the system capacity (with larger systems receiving lower FiT rates), whereas the RO depends on the market segment, with building mounted system receiving more ROCs. The impact of the introduction and revision of the FiT and RO upon PV deployment in the different market segments is discussed in the following section. In the analysis presented below (i.e., pre 2014) it is worthwhile to note that systems above 5 MWp were still eligible for the RO.
5. Conclusions
In conclusion, we have developed and demonstrated a novel GIS-based framework to map and analyze trends in PV deployment across all locations and market segments within the UK. The high spatio-temporal resolution of this analysis has provided a novel tool to analyze this evolving deployment from bottom up and in detail, presenting—to our knowledge—the first comparison of PV deployment across all UK market segments.
The analysis highlights a number of key findings about deployment. Firstly, that the non-domestic rooftop market is significantly under-developed compared to the domestic and ground-mount markets. Additionally, the investigation showed that PV deployment across the UK is highly diverse. At a local level, small areas of high PV deployment were identified. At a regional level the composition of installed PV by market segment varied significantly. These differences are important as they reveal how the benefits from solar photovoltaics are spread across different areas and markets, for example how households and businesses benefit. Furthermore, the findings reinforce the importance of disaggregating PV deployment to sensitive spatial resolution and by market segment in order to build a realistic picture of what this deployment actually looks like.
The relationship of PV deployment with policy, irradiation, rurality and building footprint were examined revealing a number of common trends across market segments. Firstly, the role of market-pull policies has been instrumental in stimulating deployment in all markets. Interestingly markets have responded differently to these policies. The non-domestic market has consistently had the lowest deployment, whereas the ground-mount market grew quickly and transitioned from utilizing the FiT to the RO as larger projects became more viable. Similarly all market segments demonstrated a positive relationship with irradiation, with the strongest effect in the ground-mount market, and weakest effect in the domestic market. Deployment in all markets was higher in rural areas, which hosted virtually all ground-mount PV and had higher utilization of building footprint for domestic and non-domestic PV.
While the framework has provided a valuable step to characterise PV deployment, it is worthwhile to note its limitations and how these could be overcome in future works. Firstly, the spatial framework used (e.g., LSOAs) aggregates PV deployment across groups of around 600 households and cannot capture more localised trends (such as how PV is spread between two adjacent streets). Being able to picture and analyse these differences may be useful to examine more clearly the factors shaping deployment. Additionally, the analysis considered building coverage as a constant over time. While this is a pragmatic assumption for the analysis presented here (due to data availability), the framework could be enhanced by characterising how such variables change over time, e.g., to capture urbanization trends or changes in building use. If an online database of such information was available the framework could be automatically updated with this information.
We also acknowledge that this study focused on a subset of variables on PV deployment, and as such does not provide a comprehensive picture of all factors that have driven PV deployment to date. Future analysis could investigate how PV deployment is influenced by the proportion of owner-occupied households across the UK, or differences in local planning policy. The framework and case studies developed here would provide a useful platform for such analysis. Indeed, if a wider range of variables can be identified and measured they could be added to the framework to provide deeper understanding of PV deployment drivers and future trends (e.g., by performing econometric analysis on the large dataset developed).
The framework could also be used to understand the impacts of PV deployment. For example, it could be used to map PV deployment against the level of fuel poverty in order to assess whether and under which conditions distributed generation could help in improving access to energy across the UK. This work would provide evidence on impacts of current policy support to PV deployment as well as valuable insight to shape future policies on both distributed generation and fuel poverty reduction. Similarly, the framework will be used to assess the impacts of PV deployment on local electricity networks by overlaying maps of PV generation with those of electricity demand. In addition the framework could be extended to account for broader ranges of technologies. For example, one area of emerging PV innovation is building integrated PV (BIPV), where PV generating materials can be incorporated into building facades,
etc. [
37]. The framework could hence be adapted to investigate building facade area as well as roof space to consider how much PV could be installed in the future [
38]. More broadly the methodology would be useful to consider other energy technologies, such as combined heat and power (CHP) which can also be applied at domestic and non-domestic building scale and at a district-level. This combined approach would be valuable to consider the real impacts of low-carbon technology deployment and how it may be managed in the future.


