3.1. Physicochemical Properties
The porous texture of the samples was characterized with N
2 gas adsorption. Before analysis, the samples were degassed at 100 °C for 12 h. Brunauer-Emmett-Teller, BET equation was applied to the obtained isotherms to calculate their corresponding surface areas [
35]. The data obtained from N
2 gas adsorption are compiled in
Table 1. All the electrocatalysts show low S
BET surface areas, which range between 44 and 74 m
2·g
−1. Among the samples without Zn, the effect of Fe, Co, and Ni as metallic doping of the carbon support is directly proportional to the atomic radius of the metal, in which the NiCo
2O
4/Fe-CX sample is the one with the largest surfaces and pore volumes. However, it is very interesting that the Zn-containing composites have the lowest values of surface areas and pore volume, especially the Zn-Ni-Co/Co-CX sample.
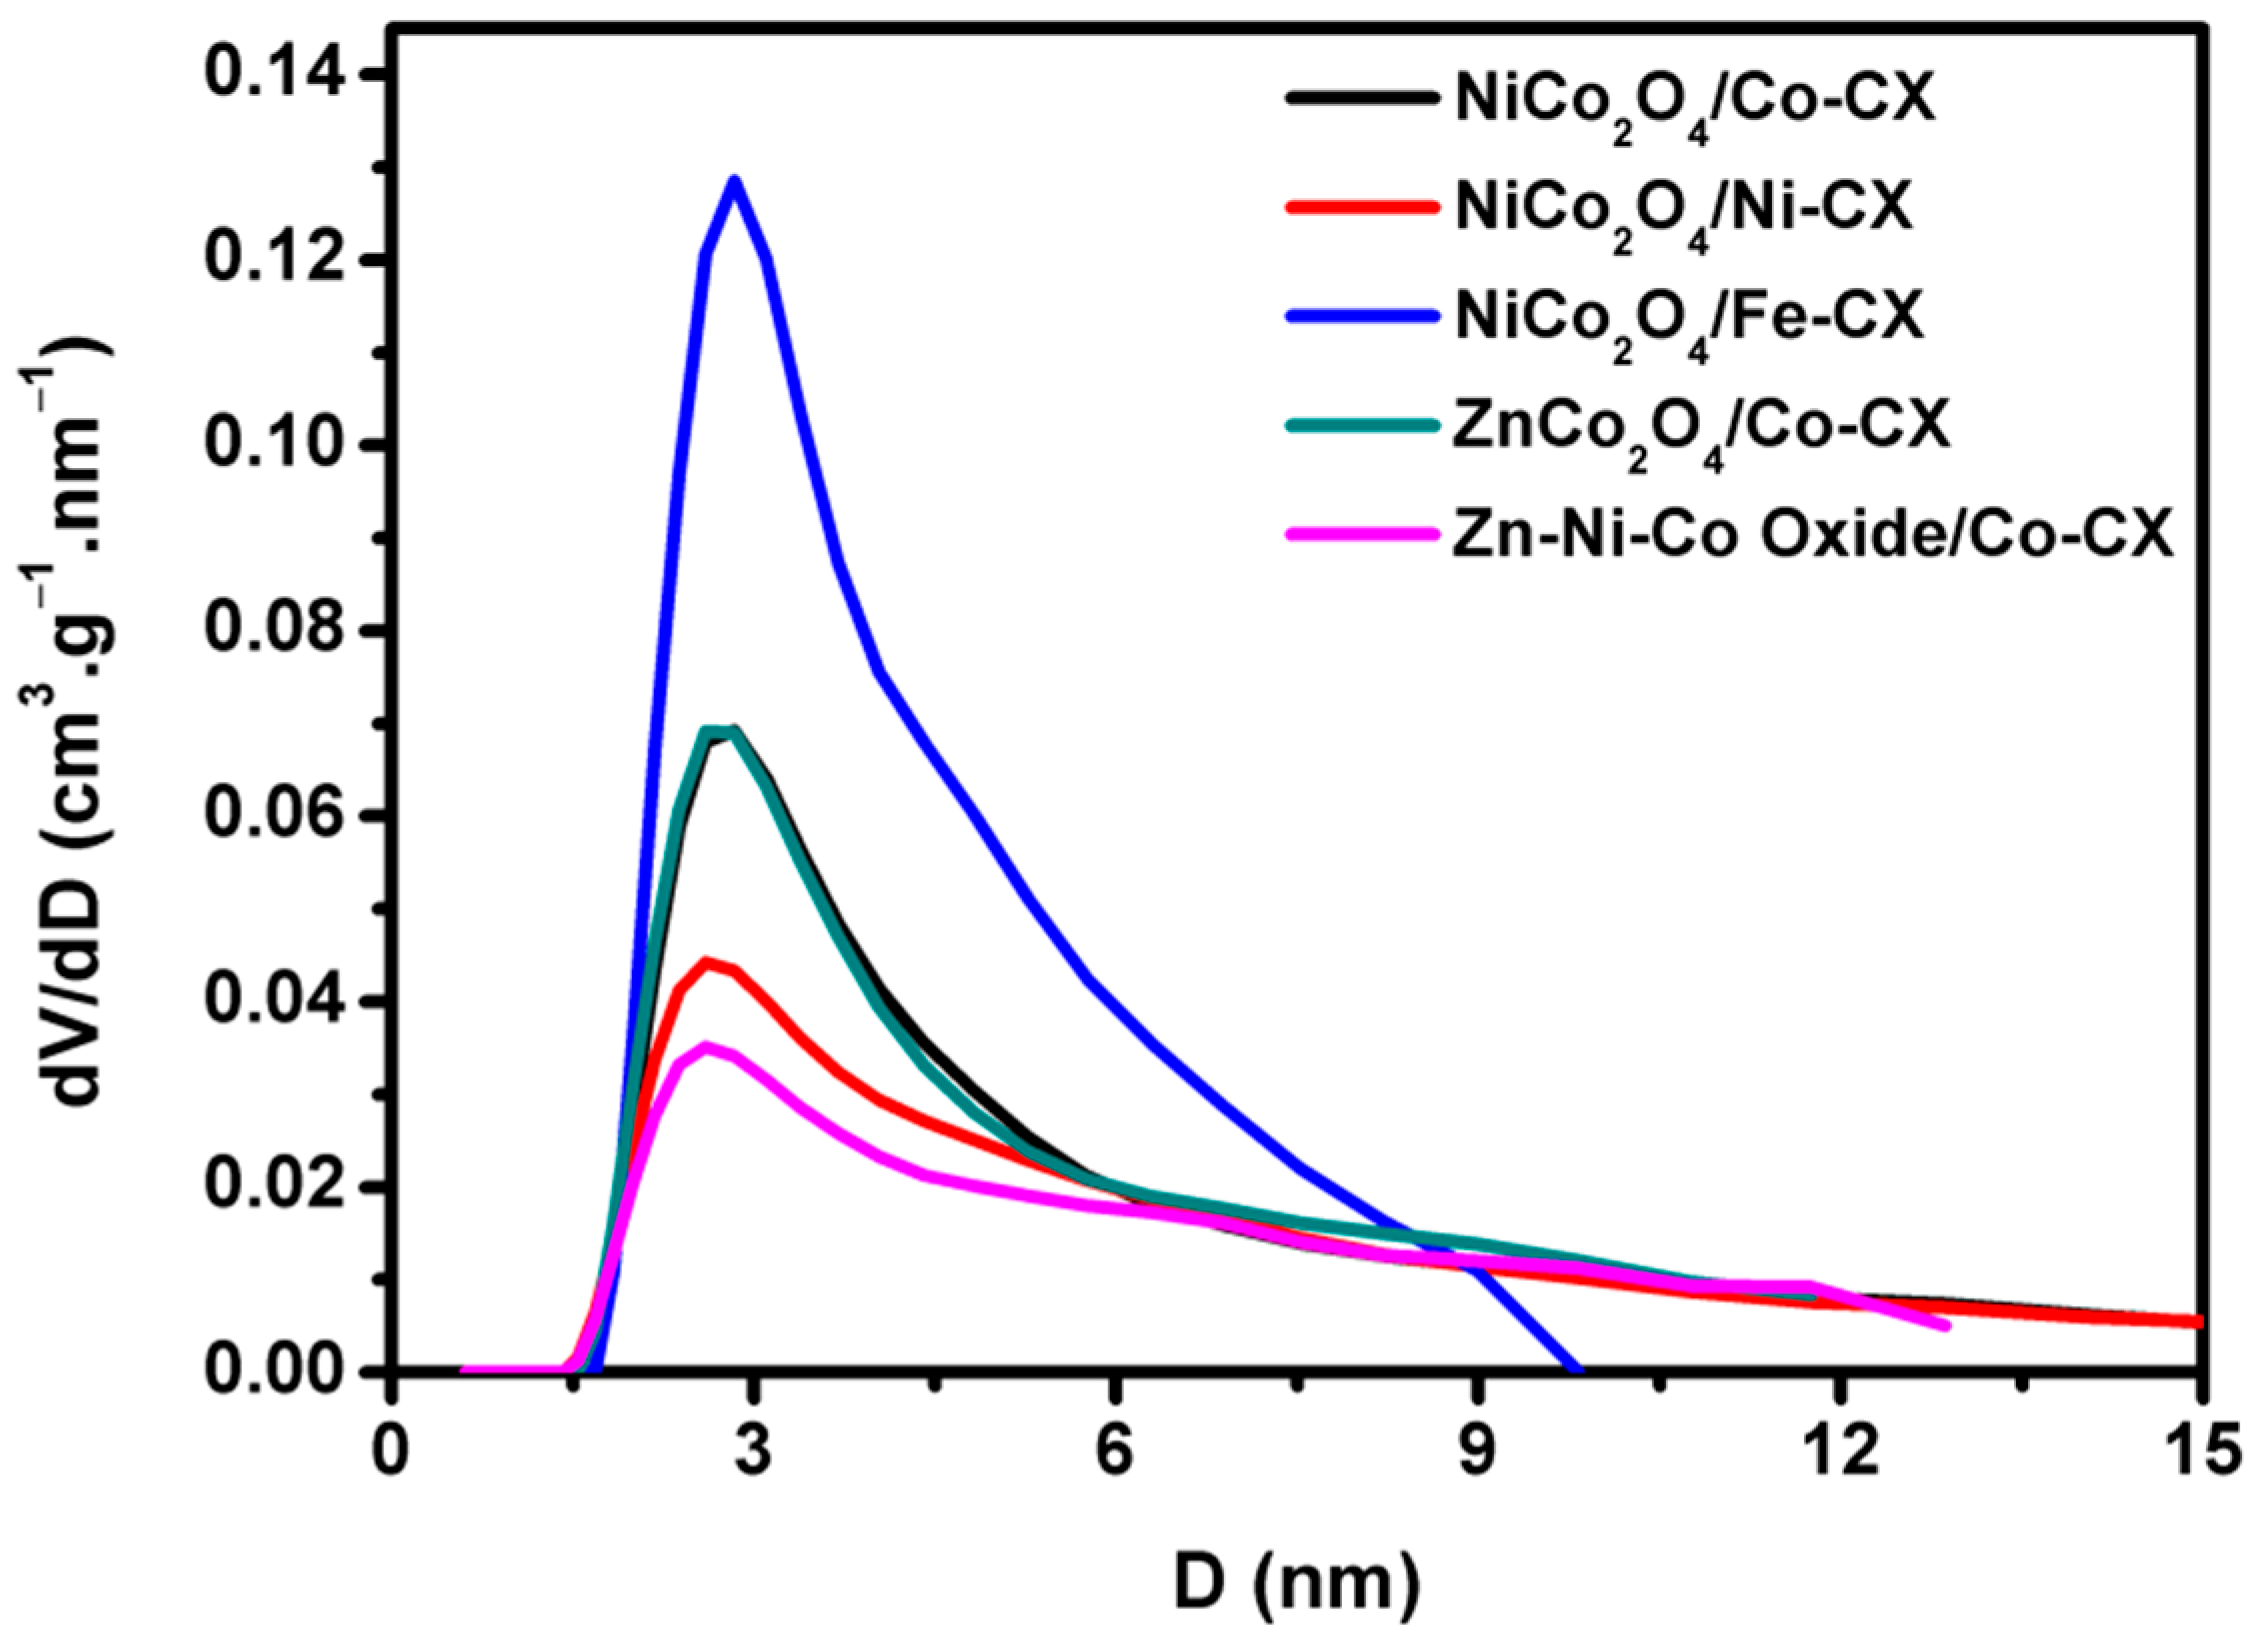
Pore size distributions were determined by applying quenched solid density functional theory (QSDFT) to the N
2 adsorption data (
Figure 1) [
36]. In this figure, we can observe that the main pore size of these composites is situated in the limit between the micropore and mesopore values, in which Zn–Ni–Co/Co–CX was the composite with a pore size distribution more shifted to the microporous range and the QSDFT surface areas (S
DFT) were ranging from 79 to 201 m
2.g
−1, as shown in
Table 1.
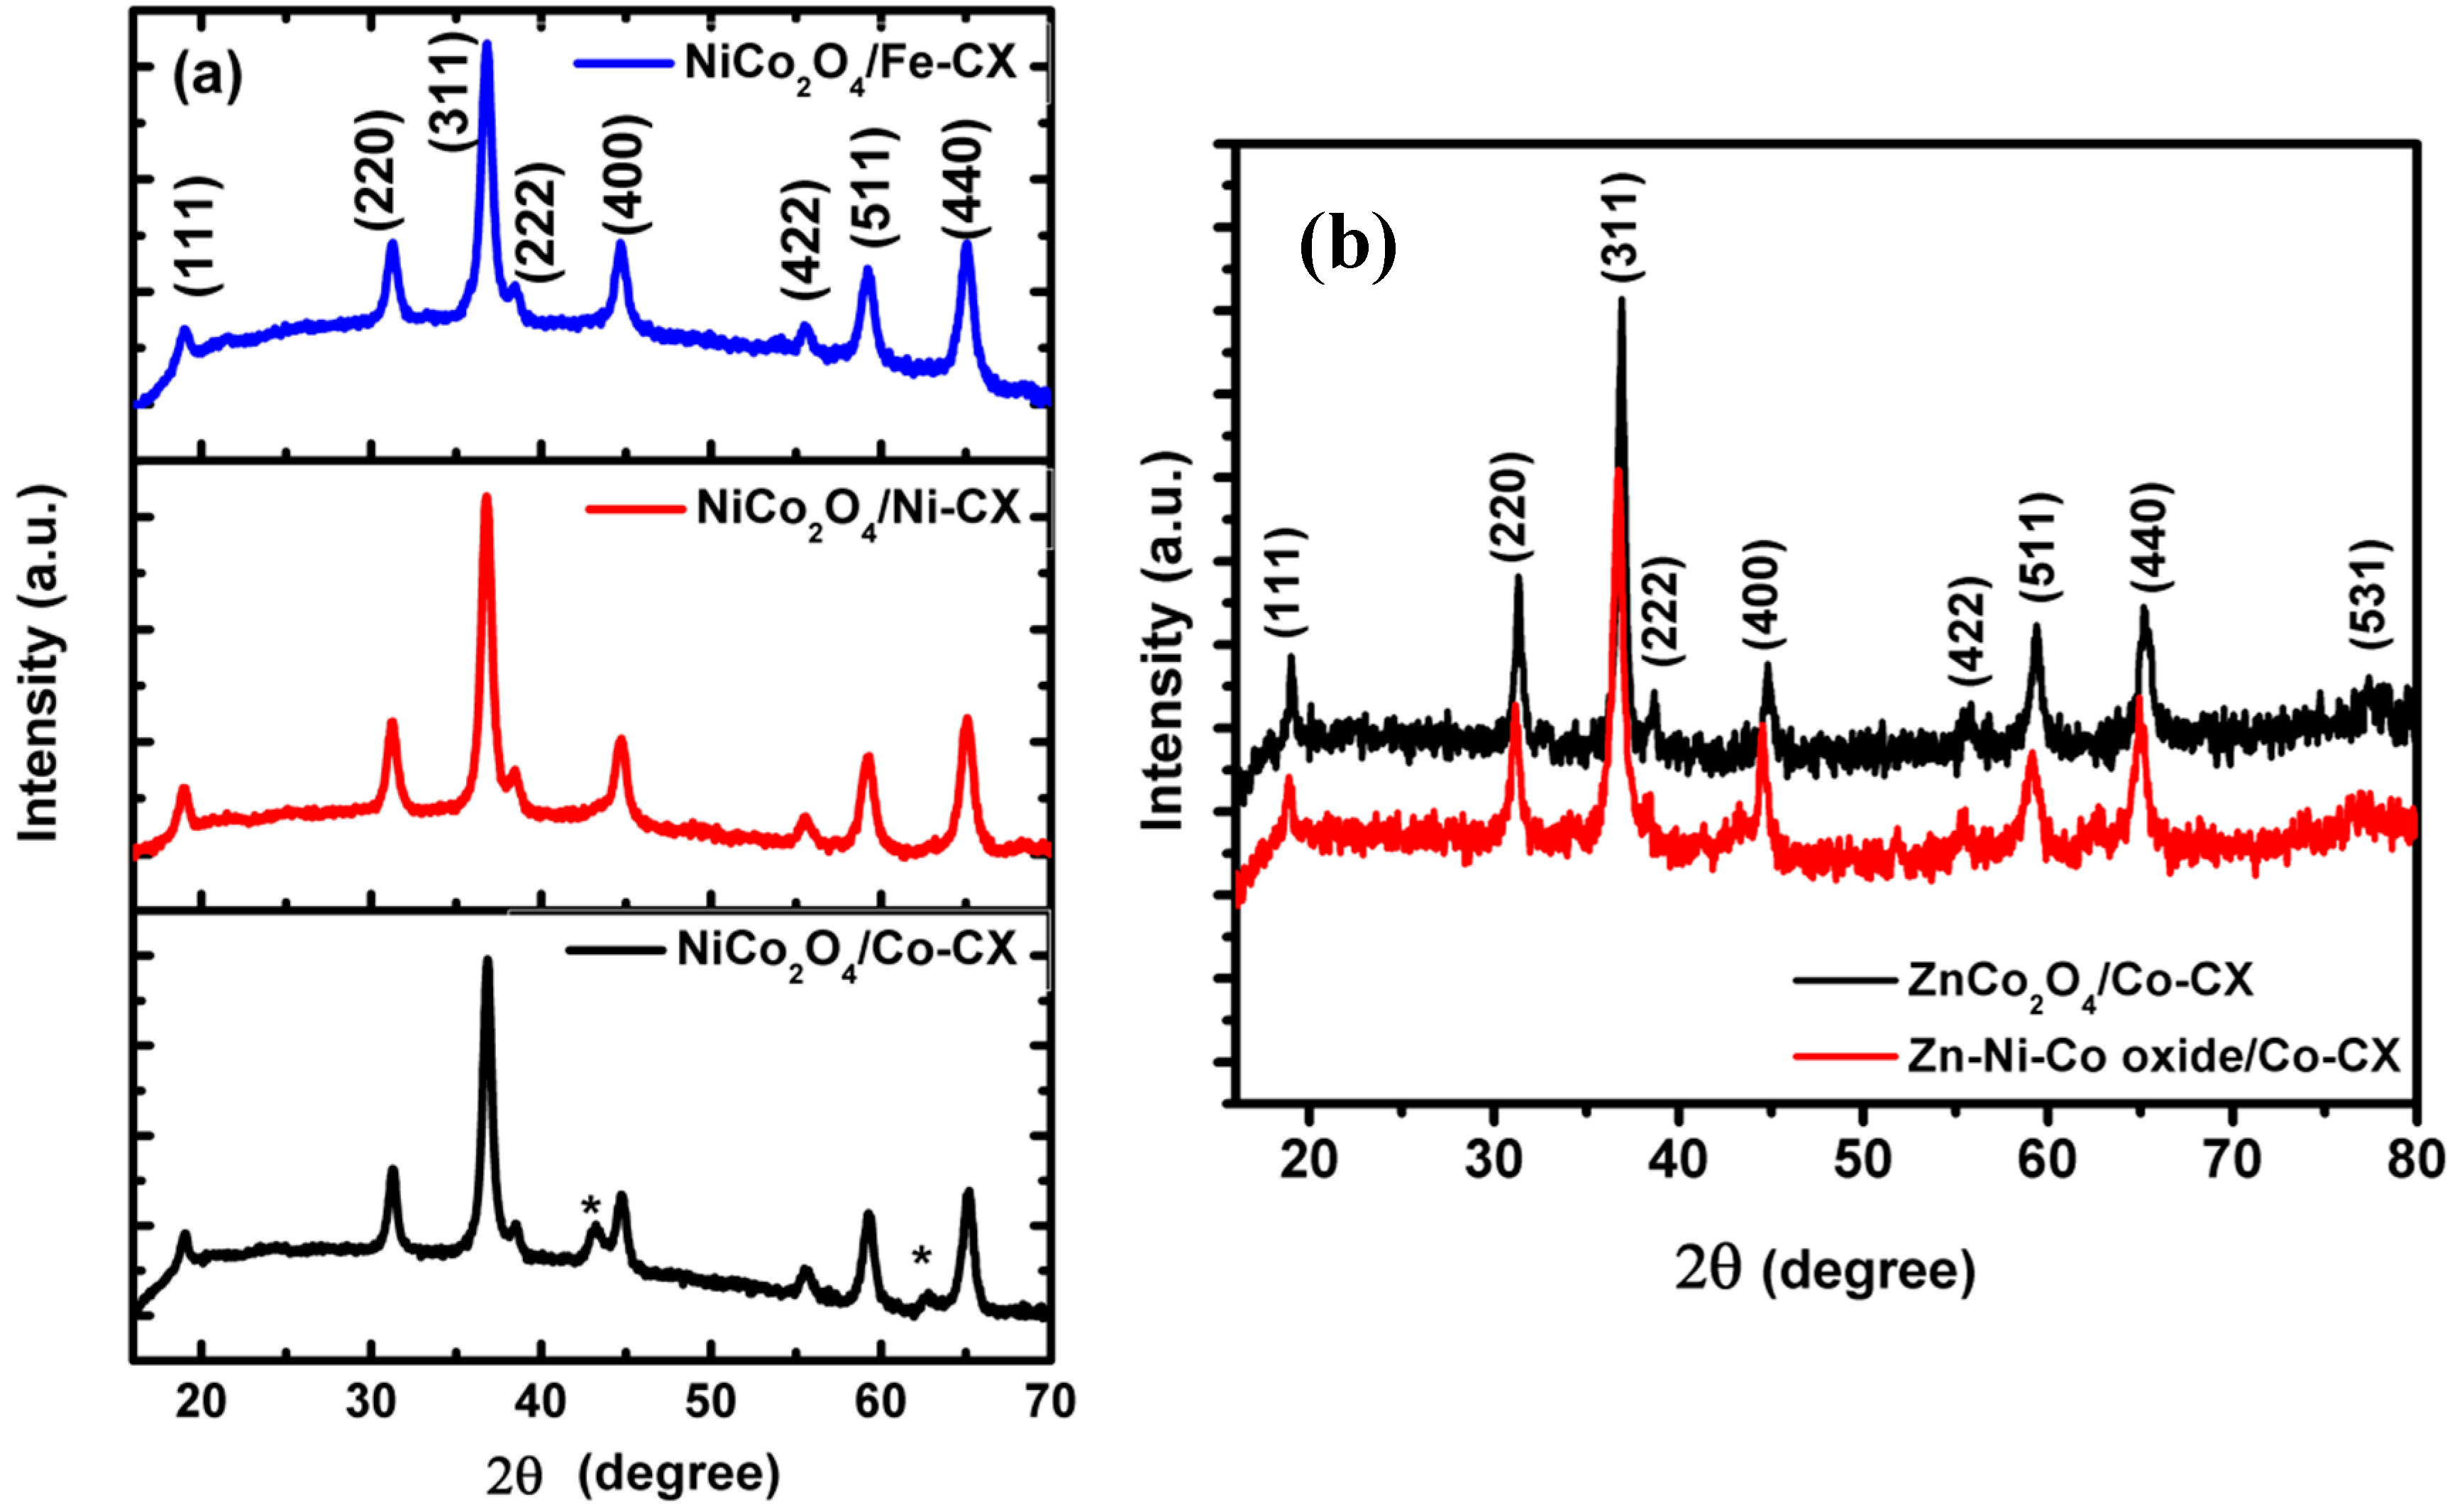
The samples’ crystallinity was investigated with powder X-ray diffraction (XRD) and their corresponding patterns are given in
Figure 2. The XRD spectra for nickel cobaltite NiCo
2O
4 functionalized carbon xerogel are similar to those indexed for the spinel structure of NiCo
2O
4, as shown in
Figure 2a [
37]. There is an excess diffraction peak for NiCo
2O
4/Co–CX at 2θ of 43°, which is corresponding to the (200) plane. The XRD spectra for ZnCo
2O
4/Co–CX and Zn–Ni–Co oxide/Co–CX, as shown in
Figure 2b, are identical with diffraction peaks centered at 2θ of 18.7°, 30.9°, 36.5°, 44.5°, 59.0°, and 64.7°. The diffraction peaks for Zn–Ni–Co oxide/Co–CX are slightly shifted, and there is a higher intensity of the (400) plane at 2θ of 44.5°, indicating the formation of zinc/nickel co-doped Co
3O
4 on the carbon xerogel [
14].
The mean particle size for the prepared sample is calculated by applying the Scherrer equation to the XRD patterns, as shown in
Table 2. Nickel cobaltite-functionalized carbon xerogels have a similar particle size ranging between 21.1 and 25.5 nm. However, there is a remarkable increase in the particle size to 39.2 nm and 38.8 nm when carbon xerogel was doped with zinc cobaltite and Zn–Ni–Co oxide, respectively.
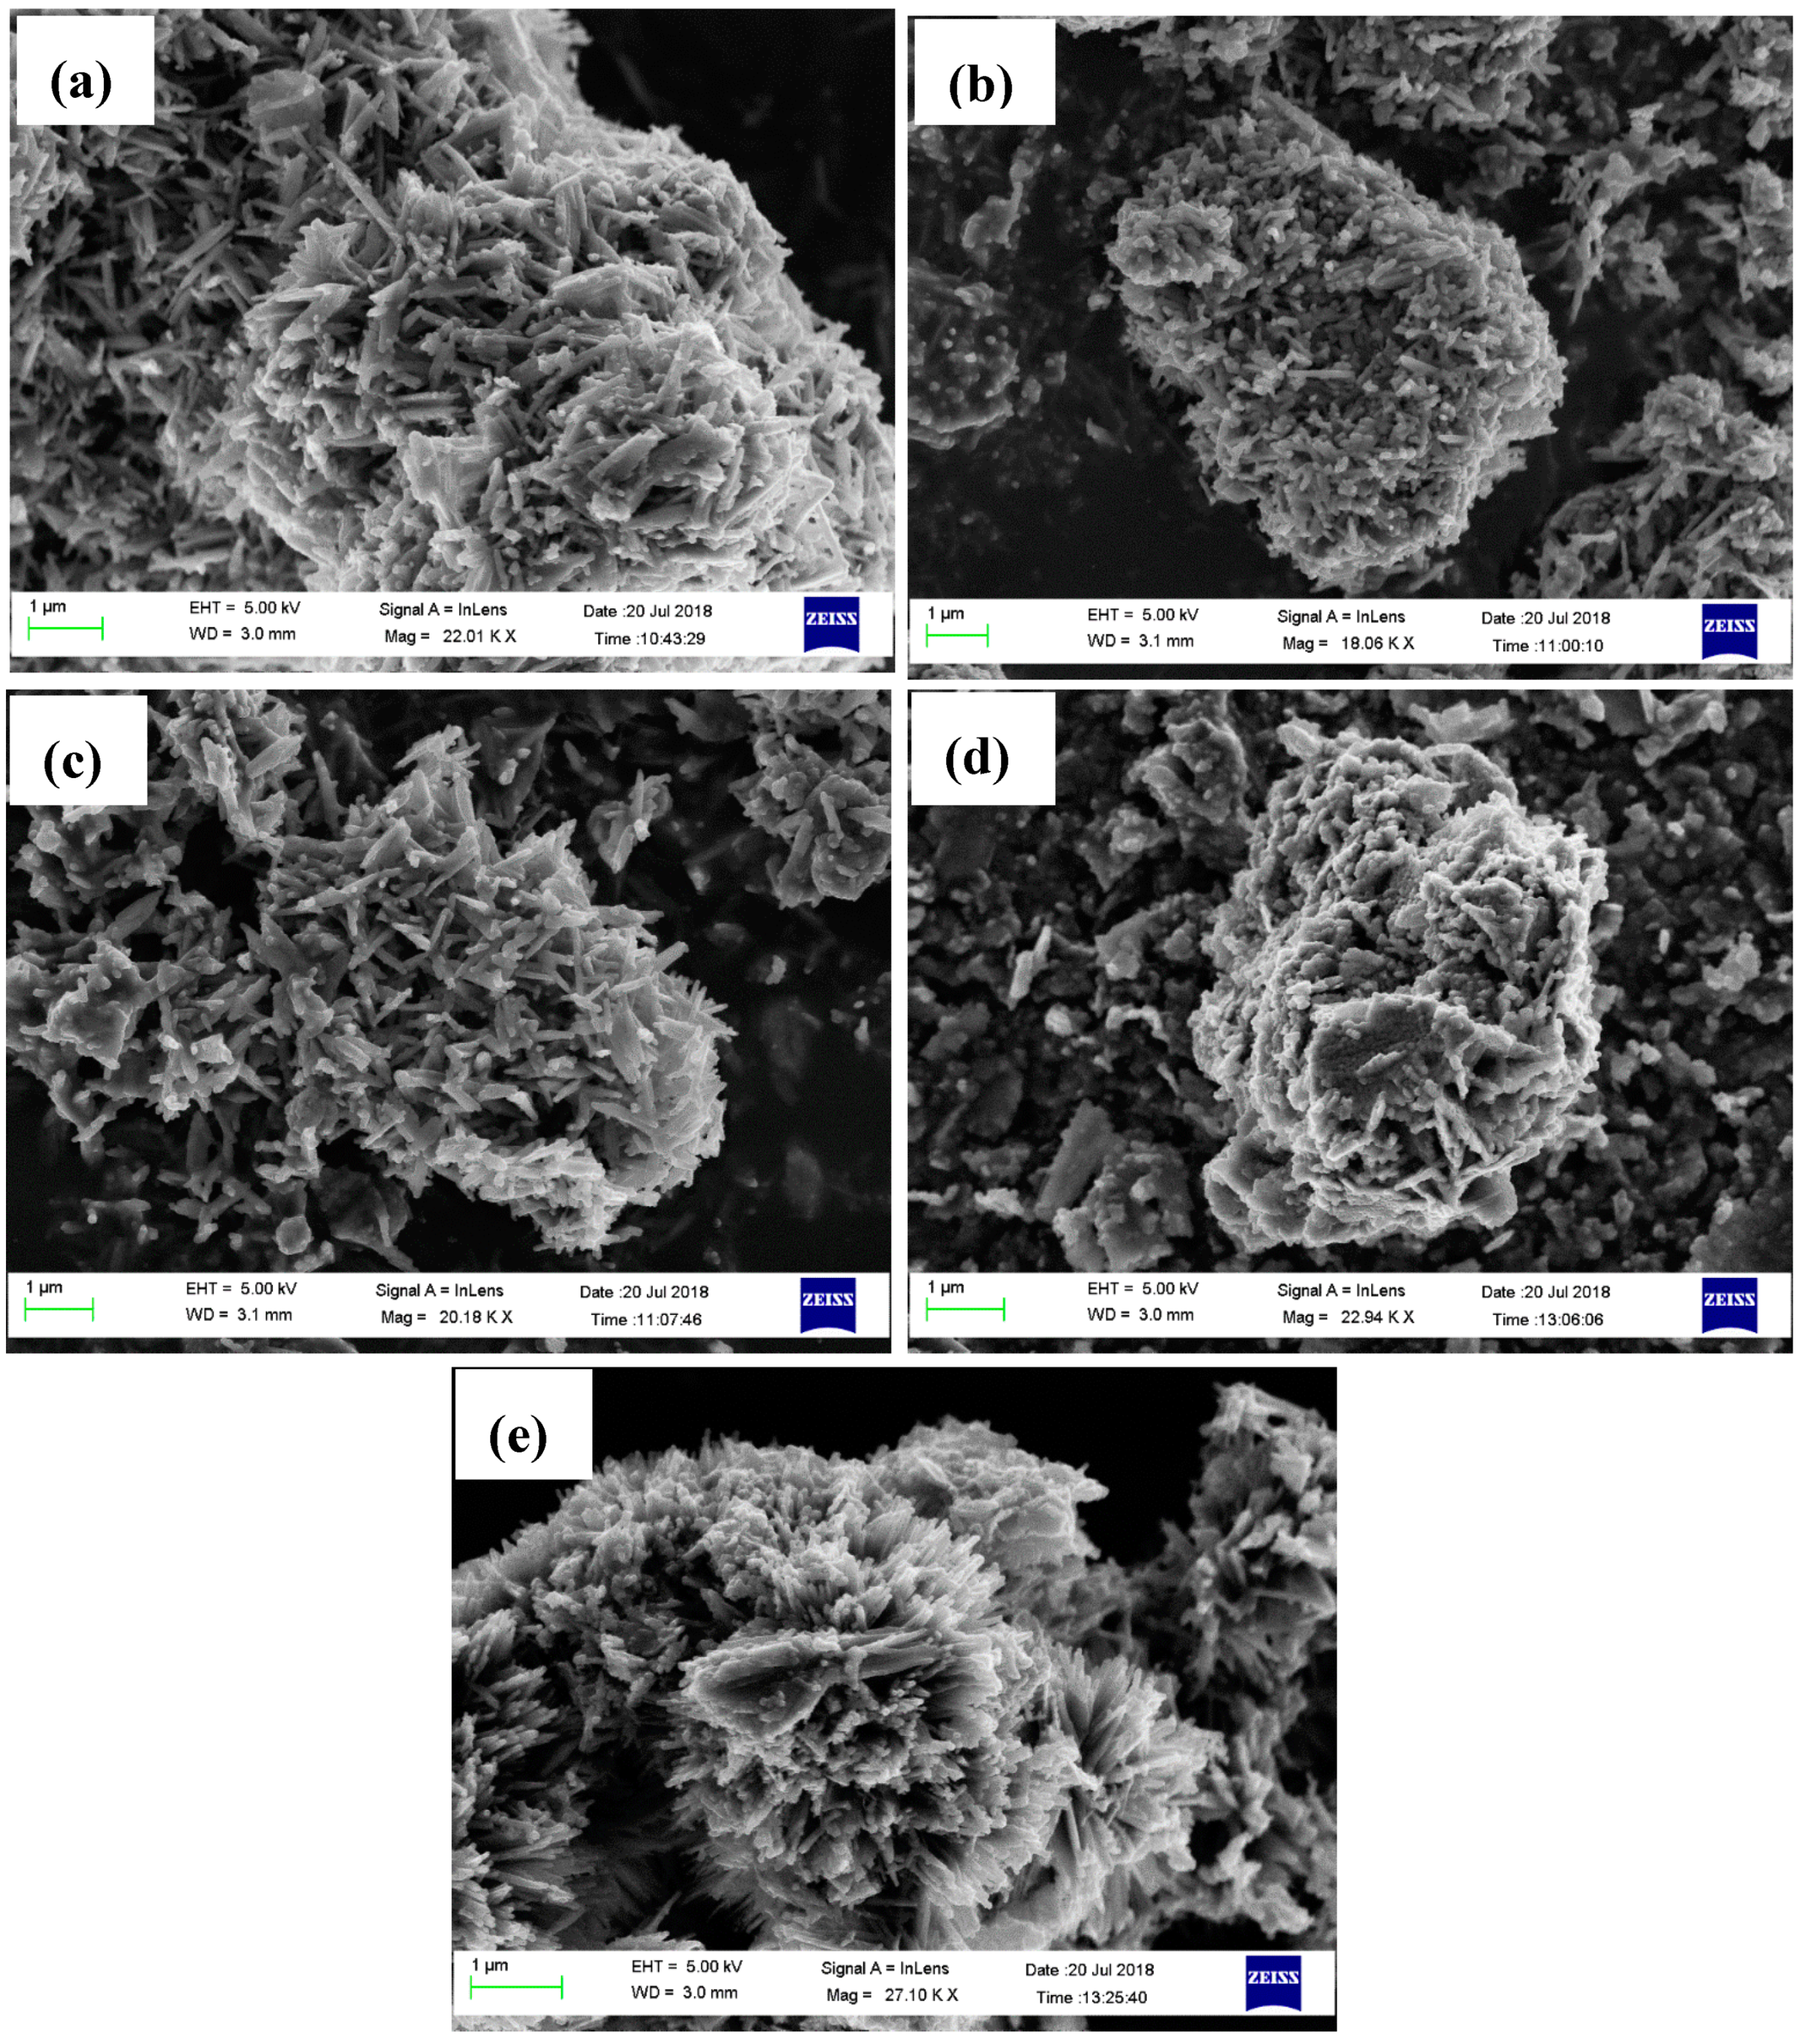
The samples’ morphology was characterized using scanning electron microscopy (SEM), as shown in
Figure 3. SEM images for all of the as-obtained samples clearly show that the samples are composed of 3D nanobundles with different lengths [
37,
38]. The formation of metal oxides nanobundles can be explained as follows: firstly, the metal cations were adsorbed onto the carbon xerogel surface with the aid of urea as a precipitator agent. During the hydrothermal process, the metal hydroxides were formed in a one-step process and converted into spinel metal oxides nanobundles during the calcination treatment [
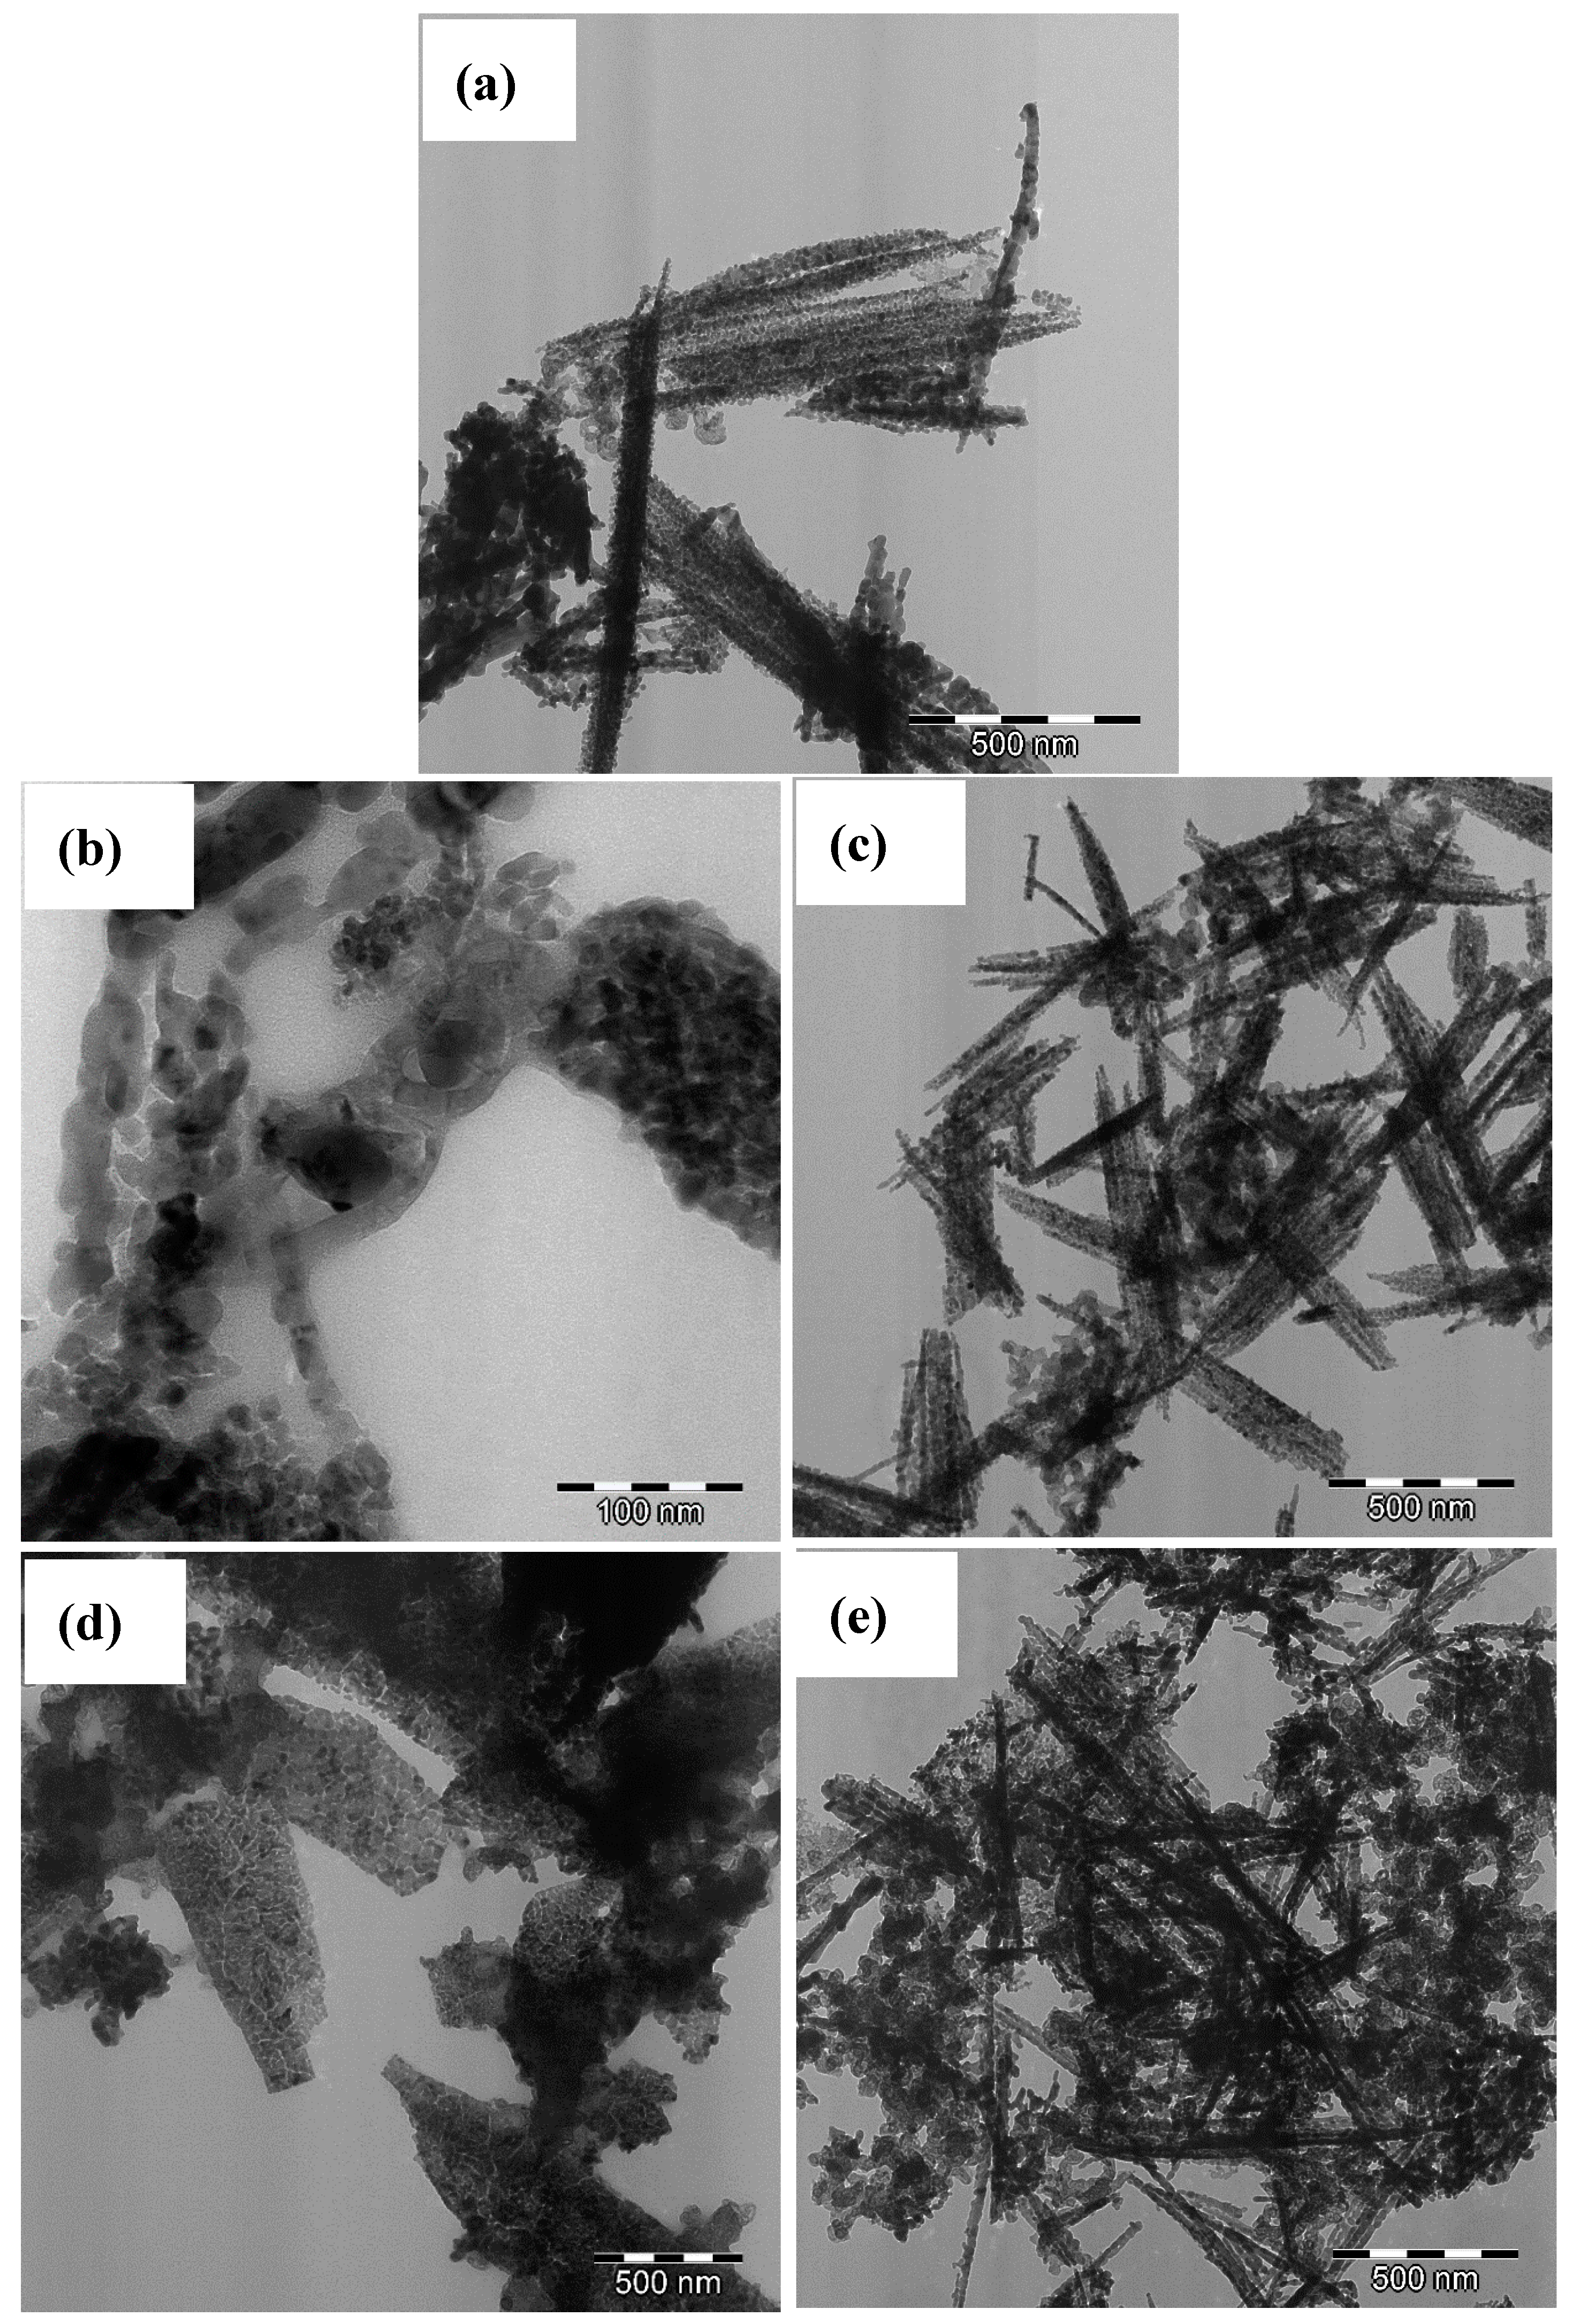
37]. The nanobundle structure of the prepared samples is also confirmed with TEM analysis.
Figure 4 shows the anchoring of nanobundles on the surface of carbon xerogels (
Figure 4a–e). In addition, the nanobundles have different widths, ZnCo
2O
4/Co–CX being the widest (
Figure 4d), whereas the Zn–Ni–Co/Co–CX composite looks completely the opposite (
Figure 4e). This difference could be due to the absence of Ni in the first case.
In addition,
Figure 4b shows that the NiCo
2O
4 nanobundles are composed of many small nanoparticles of 10–20 nm in diameter, indicating that the prepared nanobundles are porous nanobundles instead of single-crystal nanobundles.
Table 3 shows the XPS spectra binding energies (B.E) of carbon, oxygen, and nitrogen atoms, in which the lowest binding energy of oxygen (O1s) at B.E of 529.3 ± 0.3 eV is compatible to oxygen bonded to transition metal cations with oxidation states of +2 and +3, the peaks full width at half maximum (FWHM) is also presented [
32].
On the other hand,
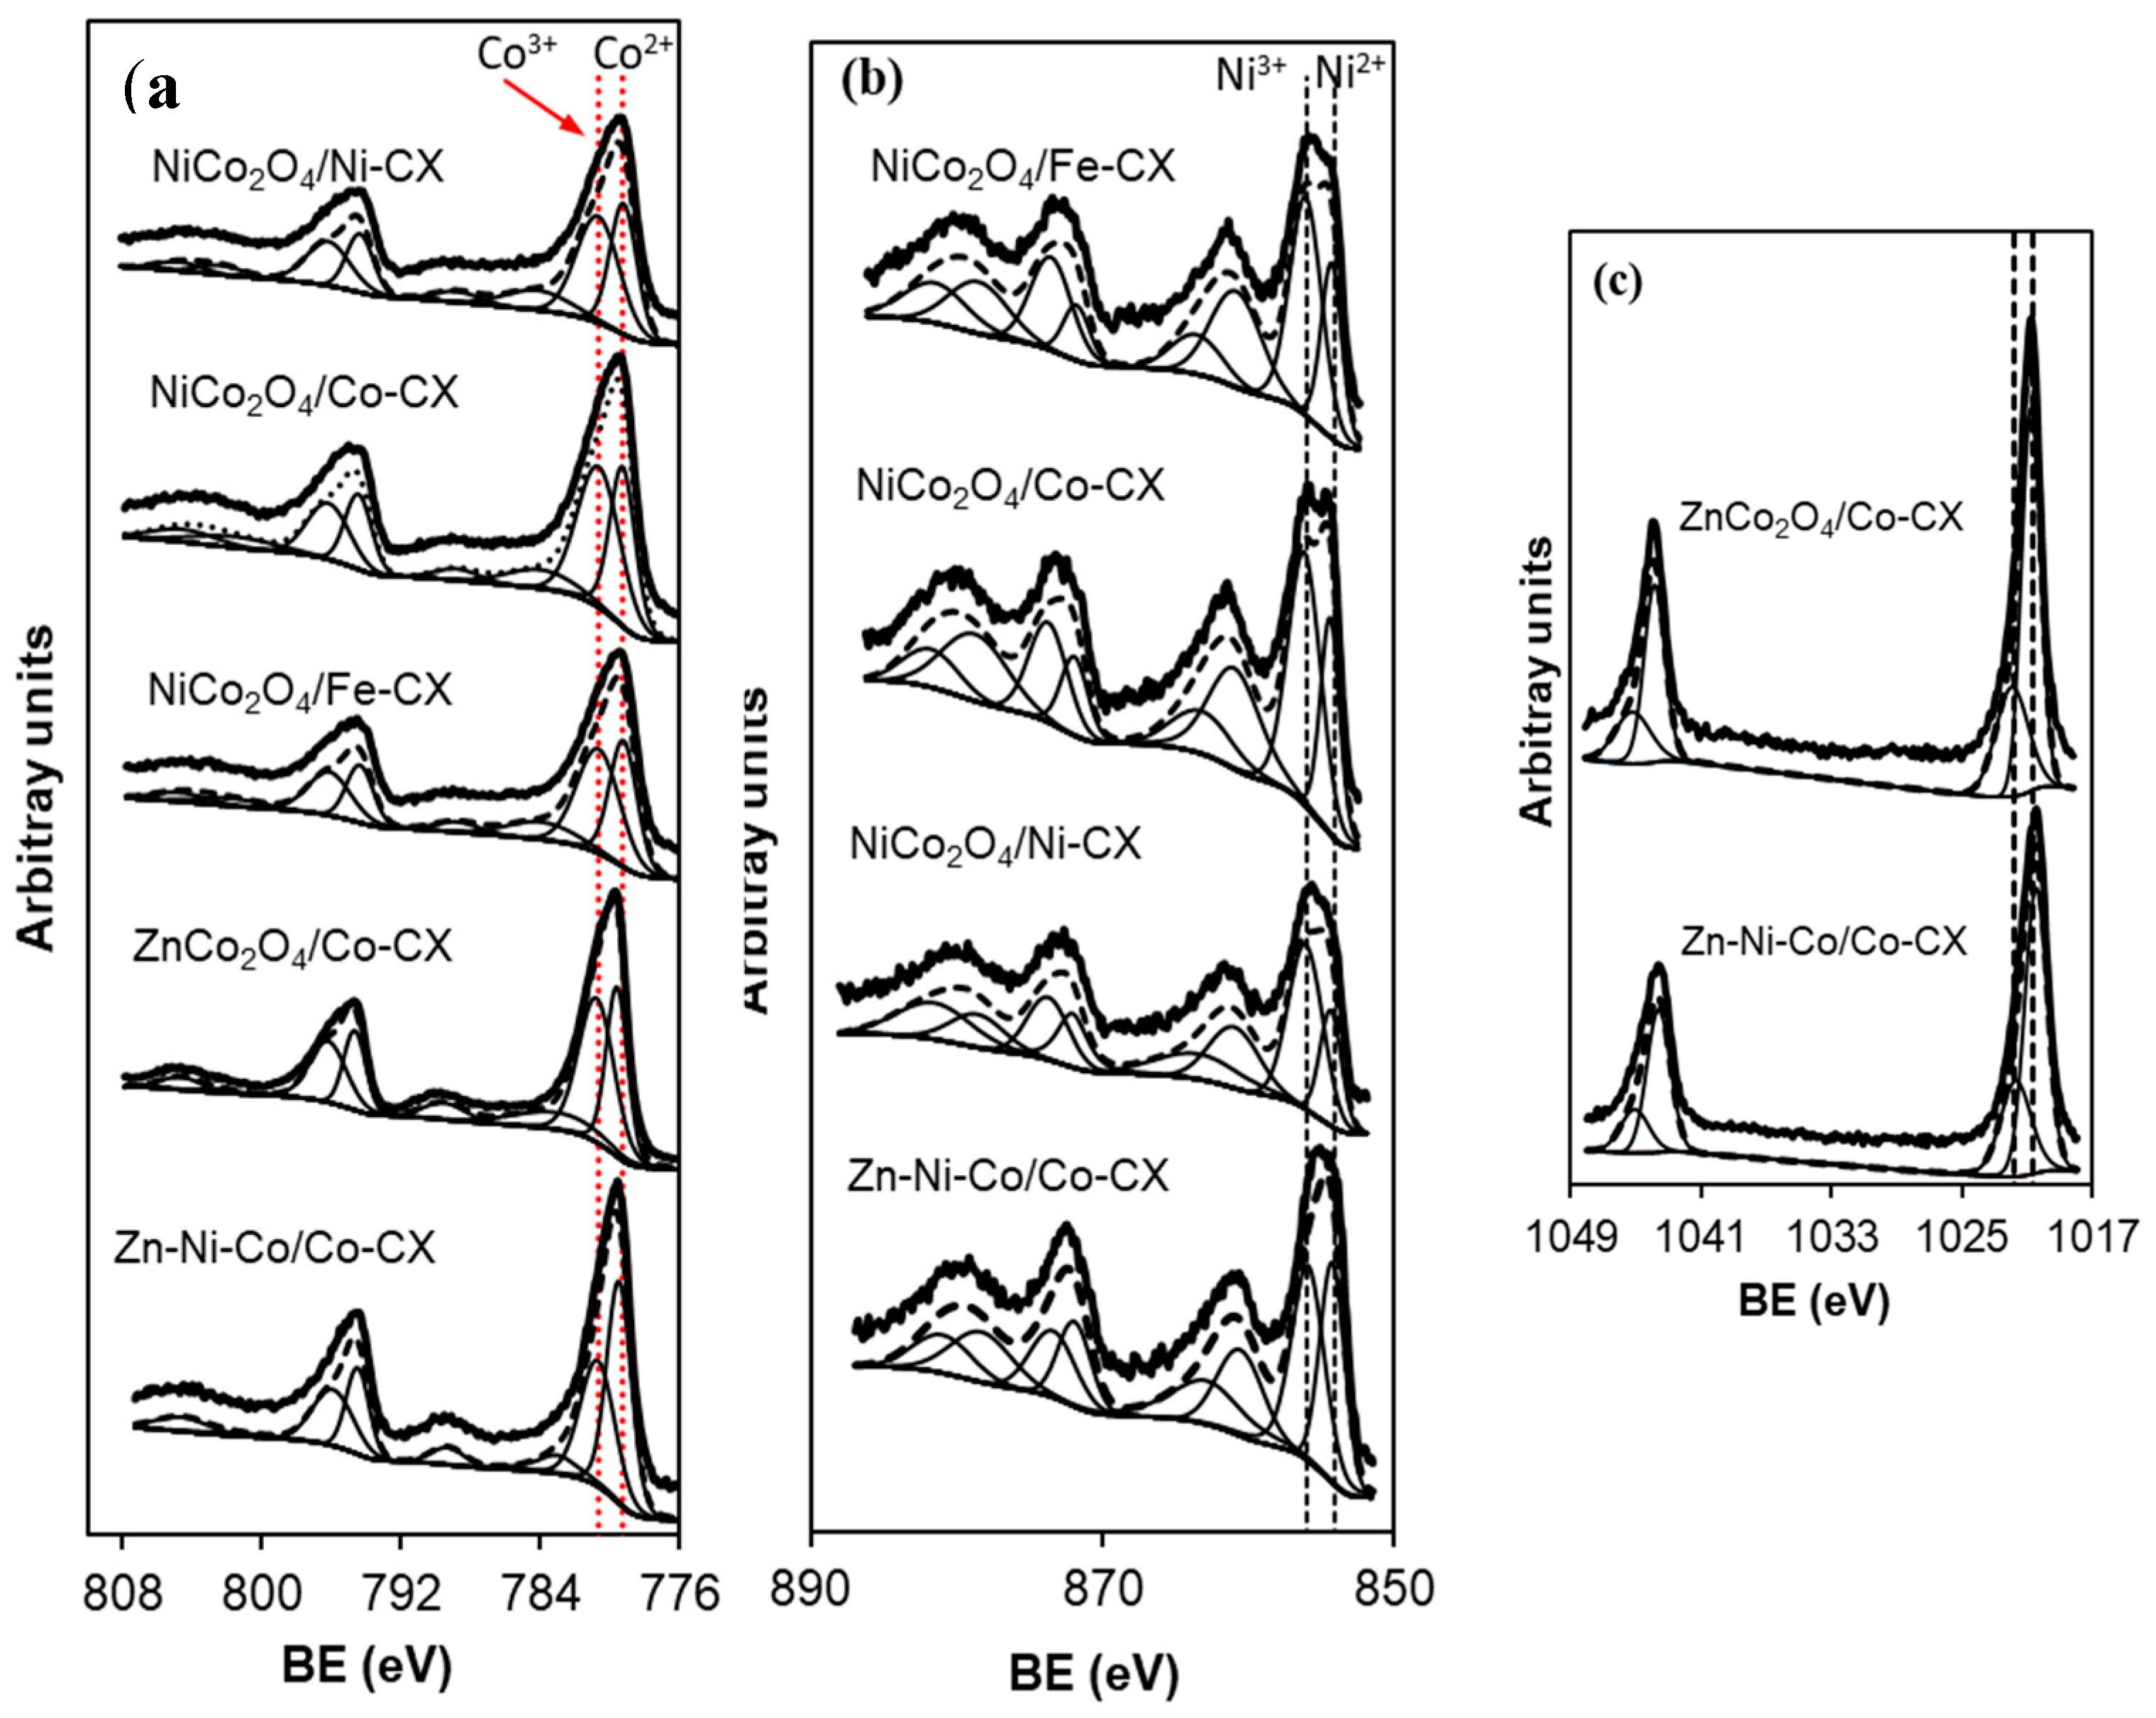
Table 4 shows the XPS spectra binding energies (B.E) of the metal atoms. In analyzing Co
2p, as shown in
Figure 5a, different Co2p
3/2 peaks are obtained and assigned as following. In the case of NiCo
2O
4-based samples, the signals at 779.2 ± 0.1 correspond to Co
2+ situated in octahedral holes, whereas the signals at 780.6 ± 0.2 correspond to Co
3+ situated in tetrahedral holes [
39,
40]. On the other hand, the XPS spectra of the Ni
2p region, as shown in
Figure 5b, show signals centered at 854.2 ± 0.1 and 871.7 ± 0.2 eV for the 2p
3/2 and 2p
1/2 components respectively, which correspond to Ni
2+ species, as well as signals at 855.9 ± 0.3 and 873.5 ± 0.2 eV corresponding to Ni
3+ cations [
40]. Iron was not detected in any sample by XPS, and
Figure 5c shows the Zn2p spectra. The presence of zinc cobaltite, ZnCo
2O
4, is confirmed by a peak centered at 1020.7 eV [
41], while the peak at 1021.5–1021.8 eV is assigned to ZnO [
42].
Finally,
Table 5 collects the superficial chemical composition of the samples. The nitrogen content of the external surface is extremely low in all the samples. Besides, it should be mentioned that Zn-containing samples have the highest total metal concentration in the external surface area, and part of the oxygen content can be due to the calcination treatment during the preparation of the samples. Besides, the ZnCo
2O
4/Co–CX composite has a very large Co concentration in the external surface area, which indicates a non-homogeneous metal distribution. This would be able to affect its electrocatalytic performance negatively.
3.2. Oxygen Reduction Reaction Activity
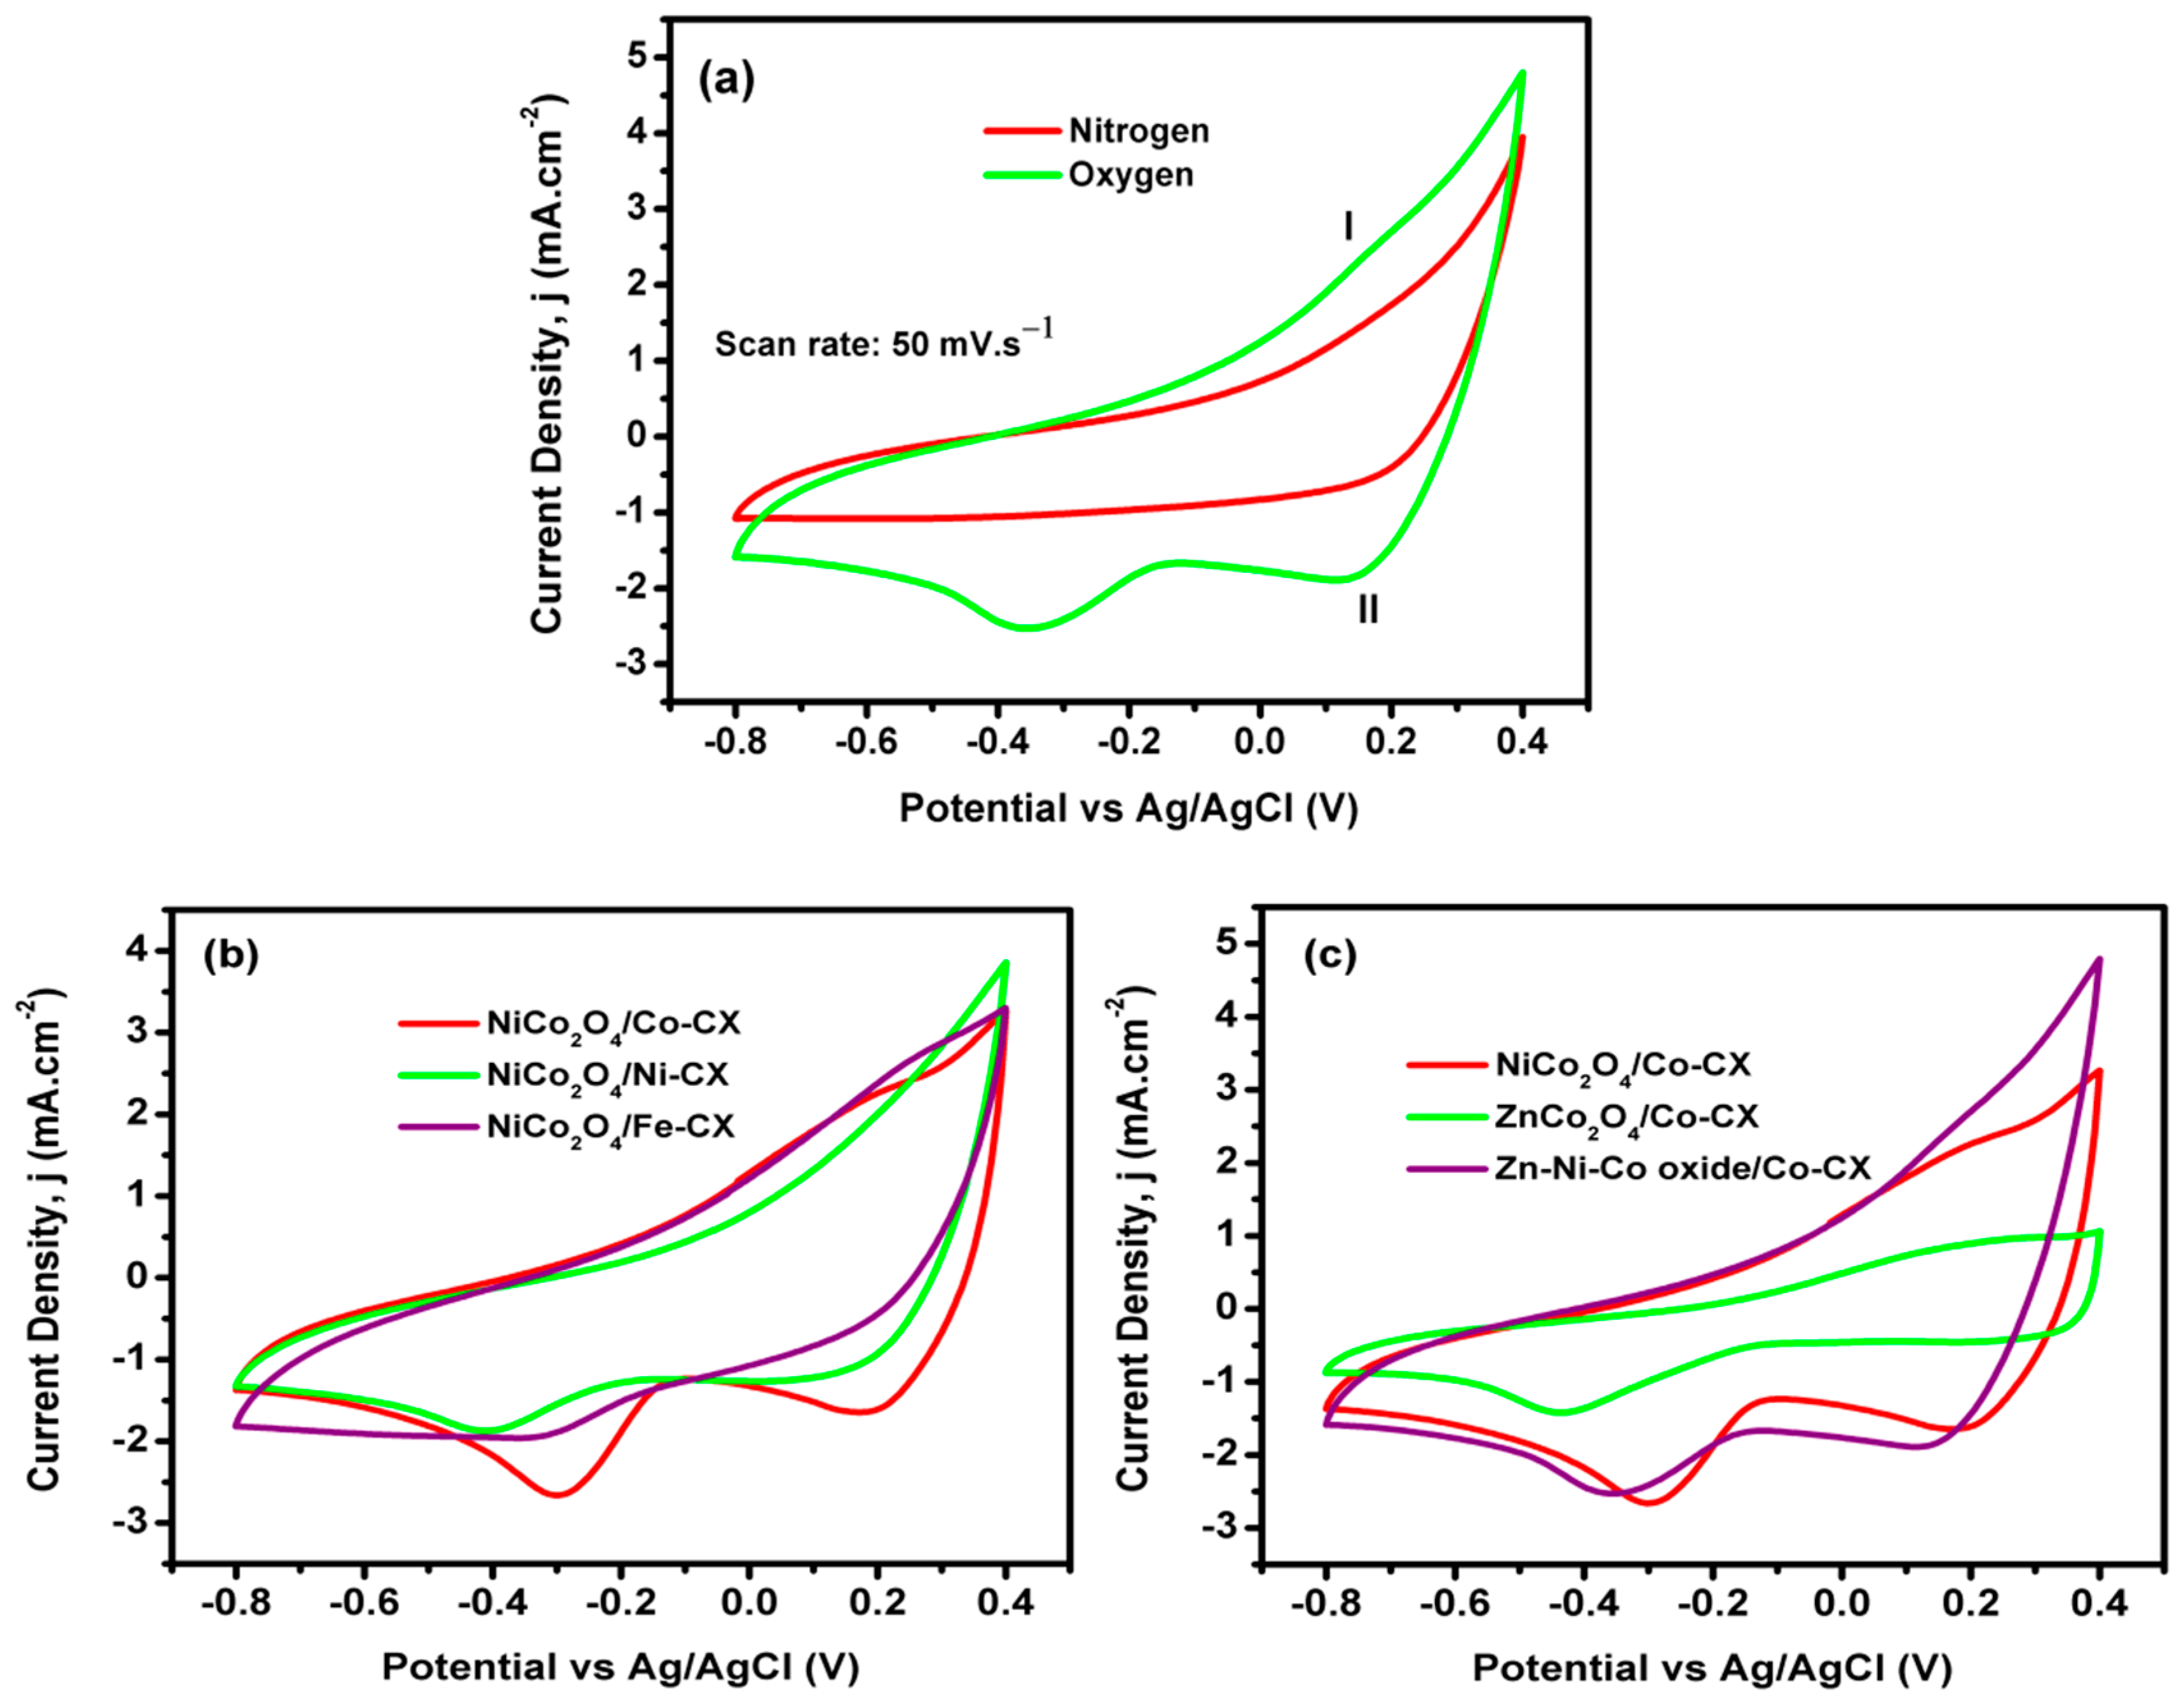
The samples’ performance in the presence and absence of oxygen was studied using cyclic voltammetry in oxygen and nitrogen-saturated electrolyte (0.1 M KOH), respectively.
Figure 6a shows the behavior of the Zn–Ni–Co/Co–CX sample in saturated oxygen and nitrogen electrolyte at a scan rate of 50 mV∙s
−1. The figure shows the presence of an oxygen reduction peak, indicating the activity of the used material for ORR. In addition, there are a couple of redox peaks (I/II) at the positive potential range; these peaks come from the reversible transition between Co
3O
4 and CoOOH [
43]. This reaction can be formulated as Co
3O
4 + OH
− + H
2O ↔ 3CoOOH + e
−. This reduction peak was also detected with all the electrocatalysts; i.e.,
Figure 6b,c show the compared cyclic voltammograms of the five samples. Thus, regarding the dopant metal (M = Co, Ni, Fe) in the carbon xerogels, the ORR results obtained with the three doped samples functionalized with NiCo
2O
4 can be compared in
Figure 6b. The results show that the electrochemical performance toward ORR is higher for cobalt-doped carbon xerogels (Co-CX) followed by samples doped with iron (Fe) and nickel (Ni), which is in good agreement with previously published work [
31,
44]. In general, the incorporation of transition metal into the carbon structure promotes the catalytic activity for ORR due to the generation of more active sites [
45]. Related work attributed the lower activity of nickel-doped carbon electrocatalysts to the formation of a nickel oxide NiO on the carbon surface, which has an inhibitory effect on the catalytic current and a poisoning effect on the ORR activity [
46].
Another work explains the higher activity of cobalt-based carbon for ORR to the formation of cobalt–nitrogen (Co–N) complexes during the pyrolysis under nitrogen in the preparation of carbon; these Co–N complex moieties have a strong activity for ORR [
47]. In any case, we have to consider that the NiCo
2O
4/Fe-CX sample has the lowest BET surface area and pore volume (
Table 4), as well as a much lower superficial metal content (
Table 1) than the other two compared samples; therefore, the electrocatalytic activity promoted by Ni cannot be undervalued at first glance.
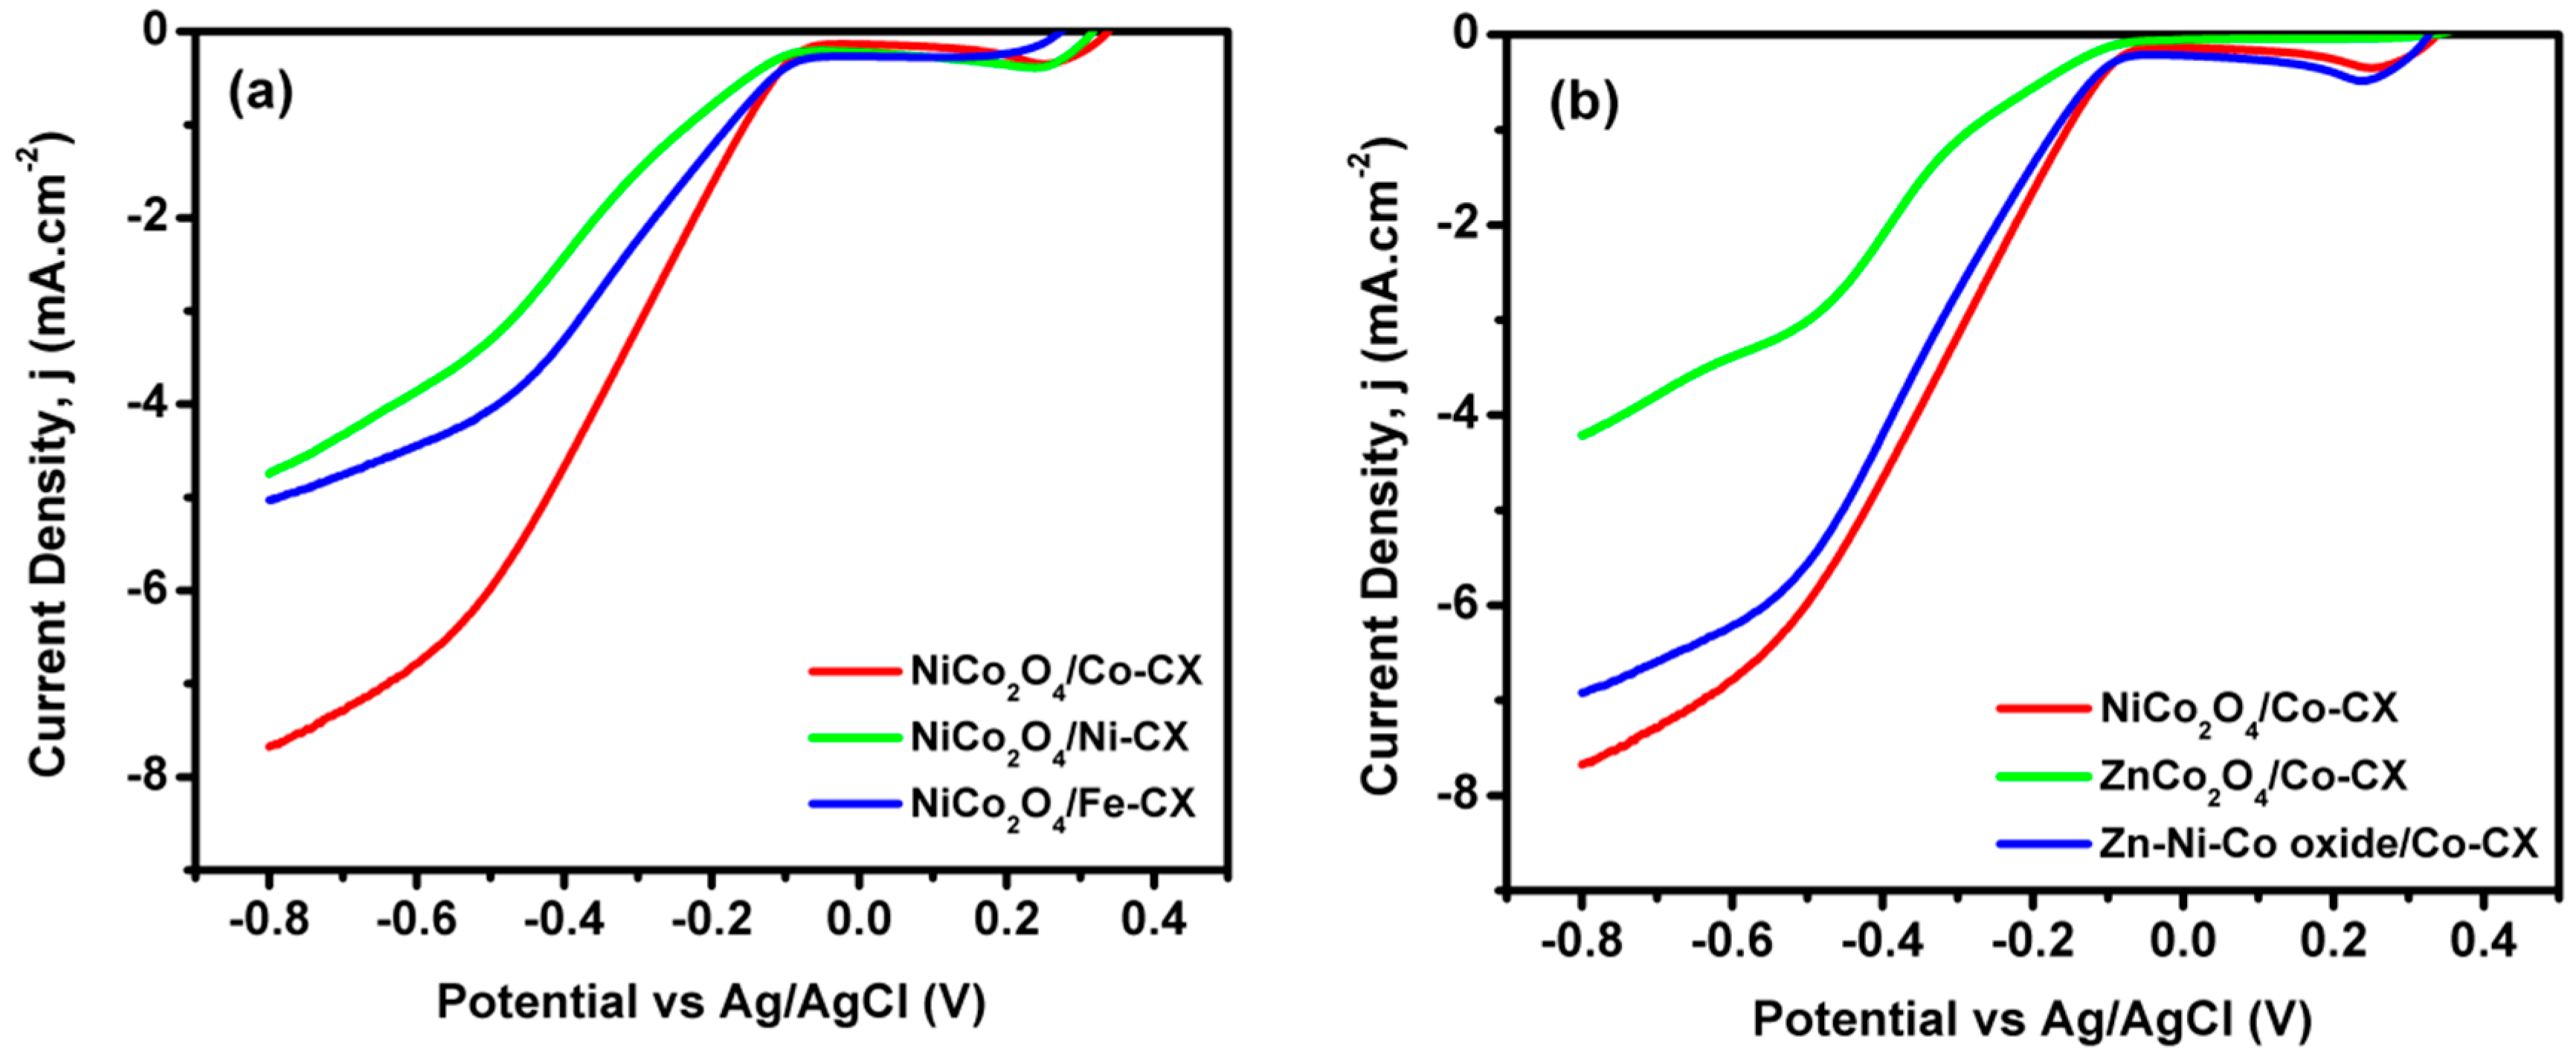
In this way, when the ORR results among all samples containing Co–CX xerogel are compared, the two samples that contain Ni show the best electrocatalytic behavior (
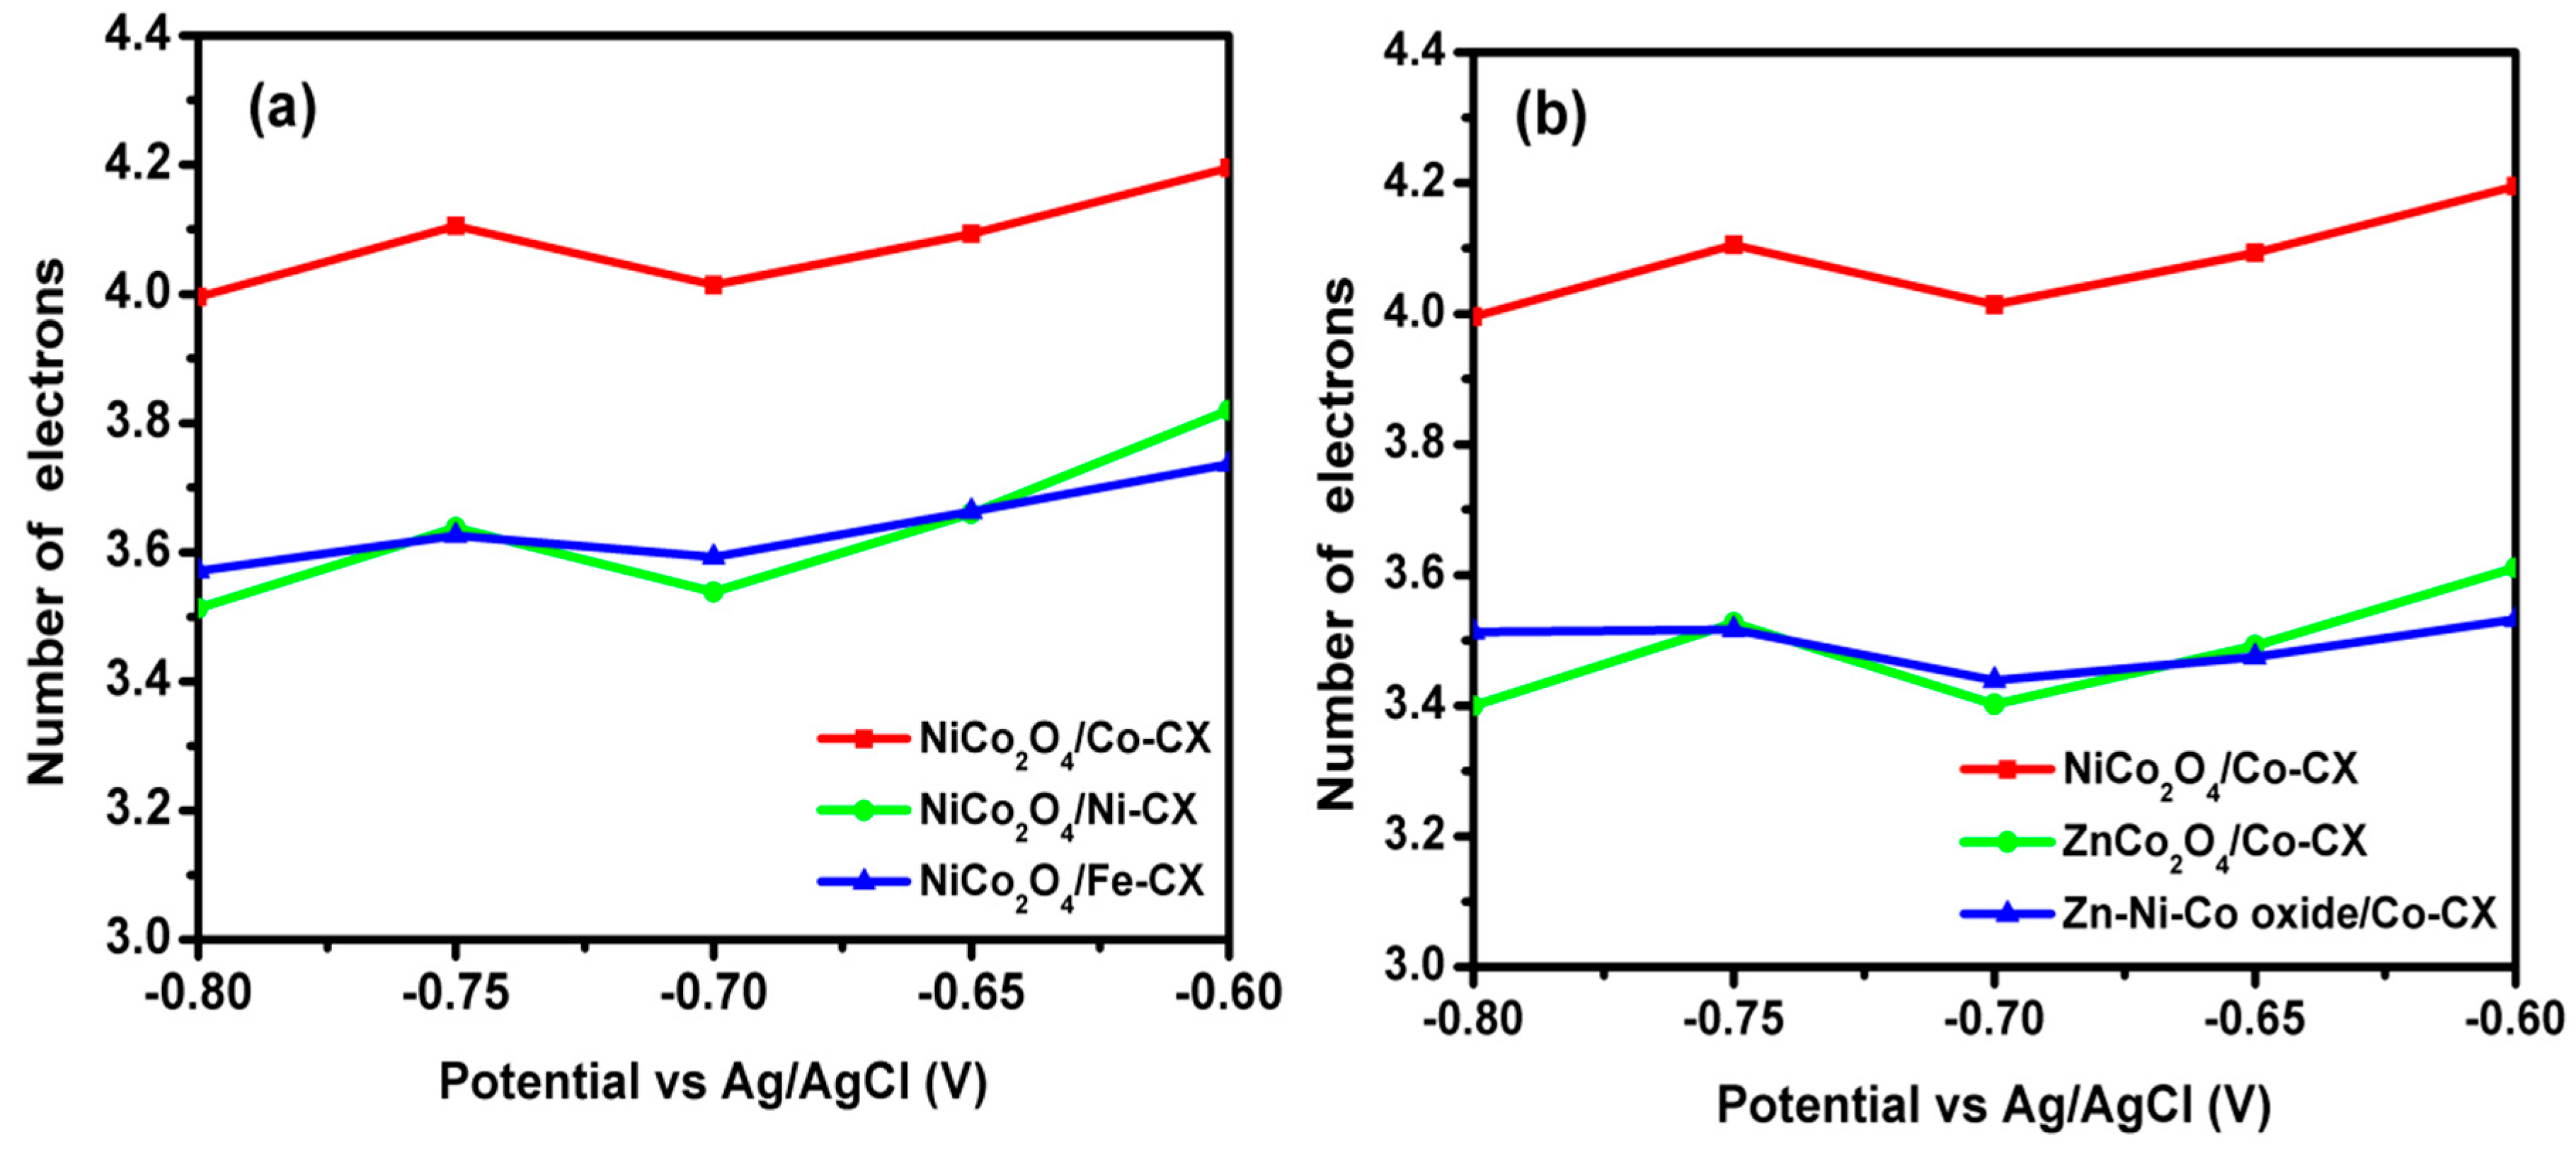
Figure 7b). However, this discussion, apart from comparing the quantitative electrochemical parameters, needs to take into account the role of Zn as well. For a good comparison, data obtained from linear sweep voltammetry (LSV) as well as Nyquist plots have been collected in
Table 6. Thus, the estimated number of electrons transferred at a given potential obtained from the Koutecky–Levich equation are all good enough to work well as electrocatalysts for ORR, and they also keep these values at different potentials (
Figure 8). The number of electrons transferred can proportionally vary a little bit depending on the type of electrode used, and if a low formation of peroxides occurs, which in this work has not been analyzed. Besides, the number of electrons transferred has a direct relation and depends on the electrocatalyst resistance. The electrochemical impedance spectroscopy (EIS) is an important technique that determines the behavior of an electrode in certain application and its resistance.
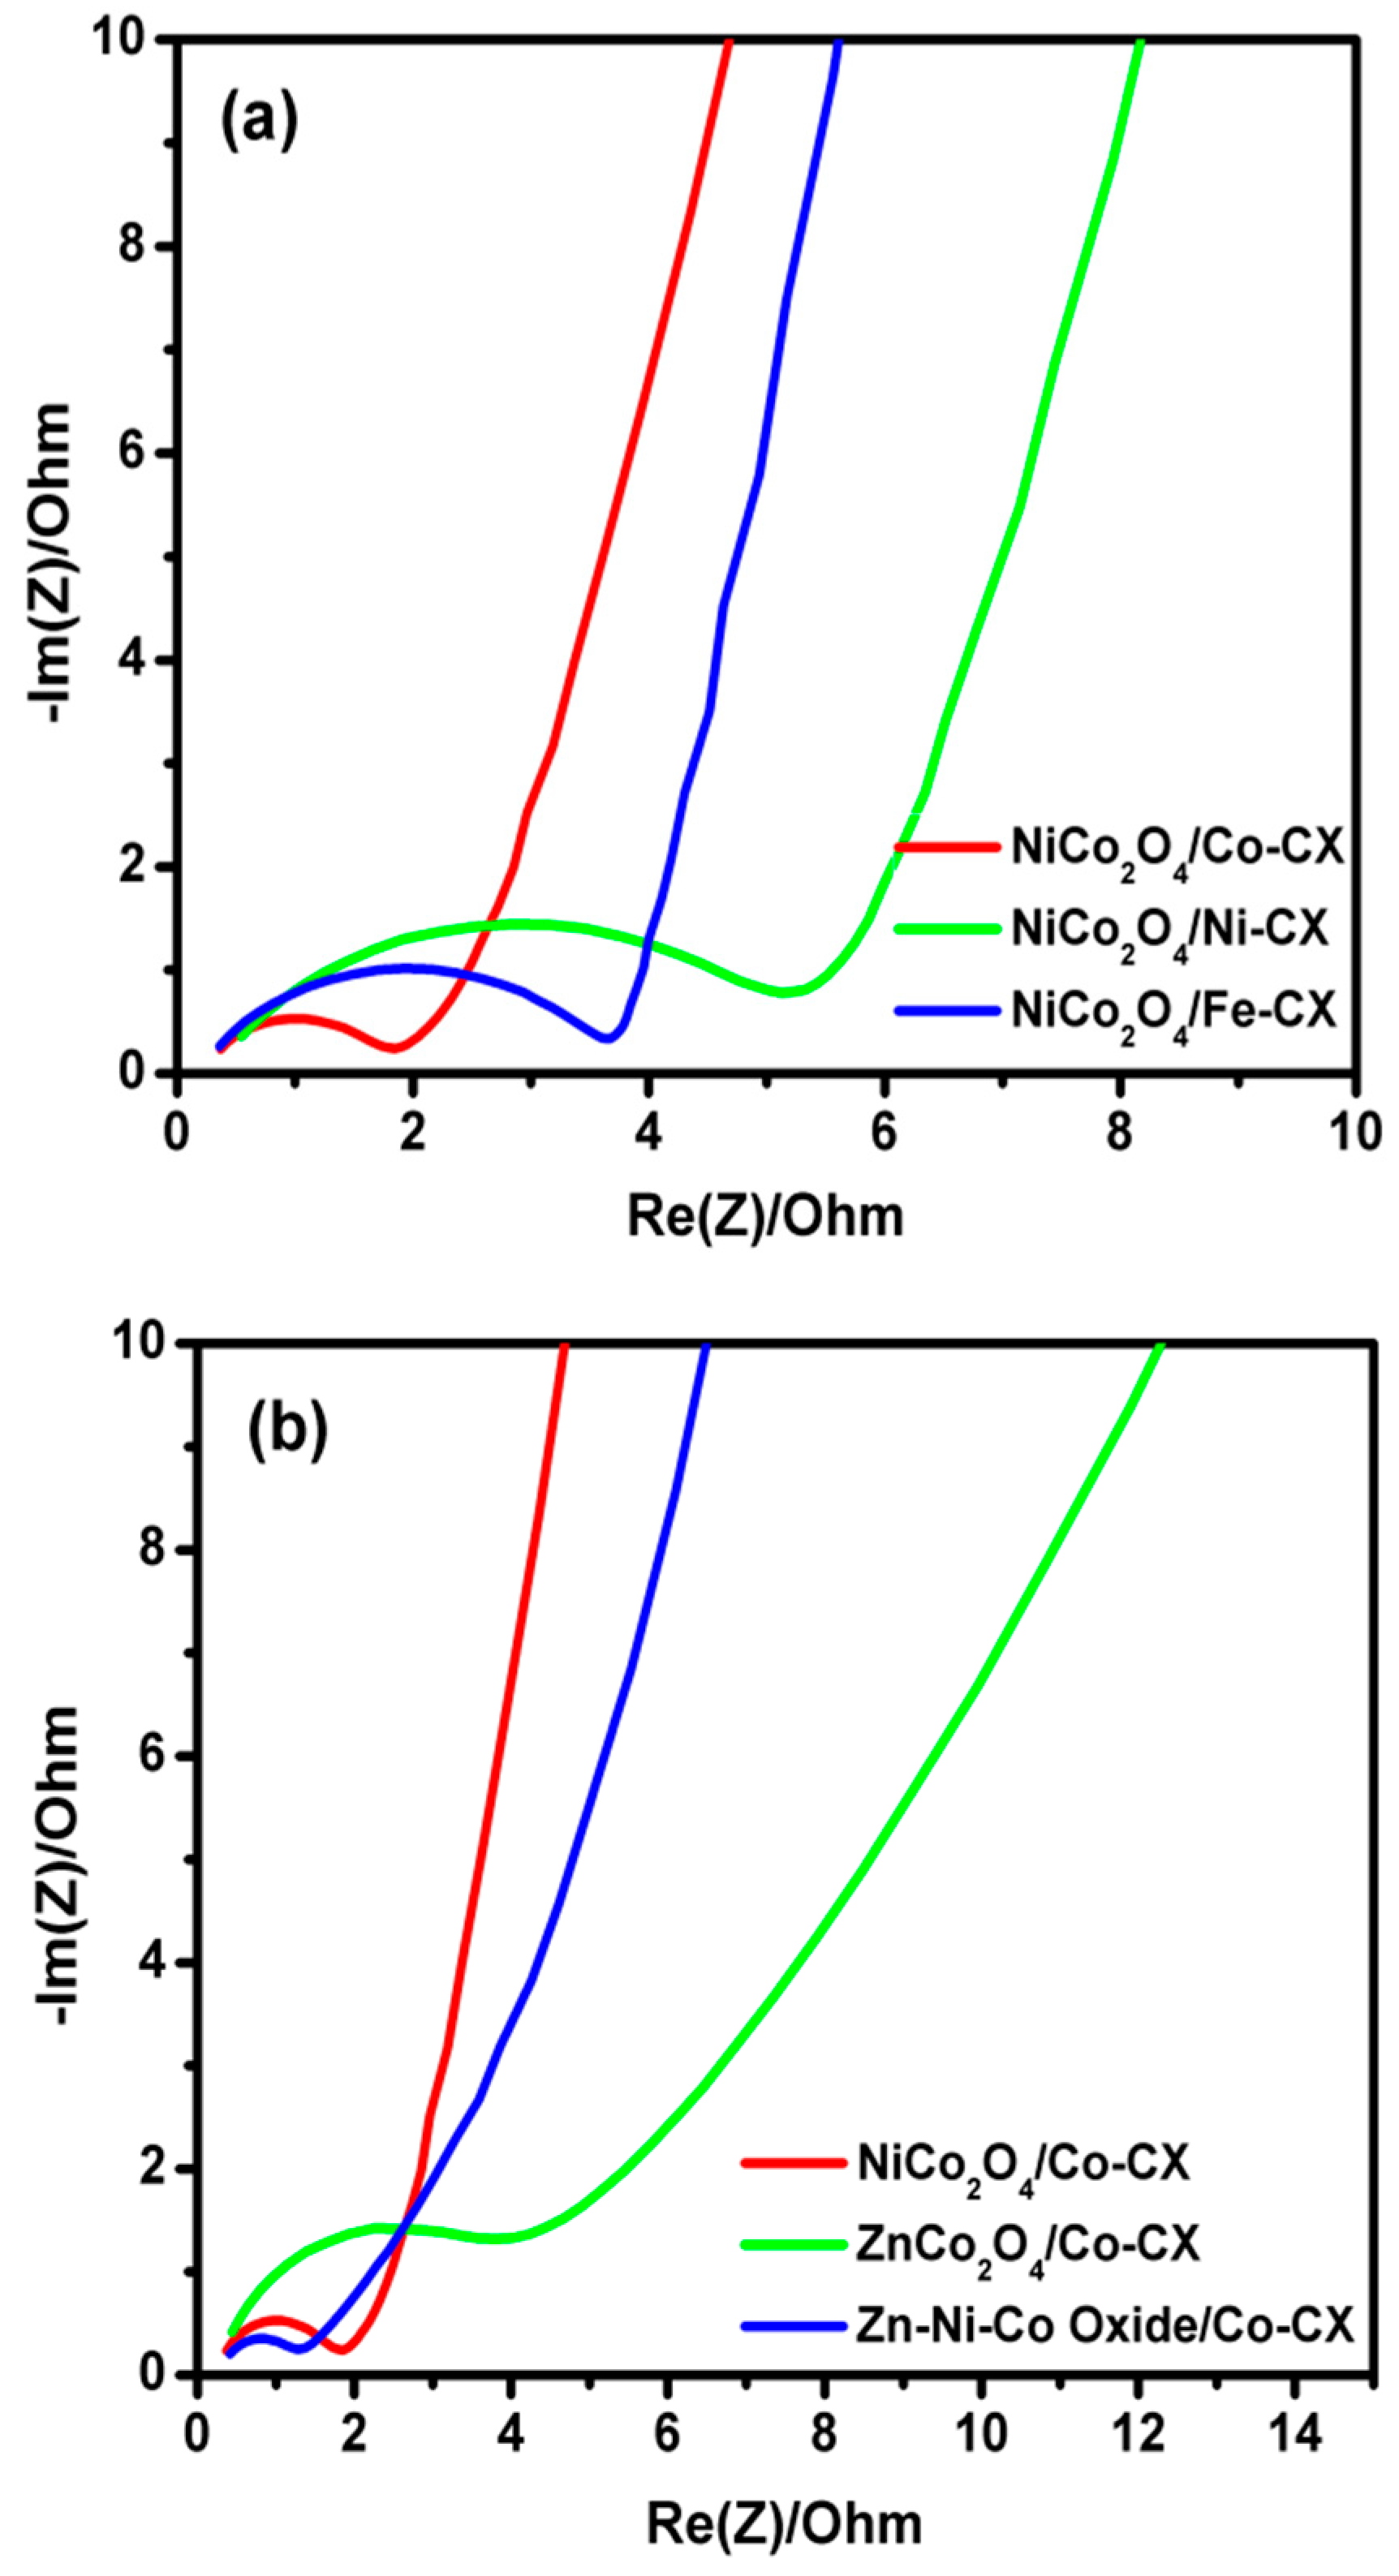
Figure 9 shows the Nyquist plots for the prepared electrodes. As it can be seen, a semicircle is observed at the high-frequency region due to charge transfer resistance on the electrode/electrolyte interface. Meanwhile, at low frequency, a purely capacitive behavior is obtained, and the combination between both the resistive and capacitive behavior is known as the Warburg region, which has a relation to the diffusive resistance [
37,
48]. The equivalent series resistance (ESR) of the electrode can be determined by the intersection of the semicircle with the real axis.
In the Nyquist plots for all composites (
Figure 9), the diameter of the semicircle for Zn–Ni–Co/Co–CX is the lowest, indicating the lowest charge-transfer resistance (R
ct) between the electrode and electrolyte interface. Moreover, the lowest equivalent series resistance (ESR) is obtained for Zn–Ni–Co/Co–CX, indicating the better conductivity of this electrocatalyst. On the other hand, we should remark on the low values of E
onset among all our electrocatalysts, showing again the Zn–Ni–Co/Co–CX composite as one of the smallest. Moreover, this composite exhibits the best electrocatalytic behavior in ORR in spite of its much larger mean metal particle size and lower surface area and pore volumes.
The available bibliography about a possible effect of the metal particle sizes on the ORR activity is not clear. Some works with Pt supported on carbon materials found a relation between the particle size and the specific activity toward ORR. However, while some of them mention that for oxygen reduction, a loss of catalytic activity with the decreased Pt particle size occurs due to the stronger adsorption of oxygenated species [
12,
49], other authors found an optimal Pt particle size [
50]. Nevertheless, with Fe, Co, or Ni-based catalysts, the previous mentioned tendencies seem to be different, where the small-sized cobalt nanoparticles and dispersion in carbon provide fast electron transport between the carbon matrix and the cobalt nanoparticles, leading to efficient electrical conductivity [
13,
51]. However, in that work, the samples did not contain Zn. Therefore, it could very well be that the extremely large main crystallite sizes of samples containing Zn can be more of a handicap than an advantage. However, the Zn–Ni oxide phases combination seems to improve the electrocatalytic behavior, especially that related with the conductivity of the electrode. On the other hand, the ZnCo
2O
4/Co–CX composite, due to its very large Co concentration in the external surface area and large mean metal particle size, partially loses the synergism with the doped xerogel support, showing the worst electrocatalytic performance. This means that the sizes of these types of metal phases should be better controlled and optimized for future applications.
Finally, reviewing the available literature, we have found that the higher electrochemical activity for ORR is obtained by comparing our results with already published ones at similar conditions. For example, Zhang et al. [
52] report a composite NiCo
2O
4/N–rGO with onset potential, E
onset, of about −0.08 V, while it is just −0.06 V versus the Ag/AgCl reference electrode for two of our best composites. Moreover, when comparing our ternary metal oxide electrocatalyst Zn–Ni–Co oxide/Co–CX with a published nanoalloy of Pt
25Ni
16Co
59/C [
53], a higher ORR current density is obtained of about −8.0 mA∙cm
−2 compared with −6.0 mA∙cm
−2 for Pt
25Ni
16Co
59/C at similar conditions.


