
Dynamic Recrystallization and Its Effect on Superior Plasticity of Cold-Rolled Bioabsorbable Zinc-Copper Alloys

 , , , ,
Abstract
:1. Introduction
2. Materials and Methods
3. Results
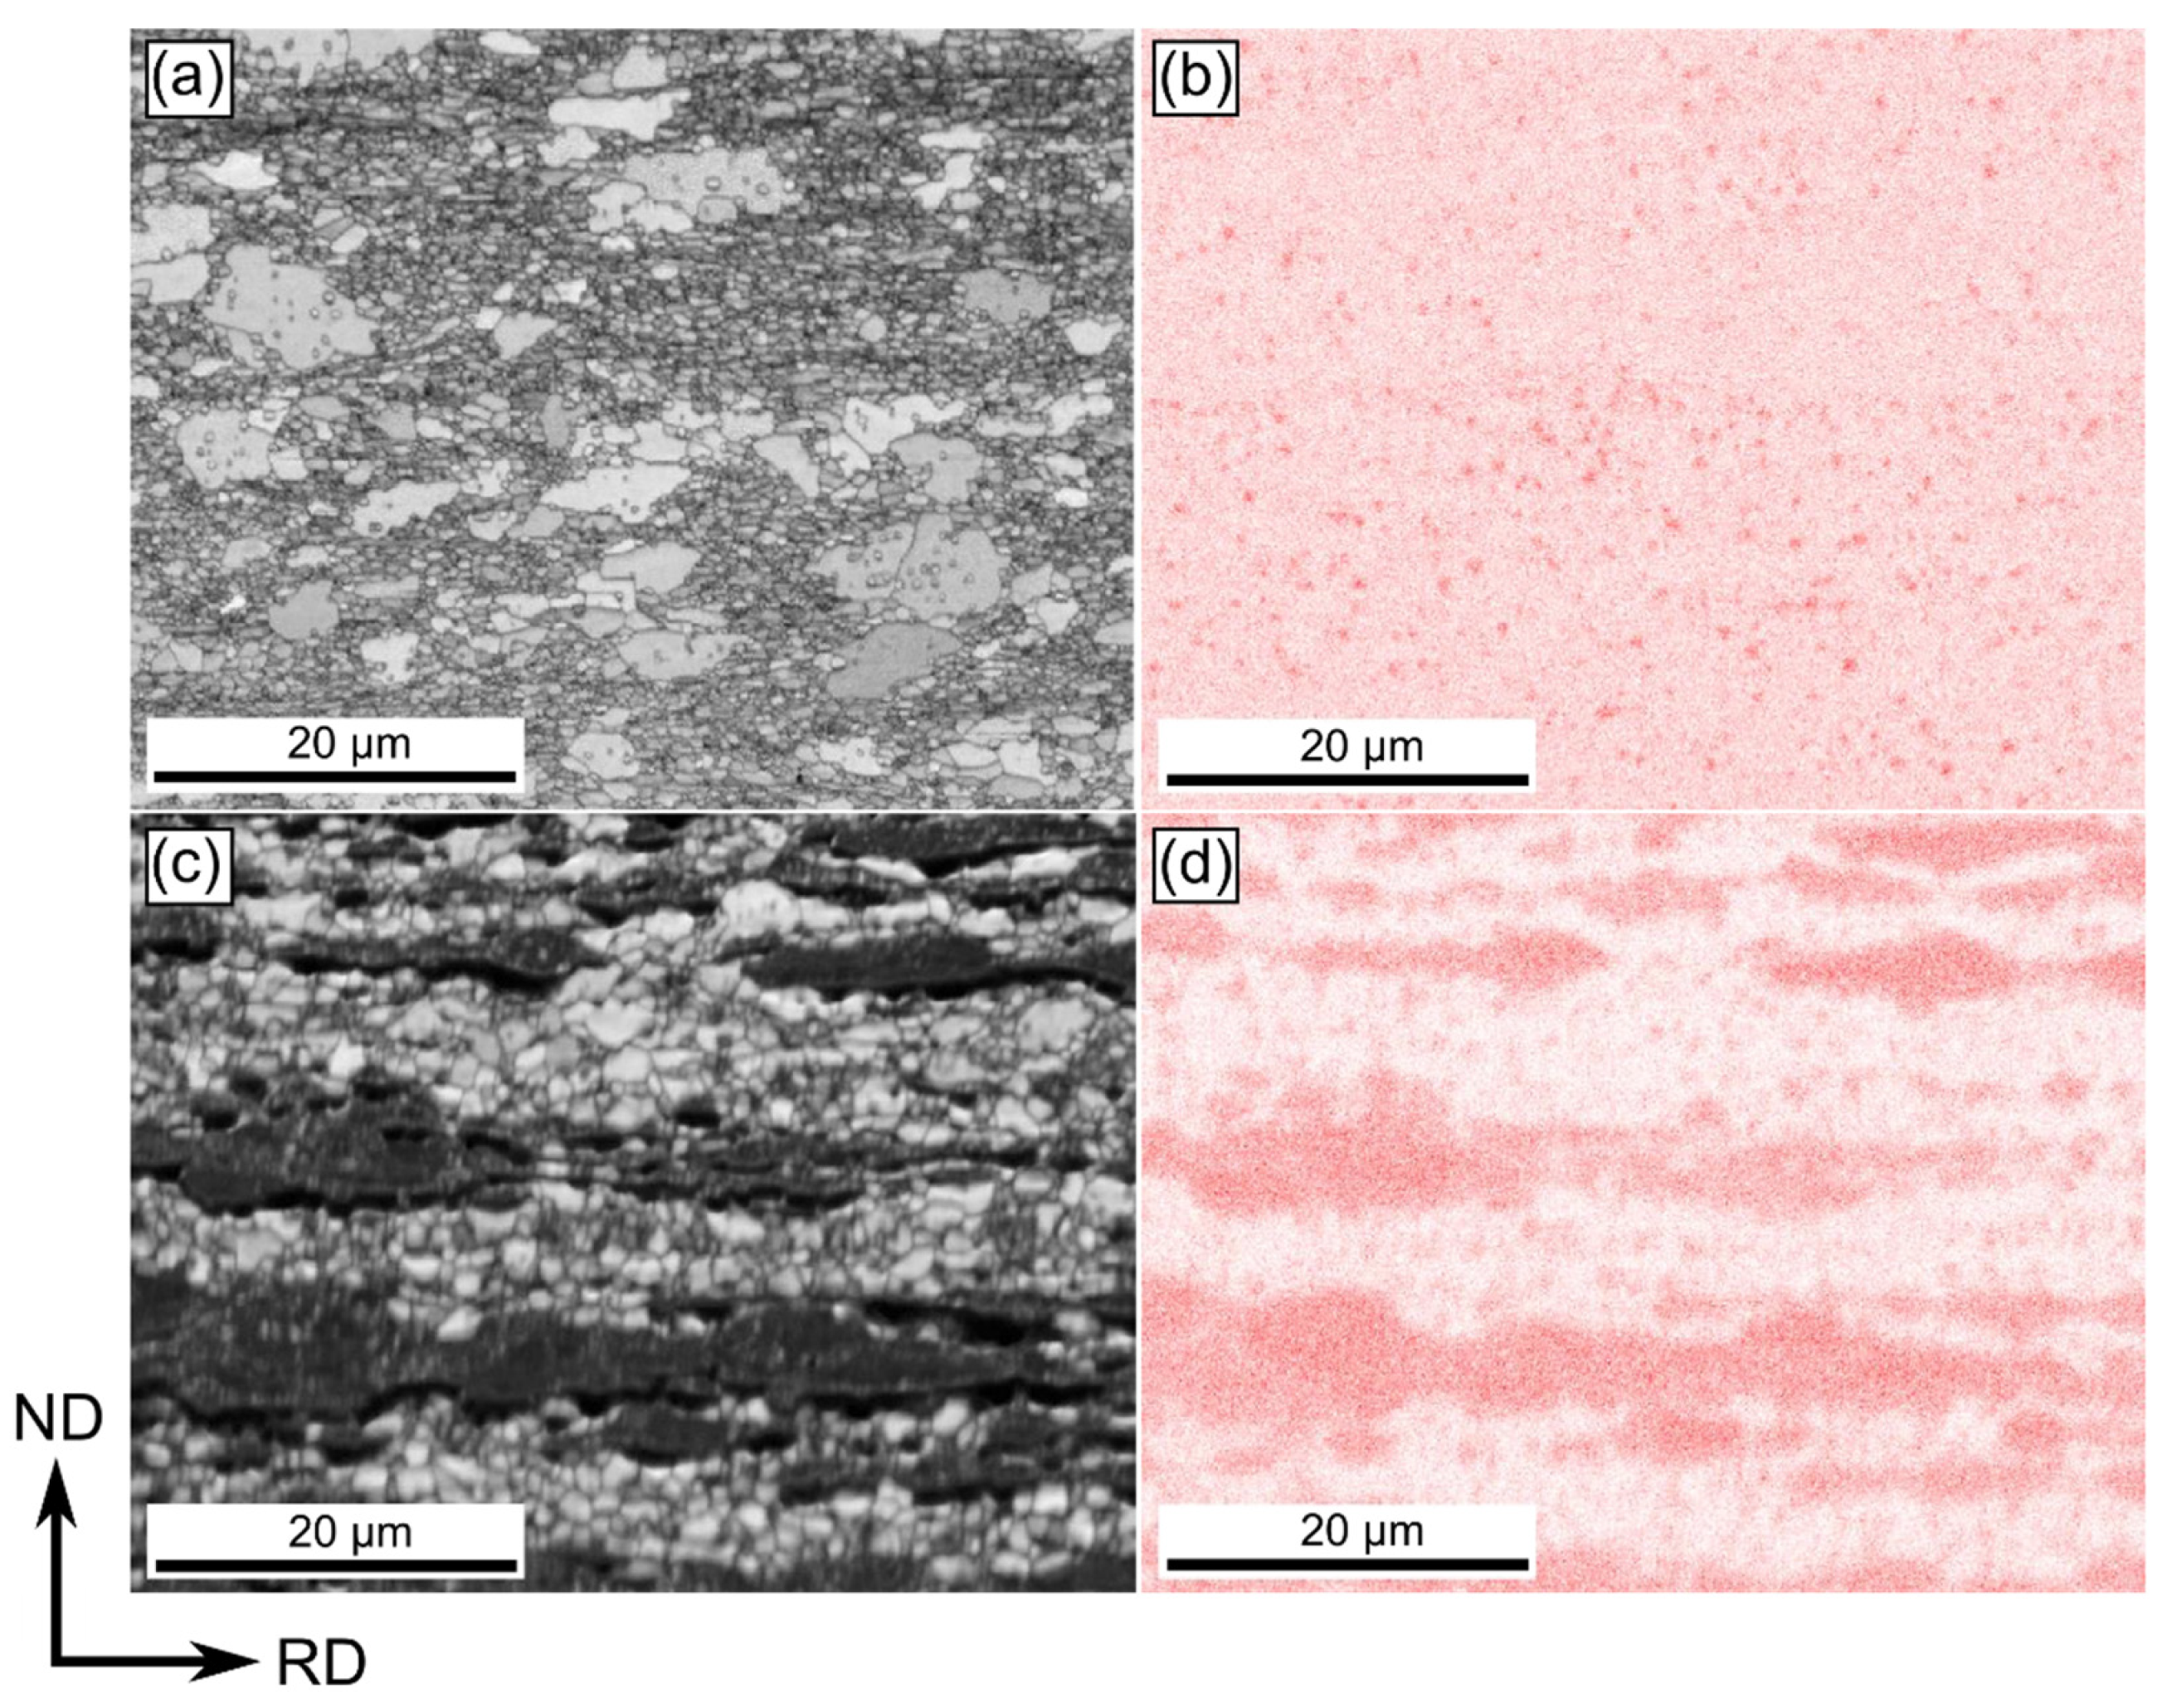
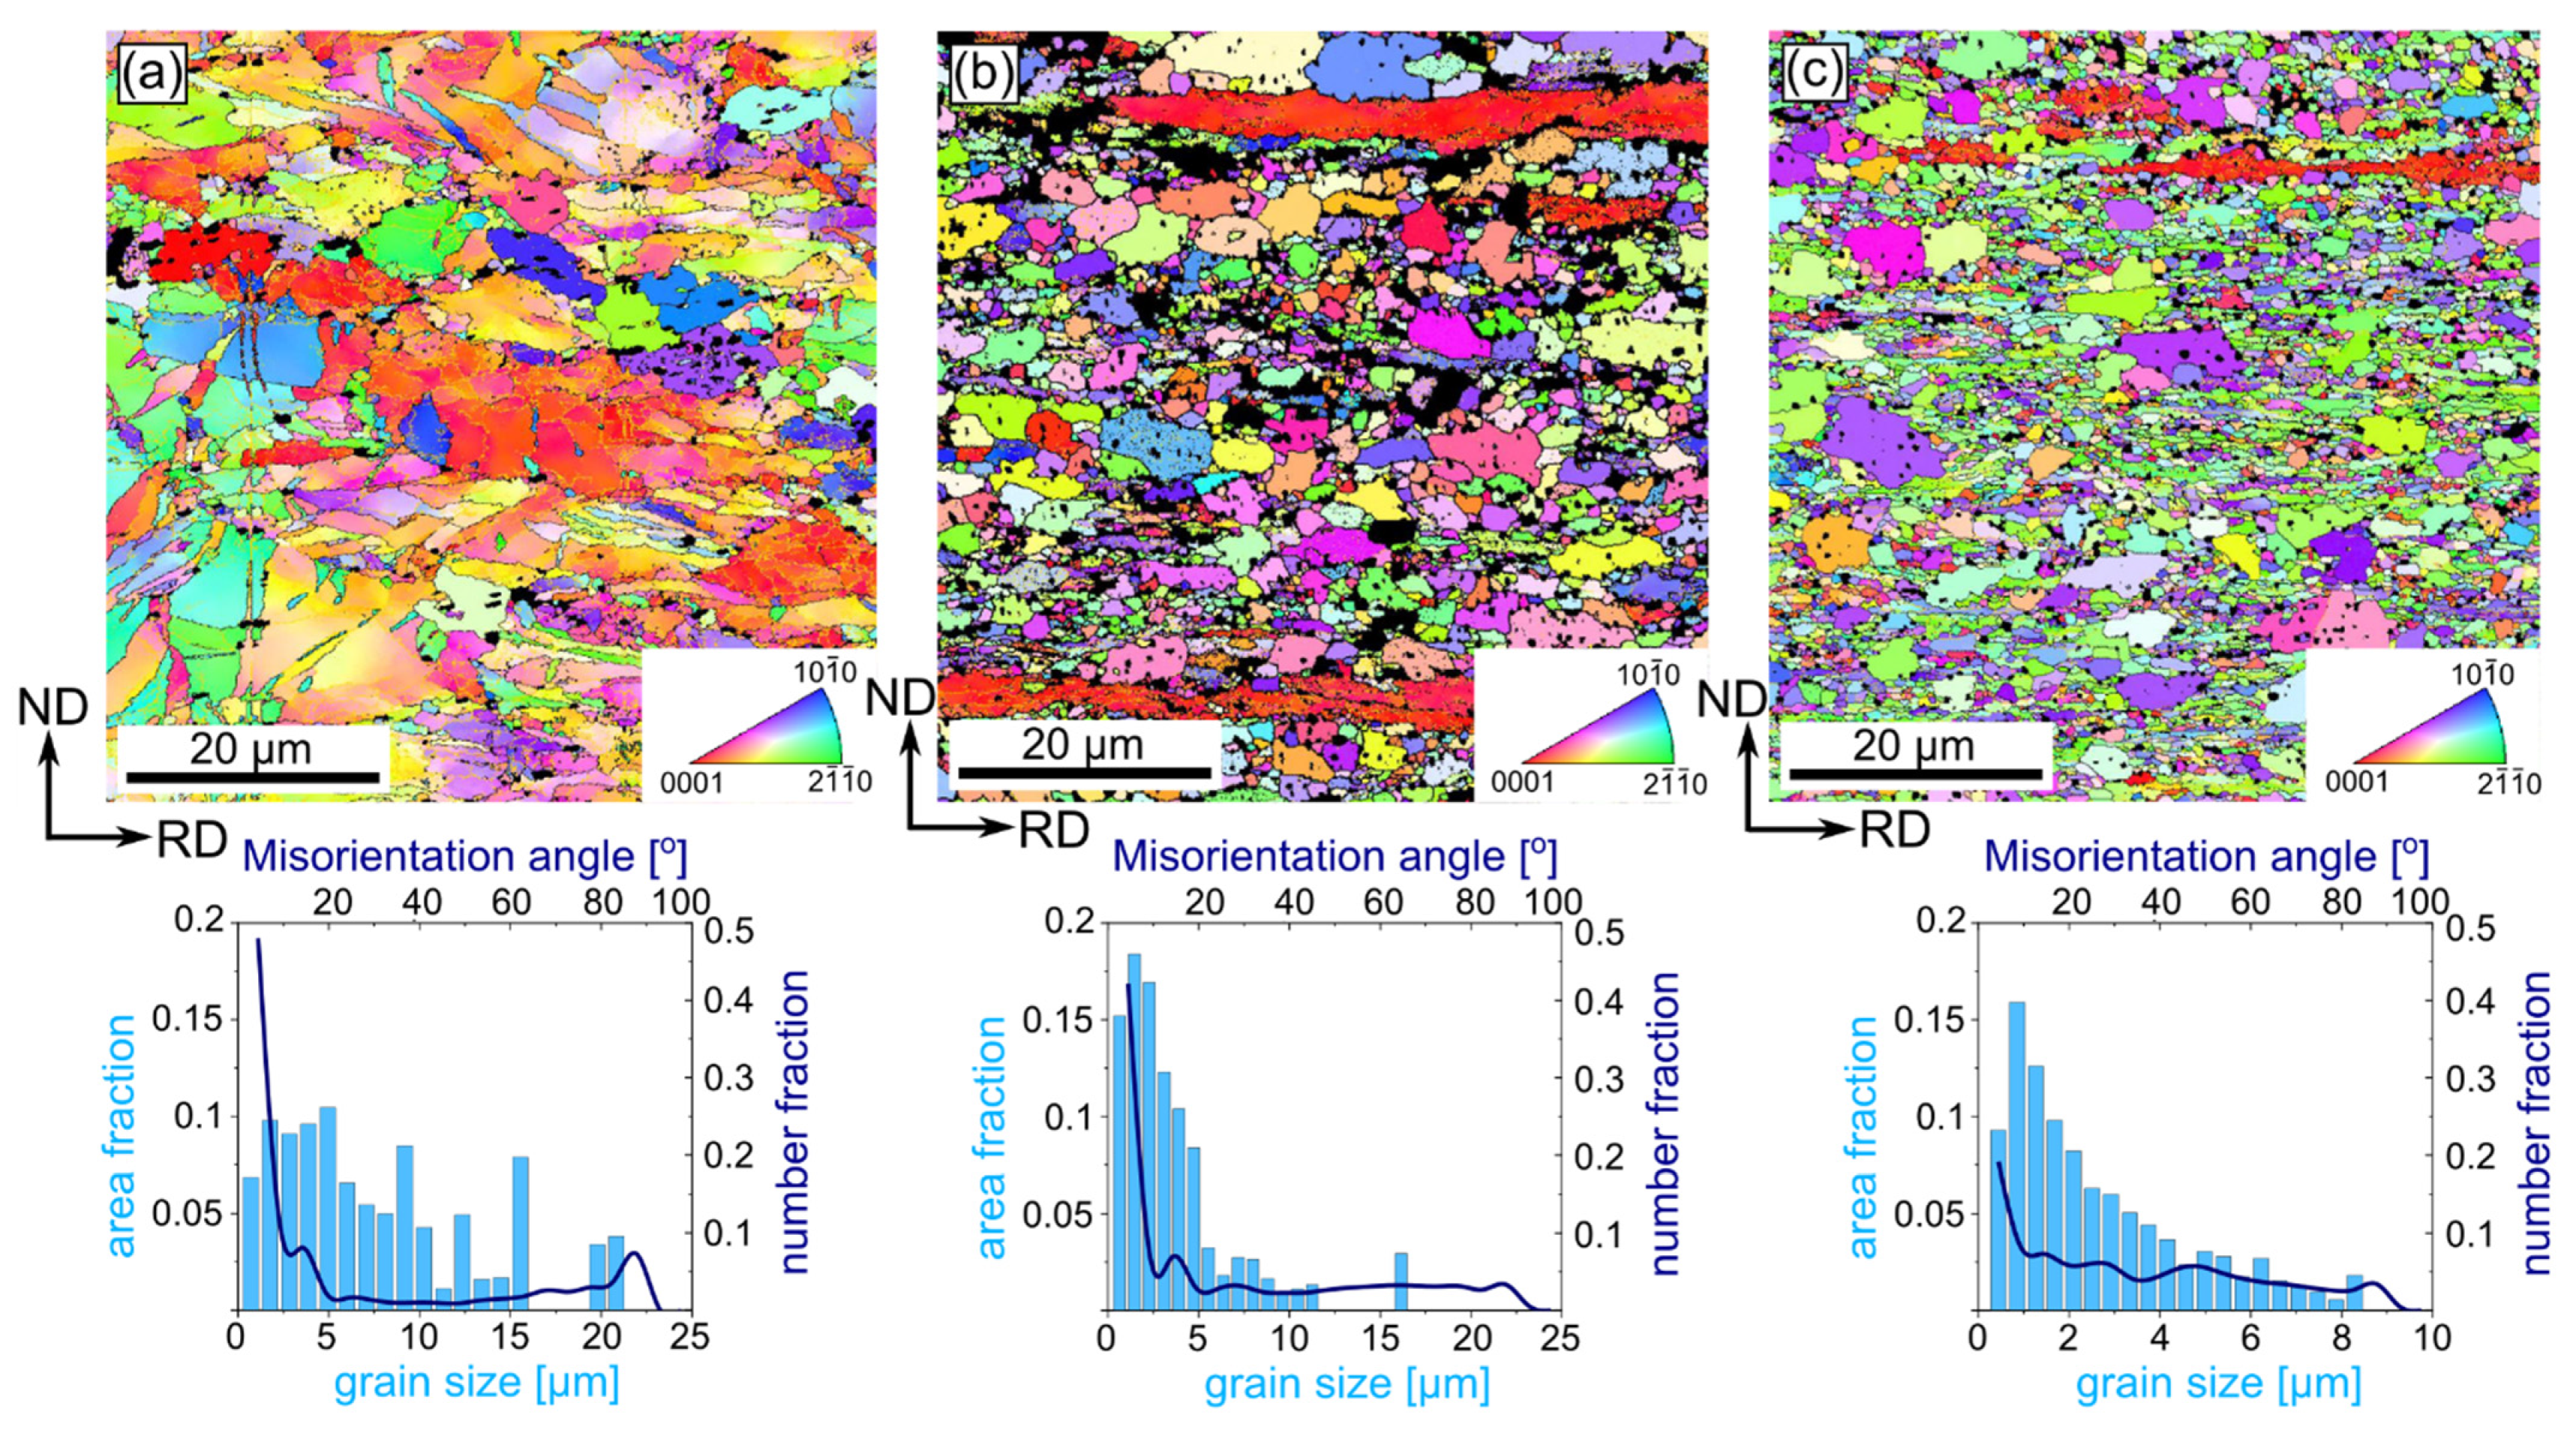
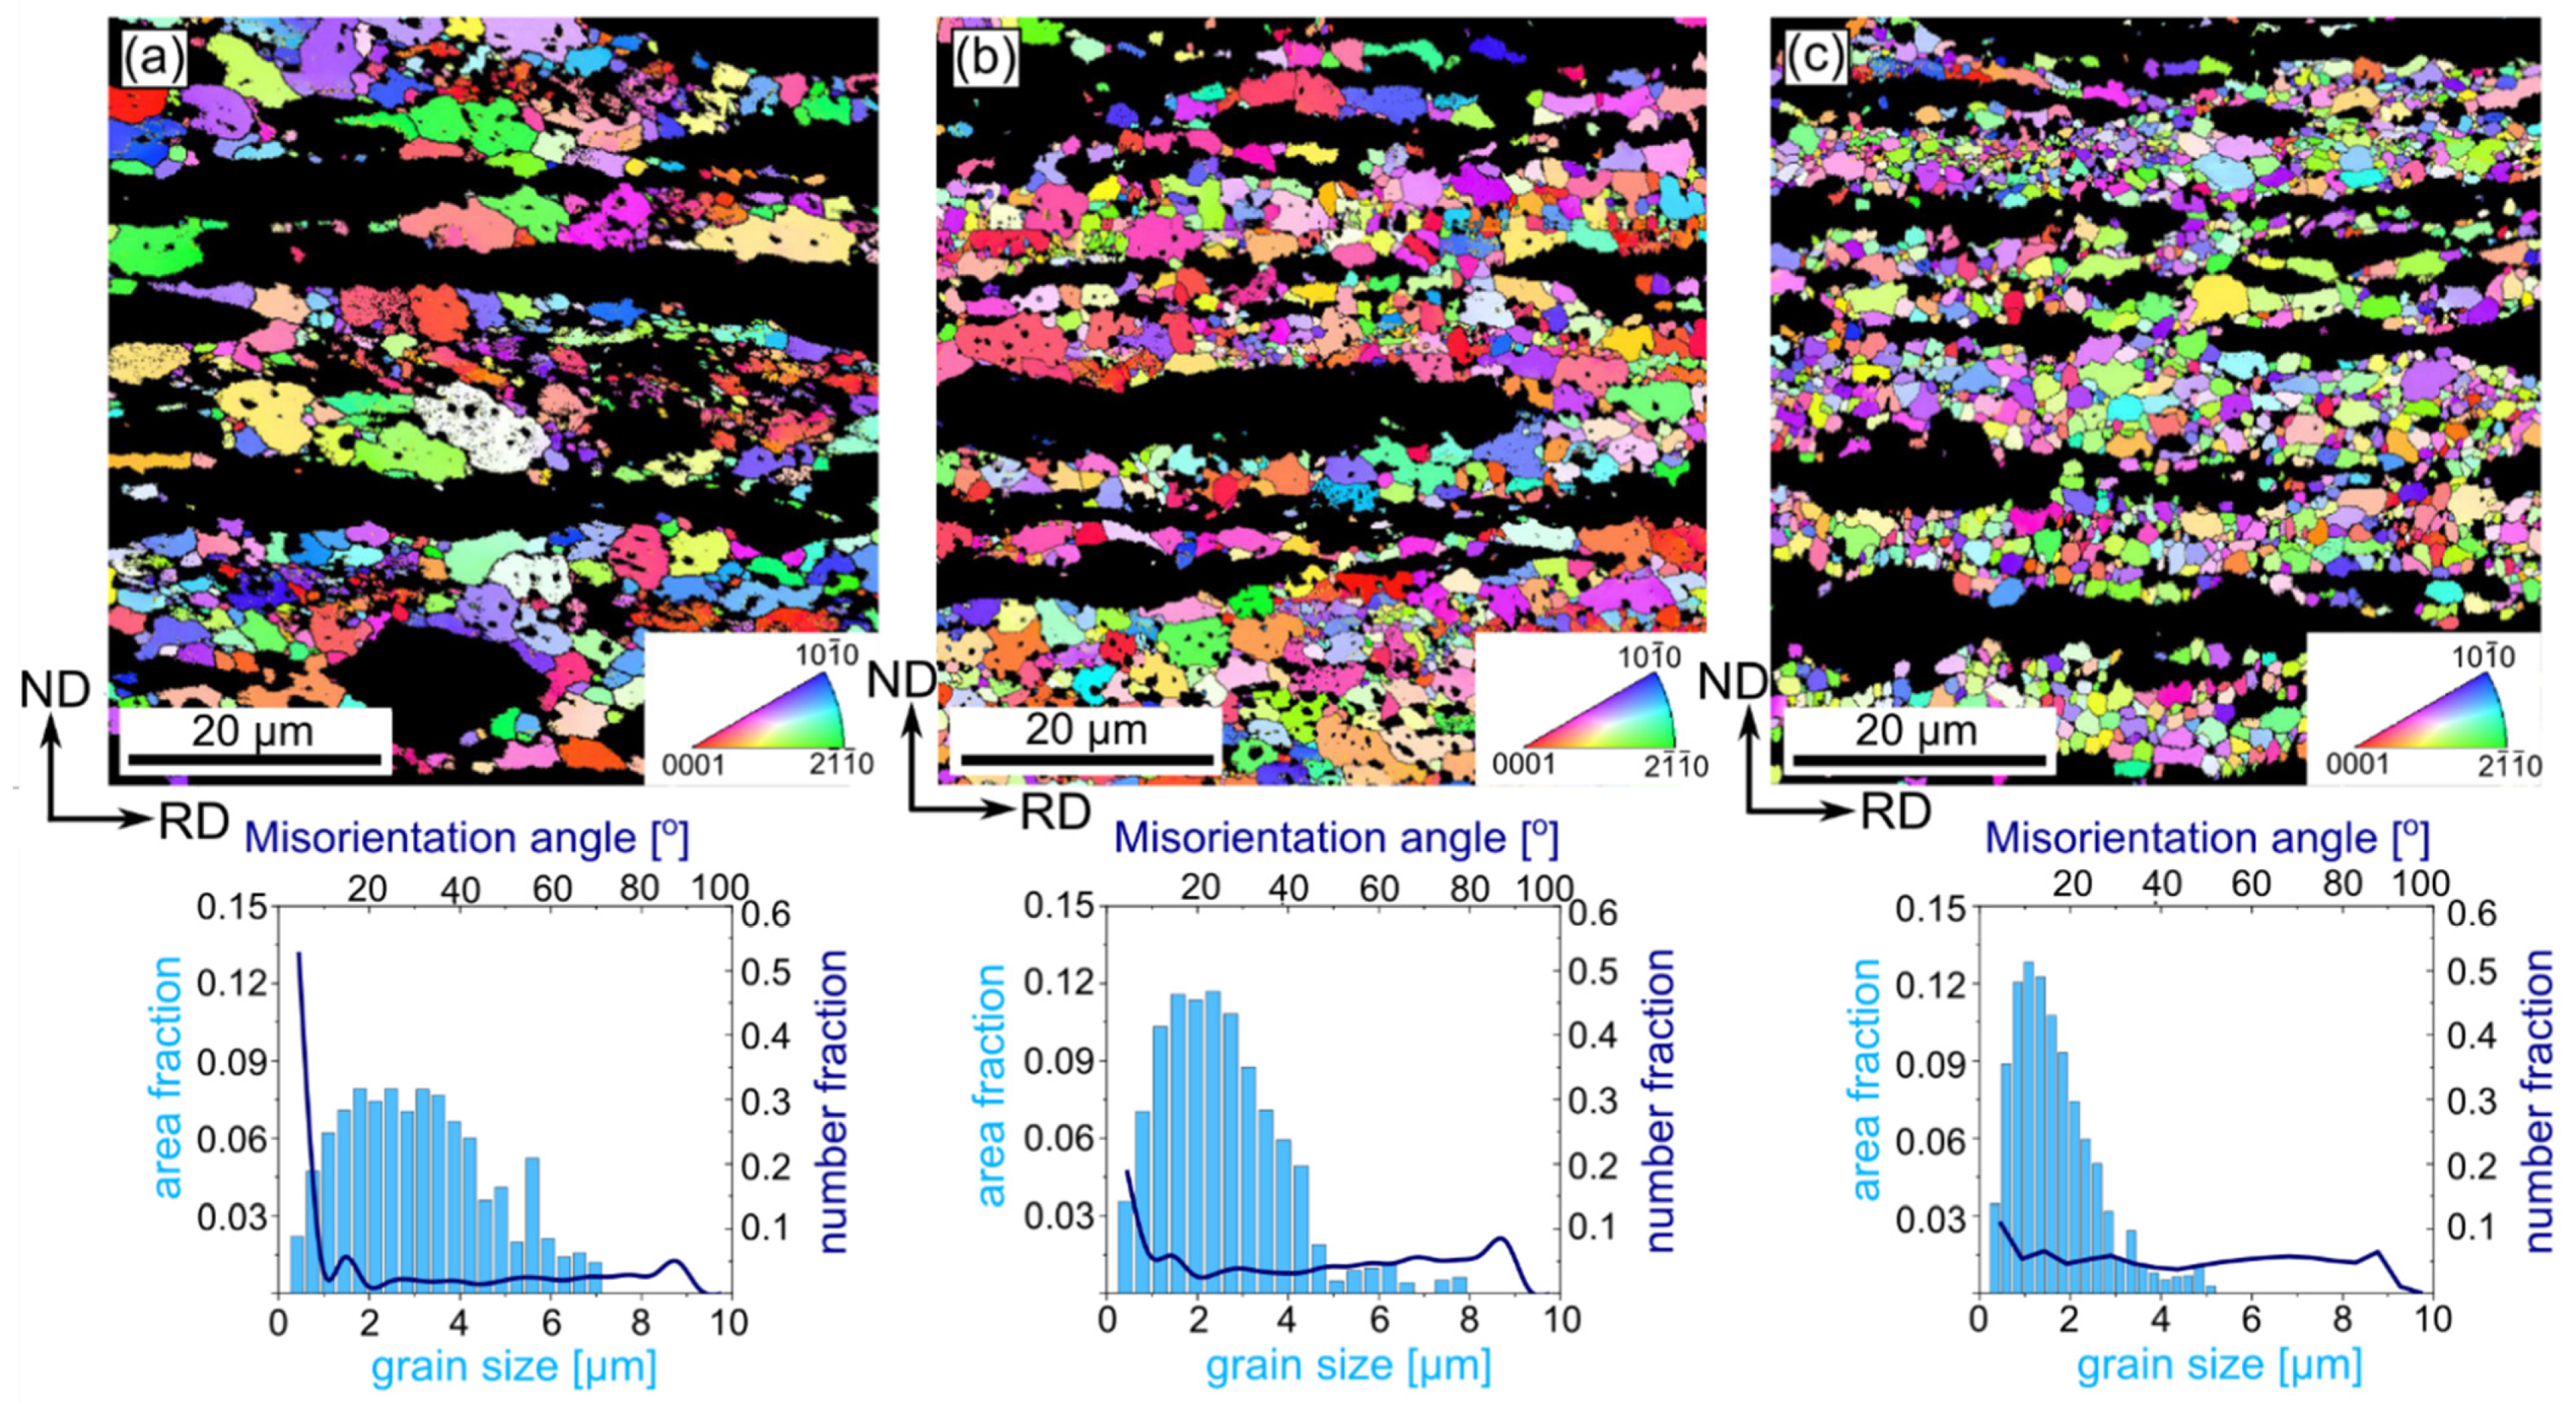
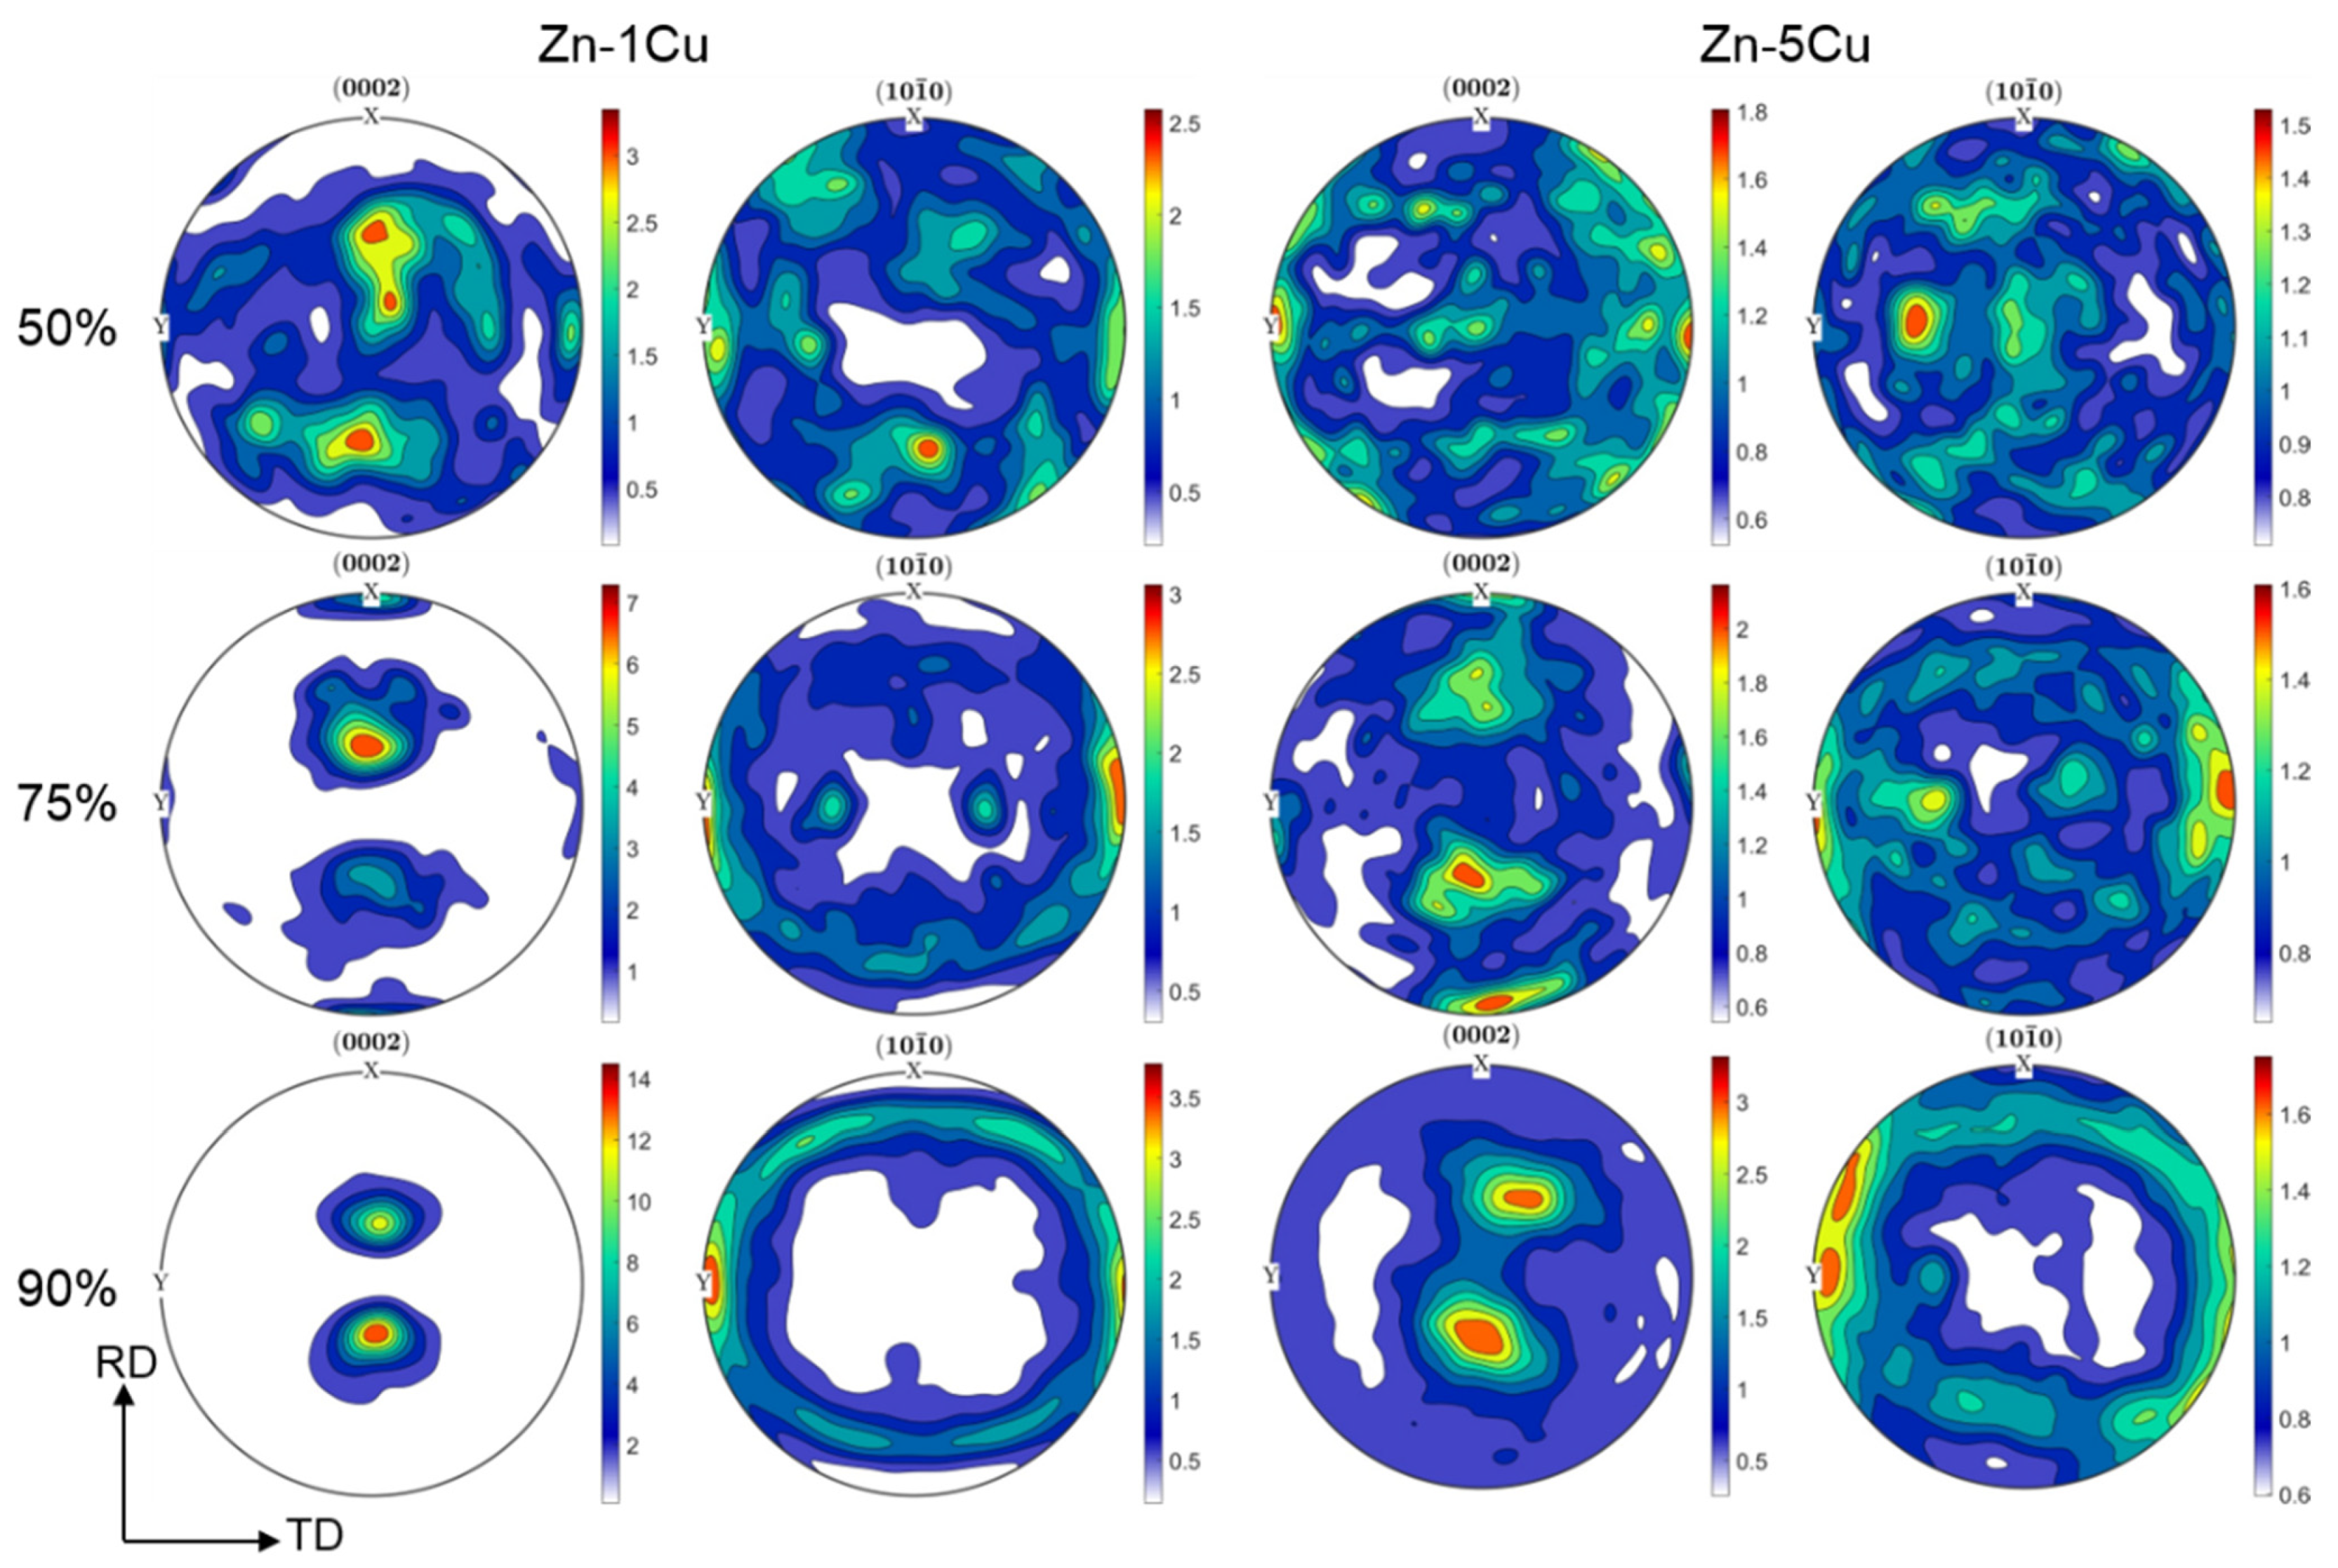
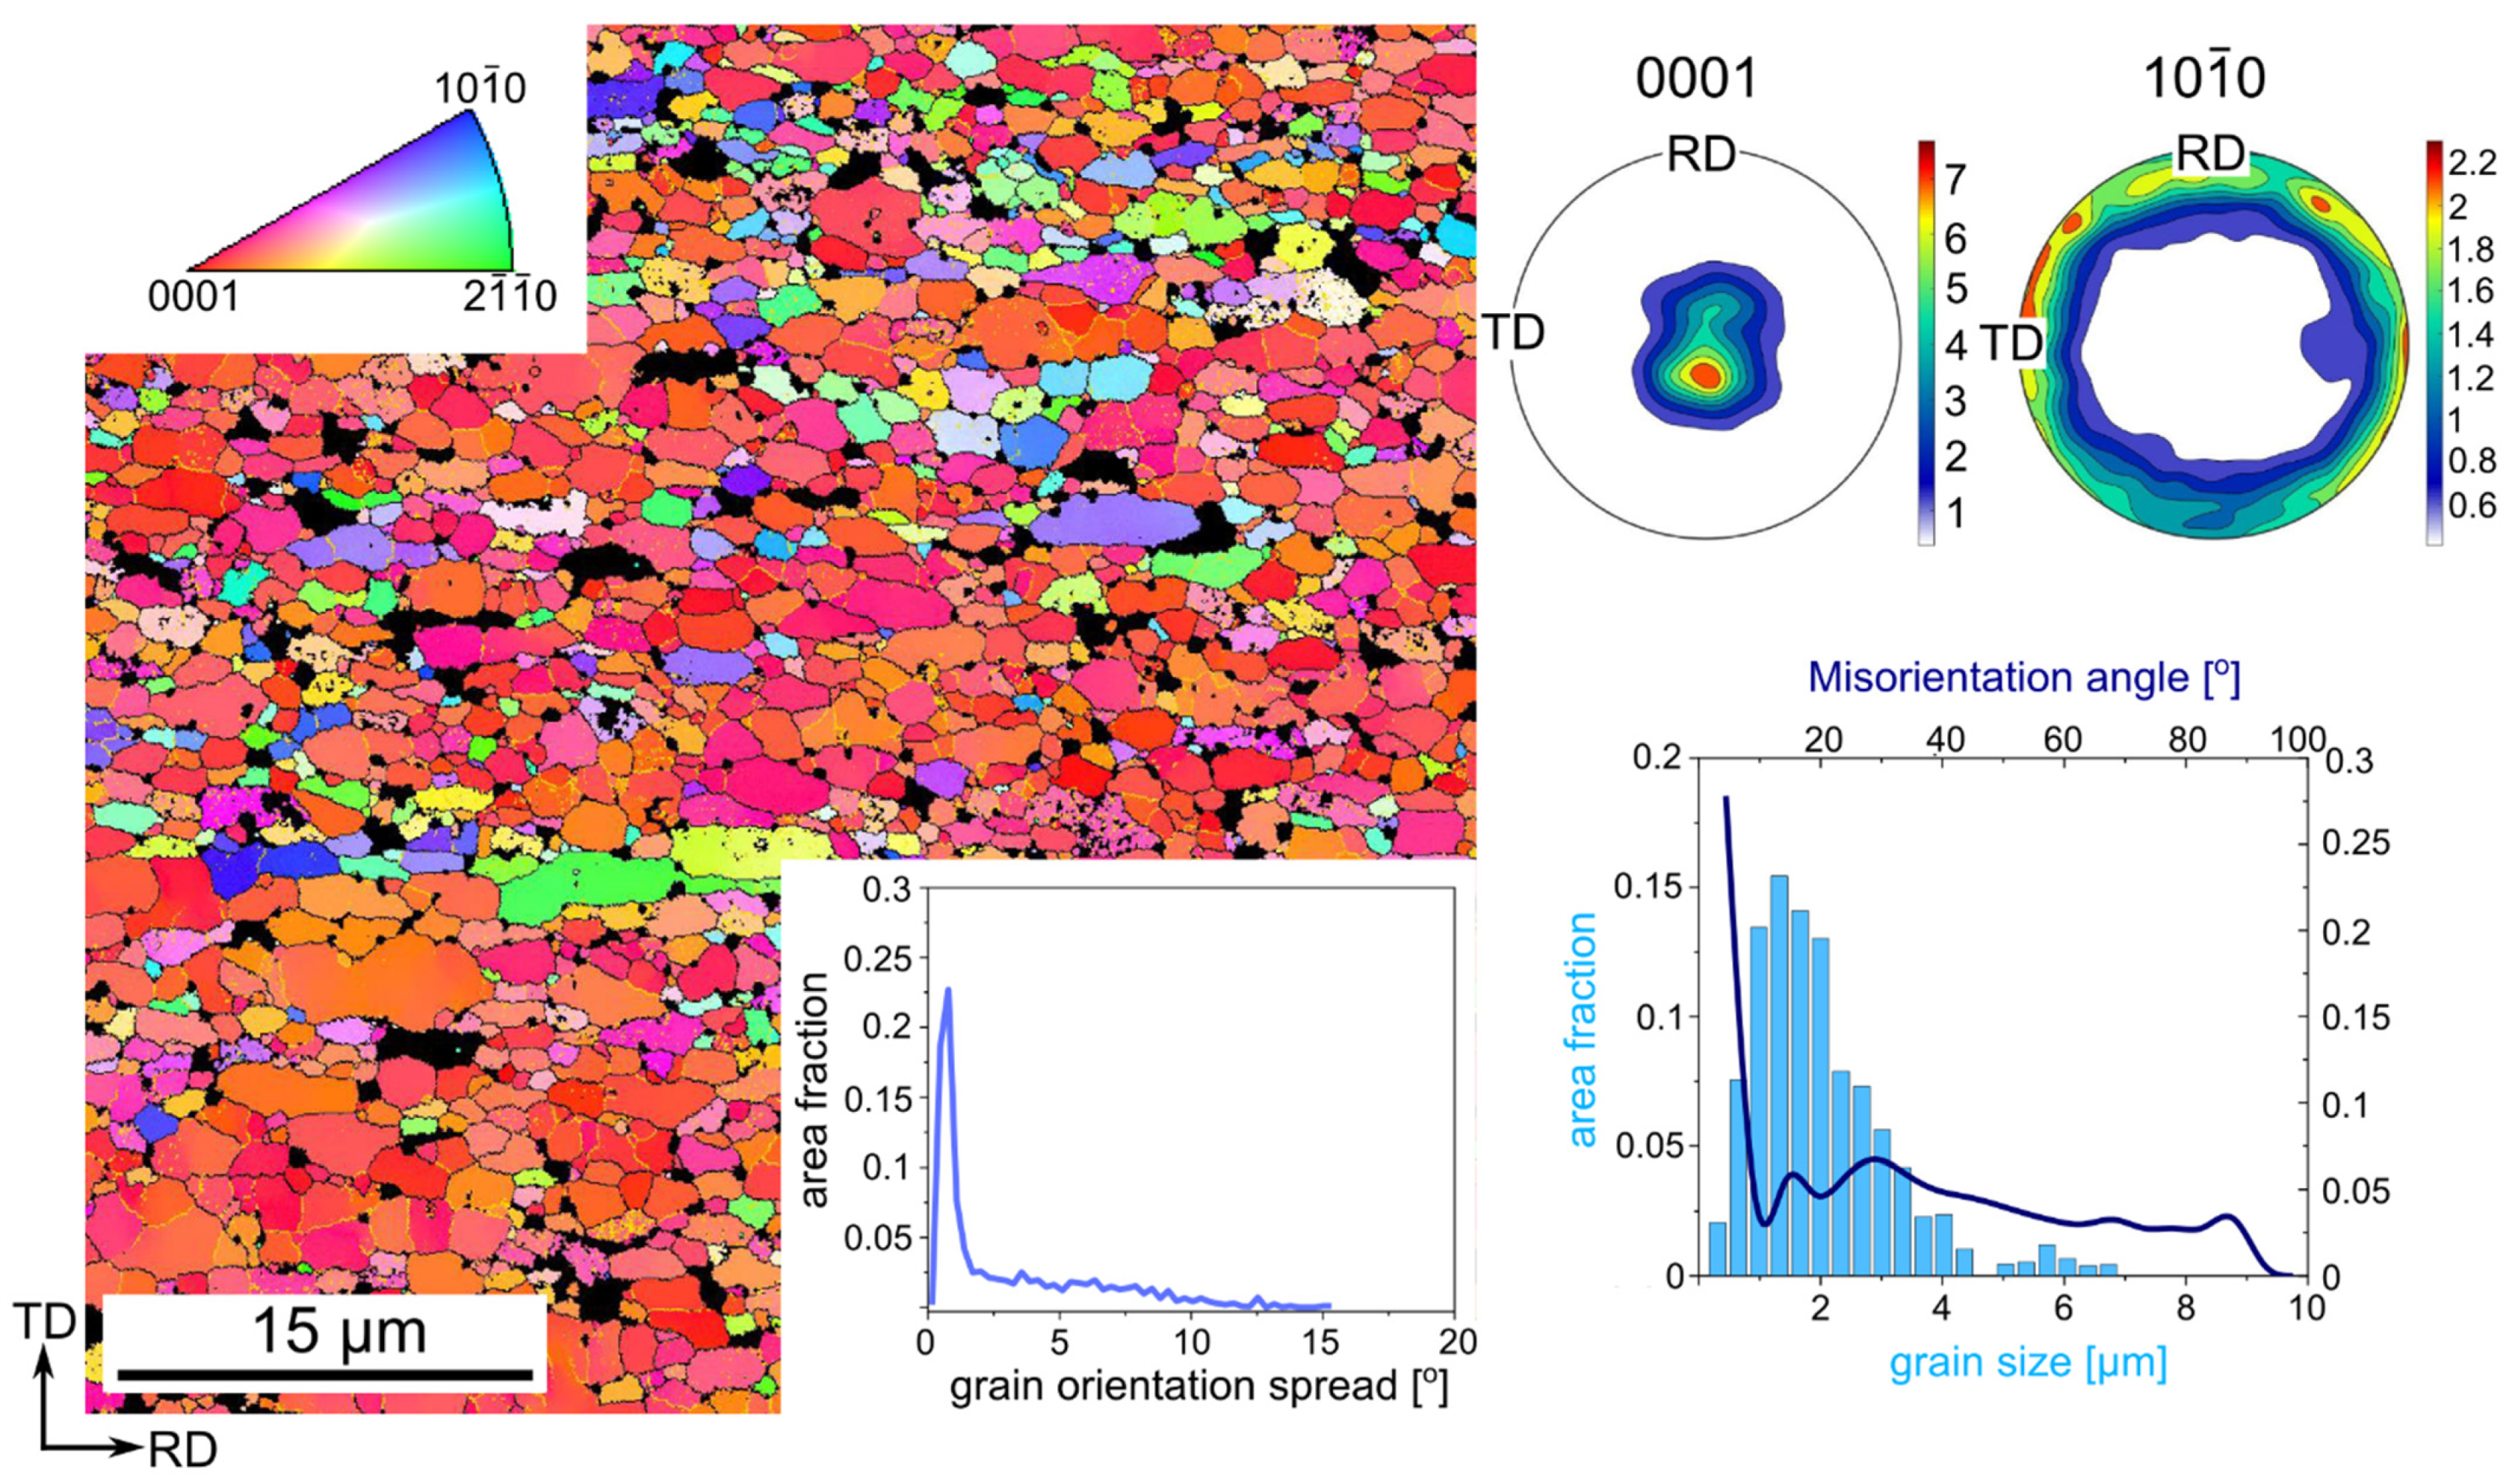
3.1. SEM/EBSD Characterization of Cold-Rolled Zn-Cu Alloys
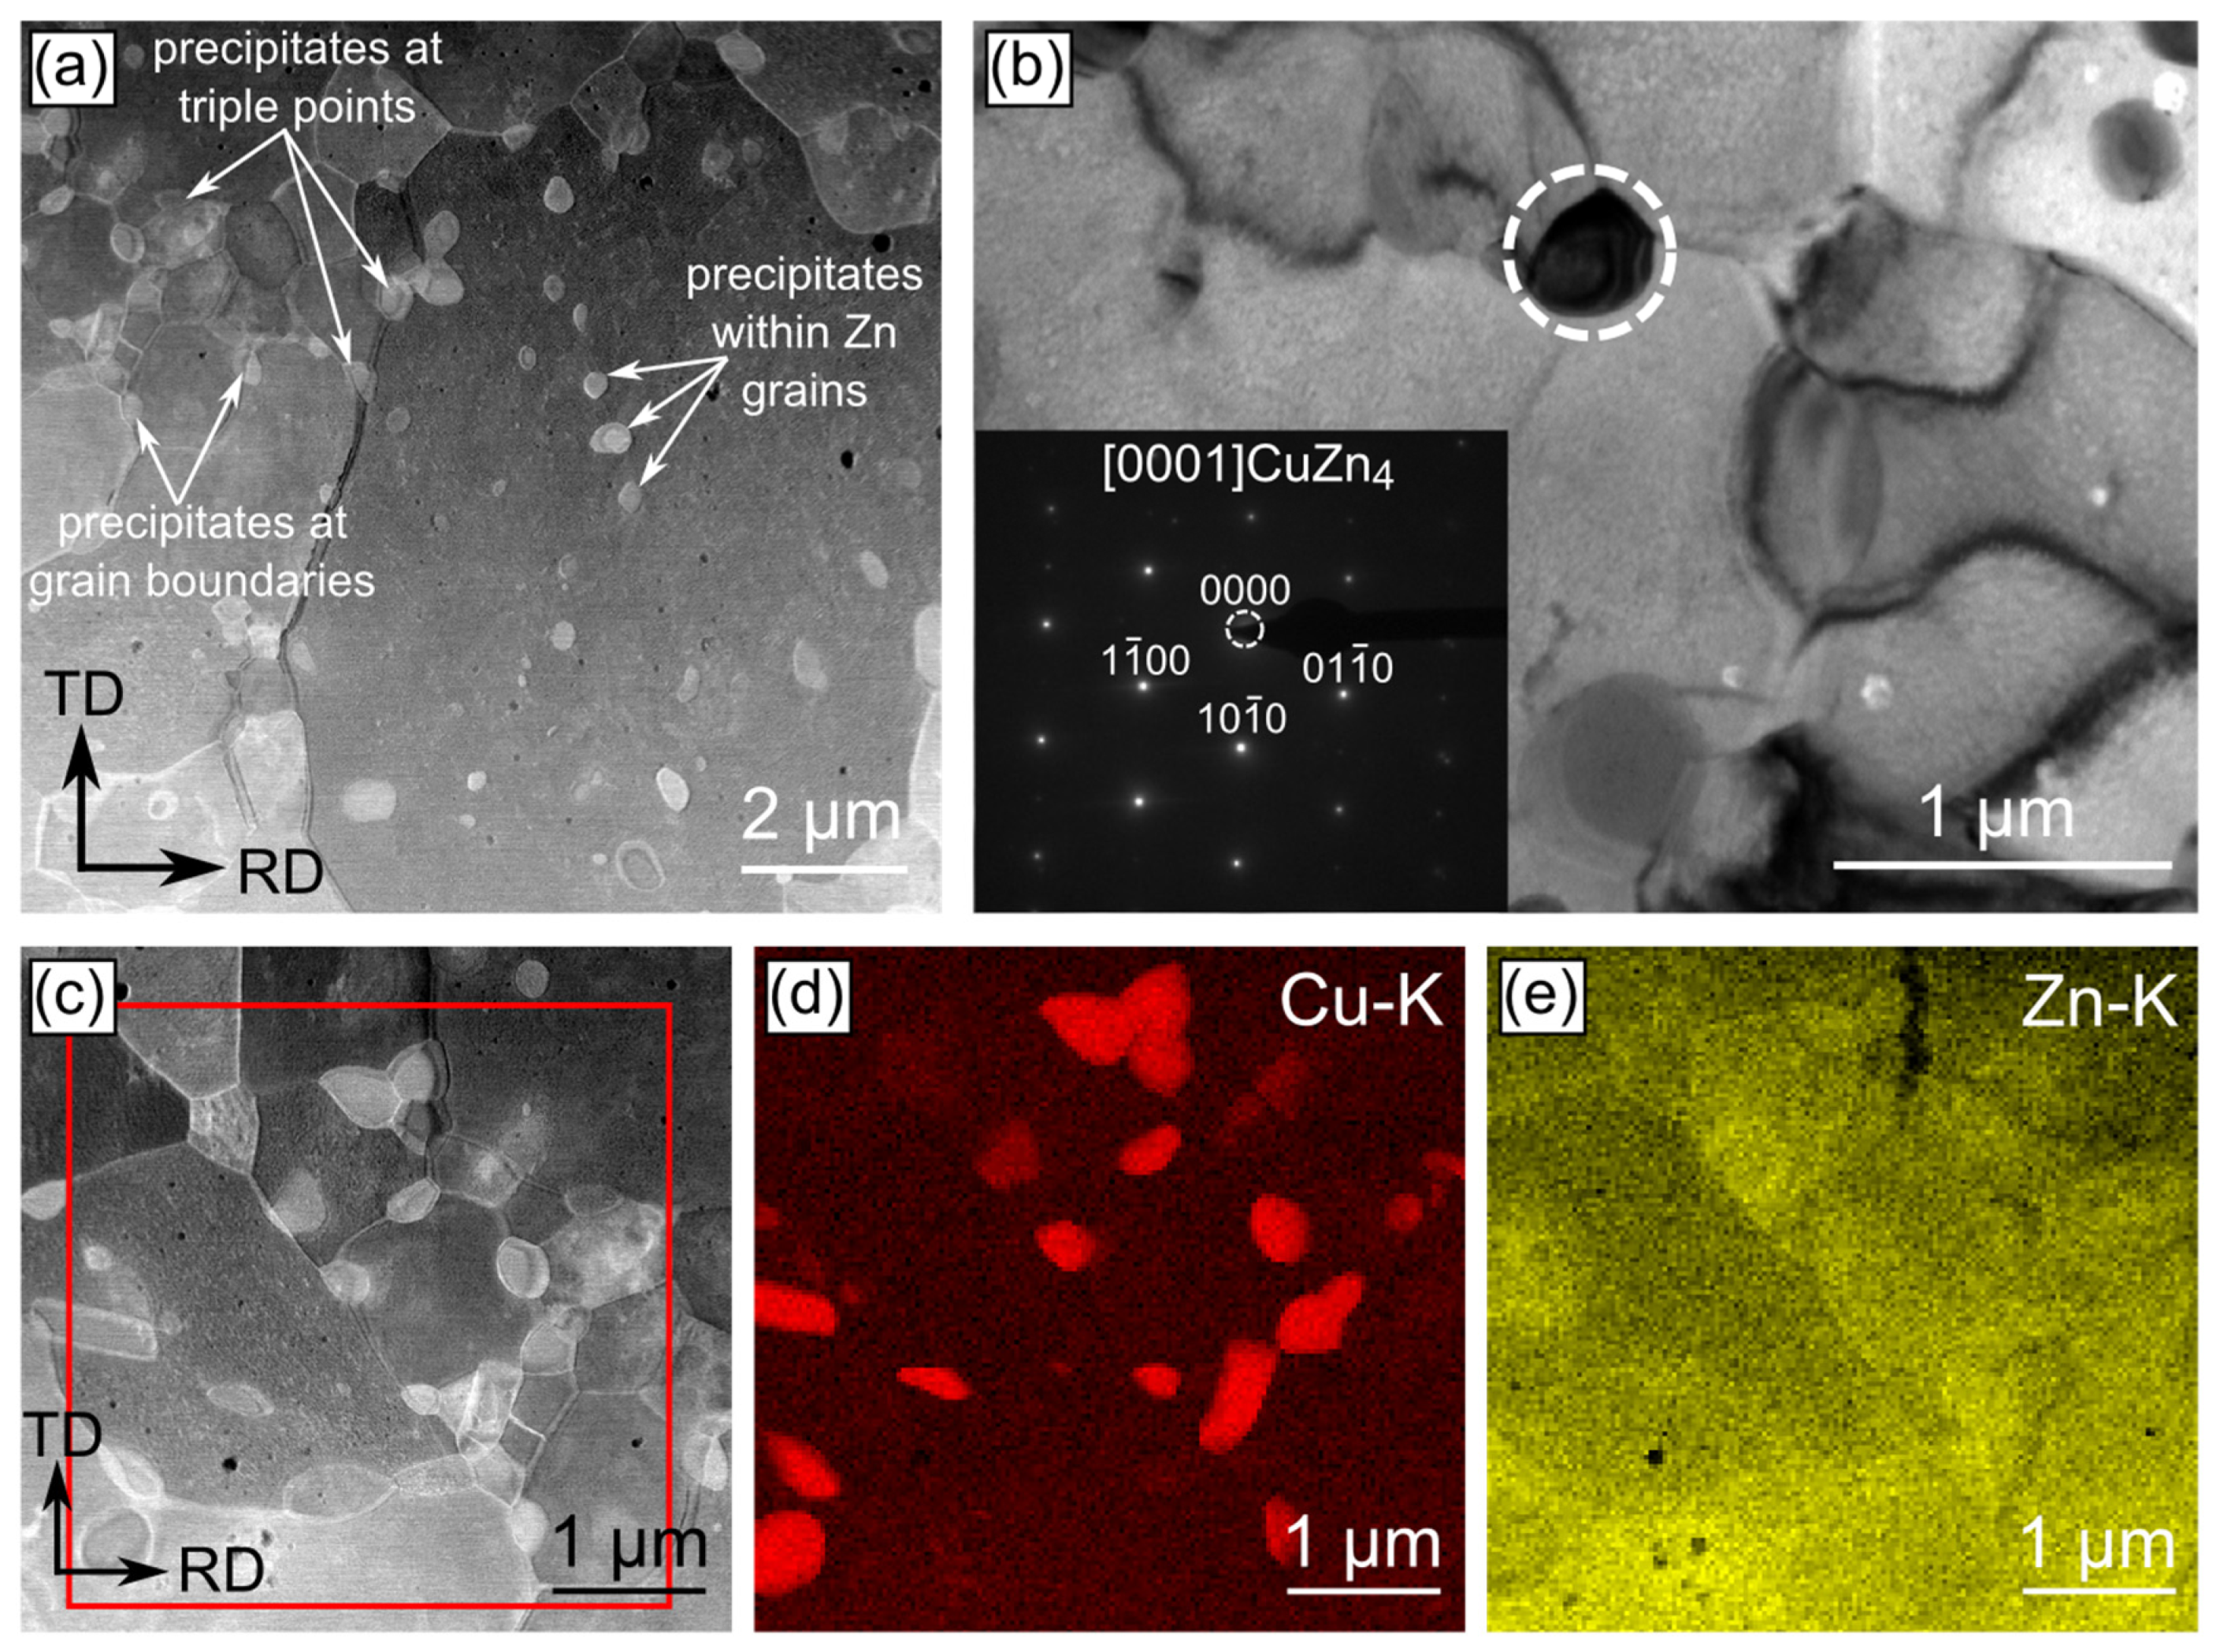
3.2. TEM Nanoscale Characterization of Cold-Rolled Zn-Cu Alloys
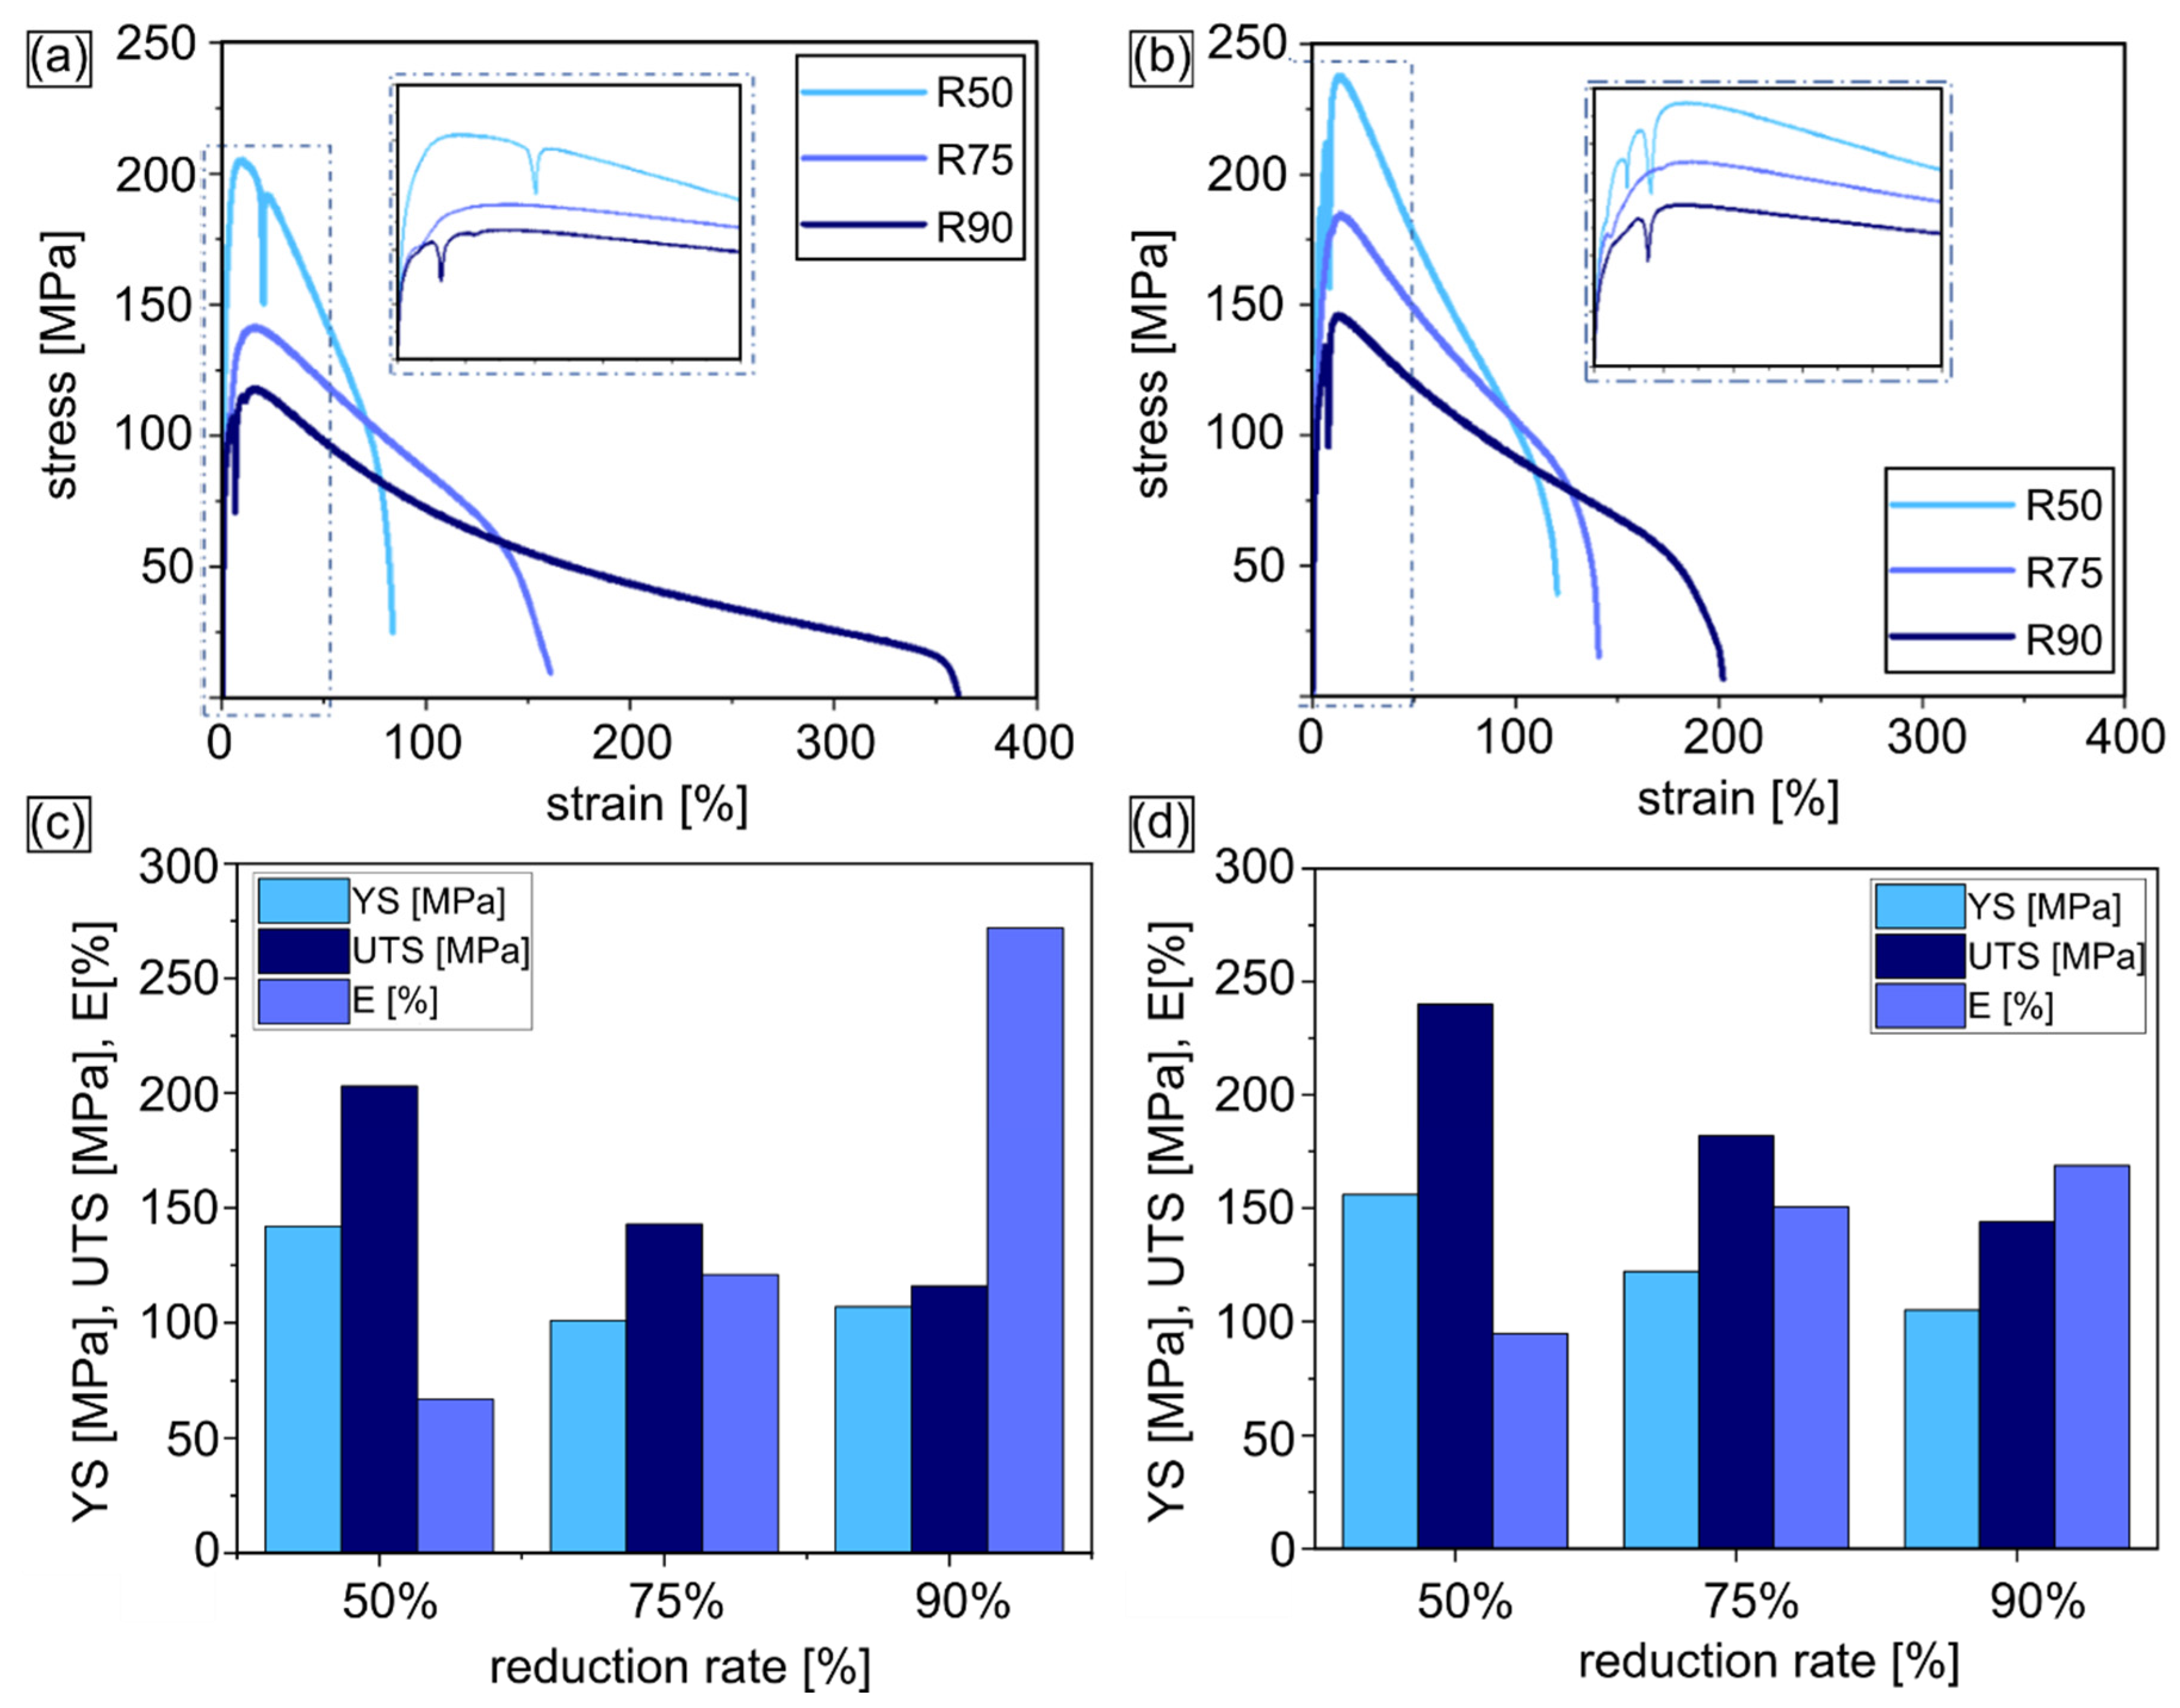
3.3. Mechanical Properties of Cold-Rolled Zn-Cu Alloys
4. Discussion
4.1. Continuous Dynamic Recrystallization in Cold-Rolled Zn-Cu Alloys
4.2. Superior Plasticity of Cold-Rolled Zn-Cu Alloys
5. Conclusions
Author Contributions
Funding
Institutional Review Board Statement
Informed Consent Statement
Data Availability Statement
Acknowledgments
Conflicts of Interest
References
- Venezuela, J.; Dargusch, M.S. The influence of alloying and fabrication techniques on the mechanical properties, biodegradability and biocompatibility of zinc: A comprehensive review. Acta Biomater. 2019, 87, 1–40. [Google Scholar] [CrossRef] [Green Version]
- Kabir, H.; Munir, K.; Wen, C.; Li, Y. Recent research and progress of biodegradable zinc alloy and composites for biomedical applications: Biomechanical and biocorrosion perspectives. Bioact. Mater. 2021, 6, 836–879. [Google Scholar] [CrossRef]
- Levy, G.K.; Goldman, J.; Aghion, E. The prospect of zinc as a structural material for biodegradable implants—A review paper. Metals 2017, 7, 402. [Google Scholar] [CrossRef] [Green Version]
- Yang, H.; Jia, B.; Zhang, Z.; Qu, X.; Li, G.; Lin, W.; Zhu, D.; Dai, K.; Zheng, Y. Alloying design of biodegradable zinc as promising bone implants for load-bearing applications. Nat. Comun. 2020, 11, 401. [Google Scholar] [CrossRef] [Green Version]
- Bowen, P.K.; Shearier, E.R.; Zhao, S.; Guillory, R.J., II; Zhao, F.; Goldman, J.; Drelich, J.W. Biodegradable Metals for Cadiovascular Stents: From Clinical Concerns to Recent Zn-Alloys. Adv. Healthc. Mater. 2016, 5, 1121–1140. [Google Scholar] [CrossRef] [PubMed] [Green Version]
- Kawahara, M. Effects of aluminium on the nervous system and its possible link with neurodegenerative diseases. J. Alzheimers Dis. 2005, 8, 171–182. [Google Scholar] [CrossRef] [PubMed]
- Grass, G.; Rensing, C.; Solioz, M. Metallic Copper as an Antimicrobial Surface. Appl. Environ. Microbiol. 2011, 77, 1541–1574. [Google Scholar] [CrossRef] [PubMed] [Green Version]
- Znhang, E.; Zhao, X.; Hu, J.; Wang, R.; Fu, S.; Qin, G. Antibacterial metals and alloys for potential biomedical implants. Bioact. Mater. 2021, 6, 2569–2612. [Google Scholar] [CrossRef]
- Bednarczyk, W.; Kawałko, J.; Wątroba, M.; Bała, P. Achieving room temperature superplasticity in the Zn-0.5Cu alloy processed via equal channel angular pressing. Mater. Sci. Eng. A 2018, 723, 126–133. [Google Scholar] [CrossRef]
- Niu, J.; Tang, Z.; Huanh, H.; Pei, J.; Zhang, H.; Yuan, G.; Ding, W. Research on a Zn-Cu alloy as biodegradable material for potential vascular stents application. Mater. Sci. Eng. C 2016, 69, 407–413. [Google Scholar] [CrossRef]
- Lin, J.; Tong, X.; Wang, K.; Sji, Z.; Li, Y.; Dargusch, M.; Wen, C. Biodegradable Zn-3Cu and Zn-3Cu-0.2Ti alloys with ultrahigh ductility and antibacterial ability for orthopedic applications. J. Mater. Sci. Technol. 2021, 68, 76–90. [Google Scholar] [CrossRef]
- Mosayyebi, A.; Manes, C.; Carugo, D.; Smoani, B.K. Advanes in Ureteral Stent Designe and Materials. Curr. Urol. Rep. 2018, 19, 35. [Google Scholar] [CrossRef] [PubMed] [Green Version]
- Li, P.; Zhang, W.; Dai, J.; Xepapadeas, A.B.; Schweizer, E.; Alexander, D.; Scheideler, L.; Zhou, C.; Zhang, H.; Wan, G.; et al. Investigation of zinc-copper alloys as potential materials for craniomaxillofacial osteosynthesis implants. Mater. Sci. Eng. C 2019, 103, 109826. [Google Scholar] [CrossRef] [PubMed]
- Zhou, C.; Li, H.F.; Yin, Y.X.; Shi, Z.Z.; Li, T.; Feng, X.Y.; Zhang, J.W.; Song, C.X.; Cui, X.S.; Xu, K.L.; et al. Long-term in vivo study of biodegradable Zn-Cu stent: A 2-year implantation evaluation in porcine coronary artery. Acta Biomater. 2019, 97, 657–670. [Google Scholar] [CrossRef] [PubMed]
- Tang, Z.; Niu, J.; Huang, H.; Zhang, H.; Pei, J.; Ou, J.; Yuan, G. Potential biodegradable Zn-Cu binary alloys developed for cardiovascular implant applications. J. Mech. Behav. Biomed. Mater. 2017, 72, 182–191. [Google Scholar] [CrossRef] [PubMed]
- Qu, X.; Yang, H.; Jia, B.; Yu, Z.; Zheng, Y.; Dai, K. Biodegradable Zn-Cu alloys show antibacterial activity against MRSA bone infection by inhibiting pathogen adhesion and biofilm formation. Acta Biomater. 2020, 117, 400–417. [Google Scholar] [CrossRef] [PubMed]
- Tang, Z.; Huang, H.; Niu, J.; Zhang, L.; Zhang, H.; Pei, J.; Tan, J.; Yuan, G. Design and characterizations of novel biodegradable Zn-Cu-Mg alloys for potential biodegradable implants. Mater. Des. 2017, 117, 84–94. [Google Scholar] [CrossRef]
- Wang, Y.N.; Huang, J.C. Texture analysis in hexagonal materials. Mater. Chem. Phys. 2003, 81, 11–26. [Google Scholar] [CrossRef]
- Hadadzadeh, A.; Mokdad, F.; Wells, M.A.; Chen, D.L. A new grain orientation spread to analyze the dynamic recrystallization behavior of a cast-homogenized Mg-Zn-Zr alloy using electron backscattered diffraction. Mater. Sci. Eng. A 2018, 709, 285–289. [Google Scholar] [CrossRef]
- Shi, Z.Z.; Gao, X.X.; Zhang, H.J.; Liu, X.F.; Li, H.Y.; Zhou, C.; Yin, Y.X.; Wang, L.N. Design biodegradable Zn alloys: Second phases and their significant influence on alloy properties. Bioact. Mater. 2020, 5, 210–218. [Google Scholar] [CrossRef]
- Huang, K.; Loge, R.E. A review of dynamic recrystallization phenomena in metallic materials. Mater. Des. 2016, 111, 548–574. [Google Scholar] [CrossRef]
- Wątroba, M.; Bednarczyk, W.; Kawałko, J.; Bała, P. Fine-tuning of mechanical properties in a Zn–Ag–Mg alloy via cold plastic deformation process and post-deformation annealing. Bioact. Mater. 2021, 6, 3424–3436. [Google Scholar] [CrossRef]
- Jarzębska, A.; Bieda, M.; Maj, Ł.; Chulist, R.; Wojtas, D.; Strąg, M.; Sułkowski, B.; Przybysz, S.; Pachla, W.; Sztwiertnia, K. Controlled grain refinement of biodegradable Zn-Mg alloy: The effect of magnesium alloying and multi-pass hydrostatic extrusion preceded by hot extrusion. Metall. Mater. Trans. A 2020, 51, 6784–6796. [Google Scholar] [CrossRef]
- Bednarczyk, W.; Wątroba, M.; Kawałko, J.; Bała, P. Can zinc alloys be strengthened by grain refinement? A critical evaluation of the processing of low-alloyed binary zinc alloys using ECAP. Mater. Sci. Eng. A 2019, 748, 357–366. [Google Scholar] [CrossRef]
- Roatta, A.; Leonard, M.; Nicoletti, E.; Singnorelli, J.W. Modeling texture during monotonic loading of Zn-Cu-Ti alloy sheet using the viscoplastic self-consistent polycrystal model. J. Alloys Compd. 2021, 860, 158425. [Google Scholar] [CrossRef]
- Leonard, M.; Moussa, C.; Roatta, A.; Seret, A.; Signorelli, J.W. Continuous dynamic recrystallization in a Zn-Cu-Ti sheet subjected to bilinear tensile strain. Mater. Sci. Eng. A 2020, 789, 139689. [Google Scholar] [CrossRef]
- Schlosser, F.; Schwindt, C.; Fuster, V.; Tommasi, A.; Signorelli, J.W. Crystallographic Texture Evolution of Zinc Sheet Subjected to Different Strain Paths. Metall. Mater. Trans. A 2017, 48A, 2858. [Google Scholar] [CrossRef]
- Wątroba, M.; Bednarczyk, W.; Kawałko, J.; Lech, S.; Wieczerzak, K.; Langdon, T.G.; Bała, P. A Novel High-Strength Zn-3Ag-0.5Mg Alloy Processed by Hot Extrusion, Cold Rolling, or High-Pressure Torsion. Metall. Mater. Trans. A 2020, 51, 3335–3348. [Google Scholar] [CrossRef]
- Liu, S.; Kent, D.; Zhan, H.; Doan, N.; Dargusch, M.; Wang, G. Dynamic recrystallization of pure zinc during high strin-rate compression at ambient temperature. Mater. Sci. Eng. A 2020, 784, 139325. [Google Scholar] [CrossRef]
- Liu, S.; Kent, D.; Zhan, H.; Doan, N.; Wang, C.; Yu, S.; Dargusch, M.; Wang, G. Influence of strain rate and crystallographic orientation on dynamic recrystallization of pure Zn during room-temperature compression. J. Mater. Sci. Technol. 2021, 86, 237–250. [Google Scholar] [CrossRef]
- Mostaed, E.; Ardakani, M.S.; Sikora-Jasinska, M.; Drelich, J.W. Precipitation induced room temperature superplasticity in Zn-Cu alloys. Mater. Letter. 2019, 244, 203–206. [Google Scholar] [CrossRef] [PubMed]
- Zhao, Y.; Toth, L.S.; Massion, R.; Skrotzki, W. Role of grain boundary sliding in texture evolution for nanoplasticity. Adv. Eng. Mater. 2017, 1700212. [Google Scholar] [CrossRef]
- Raja, A.; Jayagnthan, R.; Tiwari, A.; Rakesh, S. Effect of grains size on superplastic deformation of metallic materials. In Aluminium Alloys and Composites, 1st ed.; Cooke, K., Ed.; IntechOpen: Rijeka, Croatia, 2020. [Google Scholar] [CrossRef]


| Zn-1Cu Alloy | Zn-5Cu Alloy | |||||
|---|---|---|---|---|---|---|
| Reduction rate | 50% | 75% | 90% | 50% | 75% | 90% |
| Average grain size [µm] | 7.7 ± 6 | 3.6 ± 3 | 2.6 ± 2 | 3.1 ± 2 | 2.5 ± 1 | 1.6 ± 1 |
| Average misorientation angle [°] | 25 | 27 | 34 | 25 | 43 | 44 |
| Average GOS [°] | 9.9 ± 6 | 2.8 ± 3 | 4.8 ± 5 | 1.9 ± 2 | 1.8 ± 3 | 1.7 ± 2 |
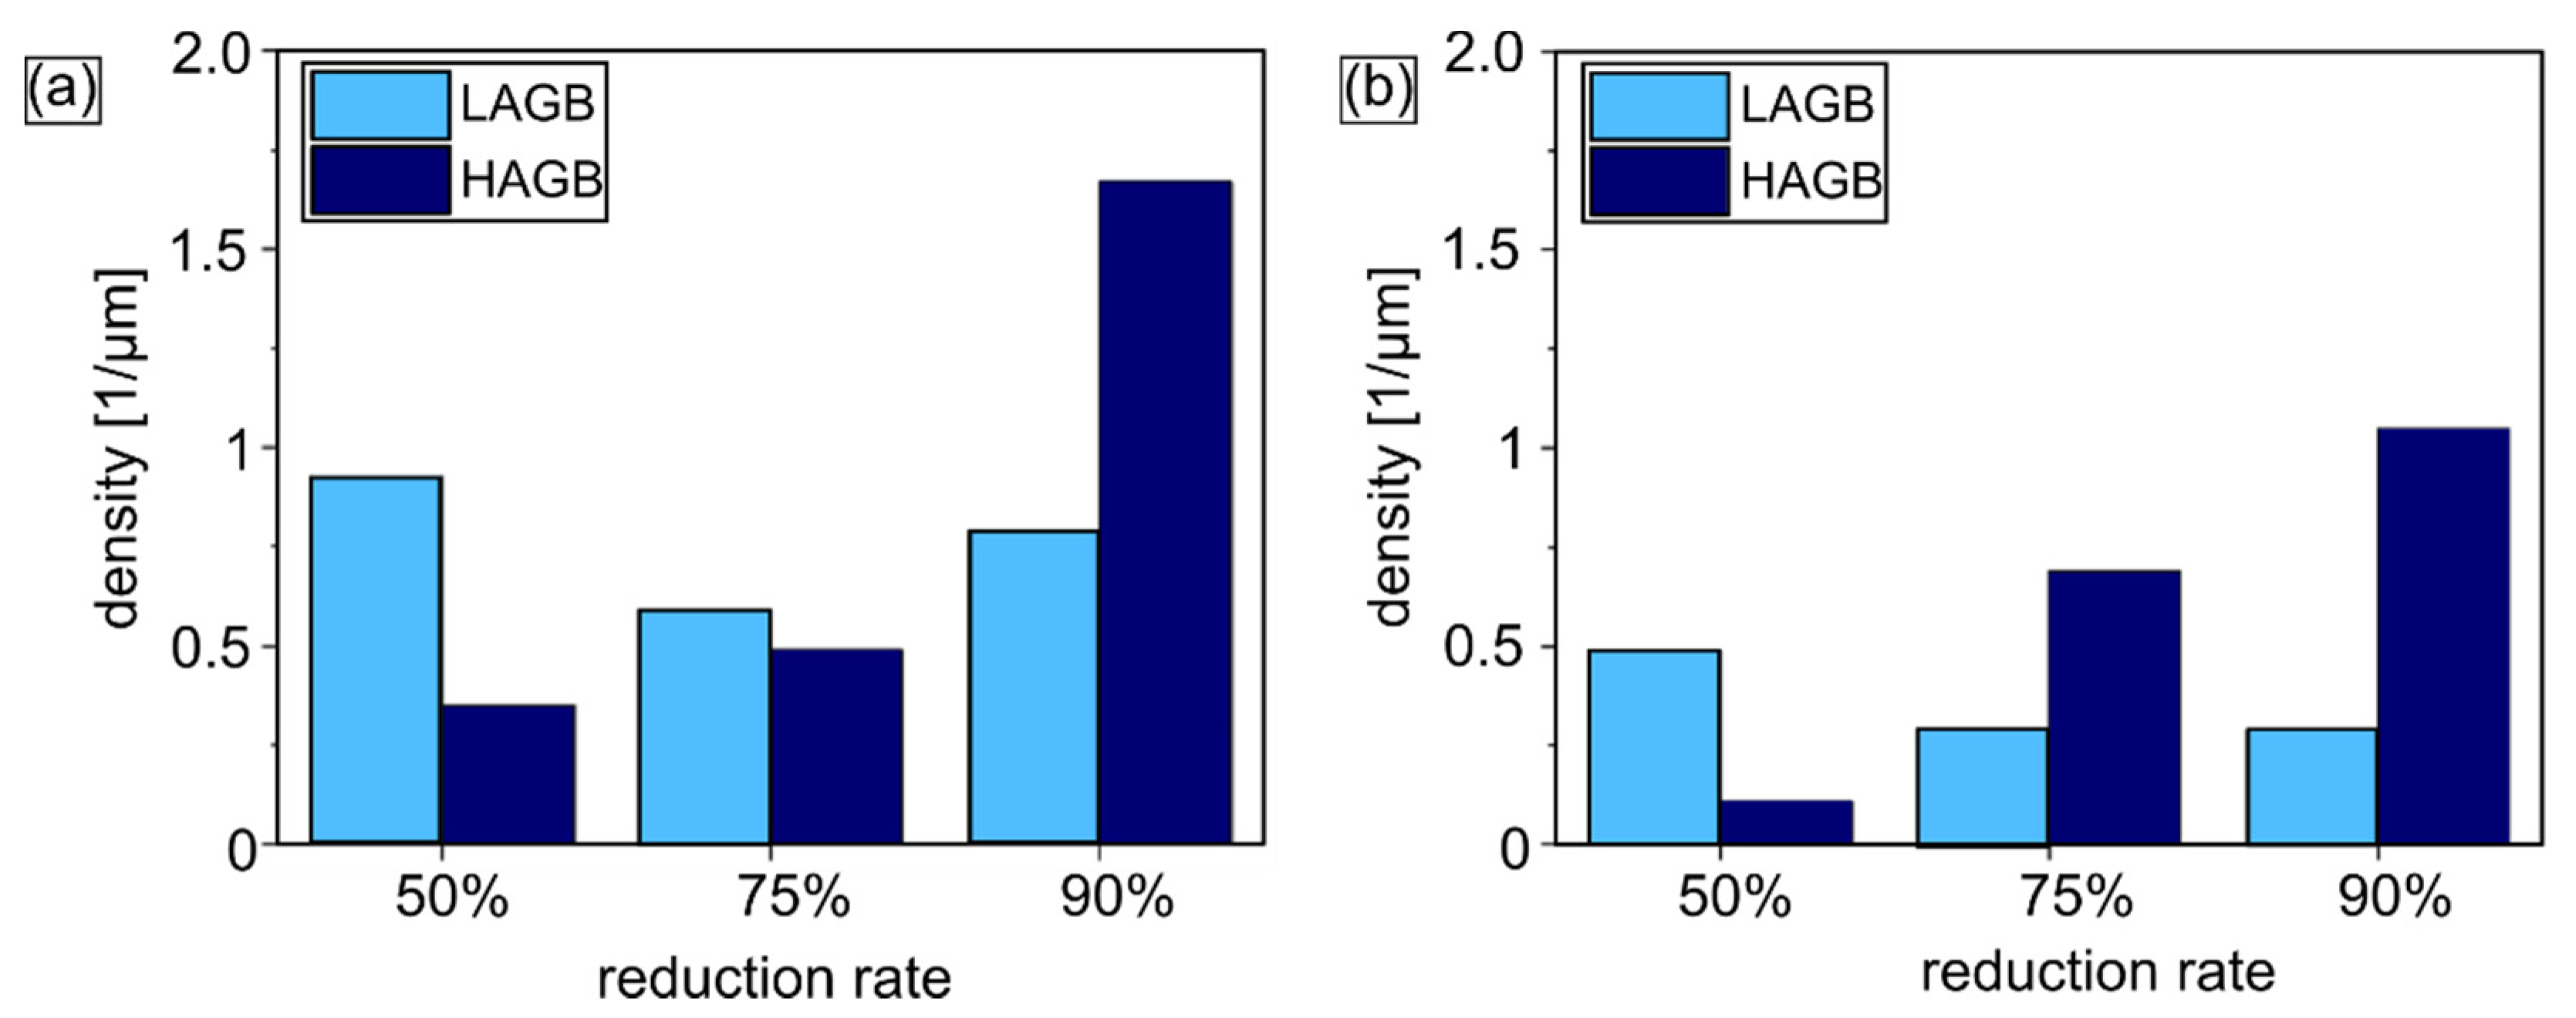
| HAGB density [1/µm] | 0.35 | 0.49 | 1.67 | 0.11 | 0.69 | 1.05 |
| LAGB density [1/µm] | 0.93 | 0.59 | 0.79 | 0.49 | 0.29 | 0.29 |
| Fraction of CuZn4 [%] | 6.1 | 26.6 | 10.5 | 60.5 | 50.7 | 56.1 |
Publisher’s Note: MDPI stays neutral with regard to jurisdictional claims in published maps and institutional affiliations. |
© 2021 by the authors. Licensee MDPI, Basel, Switzerland. This article is an open access article distributed under the terms and conditions of the Creative Commons Attribution (CC BY) license (https://creativecommons.org/licenses/by/4.0/).
Share and Cite
Jarzębska, A.; Maj, Ł.; Bieda, M.; Chulist, R.; Wojtas, D.; Wątroba, M.; Janus, K.; Rogal, Ł.; Sztwiertnia, K. Dynamic Recrystallization and Its Effect on Superior Plasticity of Cold-Rolled Bioabsorbable Zinc-Copper Alloys. Materials 2021, 14, 3483. https://doi.org/10.3390/ma14133483
Jarzębska A, Maj Ł, Bieda M, Chulist R, Wojtas D, Wątroba M, Janus K, Rogal Ł, Sztwiertnia K. Dynamic Recrystallization and Its Effect on Superior Plasticity of Cold-Rolled Bioabsorbable Zinc-Copper Alloys. Materials. 2021; 14(13):3483. https://doi.org/10.3390/ma14133483
Chicago/Turabian StyleJarzębska, Anna, Łukasz Maj, Magdalena Bieda, Robert Chulist, Daniel Wojtas, Maria Wątroba, Karol Janus, Łukasz Rogal, and Krzysztof Sztwiertnia. 2021. "Dynamic Recrystallization and Its Effect on Superior Plasticity of Cold-Rolled Bioabsorbable Zinc-Copper Alloys" Materials 14, no. 13: 3483. https://doi.org/10.3390/ma14133483