
Tensile and Impact Toughness Properties of a Zr-Based Bulk Metallic Glass Fabricated via Laser Powder-Bed Fusion


Abstract
:1. Introduction
2. Materials and Methods
3. Results
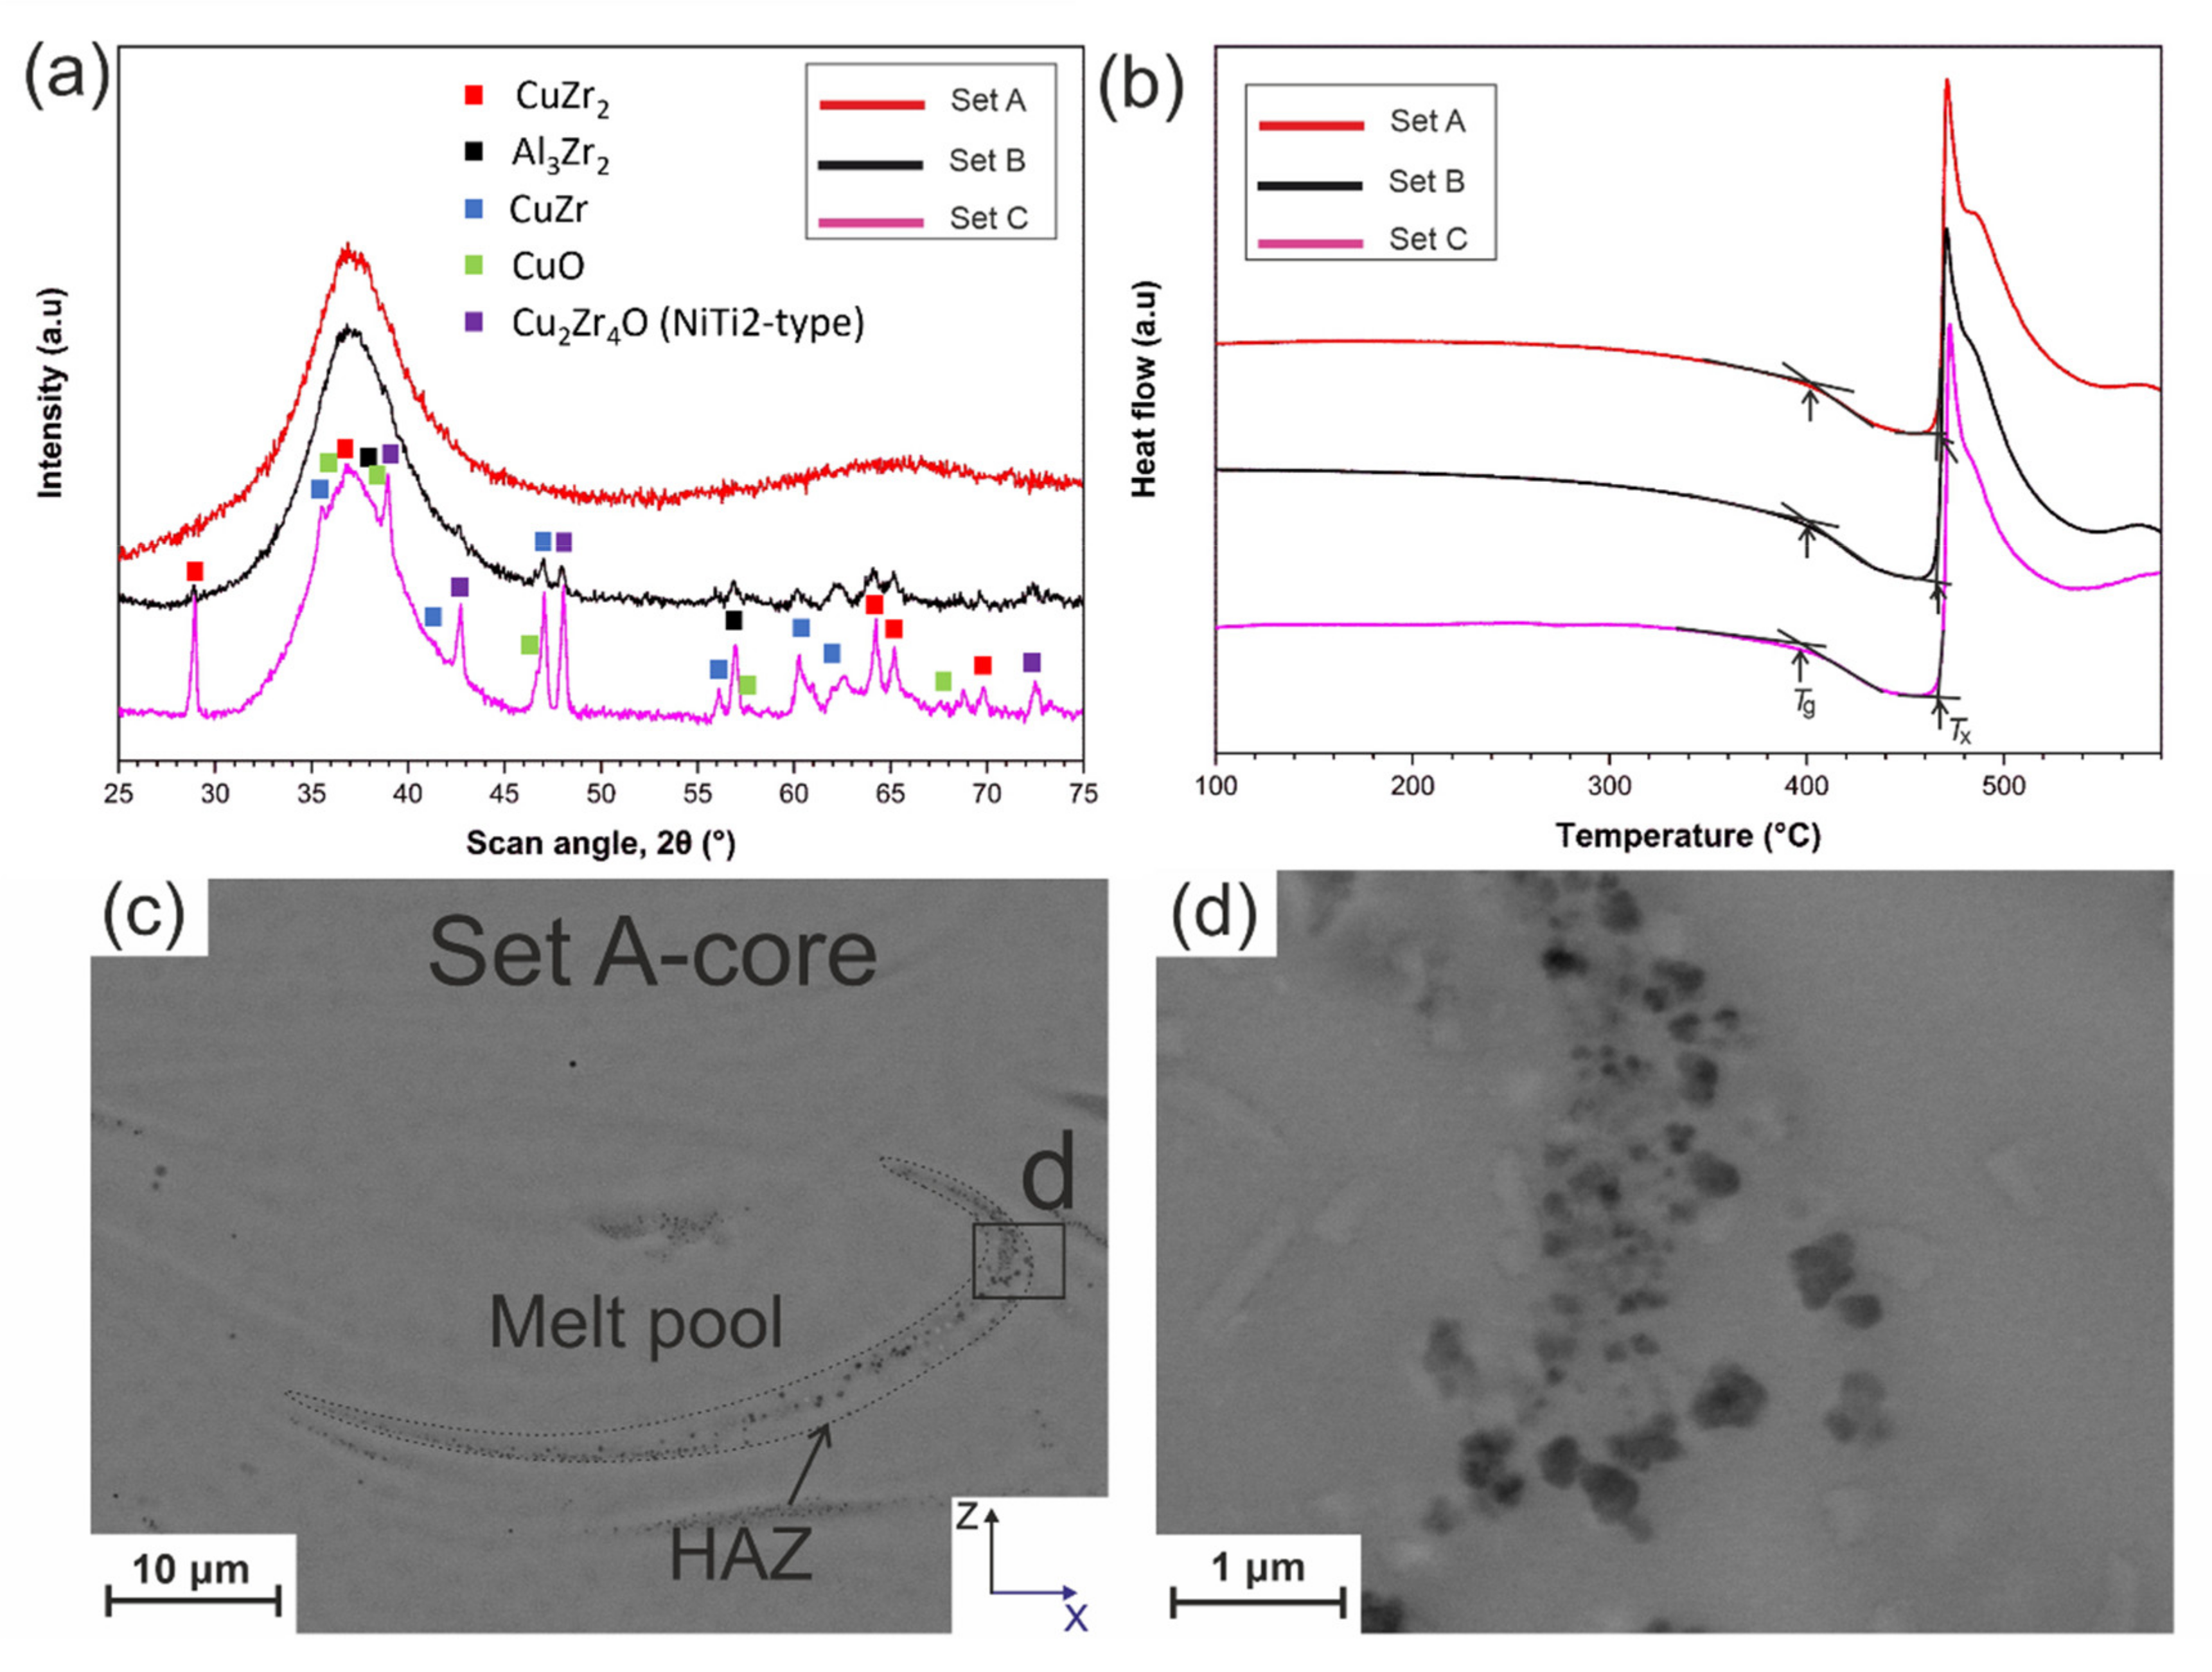
3.1. Microstructure
3.2. Impact Toughness
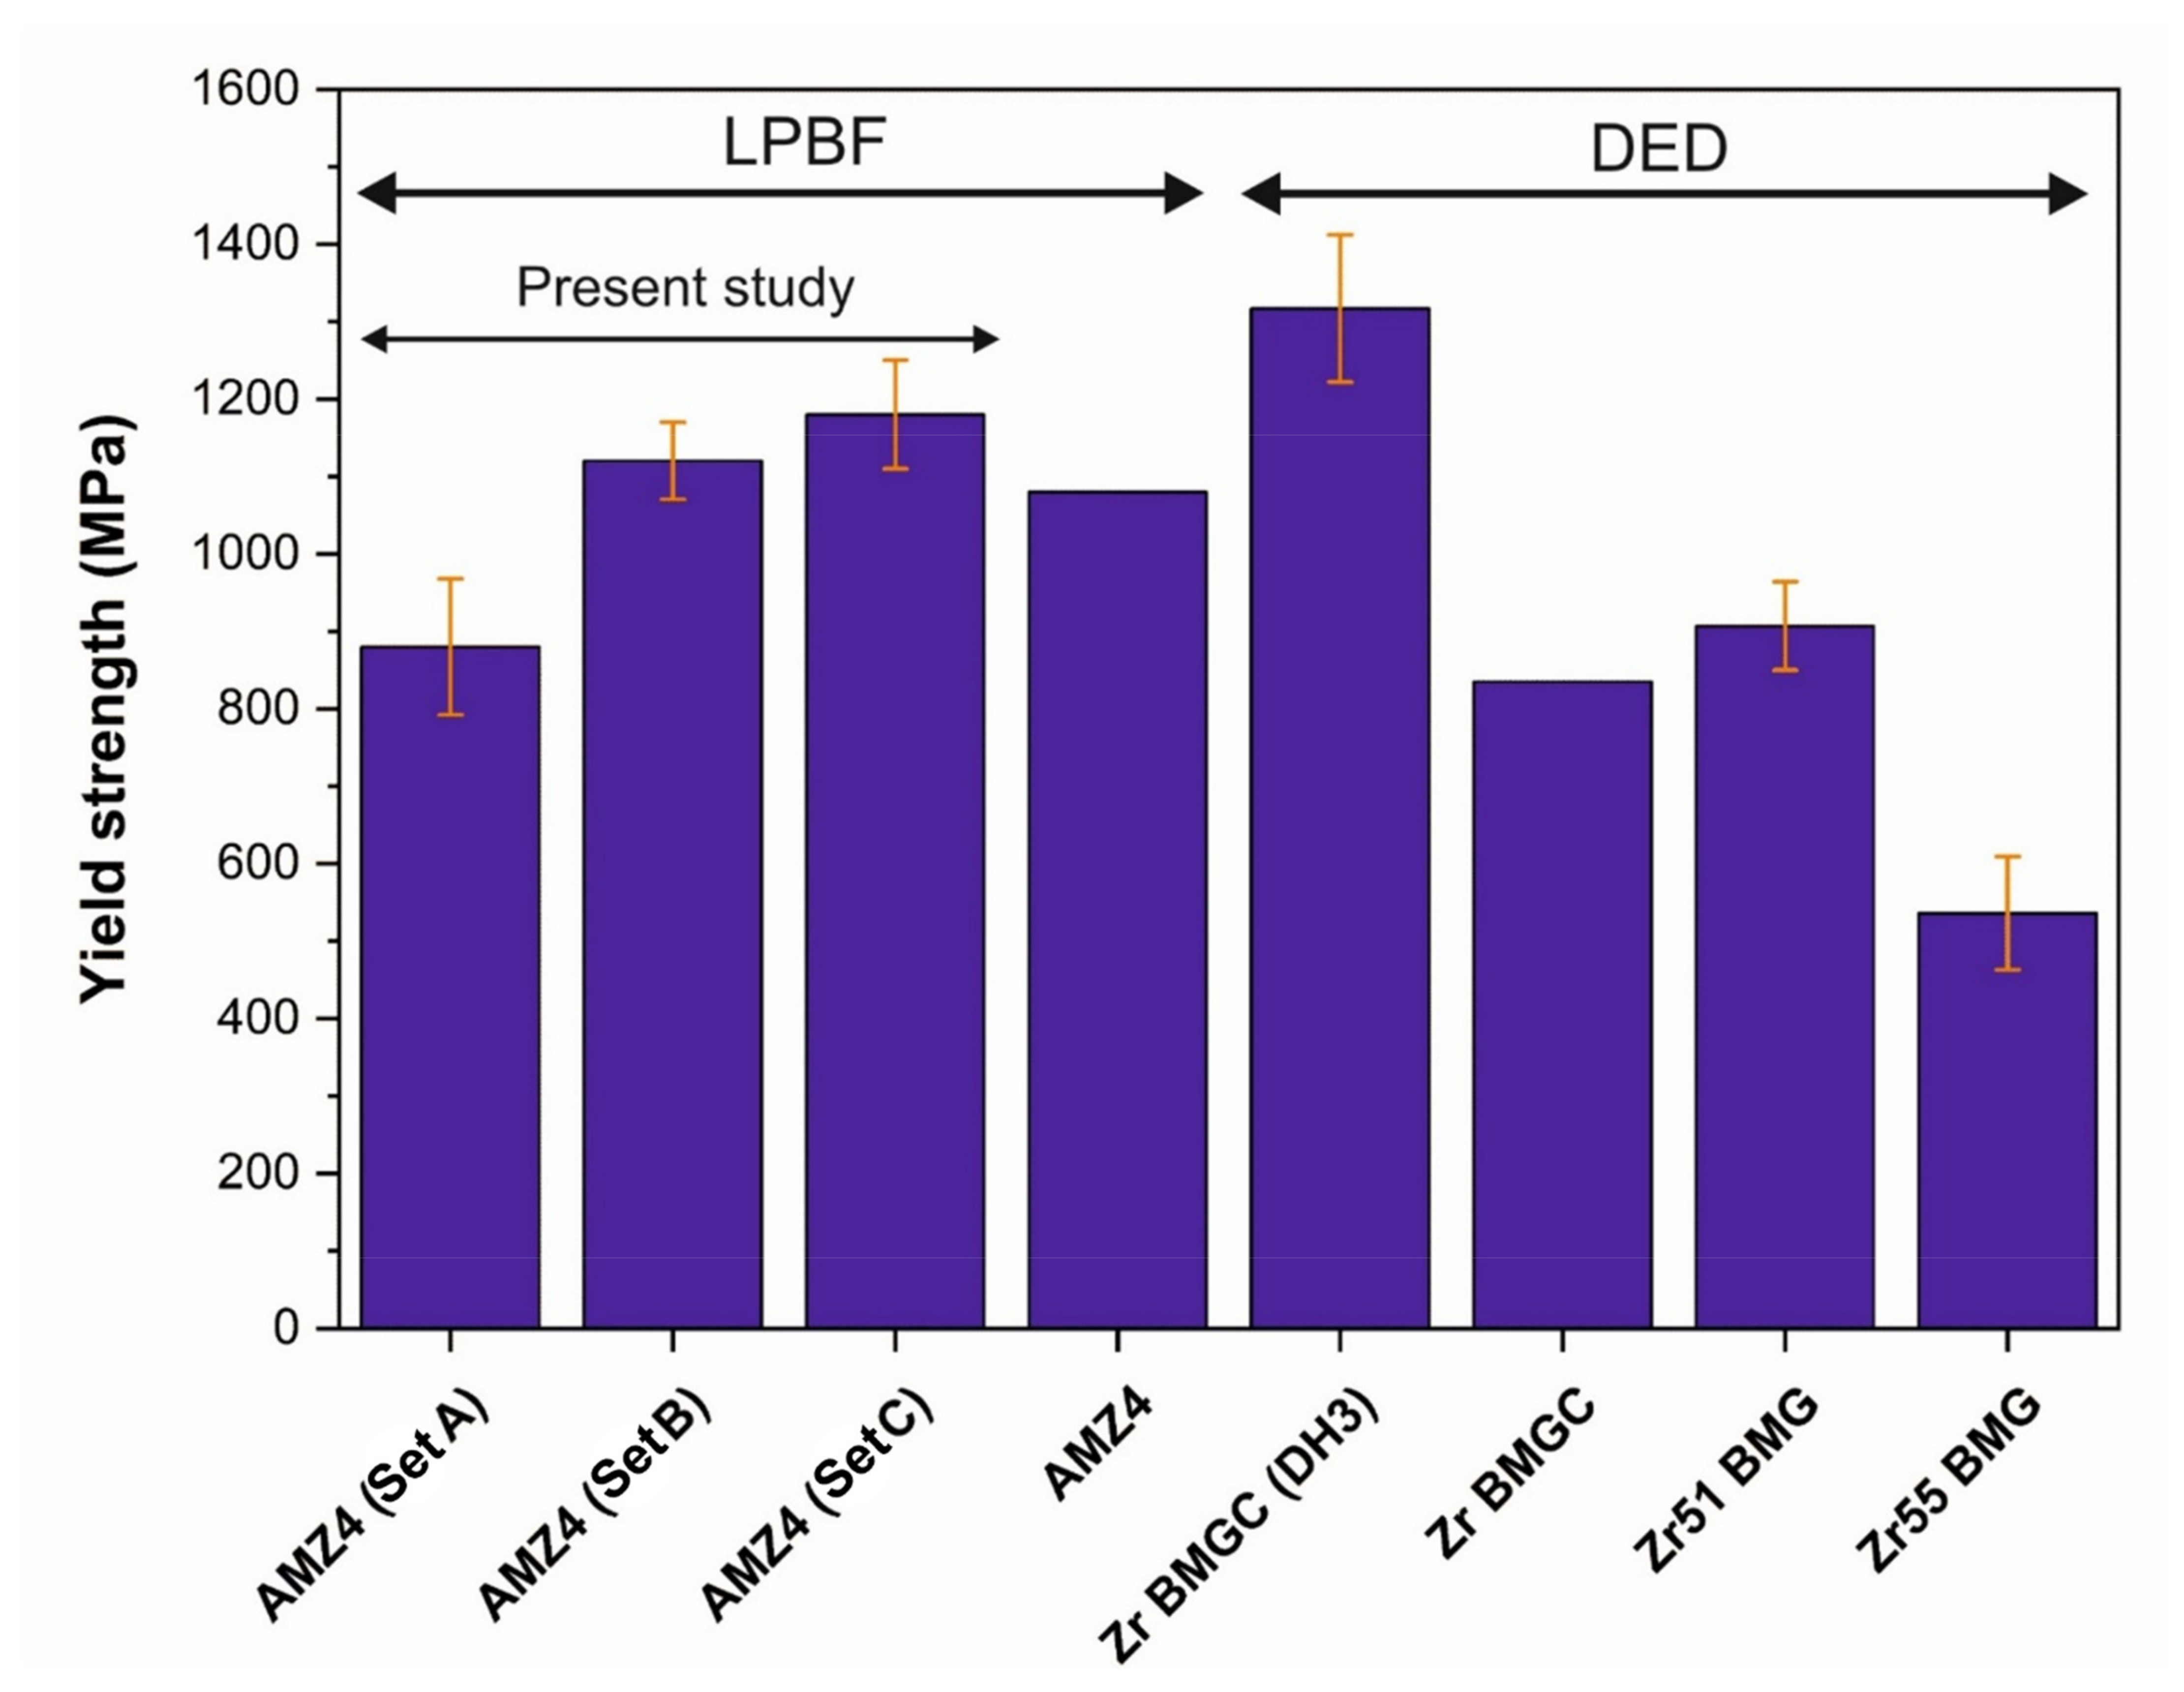
3.3. Tensile Properties
4. Discussion
5. Conclusions
- Using the first strategy (increasing the laser power in the border region) led to the mitigation of near-surface LoFs, and the results showed around 27% improvement in the tensile yield strength and impact toughness. Changing only the core laser power (second strategy) resulted in only 5% and 3% improvement in the tensile yield strength and impact toughness, respectively, compared to the first strategy, which are not considered to be significant.
- It was confirmed that, for additively manufactured BMGs, near-surface defects such as lack of fusions (LoFs) are more critical than those present in the core of the specimens.
- Although implementing the two mentioned strategies increased crystallization (up to 17%) because of the higher laser power, the importance of reducing porosity defects (especially LoFs) prevailed. The tensile yield strength of the Zr-based BMG was one of the best ones among those reported for BMGs fabricated via additive manufacturing (AM).
Supplementary Materials
Author Contributions
Funding
Institutional Review Board Statement
Informed Consent Statement
Data Availability Statement
Acknowledgments
Conflicts of Interest
References
- Schroers, J. Processing of Bulk Metallic Glass. Adv. Mater. 2010, 22, 1566–1597. [Google Scholar] [CrossRef] [PubMed]
- Zhang, Z.F.; Eckert, J.; Schultz, L. Difference in compressive and tensile fracture mechanisms of Zr59Cu20Al10Ni8Ti3 bulk metallic glass. Acta Mater. 2003, 51, 1167–1179. [Google Scholar] [CrossRef]
- Szuecs, F.; Kim, C.P.; Johnson, W.L. Mechanical properties of Zr56.2Ti13.8Nb5.0Cu6.9Ni5.6Be12.5 ductile phase reinforced bulk metallic glass composite. Acta Mater. 2001, 49, 1507–1513. [Google Scholar] [CrossRef]
- Ning, Z.; Liang, W.; Zhang, M.; Li, Z.; Sun, H.; Liu, A.; Sun, J. High tensile plasticity and strength of a CuZr-based bulk metallic glass composite. Mater. Des. 2016, 90, 145–150. [Google Scholar] [CrossRef] [Green Version]
- Nagendra, N.; Ramamurty, U.; Goh, T.T.; Li, Y. Effect of crystallinity on the impact toughness of a La-based bulk metallic glass. Acta Mater. 2000, 48, 2603–2615. [Google Scholar] [CrossRef] [Green Version]
- Ramamurty, U.; Lee, M.L.; Basu, J.; Li, Y. Embrittlement of a bulk metallic glass due to low-temperature annealing. Scr. Mater. 2002, 47, 107–111. [Google Scholar] [CrossRef] [Green Version]
- Murali, P.; Ramamurty, U. Embrittlement of a bulk metallic glass due to sub-Tg annealing. Acta Mater. 2005, 53, 1467–1478. [Google Scholar] [CrossRef]
- Raghavan, R.; Murali, P.; Ramamurty, U. Ductile to brittle transition in the Zr41.2Ti13.75Cu12.5Ni10Be22.5 bulk metallic glass. Intermetallics 2006, 14, 1051–1054. [Google Scholar] [CrossRef]
- Raghavan, R.; Murali, P.; Ramamurty, U. On factors influencing the ductile-to-brittle transition in a bulk metallic glass. Acta Mater. 2009, 57, 3332–3340. [Google Scholar] [CrossRef]
- Zachrisson, C.; Kozachkov, H.; Roberts, S.; Kaltenboeck, G.; Conner, R.D.; Demetriou, M.D.; Johnson, W.L.; Hofmann, D.C. Effect of processing on Charpy impact toughness of metallic glass matrix composites. Mater. Res. 2011, 26, 1260–1268. [Google Scholar] [CrossRef]
- Roberts, S.; Zachrisson, C.; Kozachkov, H.; Ullah, A.; Shapiro, A.A.; Johnson, L.; Hofmann, D.C. Cryogenic Charpy impact testing of metallic glass matrix composites. Scr. Mater. 2012, 66, 284–287. [Google Scholar] [CrossRef]
- Yokoyama, Y.; Fukaura, K.; Inoue, A. Cast structure and mechanical properties of Zr–Cu–Ni–Al bulk glassy alloys. Intermetallics 2002, 10, 1113–1124. [Google Scholar] [CrossRef]
- Keryvin, V.; Bernard, D.; Sangleboeuf, J.C.; Yokoyama, Y.; Rouxel, T. Toughness of Zr41.2Ti13.75Cu12.5Ni10Be22.5 bulk metallic glass for two oxygen levels. Non-Crytalline Solids 2006, 352, 2863–2868. [Google Scholar] [CrossRef]
- Best, J.P.; Ast, J.; Li, B.; Stolpe, M.; Busch, R.; Yang, F.; Li, X.; Michler, J.; Kruzic, J.J. Relating fracture toughness to micro-pillar compression response for a laser powder bed additive manufactured bulk metallic glass. Mater. Sci. Eng. A 2020, 770, 138535. [Google Scholar] [CrossRef]
- Bordeenithikasem, P.; Stolpe, M.; Elsen, A.; Hofmann, D.C. Glass forming ability, flexural strength, and wear properties of additively manufactured Zr-based bulk metallic glasses produced through laser powder bed fusion. Addit. Manuf. 2018, 21, 312–317. [Google Scholar] [CrossRef]
- DebRoy, T.; Wei, H.L.; Zuback, J.S.; Mukherjee, T.; Elmer, J.W.; Milewski, J.O.; Beese, A.M.; Wilson-Heid, A.; De, A.; Zhang, W. Additive manufacturing of metallic components—Process, structure and properties. Prog. Mater. Sci. 2018, 92, 112–224. [Google Scholar] [CrossRef]
- Sohrabi, N.; Jhabvala, J.; Logé, R.E. Additive Manufacturing of Bulk Metallic Glasses—Process, Challenges and Properties: A Review. Metals 2021, 11, 1279. [Google Scholar] [CrossRef]
- Vilaro, T.; Kottman-Rexerodt, V.; Thomas, M.; Colin, C.; Bertrand, P.; Thivillon, L.; Abed, S.; Ji, V.; Aubry, P.; Peyre, P.; et al. Direct Fabrication of a Ti-47Al-2Cr-2Nb Alloy by Selective Laser Melting and Direct Metal Deposition Processes. Adv. Mater. Res. 2010, 89, 586–591. [Google Scholar] [CrossRef]
- Löffler, J.F. Bulk metallic glasses. Intermetallics 2003, 11, 529–540. [Google Scholar] [CrossRef]
- Sohrabi, N.; Jhabvala, J.; Kurtuldu, G.; Frison, R.; Parrilli, A.; Stoica, M.; Neels, A.; Löffler, J.F.; Logé, R.E. Additive manufacturing of a precious bulk metallic glass. Appl. Mater. Today 2021, 24, 101080. [Google Scholar] [CrossRef]
- Prashanth, K.G.; Shakur Shahabi, H.; Attar, H.; Srivastava, V.C.; Ellendt, N.; Uhlenwinkel, V.; Eckert, J.; Scudino, S. Production of high strength Al85Nd8Ni5Co2 alloy by selective laser melting. Addit. Manuf. 2015, 6, 1–5. [Google Scholar] [CrossRef]
- Lu, X.; Nursulton, M.; Du, Y.; Liao, W. Structural and mechanical characteristics of Cu50Zr43Al7 bulk metallic glass fabricated by selective laser melting. Materials 2019, 12, 775. [Google Scholar] [CrossRef] [PubMed] [Green Version]
- Deng, L.; Wang, S.; Wang, P.; Kühn, U.; Pauly, S. Selective laser melting of a Ti-based bulk metallic glass. Mater. Lett. 2018, 212, 346–349. [Google Scholar] [CrossRef]
- Pauly, S.; Löber, L.; Petters, R.; Stoica, M.; Scudino, S.; Kühn, U.; Eckert, J. Processing Metallic Glasses by Selective Laser Melting. Mater. Today 2013, 16, 37–41. [Google Scholar] [CrossRef]
- Jung, H.Y.; Choi, S.J.; Prashanth, K.G.; Stoica, M.; Scudino, S.; Yi, S.; Kühn, U.; Kim, D.H.; Kim, K.B.; Eckert, J. Fabrication of Fe-based bulk metallic glass by selective laser melting: A parameter study. Mater. Des. 2015, 86, 703–708. [Google Scholar] [CrossRef]
- Ouyang, D.; Xing, W.; Li, N.; Li, Y.; Liu, L. Structural evolutions in 3D-printed Fe-based metallic glass fabricated by selective laser melting. Addit. Manuf. 2018, 23, 246–252. [Google Scholar] [CrossRef]
- Sohrabi, N.; Jhabvala, J.; Kurtuldu, G.; Stoica, M.; Parrilli, A.; Berns, S.; Polatidis, E.; Van Petegem, S.; Hugon, S.; Neels, A.; et al. Characterization, mechanical properties and dimensional accuracy of a Zr-based bulk metallic glass manufactured via laser powder-bed fusion. Mater. Des. 2021, 199, 109400. [Google Scholar] [CrossRef]
- Gao, X.; Liu, Z.; Li, J.; Liu, E.; Yue, C.; Zhao, K.; Yang, G. Selective laser melting of CuZr-based metallic glass composites. Mater. Lett. 2020, 259, 126724. [Google Scholar] [CrossRef]
- Li, X.P.; Roberts, M.P.; O’Keeffe, S.; Sercombe, T.B. Selective laser melting of Zr-based bulk metallic glasses: Processing, microstructure and mechanical properties. Mater. Des. 2016, 112, 217–226. [Google Scholar] [CrossRef]
- Zhang, C.; Li, X.M.; Liu, S.Q.; Liu, H.; Yu, L.J.; Liu, L. 3D printing of Zr-based bulk metallic glasses and components for potential biomedical applications. J. Alloys Compd. 2019, 790, 963–973. [Google Scholar] [CrossRef]
- Sohrabi, N.; Panikar, R.S.; Jhabvala, J.; Buch, A.R.; Mischler, S.; Logé, R.E. Laser coating of a Zr-based metallic glass on an aluminum substrate. Surf. Coatings Technol. 2020, 400. [Google Scholar] [CrossRef]
- Sohrabi, N.; Hamidi-Nasab, M.; Rouxel, B.; Jhabvala, J.; Parrilli, A.; Vedani, M.; Logé, R.E. Fatigue Performance of an Additively Manufactured Zr-Based Bulk Metallic Glass and the Effect of Post-Processing. Metals 2021, 11, 1064. [Google Scholar] [CrossRef]
- Best, J.P.; Ostergaard, H.E.; Li, B.; Stolpe, M.; Yang, F.; Nomoto, K.; Hasib, M.T.; Muránsky, O.; Busch, R.; Li, X.; et al. Fracture and fatigue behaviour of a laser additive manufactured Zr-based bulk metallic glass. Addit. Manuf. 2020, 36, 101416. [Google Scholar] [CrossRef]
- Su, S.; Lu, Y. Laser directed energy deposition of Zr-based bulk metallic glass composite with tensile strength. Mater. Lett. 2019, 247, 79–81. [Google Scholar] [CrossRef]
- Zhai, L.; Lu, Y.; Zhao, X.; Wang, L.; Lu, X. High-throughput screening of laser additive manufactured metallic glass via ultrasonic wave. Sci. Rep. 2019, 9, 17660. [Google Scholar] [CrossRef]
- Lin, X.; Zhang, Y.; Yang, G.; Gao, X.; Hu, Q.; Yu, J.; Wei, L.; Huang, W. Microstructure and compressive/tensile characteristic of large size Zr-based bulk metallic glass prepared by laser solid forming. J. Mater. Sci. Technol. 2019, 35, 328–335. [Google Scholar] [CrossRef]
- Lu, Y.; Su, S.; Zhang, S.; Huang, Y.; Qin, Z.; Lu, X.; Chen, W. Controllable additive manufacturing of gradient bulk metallic glass composite with high strength and tensile ductility. Acta Mater. 2021, 206, 116632. [Google Scholar] [CrossRef]
- Berg, M.T.L.; Bromiley, G.D.; Butler, I.B.; Frost, M.; Bradley, R.; Carr, J.; Le, Y.; Montési, L.G.J.; Zhu, W.; Miller, K.; et al. Deformation-aided segregation of Fe-S liquid from olivine under deep Earth conditions: Implications for core formation in the early solar system. Phys. Earth Planet. Inter. 2017, 263, 38–54. [Google Scholar] [CrossRef]
- Karimi, P.; Schnur, C.; Sadeghi, E.; Andersson, J. Contour design to improve topographical and microstructural characteristics of Alloy 718 manufactured by electron beam-powder bed fusion technique. Addit. Manuf. 2020, 32, 101014. [Google Scholar] [CrossRef]
- Cui, X.; Zu, F.Q.; Wang, Z.Z.; Huang, Z.Y.; Li, X.Y.; Wang, L.F. Study of the reversible intermetallic phase: B2-type CuZr. Intermetallics 2013, 36, 21–24. [Google Scholar] [CrossRef]
- Pacheco, V.; Karlsson, D.; Marattukalam, J.J.; Stolpe, M.; Hjörvarsson, B.; Jansson, U.; Sahlberg, M. Thermal stability and crystallization of a Zr-based metallic glass produced by suction casting and selective laser melting. J. Alloys Compd. 2020, 825, 153995. [Google Scholar] [CrossRef]
- Baricco, M.; Spriano, S.; Chang, I.; Petrzhik, M.I.; Battezzati, L. “Big cube” phase formation in Zr-based metallic glasses. Mater. Sci. Eng. A 2001, 304–306, 305–310. [Google Scholar] [CrossRef]
- Marattukalam, J.J.; Pacheco, V.; Karlsson, D.; Riekehr, L.; Lindwall, J.; Forsberg, F.; Jansson, U.; Sahlberg, M.; Hjörvarsson, B. Development of process parameters for selective laser melting of a Zr-based bulk metallic glass. Addit. Manuf. 2020, 33, 101124. [Google Scholar] [CrossRef]
- Dalla Torre, F.H.; Dubach, A.; Schällibaum, J.; Löffler, J.F. Shear striations and deformation kinetics in highly deformed Zr-based bulk metallic glasses. Acta Mater. 2008, 56, 4635–4646. [Google Scholar] [CrossRef]
- Lawn, B. Fracture of Brittle Solids, 2nd ed.; Cambridge University Press: Cambridge, UK, 1993; ISBN 9780521409728. [Google Scholar]
- Bruck, H.A.; Rosakis, A.J.; Johnson, W.L. The dynamic compressive behavior of beryllium bearing bulk metallic glasses. J. Mater. Res. 1996, 11, 503–511. [Google Scholar] [CrossRef] [Green Version]
- Sohrabi, N.; Schawe, J.E.K.; Jhabvala, J.; Löffler, J.F.; Logé, R.E. Critical crystallization properties of an industrial-grade Zr-based metallic glass used in additive manufacturing. Scr. Mater. 2021, 199, 113861. [Google Scholar] [CrossRef]
- Deng, L.; Zhang, L.; Kosiba, K.; Limbach, R.; Wondraczek, L.; Wang, G.; Gu, D.; Kühn, U.; Pauly, S. CuZr-based bulk metallic glass and glass matrix composites fabricated by selective laser melting. J. Mater. Sci. Technol. 2021, 81, 139–150. [Google Scholar] [CrossRef]
- Du Plessis, A.; Yadroitsava, I.; Yadroitsev, I. Effects of defects on mechanical properties in metal additive manufacturing: A review focusing on X-ray tomography insights. Mater. Des. 2020, 187, 108385. [Google Scholar] [CrossRef]
- Andreau, O.; Pessard, E.; Koutiri, I.; Penot, J.-D.; Dupuy, C.; Saintier, N.; Peyre, P. A competition between the contour and hatching zones on the high cycle fatigue behaviour of a 316L stainless steel: Analyzed using X-ray computed tomography. Mater. Sci. Eng. A 2019, 757, 146–159. [Google Scholar] [CrossRef] [Green Version]
- Yokoyama, Y.; Kobayashi, A.; Fukaura, K.; Inoue, A. Oxygen Embrittlement and Effect of the Addition of Ni Element in a Bulk Amorphous Zr-Cu-Al Alloy. Mater. Trans. 2002, 43, 571–574. [Google Scholar] [CrossRef]
- Murali, P.; Narasimhan, R.; Guo, T.F.; Zhang, Y.W.; Gao, H.J. Shear bands mediate cavitation in brittle metallic glasses. Scr. Mater. 2013, 68, 567–570. [Google Scholar] [CrossRef]
- Murali, P.; Guo, T.F.; Zhang, Y.W.; Narasimhan, R.; Li, Y.; Gao, H.J. Atomic Scale Fluctuations Govern Brittle Fracture and Cavitation Behavior in Metallic Glasses. Phys. Rev. Lett. 2011, 107, 215501. [Google Scholar] [CrossRef] [PubMed]
- Jia, H.; Wang, G.; Chen, S.; Gao, Y.; Li, W.; Liaw, P.K. Fatigue and fracture behavior of bulk metallic glasses and their composites. Prog. Mater. Sci. 2018, 98, 168–248. [Google Scholar] [CrossRef]


| Set | Core Power (W) | Scanning Speed (mm/s) | Hatching Distance (μm) | Layer Thickness (μm) | Border Power (W) |
|---|---|---|---|---|---|
| A | 30 | 600 | 90 | 20 | 30 |
| B | 30 | 600 | 90 | 20 | 42 |
| C | 36 | 600 | 90 | 20 | 42 |
| Sample | Tg (°C) | Tx (°C) | ΔH (J/g) | Amorphous Fraction |
|---|---|---|---|---|
| Set A | 393.7 | 467.6 | 81.34 | 0.94 |
| Set B | 394.8 | 466.7 | 79.39 | 0.91 |
| Set C | 394.7 | 468.5 | 72.69 | 0.83 |
| Sample | Density (%) * | Number of LoFs | Volume Fraction of LoFs (%) |
|---|---|---|---|
| Impact- Set A | 99.80 | 73 | 0.051 |
| Impact- Set B | 99.85 | 48 | 0.023 |
| Impact- Set C | 99.86 | 46 | 0.007 |
| Tensile- Set A | 99.77 | 129 | 0.068 |
| Tensile- Set B | 99.87 | 38 | 0.014 |
| Tensile- Set C | 99.87 | 34 | 0.009 |
Publisher’s Note: MDPI stays neutral with regard to jurisdictional claims in published maps and institutional affiliations. |
© 2021 by the authors. Licensee MDPI, Basel, Switzerland. This article is an open access article distributed under the terms and conditions of the Creative Commons Attribution (CC BY) license (https://creativecommons.org/licenses/by/4.0/).
Share and Cite
Sohrabi, N.; Parrilli, A.; Jhabvala, J.; Neels, A.; Logé, R.E. Tensile and Impact Toughness Properties of a Zr-Based Bulk Metallic Glass Fabricated via Laser Powder-Bed Fusion. Materials 2021, 14, 5627. https://doi.org/10.3390/ma14195627
Sohrabi N, Parrilli A, Jhabvala J, Neels A, Logé RE. Tensile and Impact Toughness Properties of a Zr-Based Bulk Metallic Glass Fabricated via Laser Powder-Bed Fusion. Materials. 2021; 14(19):5627. https://doi.org/10.3390/ma14195627
Chicago/Turabian StyleSohrabi, Navid, Annapaola Parrilli, Jamasp Jhabvala, Antonia Neels, and Roland E. Logé. 2021. "Tensile and Impact Toughness Properties of a Zr-Based Bulk Metallic Glass Fabricated via Laser Powder-Bed Fusion" Materials 14, no. 19: 5627. https://doi.org/10.3390/ma14195627