3.1. AIMD Simulations
AIMD simulations have been widely used to study the atomic structure of metallic glasses [
28,
29]. The TSRO and CSRO of the Fe
80+xSi
5−xB
15 (
x = 0–4) metallic glasses were investigated by AIMD simulations and the correlations between their GFA and magnetic properties were explored.
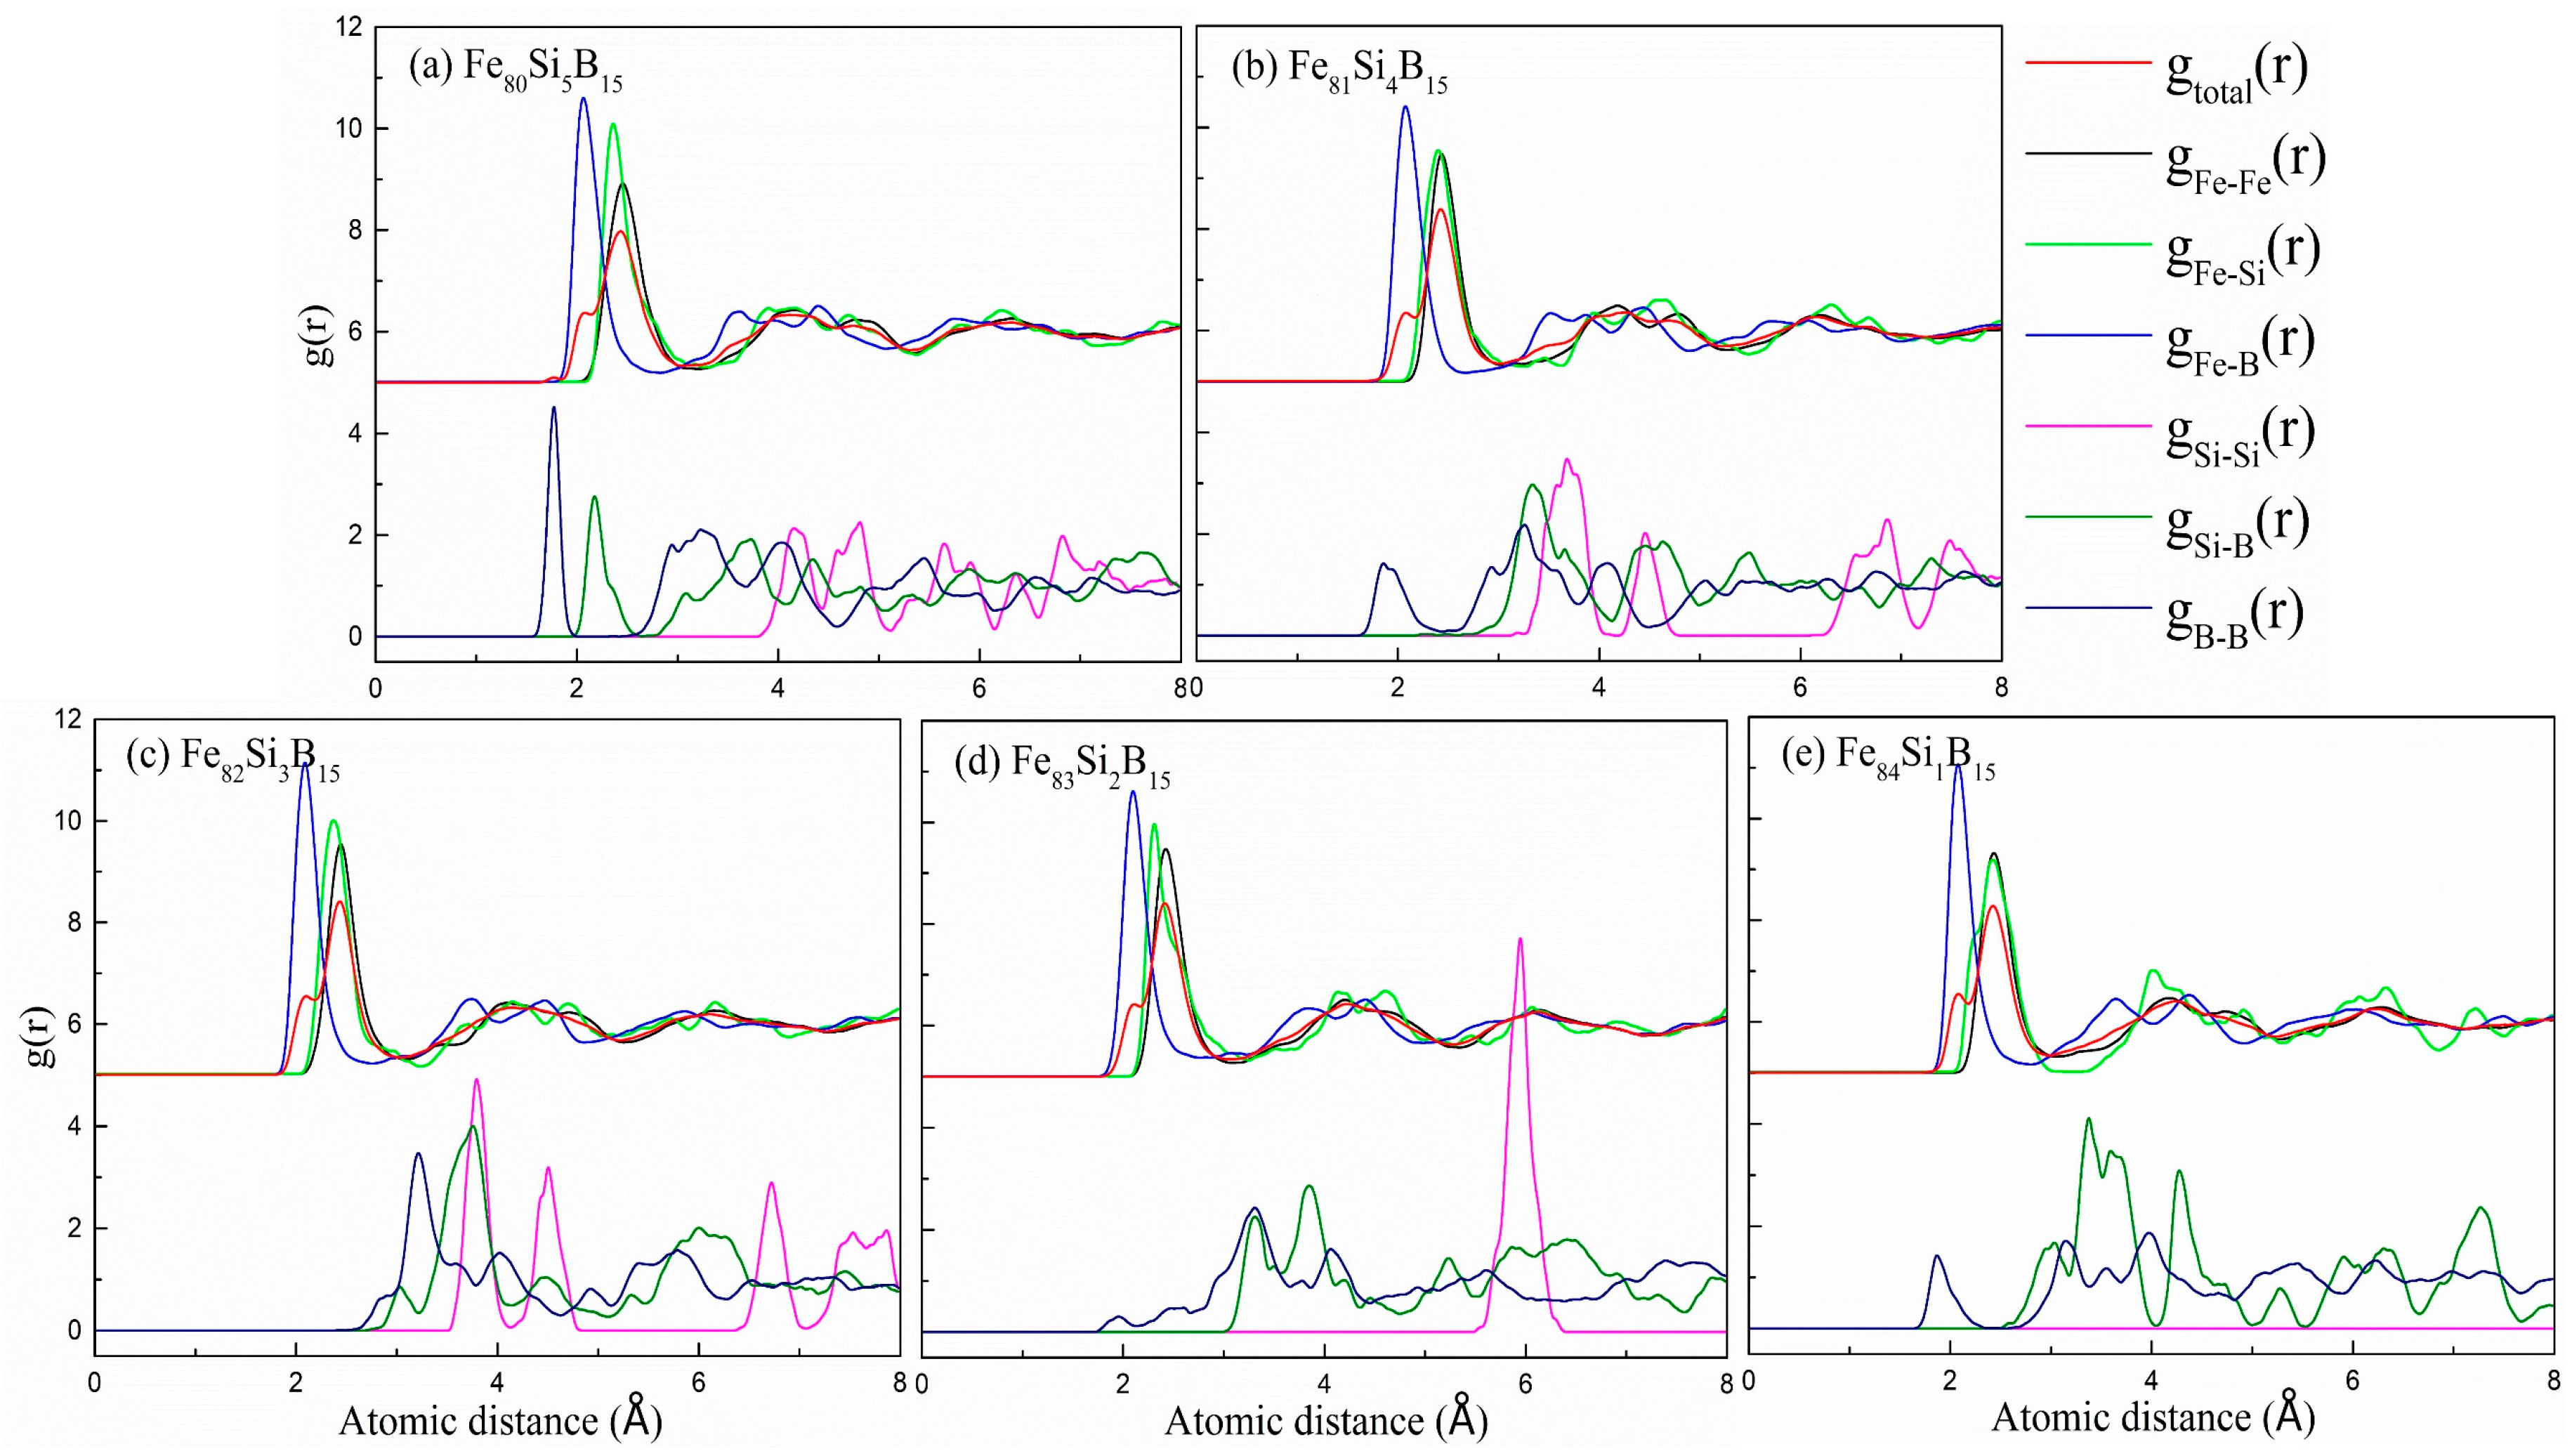
The total and partial pair distribution functions (PDFs) of the Fe
80+xSi
5−xB
15 (
x = 0–4) amorphous alloys at 300 K are plotted in
Figure 1, in which all characteristic broad peaks can be observed, demonstrating the appearance of an amorphous structure. The positions of the first peaks of
gtotal(r) for the different compositions showed mere changes at 2.4 Å. The first peaks of
gFe-M(r) were intense, indicating the strong interactions between the Fe and metalloid (M = Si, B) atoms. Noticeably, there existed a shoulder peak at around 2.1 Å in the first peak of
gtotal(r) for all the compositions. Interestingly, the first peak of
gFe-B(r) was also located at the same position, indicating that the shoulder peak resulted from a relatively large amount of Fe-B neighboring pairs with a considerably shorter distance than the Fe-Fe and Fe-Si pairs. These observations were consistent with the results in the literature for Fe
78Si
9B
13 [
30], Fe
82Si
4B
10P
4 [
24], and Fe
85Si
2B
9P
4 [
31]. For all the compositions, the first peak of
gFe-B(r) for the Fe
82Si
3B
15 amorphous alloy was the highest, indicating that the Fe–B interaction was the strongest in Fe
82Si
3B
15 due to the strong chemical bond. The
gSi-Si(r),
gSi-B(r), and
gB-B(r) curves possessed negligible first peaks, suggesting the presence of solute–solute avoidance [
16,
32,
33]. The full solute–solute avoidance stabilized the alloy system in both the melted and amorphous states by forming relatively stable atomic clusters, which decreased the constituent segregation and increased the GFA [
18]. As shown in
Figure 1, there were almost no first peaks in the
gSi-Si(r),
gSi-B(r), and
gB-B(r) curves for the Fe
82Si
3B
15 alloy, indicating its better solute–solute avoidance compared with the other compositions; this indicated that it had a good thermal stability and GFA.
The partial Fe-Fe PDFs for the five compositions at 300 K are shown in
Figure 2 and the positions of the first peaks for
gFe-Fe(r) and
rFe-Fe are listed in
Table 1. Fe
82Si
3B
15 and Fe
80Si
5B
15 had an equivalent
rFe-Fe, the largest in all compositions, indicating that the Fe-Fe bond for these two compositions was the longest. The longer Fe-Fe bond favored the larger size of the Fe-centered cluster, in which more Fe and metalloid atoms could be contained. Considering that clusters with a larger size are unfavorable for the diffusion of atoms, we predicted that the GFA of Fe
82Si
3B
15 should be high. In addition, the long bond between Fe atoms is beneficial to the magnetic properties [
20,
34]; therefore, we speculated that the Fe
80Si
5B
15 and Fe
82Si
3B
15 alloys might also have higher magnetic properties than the other three compositions.
To further study the topological short-range order of the structure, a Voronoi polyhedron (VP) analysis was carried out [
35,
36]. The position of the first minimum (at ~3.1 Å) after the first peak in the g
total(r) curve was taken as the cut-off range for the atomic neighboring. The VP index was defined as (
n3,
n4,
n5, and
n6), in which
ni denoted the number of
i-sided faces of the VP.
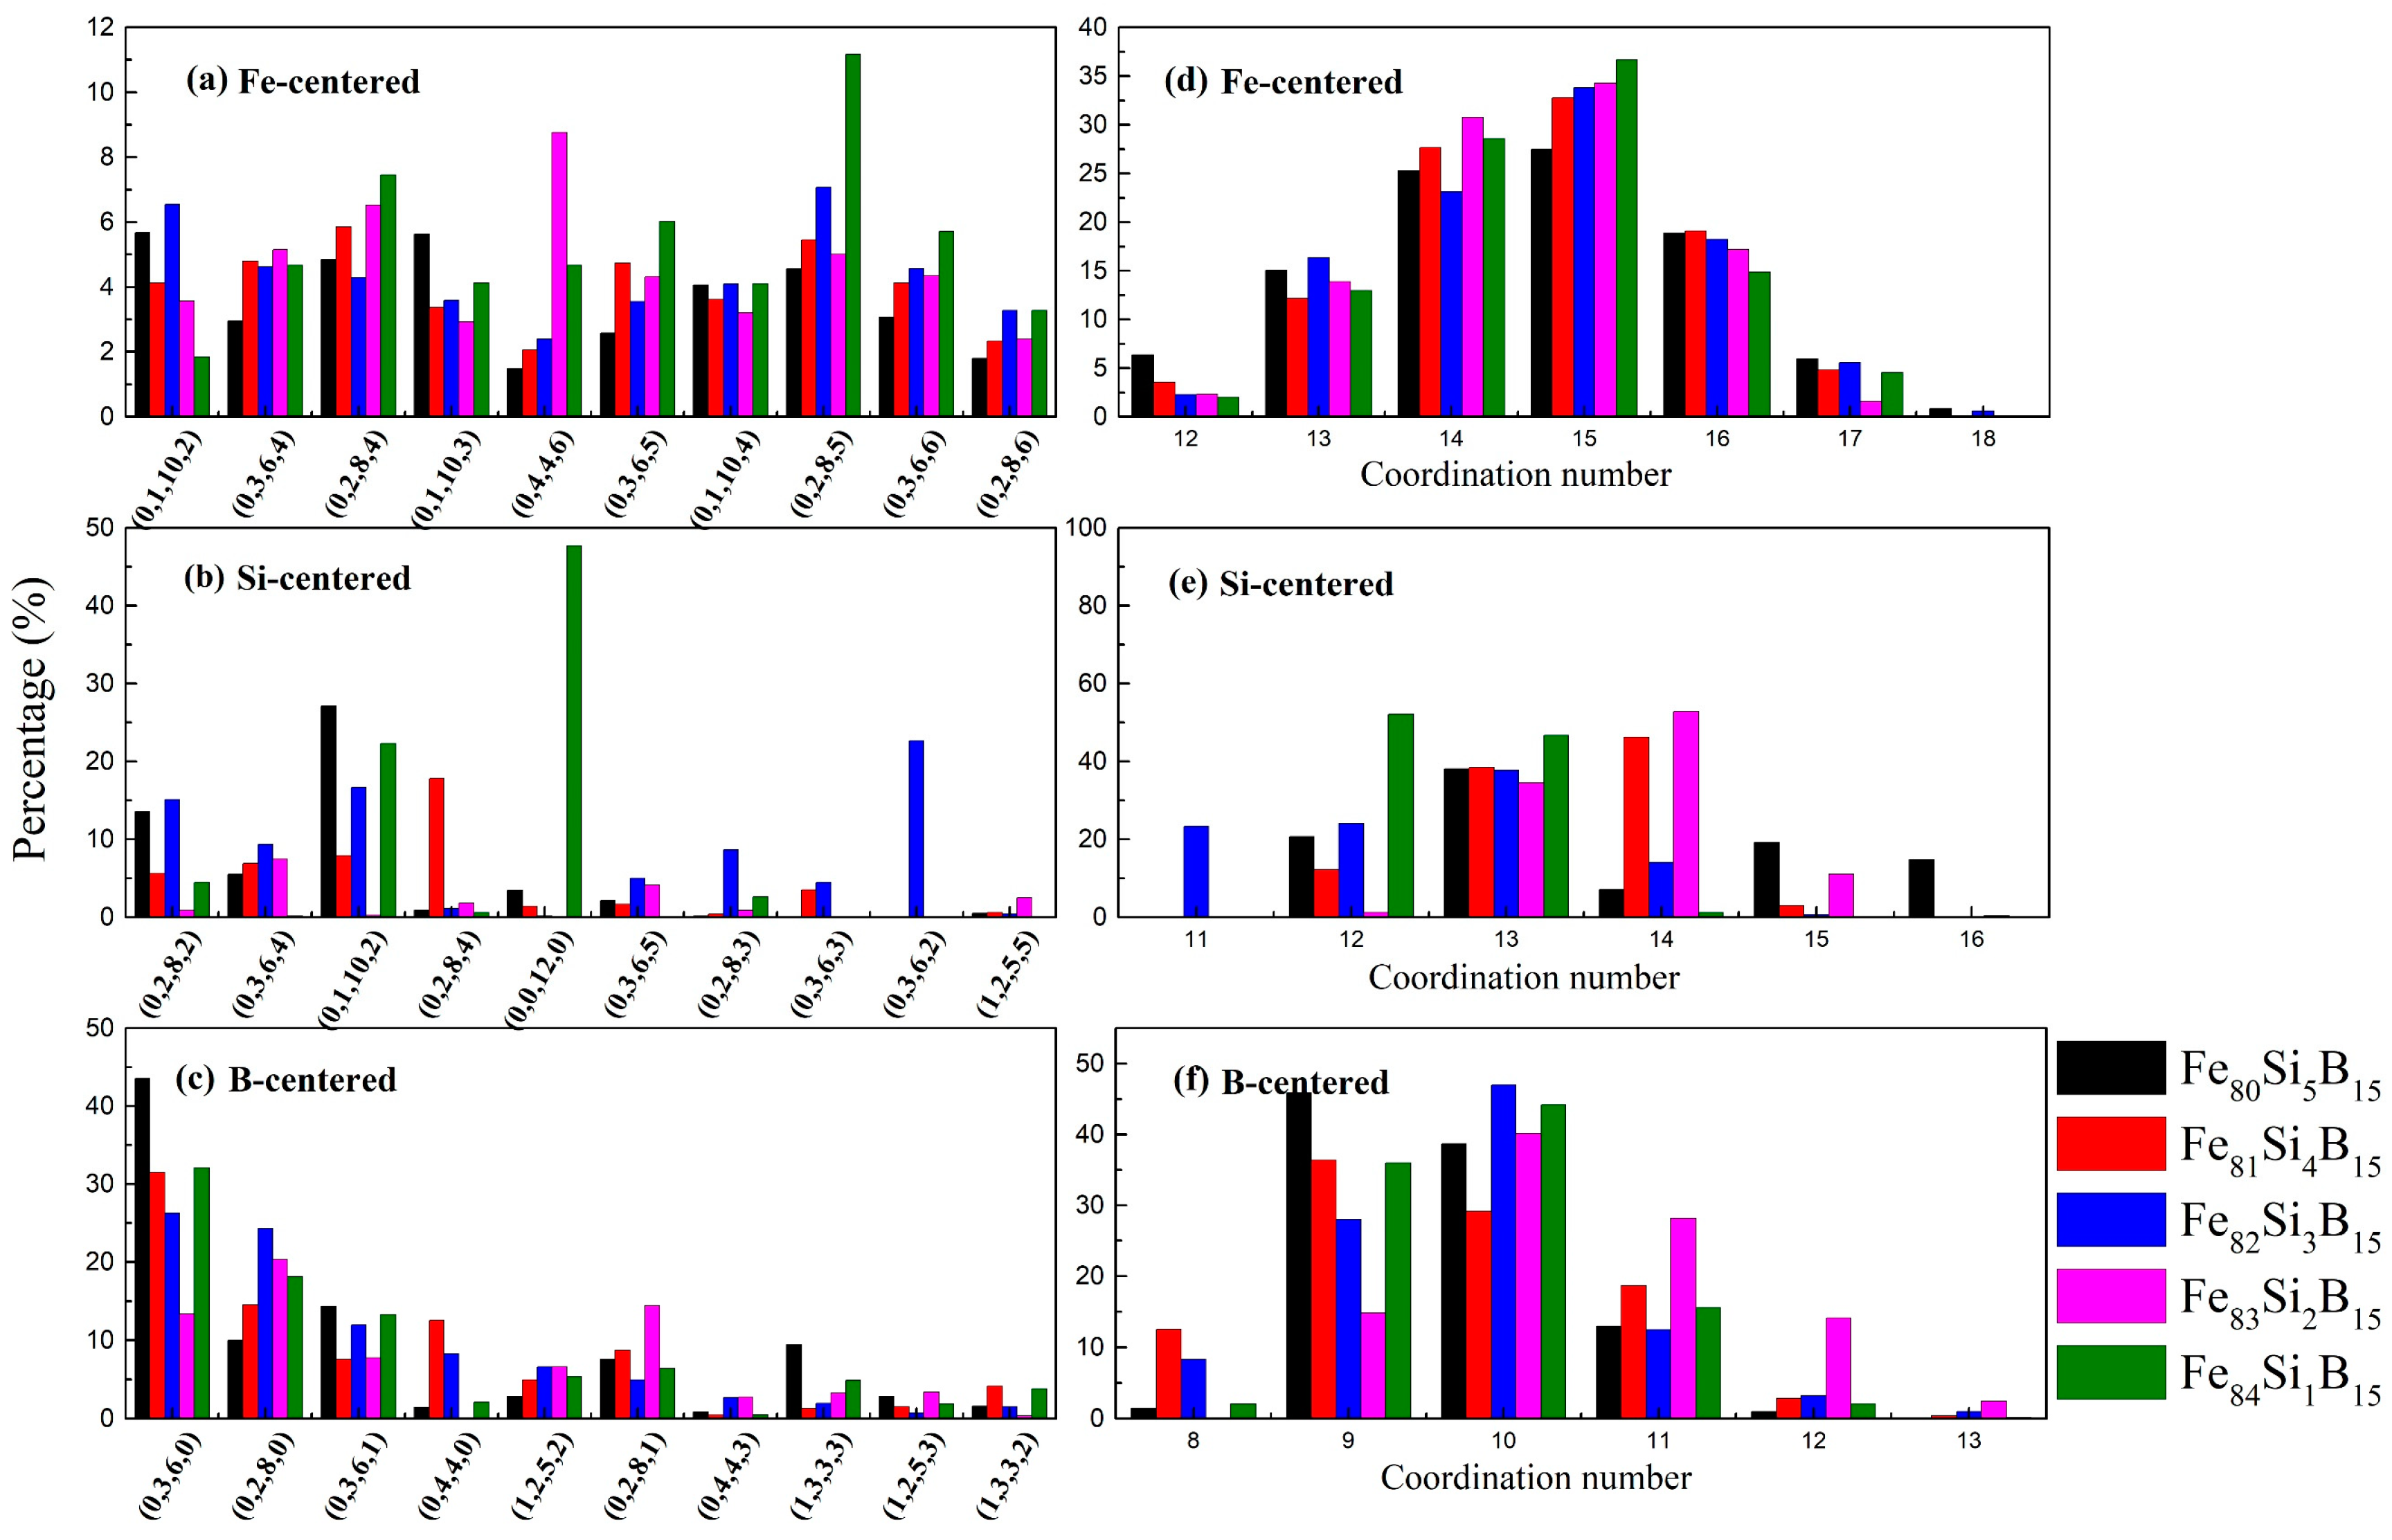
The major types of VP indices with Fe- and M-centered clusters and the corresponding distribution of coordination numbers (CNs) of the Fe
80+xSi
5−xB
15 (
x = 0–4) alloys are shown in
Figure 3. As shown in
Figure 3a, the (0, 1, 10, 2), (0, 2, 8, 4), and (0, 3, 6, 4) polyhedrons had the maximum proportion. Derived polyhedrons such as (0,1,10, 3) and (0, 1, 10, 4), which occupied similar rates, were also found around the Fe atoms. The Si-centered (0, 1, 10, 2) and (0, 3, 6, 4) clusters accounted for a large proportion, similar to the cluster types of the Fe-centered ones, as shown in
Figure 3b. In the amorphous Fe
84Si
1B
15 alloy, amongst the Si-centered VP, the (0, 0, 12, 0) type had the maximum ratio of 47.6%, probably due to the single Si atom, resulting in the non-uniformity of its structure in the Fe
84Si
1B
15 alloy. In
Figure 3c, amongst the B-centered VP, the (0, 3, 6, 0), (0, 2, 8, 0), and (0, 3, 6, 1) polyhedrons played a major role. Most of these conformed with the behavior of Fe
78Si
9B
13 [
32] and Fe
82Si
4B
10P
4 [
24] metallic glasses.
The CN was calculated based on the basic theory of a VP partition. The number of facets on the VP surface (practically
n3 +
n4 +
n5 +
n6) was equal to the number of the neighboring atoms—i.e., the CN—because each facet represented the boundary of a neighboring atom. The distributions of CNs in the Fe-, Si-, and B-centered clusters of the Fe
80+xSi
5−xB
15 (
x = 0–4) amorphous alloys are illustrated in
Figure 3. The Fe-centered clusters showed dominant CNs of 14 and 15, mainly attributed to the (0, 2, 8, 4), (0, 2, 8, 5), (0, 3, 6, 5), and (0, 3, 6, 6) polyhedrons. As can be seen in
Figure 3e, the Si-centered cluster had a major CN of 13, which was mainly due to the (0, 1, 10, 2) polyhedron. The CN of the B-centered ones was 10 because of the (0, 2, 8, 0) polyhedron. According to the spatial connectivities between the clusters, the large clusters such as (0, 2, 8, 4) and (0, 1, 10, 2) had a strong tendency to connect to the small clusters (e.g., (0, 2, 8, 0), (0, 3, 6, 0), and (0, 4, 4, 0)), leading to dense cluster packing [
37]. It could be concluded that there was a strong connection tendency between the larger clusters (Fe-centered) and the smaller ones (Si- and B-centered).
To further analyze the influence of the local structure on the GFA and atomic magnetic moment, the total and partial CNs for the Fe
80+xSi
5−xB
15 (
x = 0–4) alloys were counted; the results are presented in
Table 2,
Table 3 and
Table 4. Evidently, in the five compositions, the partial CNs of Si-Si, Si-B, B-Si, and B-B were the least in the Fe
82Si
3B
15 alloy. This indicated that Fe
82Si
3B
15 had the strongest solute–solute avoidance and thus had the best GFA, which was consistent with the findings from the PDFs. In addition, according to Heisenberg [
38,
39], the atomic magnetic moment depends on the number of Fe atoms in the nearest neighbor (NN) shell; that is, more nearest neighbor Fe atoms correspond with higher atomic magnetic moments. As shown in
Table 2, the partial CN of the Fe-Fe pair in Fe
84Si
1B
15 and Fe
82Si
3B
15 were large (12.8 and 12.5) and that of Fe
80Si
5B
15 was the smallest (12.1). From this point of view, the Fe
84Si
1B
15 and Fe
82Si
3B
15 alloys should have had higher atomic magnetic moments than the other compositions. Considering the above-mentioned length of the Fe-Fe bond, the Fe
82Si
3B
15 alloy was speculated to have the highest
Bs.
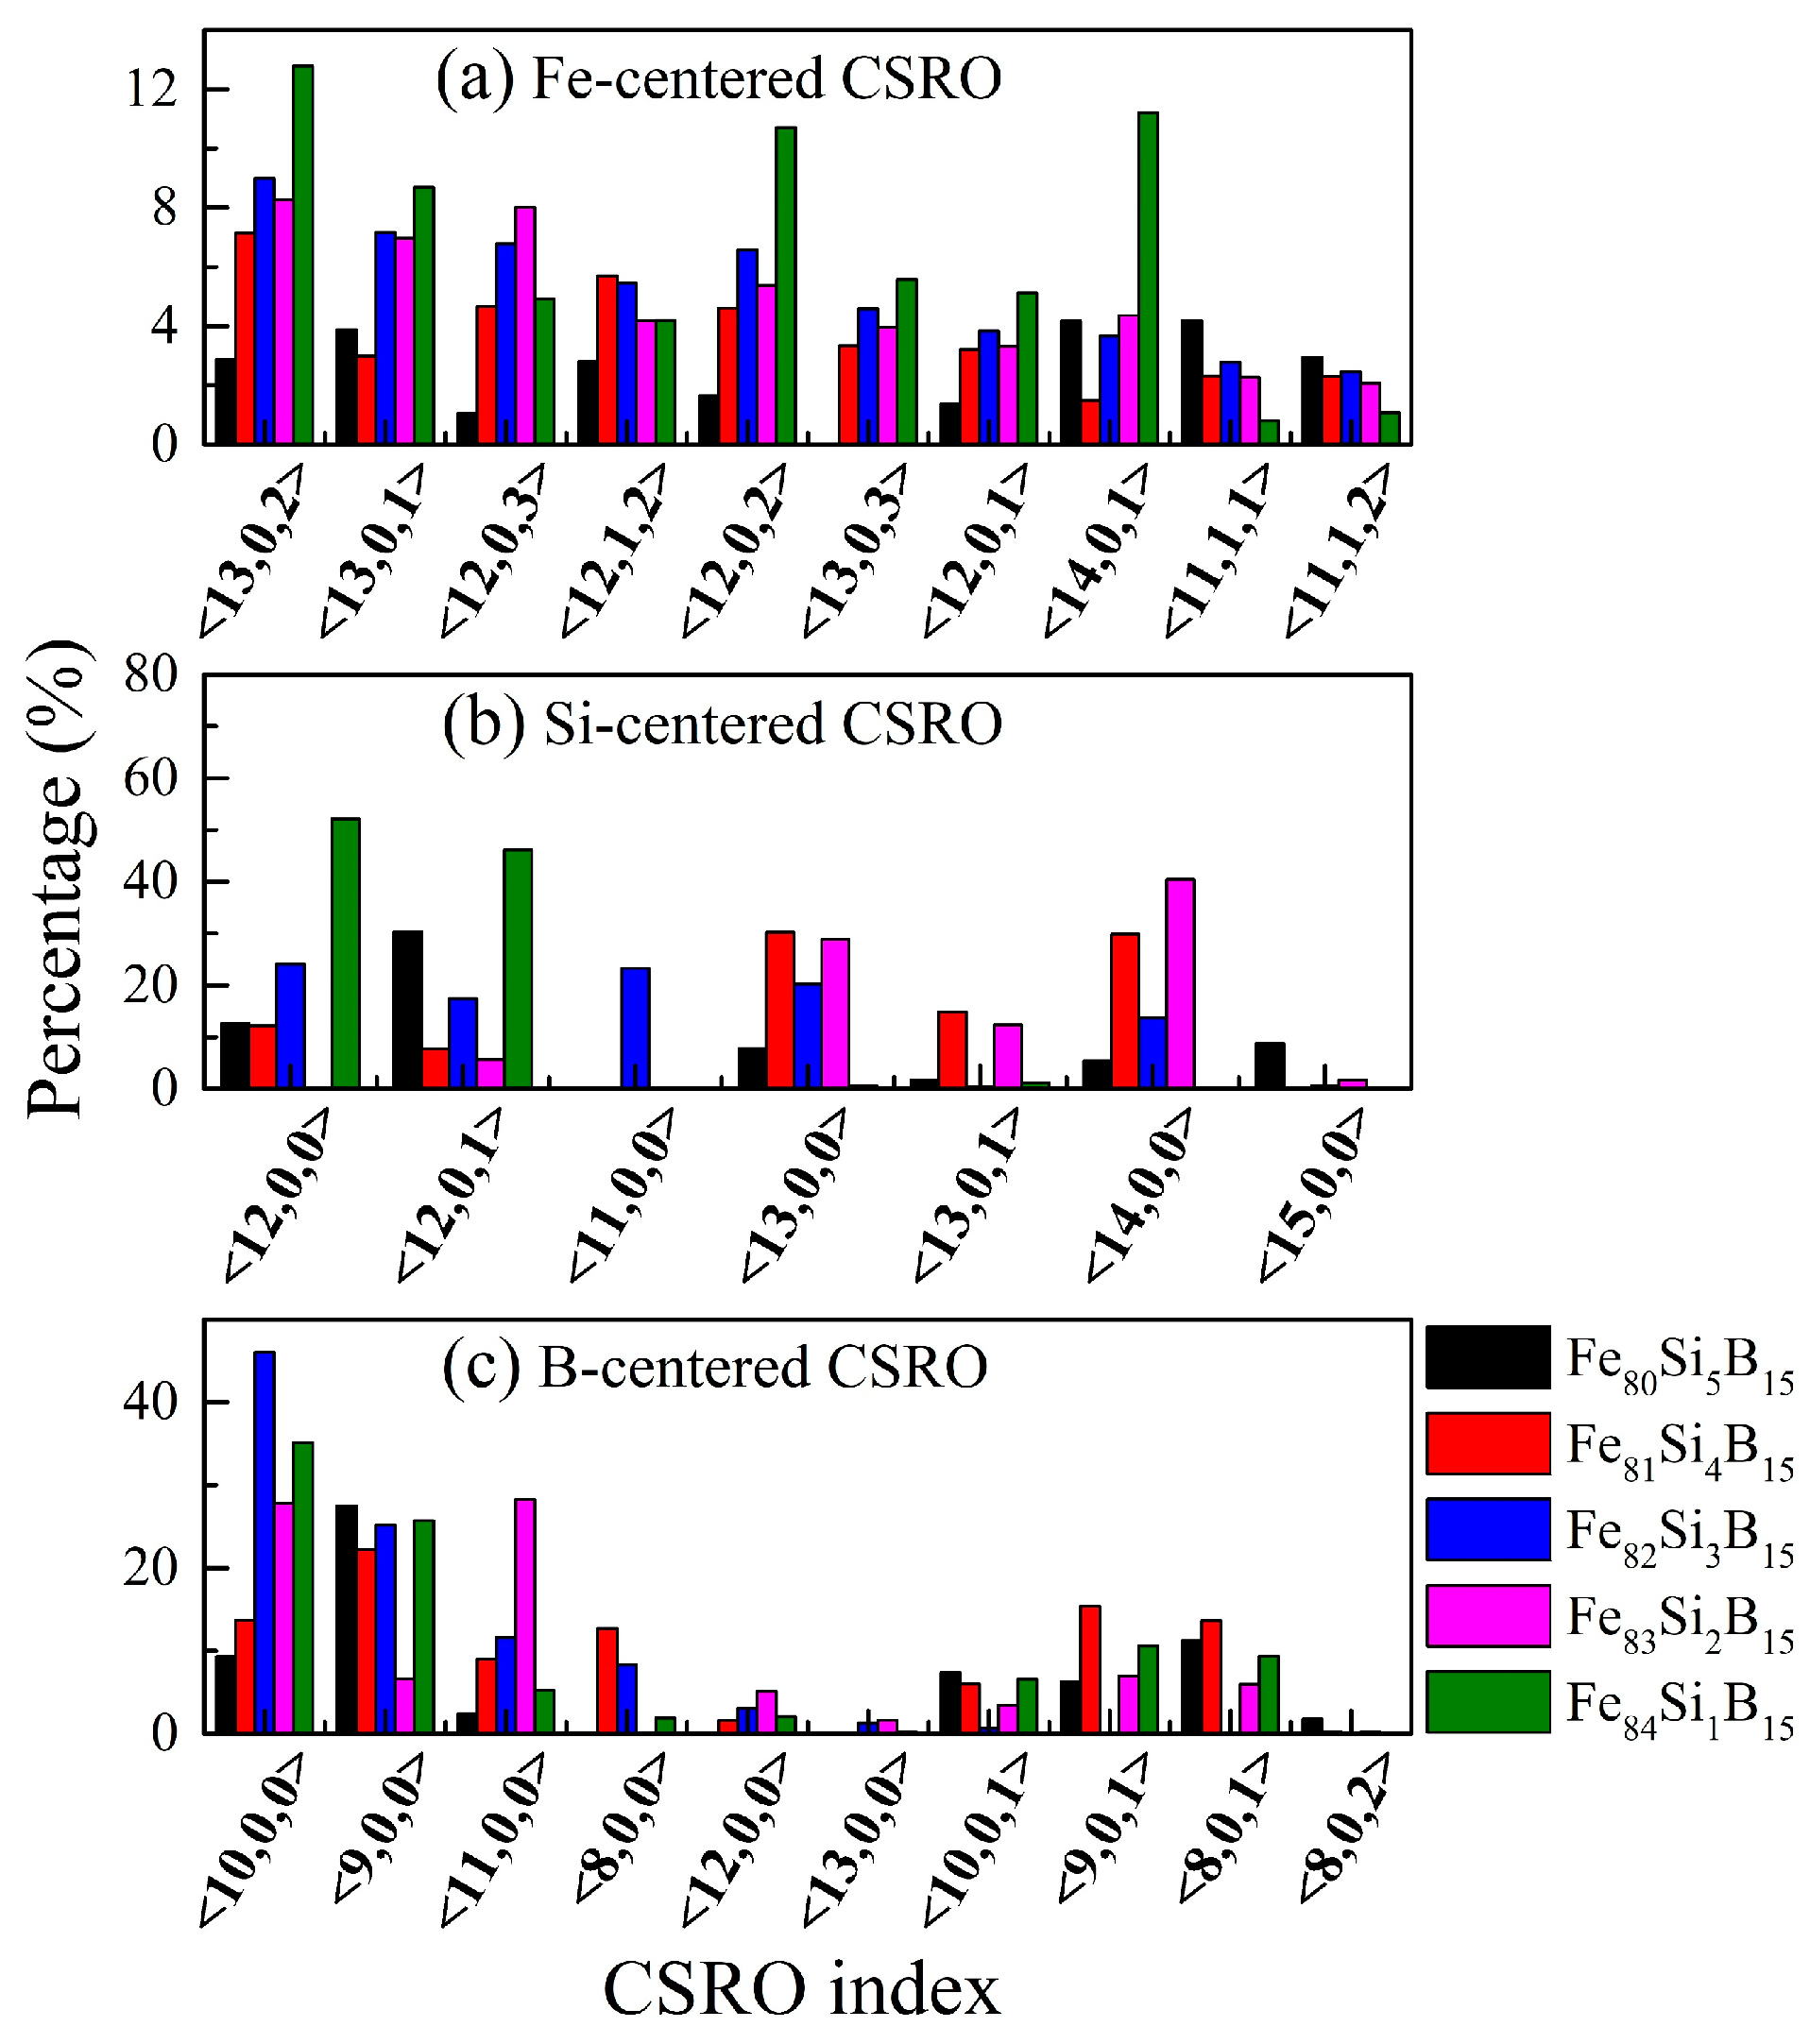
The fraction of atom-centered CSROs, confined to the NN shell, is shown in
Figure 4 and
Table 5. The index <
n1,
n2,
n3,
n4> along the lateral axis defined the CSRO type, in which
ni indicated the total number of Fe, Si, or B atoms in the chemical component. For instance, index <13, 0, 2> in
Figure 4a denotes that this type of Fe-centered CSRO in the Fe
80+xSi
5−xB
15 (
x = 0–4) amorphous alloys contained 13 Fe atoms, 0 Si atom, and 2 B atoms. In the M-centered CSROs, when the same M atom existed in the NN shell, the CSRO was defined as the S-type. If the atoms in the NN shell were all Fe atoms, then this CSRO was called a P-type CSRO [
18].
From
Figure 4 and
Table 5, it could be seen that, although the same M atoms were found in the NN shell of M, most of the surrounding atoms were Fe, indicating the formation of M-centered clusters in the Fe
80+xSi
5−xB
15 (
x = 0–4) alloys. In addition, by decreasing the Si content to 3 at.%, the fractions of the S-type reached a minimum of 0.0 and 0.6% for the Si-centered and B-centered CSROs, respectively. This indicated that the same atoms were rarely found around the Si or B atoms, resulting in an increased possibility of surrounding by the Fe atoms, which implied that the Si and B atoms had a dispersed distribution and that the solute–solute avoidance effect for the Fe
82Si
3B
15 amorphous alloy was the strongest. On the other hand, Fe-centered clusters that were only surrounded by Fe atoms (P-type) were rarely found, which showed the presence of few pure Fe clusters. Thus, the Fe atoms were mainly located in the NN atoms of all elements, making the distribution of Fe atoms more uniform. With the increase in Fe content (80 at.% → 84 at.%), the proportion of Fe-centered P-type CSROs increased from 2.5 to 8.9%, which indicated that the content of pure Fe clusters increased with the Fe content.
In connection with the above-mentioned results of the PDF, VP, CN, and CSRO, we concluded that, in the Fe80+xSi5−xB15 (x = 0–4) amorphous alloys, the Fe82Si3B15 alloy was the optimum composition, combining a good thermal stability with the GFA and magnetic properties. To further verify the simulation results, the Fe-based amorphous alloys were prepared by specific experiments, and XRD, DSC, and VSM analyses were used for the determination of the structure, thermophysical properties, and magnetism, respectively.
3.2. Experimental Determination
The melt-spun ribbons of the Fe
80+xSi
5−xB
15 (
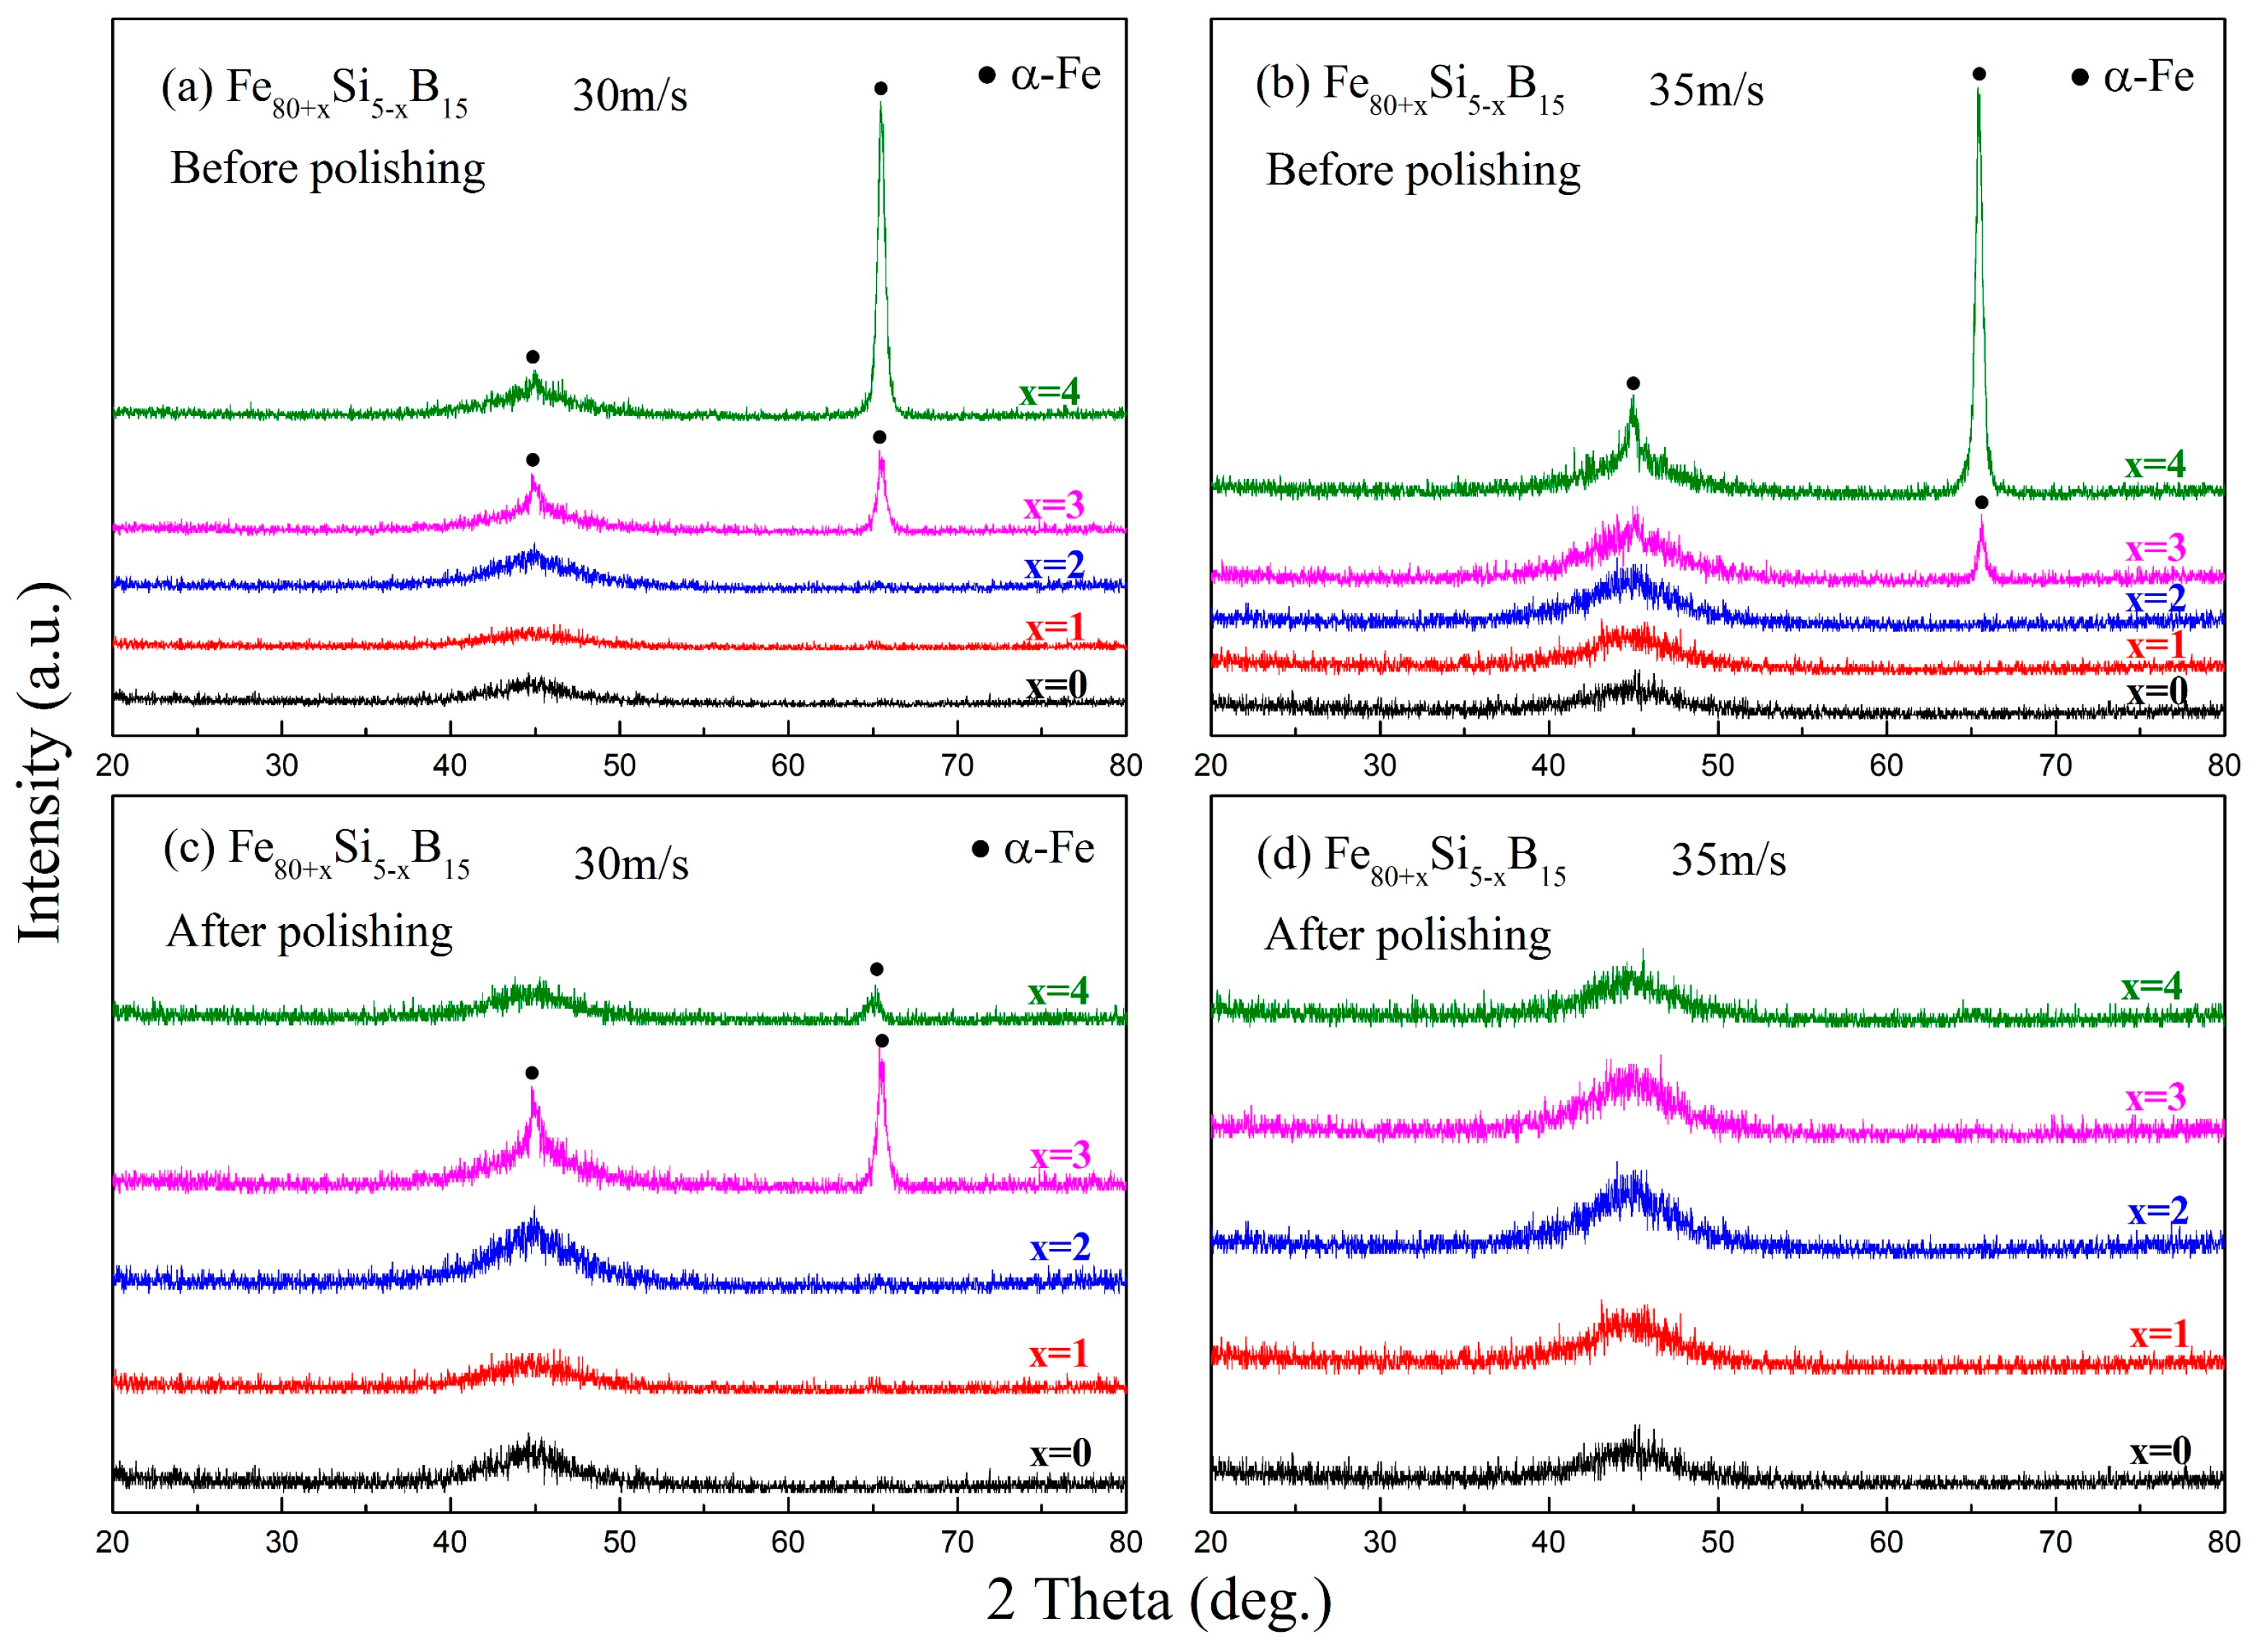
x = 0–4) alloys were prepared by single roller melt-spinning with a linear velocity of 30 or 35 m/s under a highly purified argon atmosphere. XRD was used to analyze the phase structure of these ribbons (
Figure 5). Before polishing, an amorphous structure was formed in the ribbons with an Fe content below 82 at.%, but further increasing the Fe content induced the formation of the α-Fe phase, as shown in
Figure 5a,b. After polishing, the α-Fe phase could still be found in the ribbons with a high Fe content that were prepared at the linear velocity of 30 m/s, but only one amorphous broad peak could be found in all ribbons prepared at the linear velocity of 35 m/s, as illustrated in
Figure 5c,d. The existence of the α-Fe phase was due to the crystallization layer on the free surface of the melt-spun ribbons, which was an indication of a decreased GFA. It should be noted that, when further increasing the Fe content, the GFA of the alloys was worse, as reported in the literature [
40,
41]. Thus, according to the XRD results, we concluded that the formation of the amorphous phase was affected by the Fe content and that the GFA decreased noticeably if the Fe content exceeded 82 at.%. For Fe
80Si
5B
15, Fe
81Si
4B
15, and Fe
82Si
3B
15, their GFA could not be distinguished based on the XRD results. However, it was reasonable to suppose that Fe
82Si
3B
15 had a relatively good GFA in the five compositions covered in this work.
To quantitatively characterize the thermodynamic properties of the ribbons, the polished Fe
80+xSi
5−xB
15 (
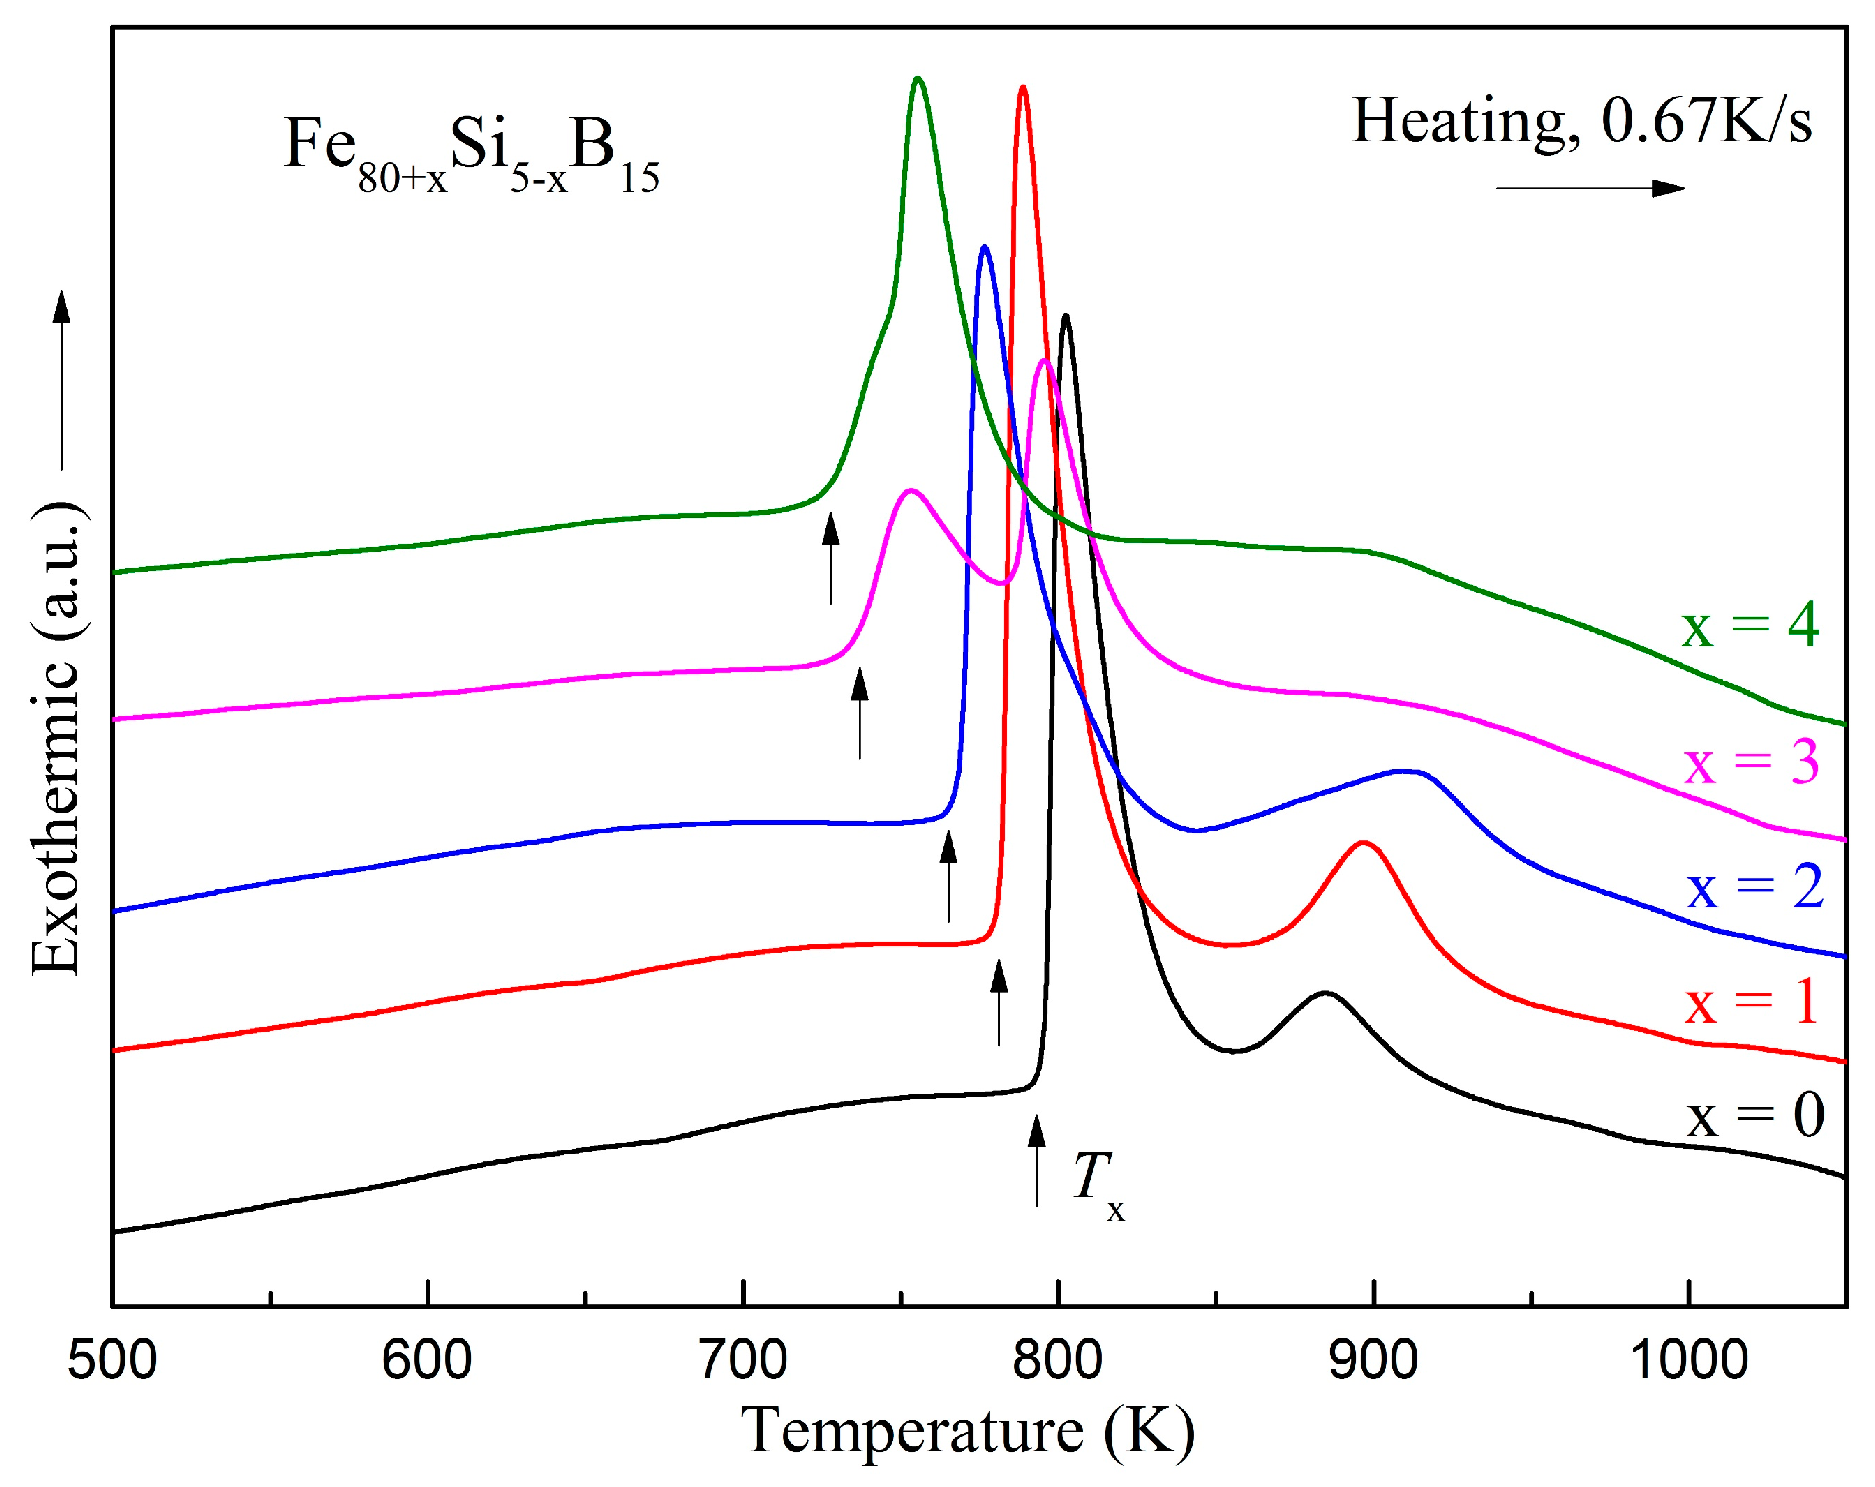
x = 0–4) amorphous ribbons prepared with a linear velocity of 35 m/s were investigated by DSC.
Figure 6 shows the DSC curves of the ribbons at a heating rate of 0.67 K/s under a highly purified argon atmosphere. Two exothermic peaks existed in each DSC curve except for the Fe
84Si
1B
15 amorphous alloy. The exothermic peak of the Fe
84Si
1B
15 amorphous alloy was asymmetric, which could indicate that there was no single crystallization process. We speculated that the precipitation phases of the Si-added alloys were more complicated. In the DSC curves, no obvious glass transition temperature could be detected for all alloys. The crystallization temperatures (
Tx) are summarized in
Table 6. It could be seen that in the Fe
80+xSi
5−xB
15 (
x = 0–4) alloys, the
Tx values decreased as
x increased.
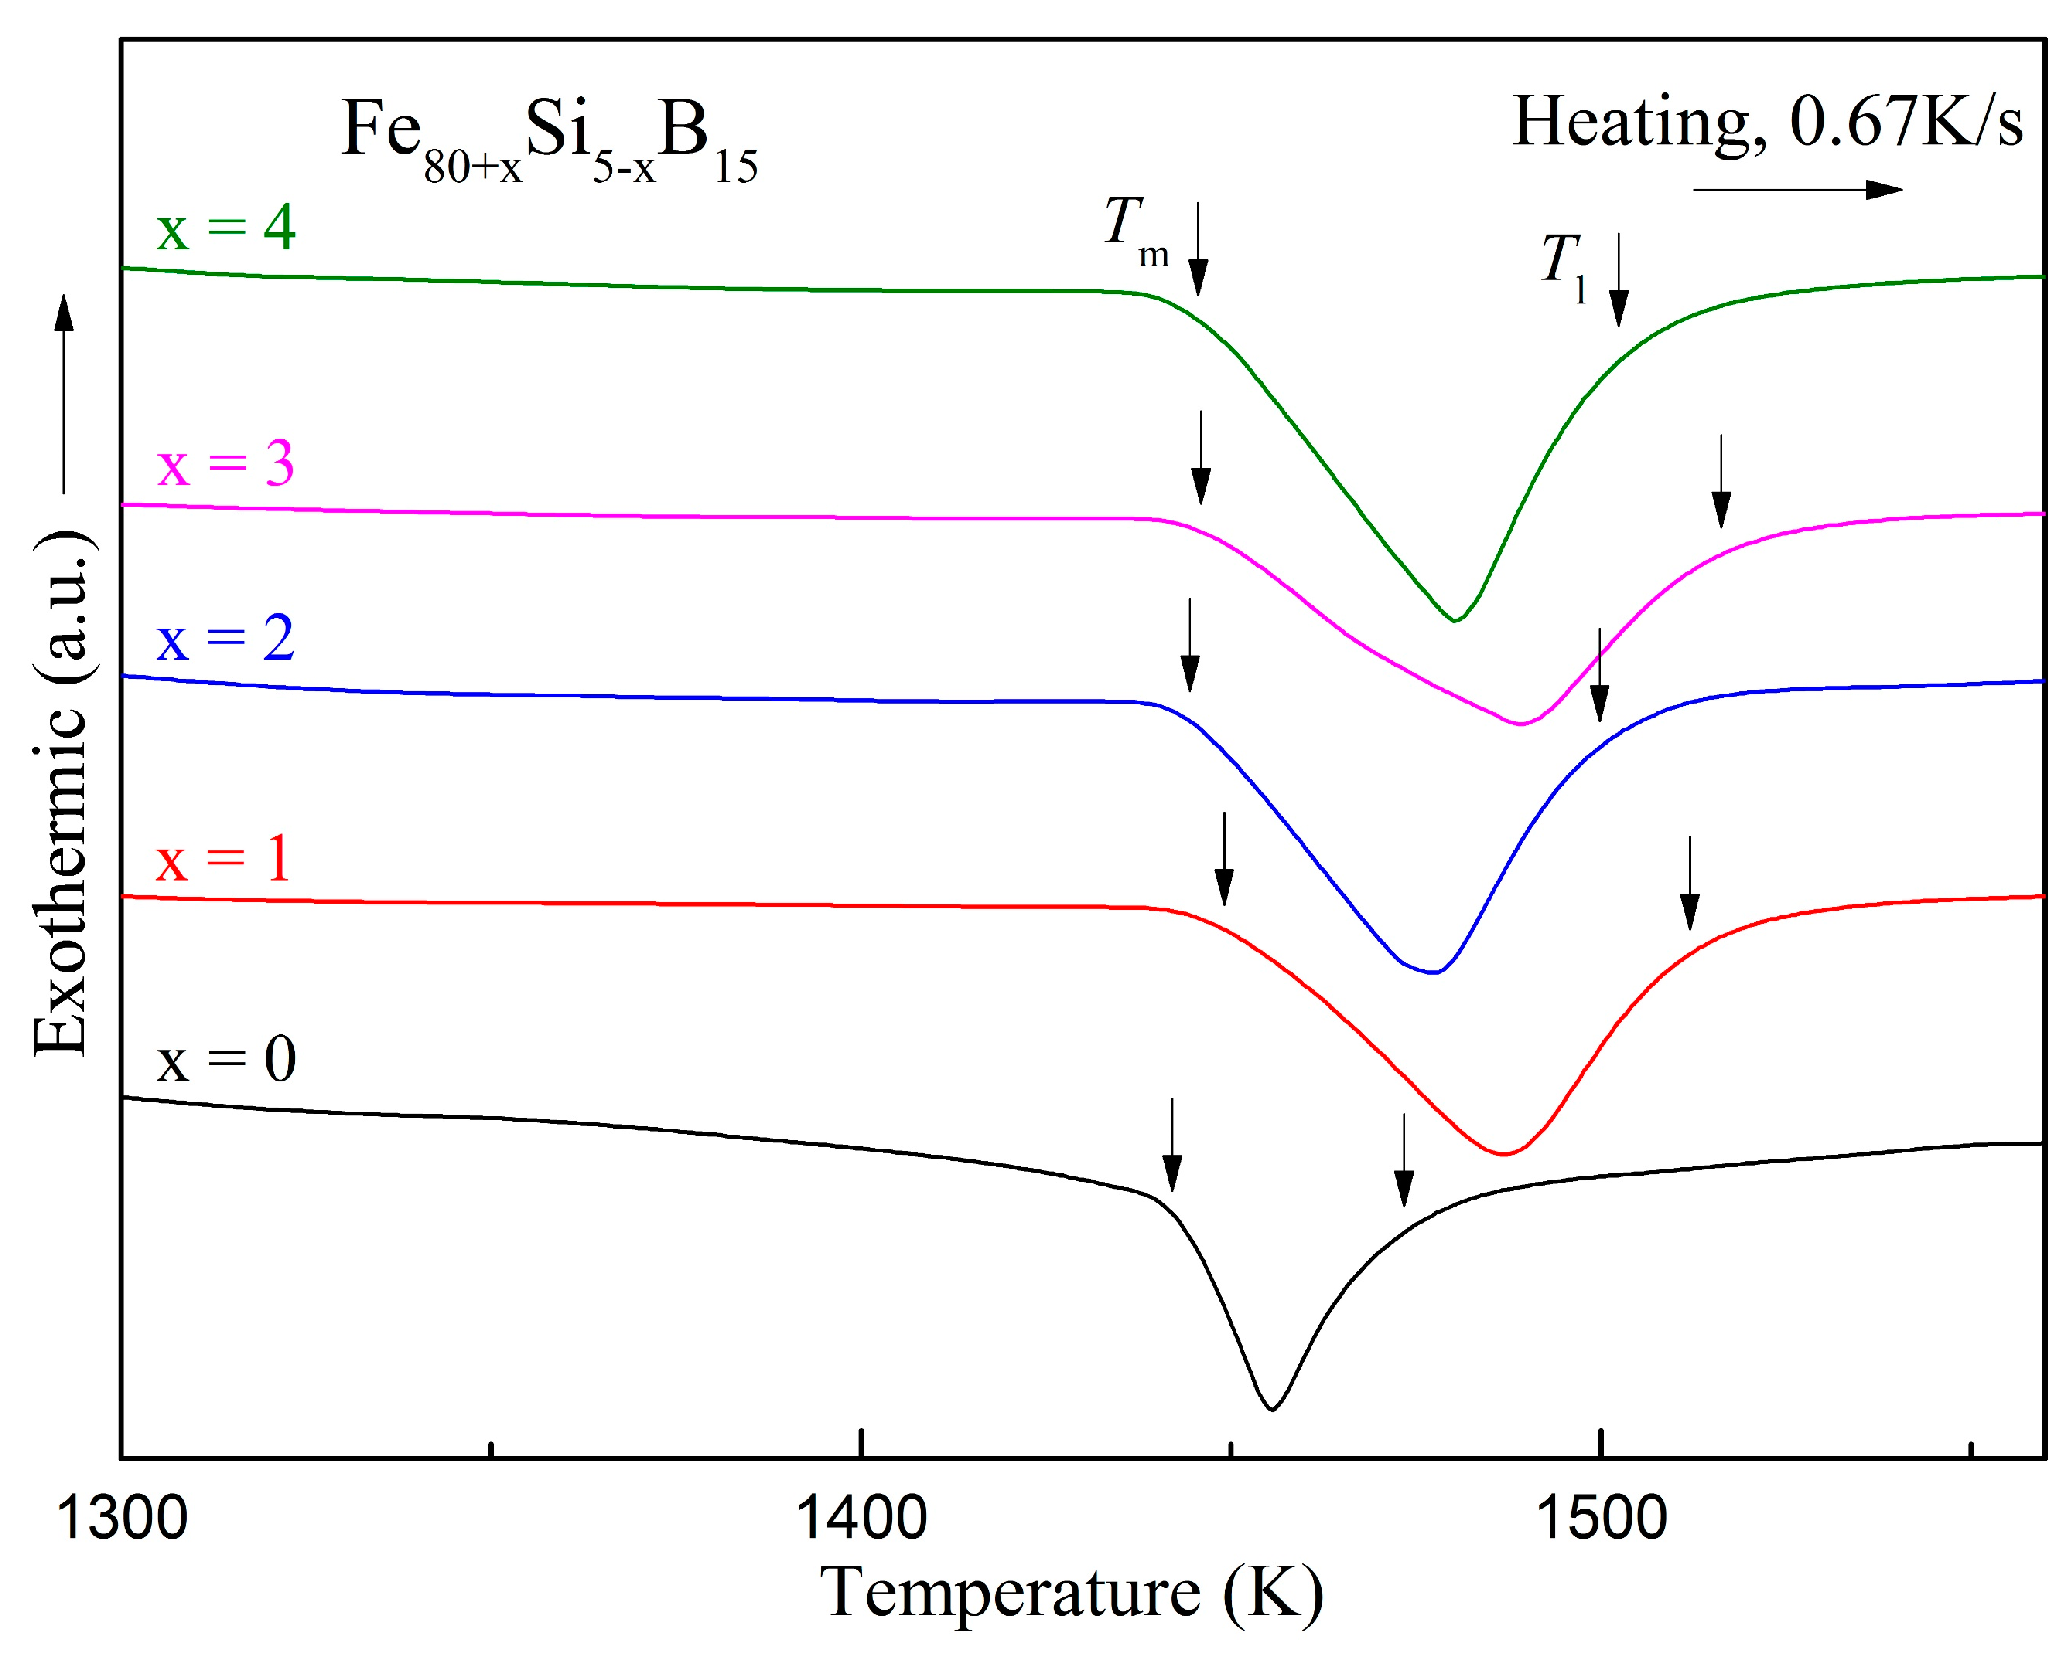
The DSC curves of the melting processes for the Fe
80+xSi
5−xB
15 (
x = 0–4) alloys are presented in
Figure 7. The onset and end temperatures of the melting endothermic events denoted by
Tm and
Tl are summarized in
Table 6. Many parameters can be used to estimate the GFA such as the reduced glass transition temperature,
Trg =
Tg/Tl [
42], and
γ = [
Tx/(
Tl +
Tg)] [
43,
44]. For amorphous alloys without an obvious glass transition temperature in the DSC determination,
Trg is often replaced by
Trx =
Tx/Tl for characterizing the GFA [
8], and
Hc is also an alternative because its decrease is usually accompanied by an increase in the GFA [
45]. The changes of
Trx and
Hc with the value of
x for the Fe
80+xSi
5−xB
15 (
x = 0–4) alloys are illustrated in
Figure 8 and the two parameters are added to
Table 6. For
Hc, the values for
x = 0–2 were close and much lower than the values for
x = 3 and 4. For
Trx, amongst the five components,
x = 2 at.% also showed a relatively high value although it was not the highest one. From these two parameters, we could conclude that the Fe
82Si
3B
15 alloy had a relatively good thermal stability and GFA.
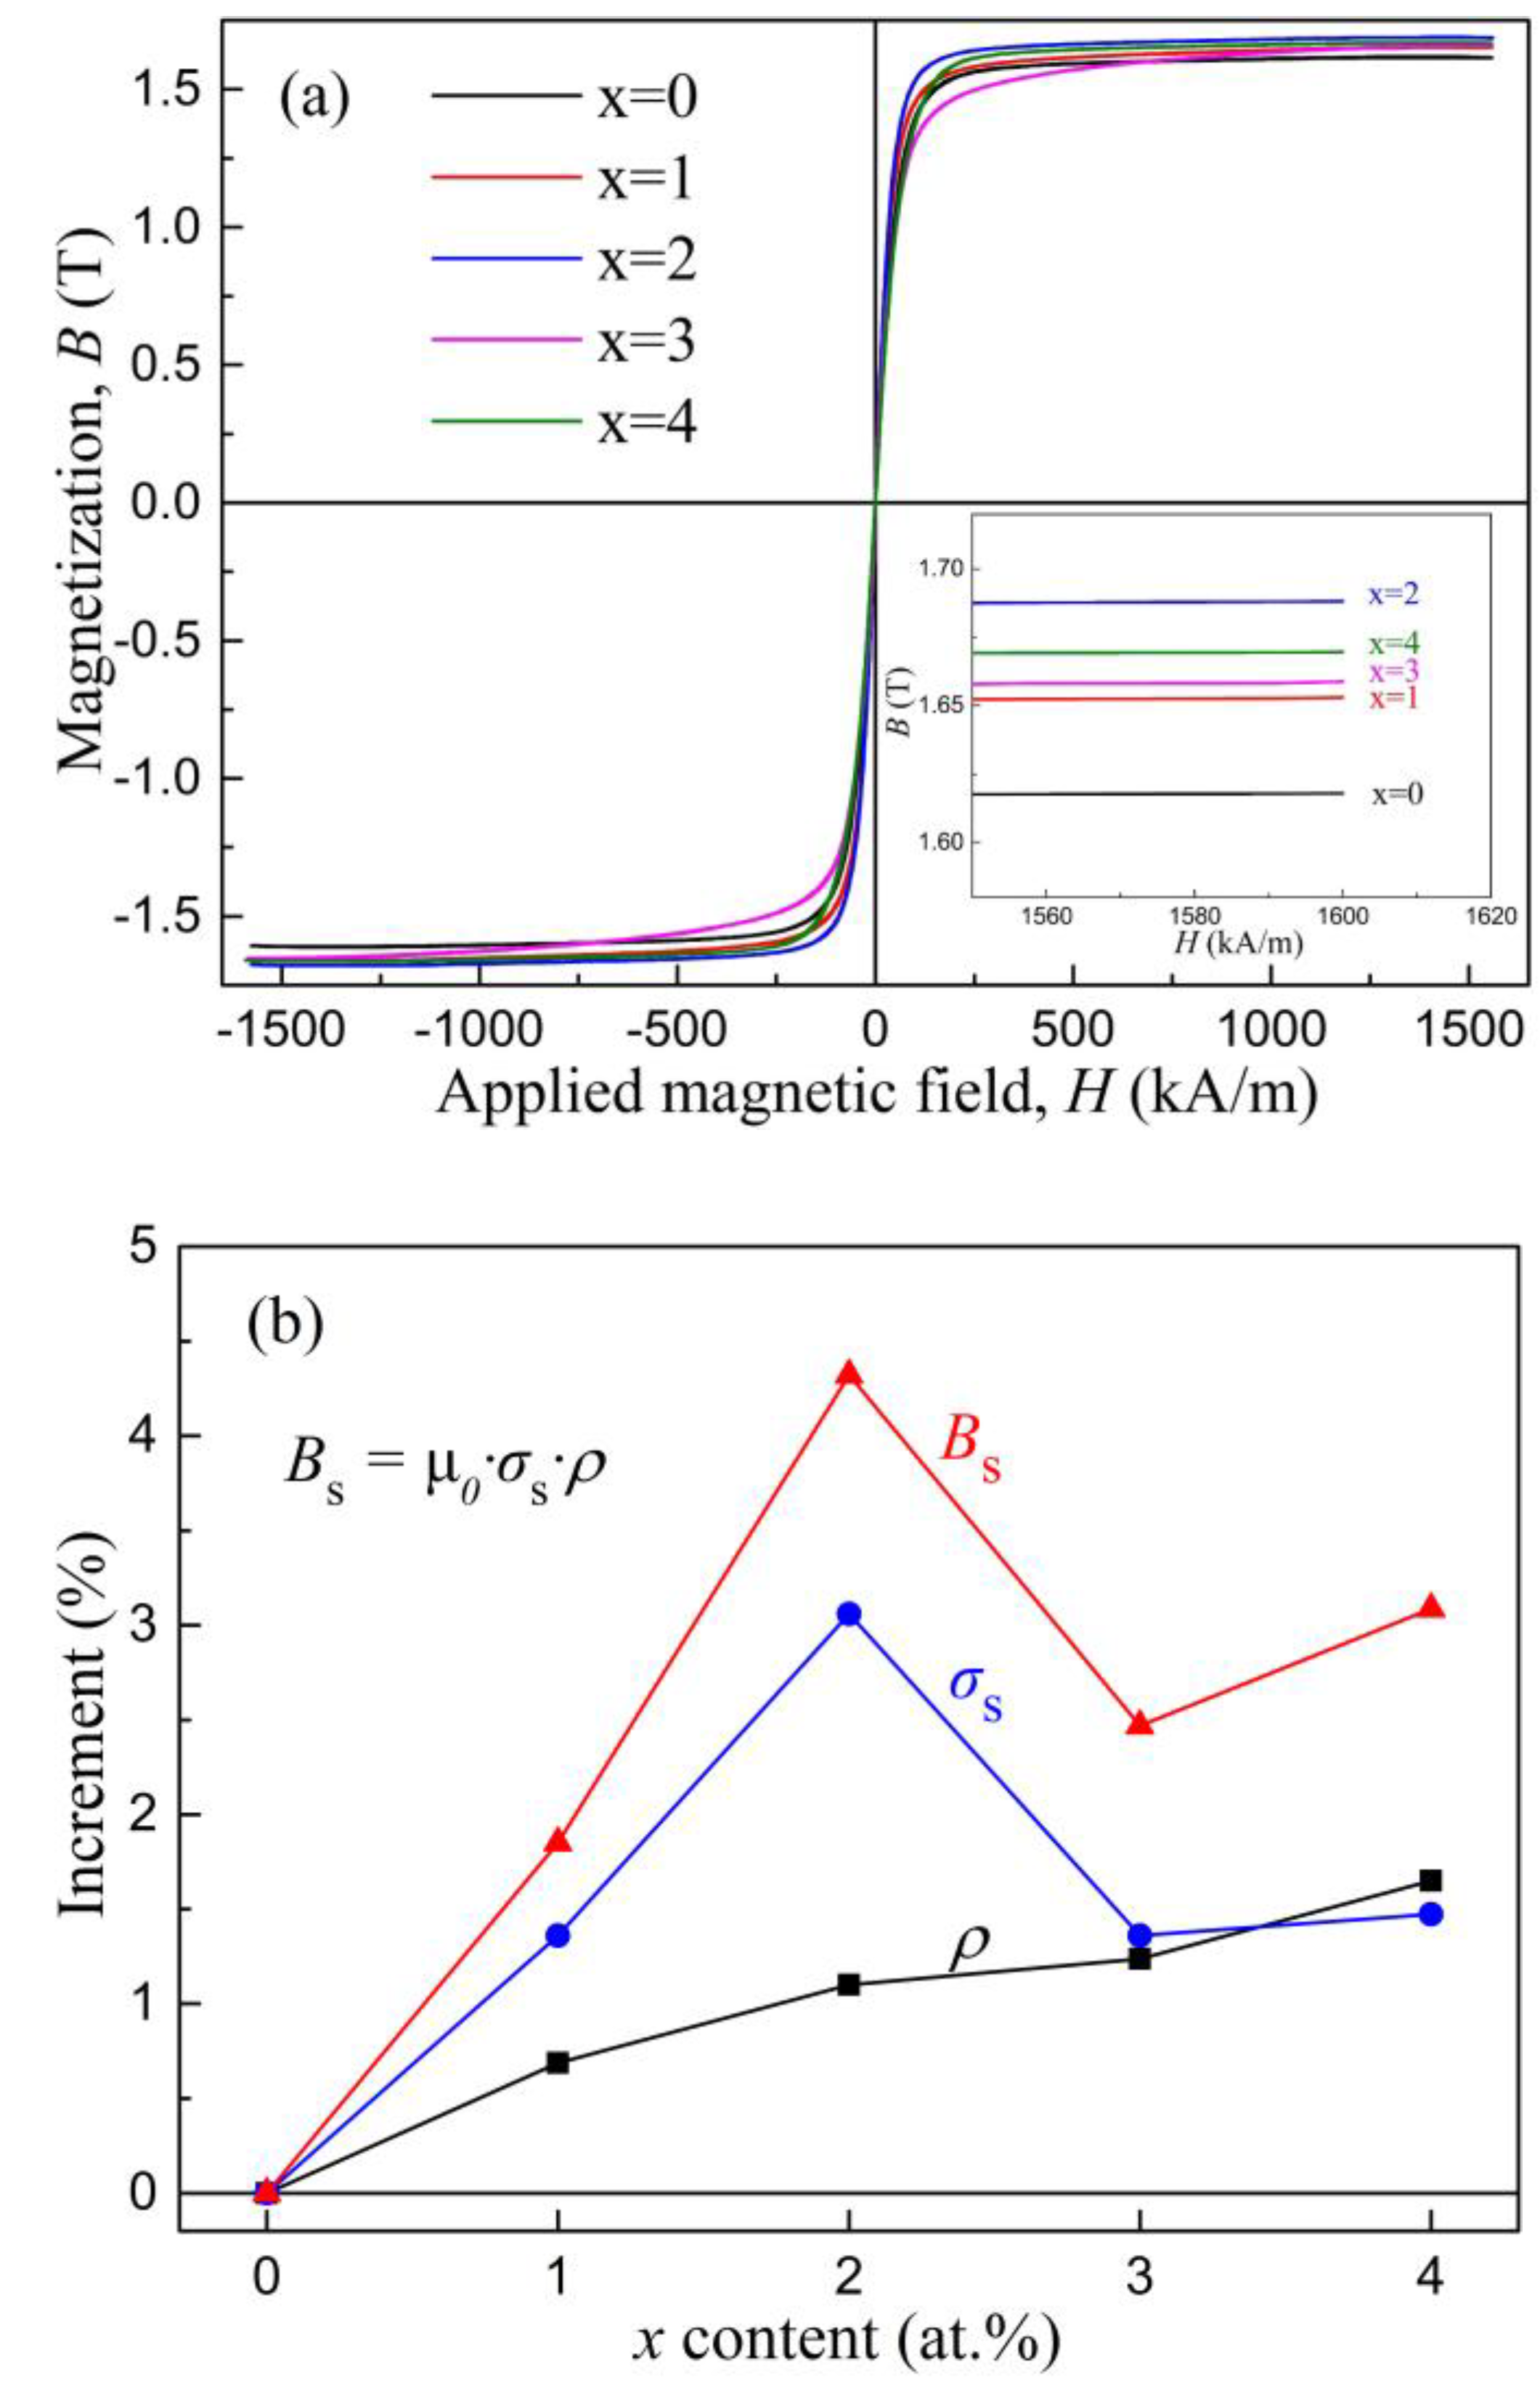
The magnetic properties of these glassy alloys were further investigated. The hysteresis loops of the as-quenched ribbons are presented in
Figure 9a. Three individual amorphous alloy ribbons of each composition, which were prepared at a linear velocity of 35 m/s and polished, were selected for the VSM test to improve the reliability of the data. All samples exhibited the typical loops of soft magnetic amorphous alloys. The
Bs values were derived from the density
ρ (measured by the Archimedean method), the permeability of the vacuum (
μ0 = 4π × 10
−7 N/A
2), and the saturated mass magnetization
σs according to the expression
Bs =
μ0·
σs·
ρ. The results are illustrated in
Figure 9b and also tabulated in
Table 6. It could be seen that, with an increase of
x, the
Bs values of the amorphous ribbons first increased and then decreased. The maximum
Bs value of 1.69 T was reached at
x = 2 at.%. For the
Bs of 1.69 T, the content of Si was 3 at.%, the
σs value was 182.5 Am
2/kg, and
ρ was 7.36 × 10
3 kg/m
3. We noted that for the same sample (3 at.% Si) in the previous literature [
46,
47],
σs was reported to be 177 Am
2/kg, with
ρ being 7.41 × 10
3 kg/m
3 and, accordingly, the
Bs value was calculated to be 1.65 T, which was slightly lower than our result (1.69 T). Considering the possible difference in the experiments, including the ribbon quality and the testing equipment, such a slight variation was considered to be reasonable. Overall, our results indicated that when the Fe content was less than 82 at.% in the Fe-Si-B amorphous alloys, the
Bs value increased with the increase in Fe content and this trend was reversed with a higher Fe content. This observation was in agreement with a previous report [
8].
Combining the results of the XRD, DSC, and VSM analyses, a conclusion could be made that, amongst the Fe80+xSi5−xB15 (x = 0–4) amorphous alloys, the Fe82Si3B15 amorphous alloy had the highest saturation magnetization and a relatively good GFA. Considering the balance between the soft magnetic properties and the GFA, Fe82Si3B15 was determined to be the optimum composition. Such an experimental observation confirmed our prediction based on the simulation results.


