3.1. Conformational Analysis Quantum Chemical Calculations
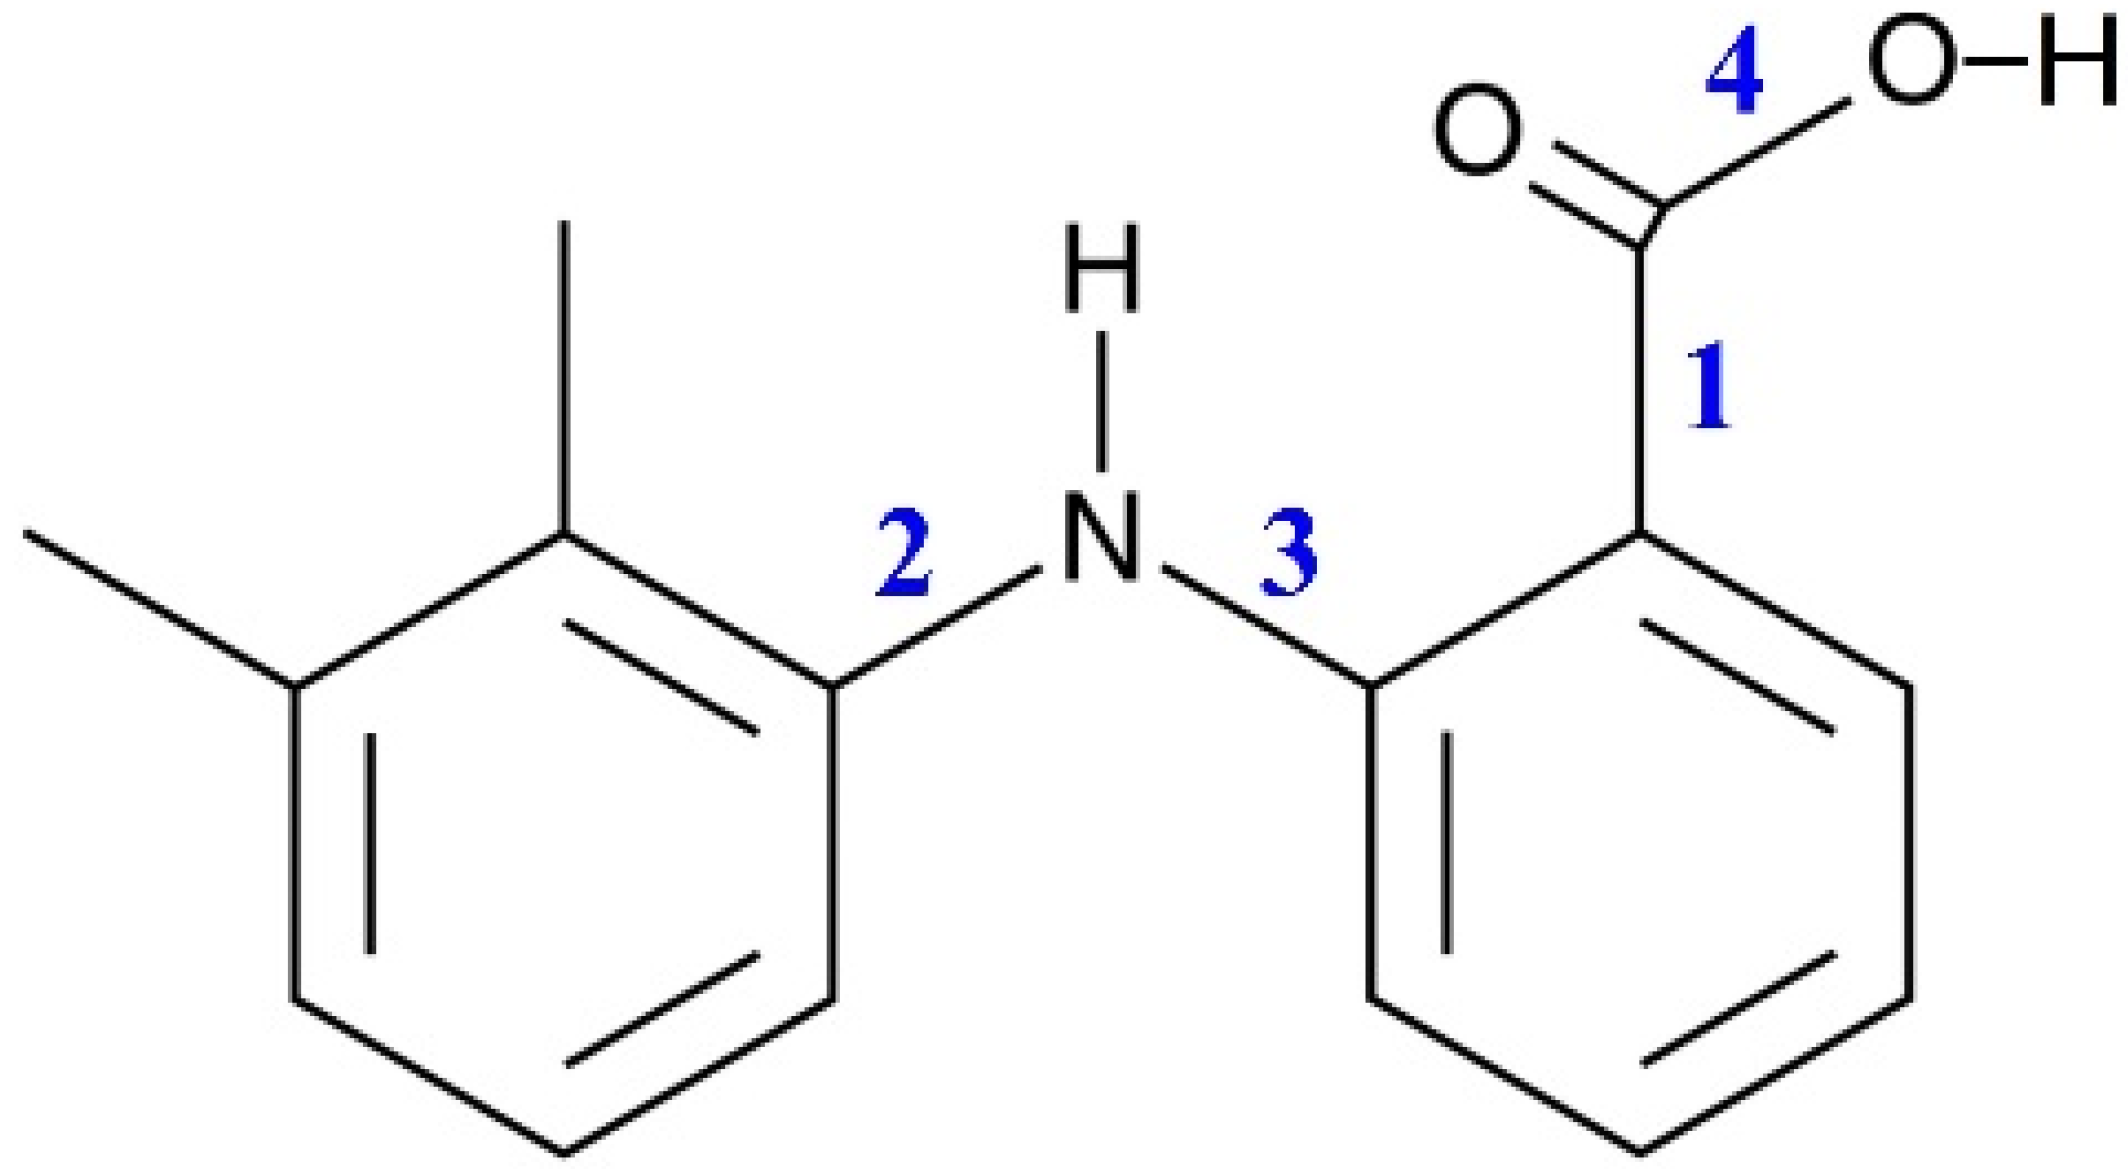
The MA molecule structure is shown in
Figure 1. It contains two groups, which can form intra- and intermolecular H-bonds. The MA molecule also has a dimethyl-substituted benzene ring and a carboxylic fragment, which is assumed to be responsible for its high conformational lability. There are four bonds in the MA molecule, around which the fragments can rotate, leading to the formation of various conformers. These bonds are numbered in
Figure 1.
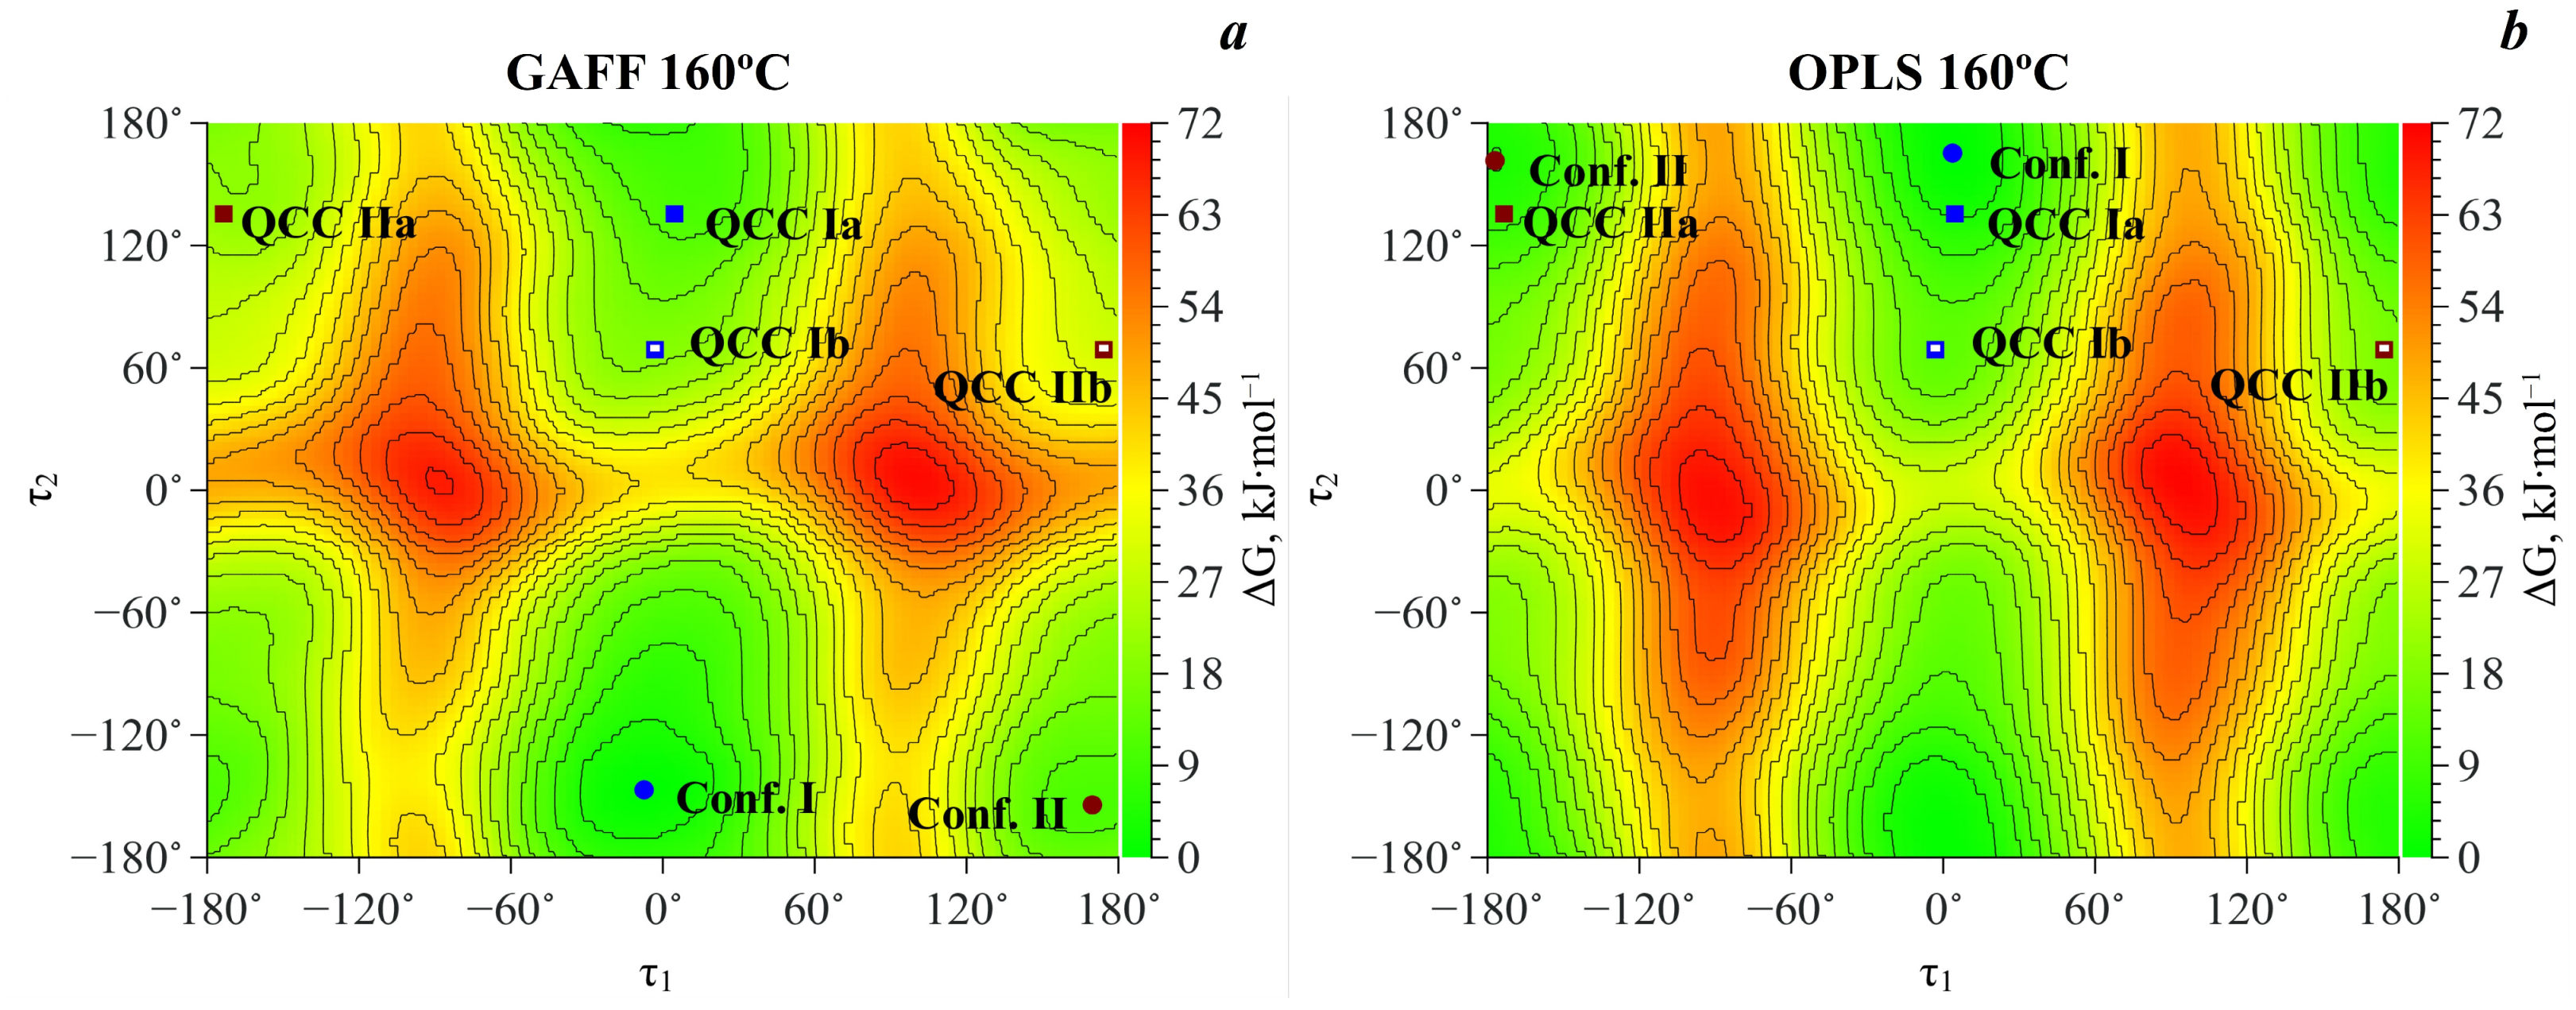
Based on the calculation results, we found that the most stable MA conformers are formed when the functional groups rotate around bonds “
1” and “
2”, while the rotation around bonds “
3” and “
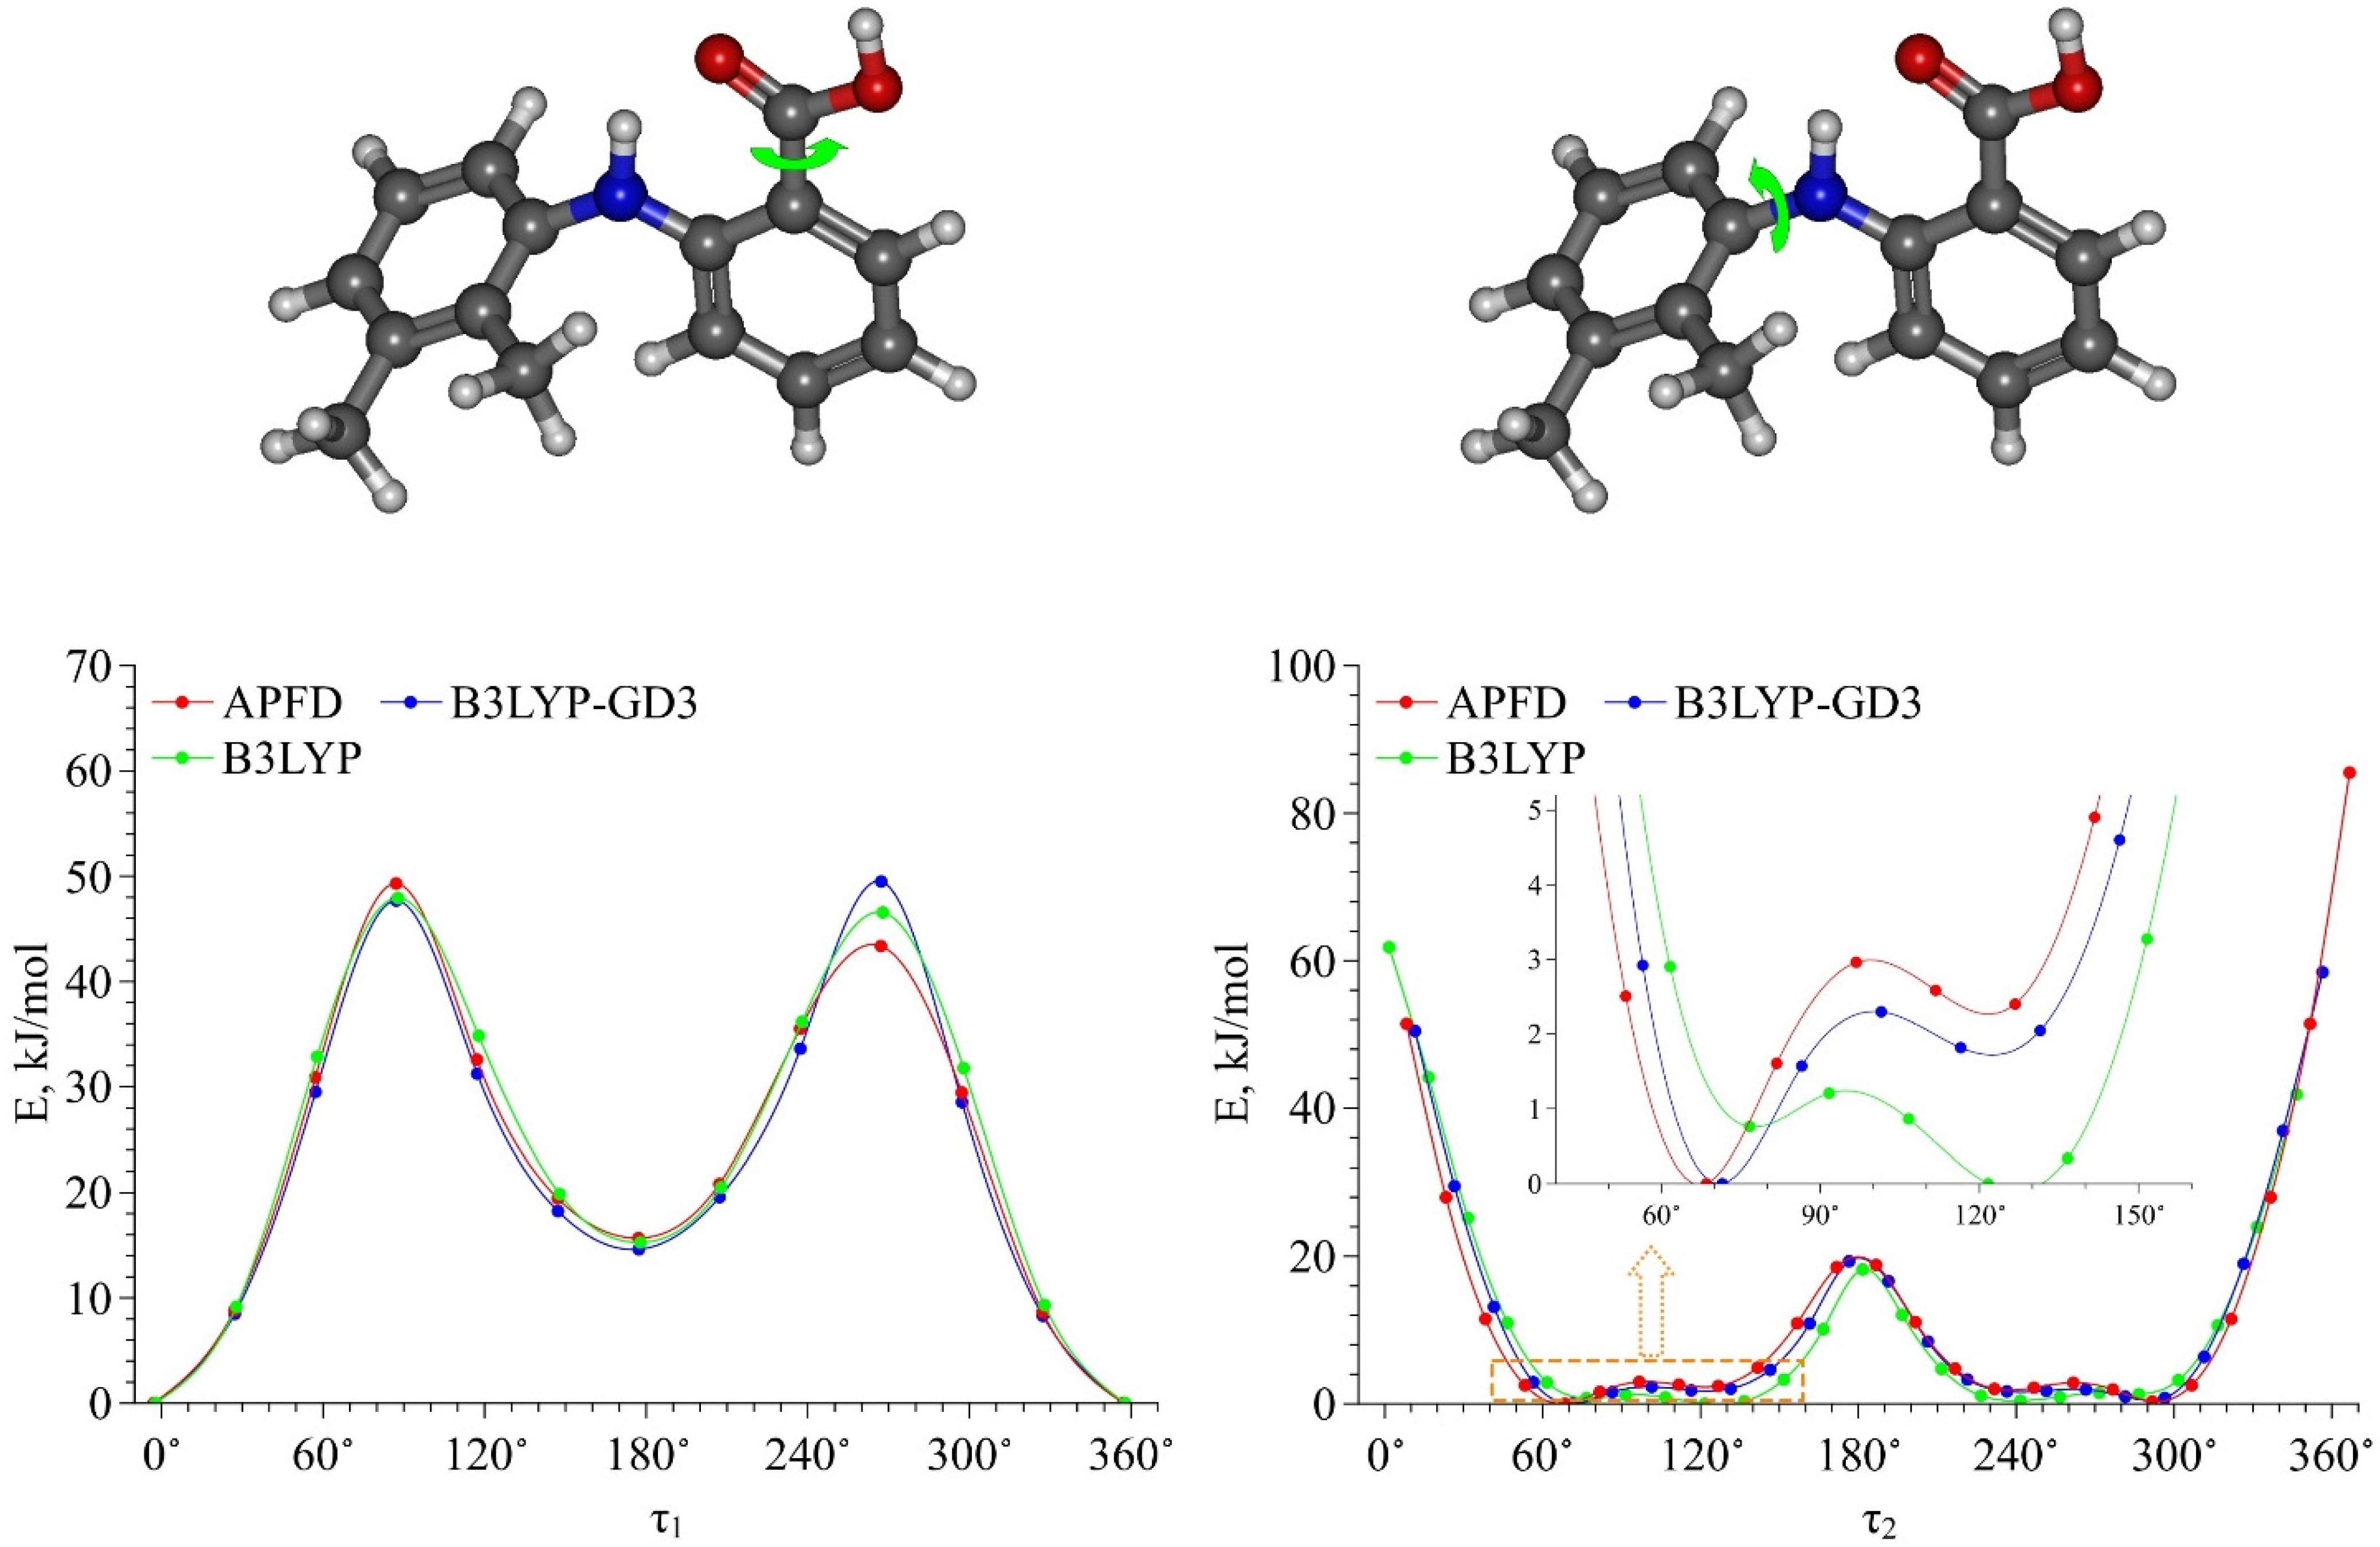
4” leads to the formation of conformers with higher energies. Thus, within this work we considered only the four most stable conformers. They form when the carboxylic group rotates around bond “
1” (variation of the dihedral angle
τ1 (C4–C3–C10–O11)) and the dimethyl-substituted benzene ring rotates around bond “
2” (variation of the dihedral angle
τ2 (C4–N15–C17–C19)) in the MA molecule structure (see
Figure 2). These conformers are denoted as Ia, Ib, IIa, IIb. The values of the mentioned dihedral angles for each of the four conformers are presented in
Table 2. According to the energy values for these conformers (see
Table 2), we divided them into two groups: Ia–Ib and IIa–IIb.
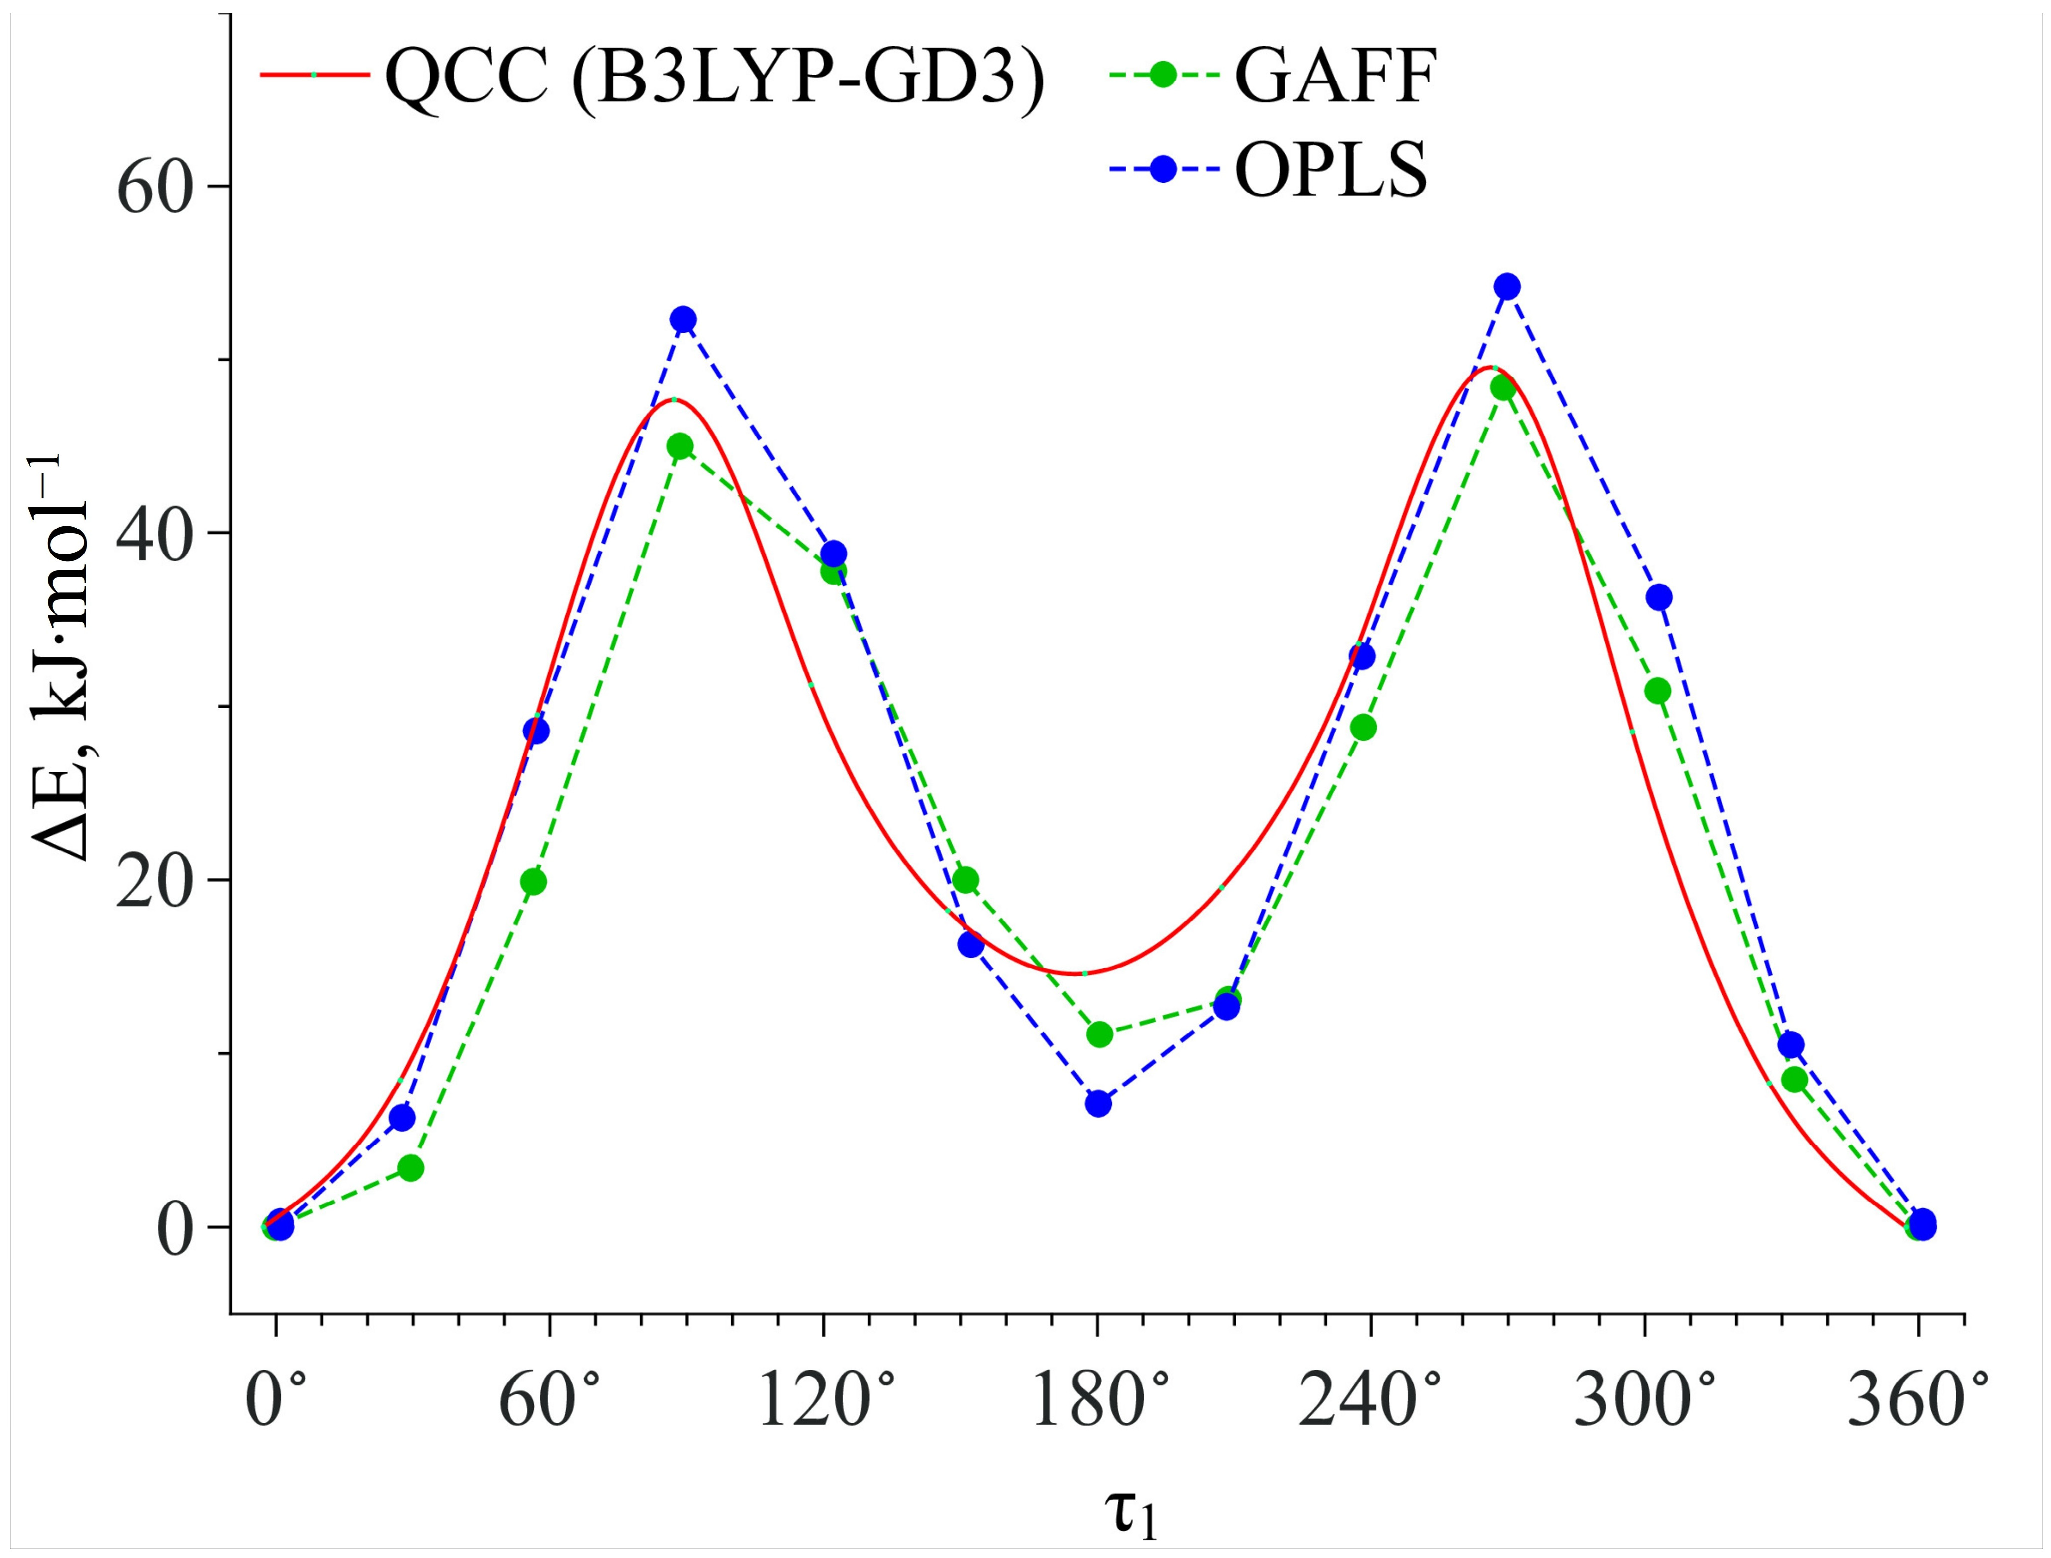
Then we calculated the energy barriers of the conformational transitions caused by varying the dihedral angles
τ1 and
τ2 for the three functionals used. These barriers are presented in
Figure 3. Analyzing these plots, we found that the conformational transition barrier related to the variation of the dihedral angle
τ1 is high (~50 kJ·mol
−1). However, the barrier of the conformational transition related to the variation of the dihedral angle
τ2 does not exceed 3 kJ·mol
−1 (for B3LYP–GD3 and APFD) and 1.5 kJ·mol
−1 (for B3LYP), which is lower than the thermal fluctuations (k
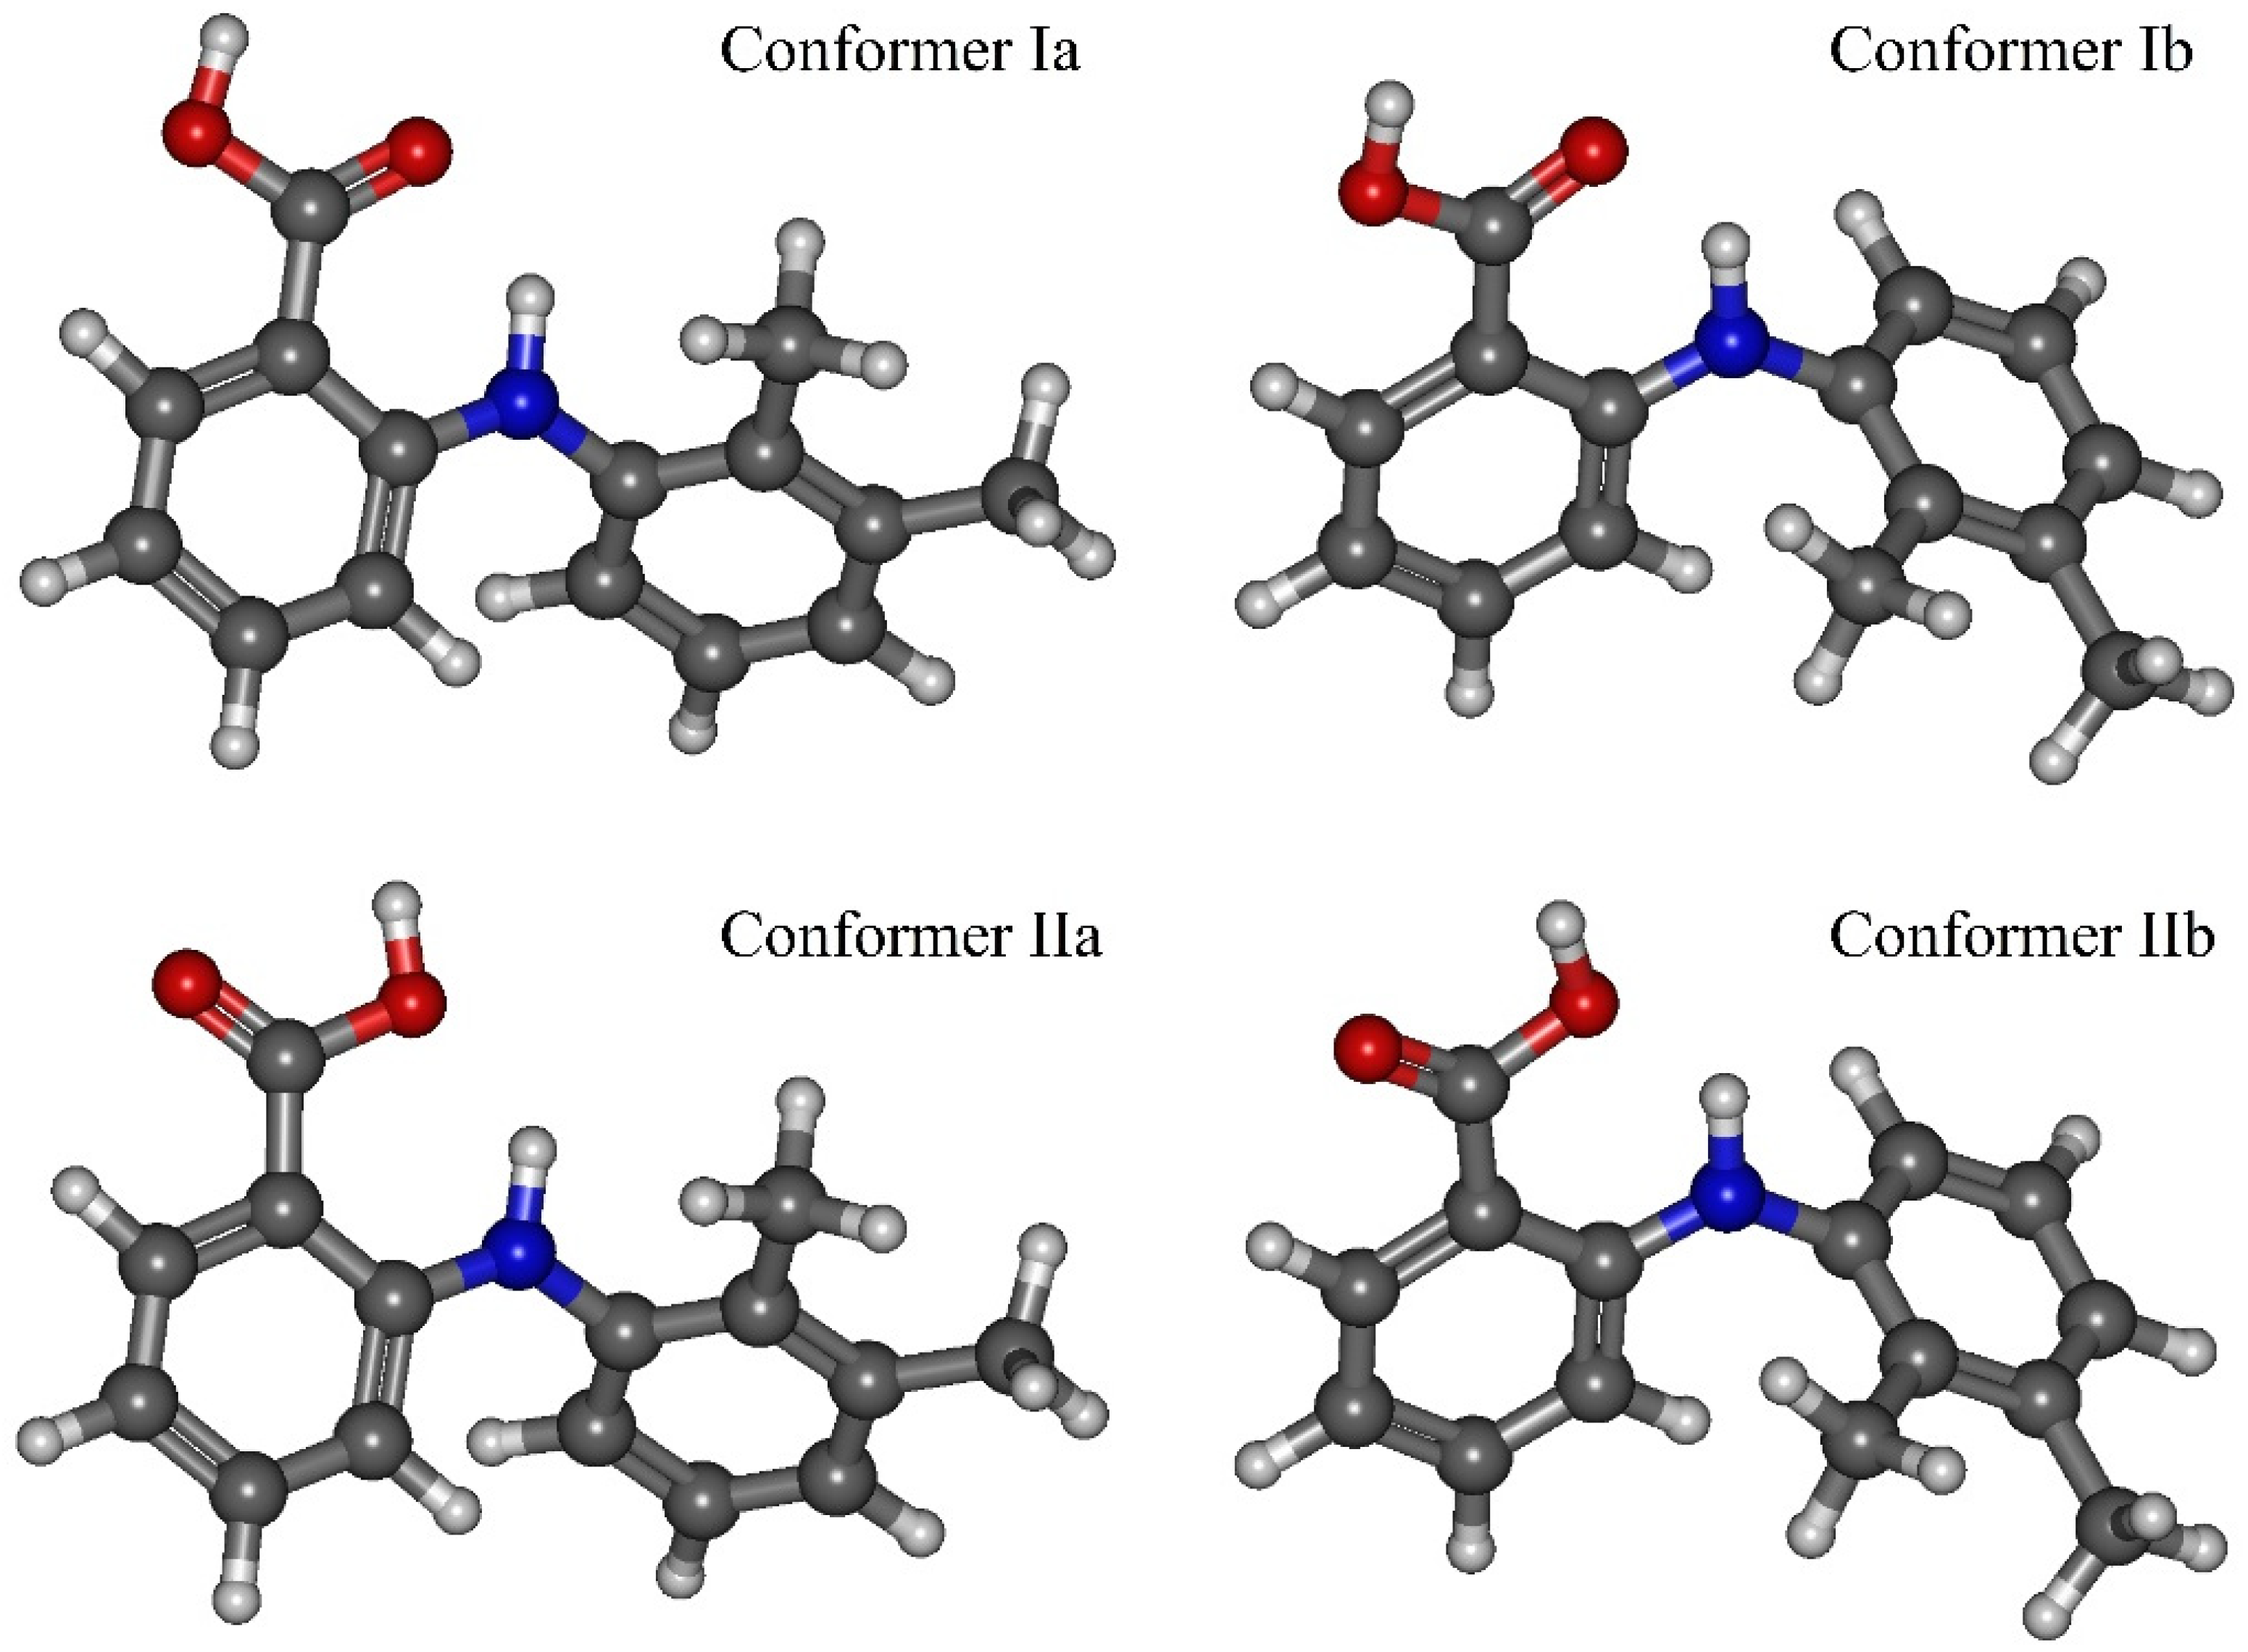
BT) at the temperature of 130 °C. Thus, we determined the two most stable conformers Ia and Ib (see
Figure 4), for which the difference in the energies and the energy barrier between them are insignificant. However, the higher barrier (~20 kJ·mol
−1) is observed upon the transition through the plane of the other benzene ring and is related to the steric effects of the two methyl substituents. Nevertheless, the transition through this plane leads to the formation of mirror-symmetric conformers, which are indistinguishable in terms of energy. The same situation is observed for the second pair of conformers IIa and IIb (see
Figure 4), which have higher energy values. Specifically, the transition between them can easily occur in the temperature range studied. However, as the insert presented in
Figure 3 shows, the shape of the energy profile of the conformational transition related to the variation of the
τ2 dihedral angle, calculated using the B3LYP functional without a dispersion correction, differs from the shape of the profiles obtained using functionals with a dispersion correction. These differences are within the
τ2 region corresponding to the conformational transition (60°–140°). Thus, accounting for the dispersion correction somewhat changes the relative energies and, hence, reverses the conformer stability ranking within the Ia–Ib and IIa–IIb pairs. Therefore, for further analysis we analyzed only the results obtained using the B3LYP–GD3/6–311++g(2d,p) and APFD/6–311++g(2d,p) functionals.
The results presented above show that the main structural difference between the group of conformers Ia–Ib and IIa–IIb is in the carboxylic group orientation relative to the N–H group proton. The same division of the MA conformers into two groups was proposed in [
42], but the authors also took into account the two conformers, formed upon the rotation around bond “
4” and characterized by higher energy. These conformers were assigned to the first group. The transition between these two conformer groups occurs when the dihedral angle
τ1 changes by ~180°. For these conformers, we applied the NBO analysis to calculate the orbital stabilization energy (
E2) of the electron pair acceptor (antibonding orbital BD*(N–H))
, charge transfer (
q) from the bonding orbital (LP(O)) to the antibonding orbital (BD*(N–H)). Using QTAIM analysis we calculated the electronic density (
ρ) at the bond path critical point (3, −1), and the bond potential energy (½
V). These calculations were performed for the interactions between the carbonyl oxygen and the proton of the N–H group (N–H…O=C) in conformers Ia and Ib, and between the N–H group proton and the hydroxyl oxygen (N–H…O
H–C) in conformers IIa and IIb (see
Table 3). According to the obtained results, the rotation related to variations in the
τ1 dihedral angle leads to the breakage of the strong intramolecular N–H…O=C hydrogen bond in conformers Ia and Ib, and to the formation of a weaker H-bond between the N–H group proton and the hydroxyl oxygen (N–H…O
H–C) in conformers IIa and IIb.
As has been shown in our previous work [
12], the value of ½
V is in good correlation with
ρ, and this was also shown in [
43,
44] for the case of strong and medium strength hydrogen bonds. However, the
E2 value demonstrates a much worse correlation [
12,
43]. Moreover, as one can see from
Table 3 for conformer Ia, the NBO analysis with the APFD functional gives overestimated values of
E2 and
q, as compared to those obtained using the B3LYP–GD3 functional. Therefore, in the present work we also used ½
V as the energy measure of hydrogen bonding, as Espinosa et al. suggested [
35]. For conformers Ia and Ib, the values of ½
V lie in the range from –33.86 to –36.51 kJ·mol
−1 (for the B3LYP–GD3 functional) and from –38.56 to –41.65 kJ·mol
−1 (for the APFD functional). These values correspond to the energy of strong hydrogen bonds. Along with that, for these two functionals, these values for conformers IIa and IIb lie in the range from –28.13 to –29.85 kJ·mol
−1 and from −29.97 to −31.97 kJ·mol
−1, respectively. These values correspond to the threshold of strong hydrogen bonds and are in good agreement with the value
q, which is close to 0.01 and is also close to the threshold of strong hydrogen bonds, according to Weinhold [
31].
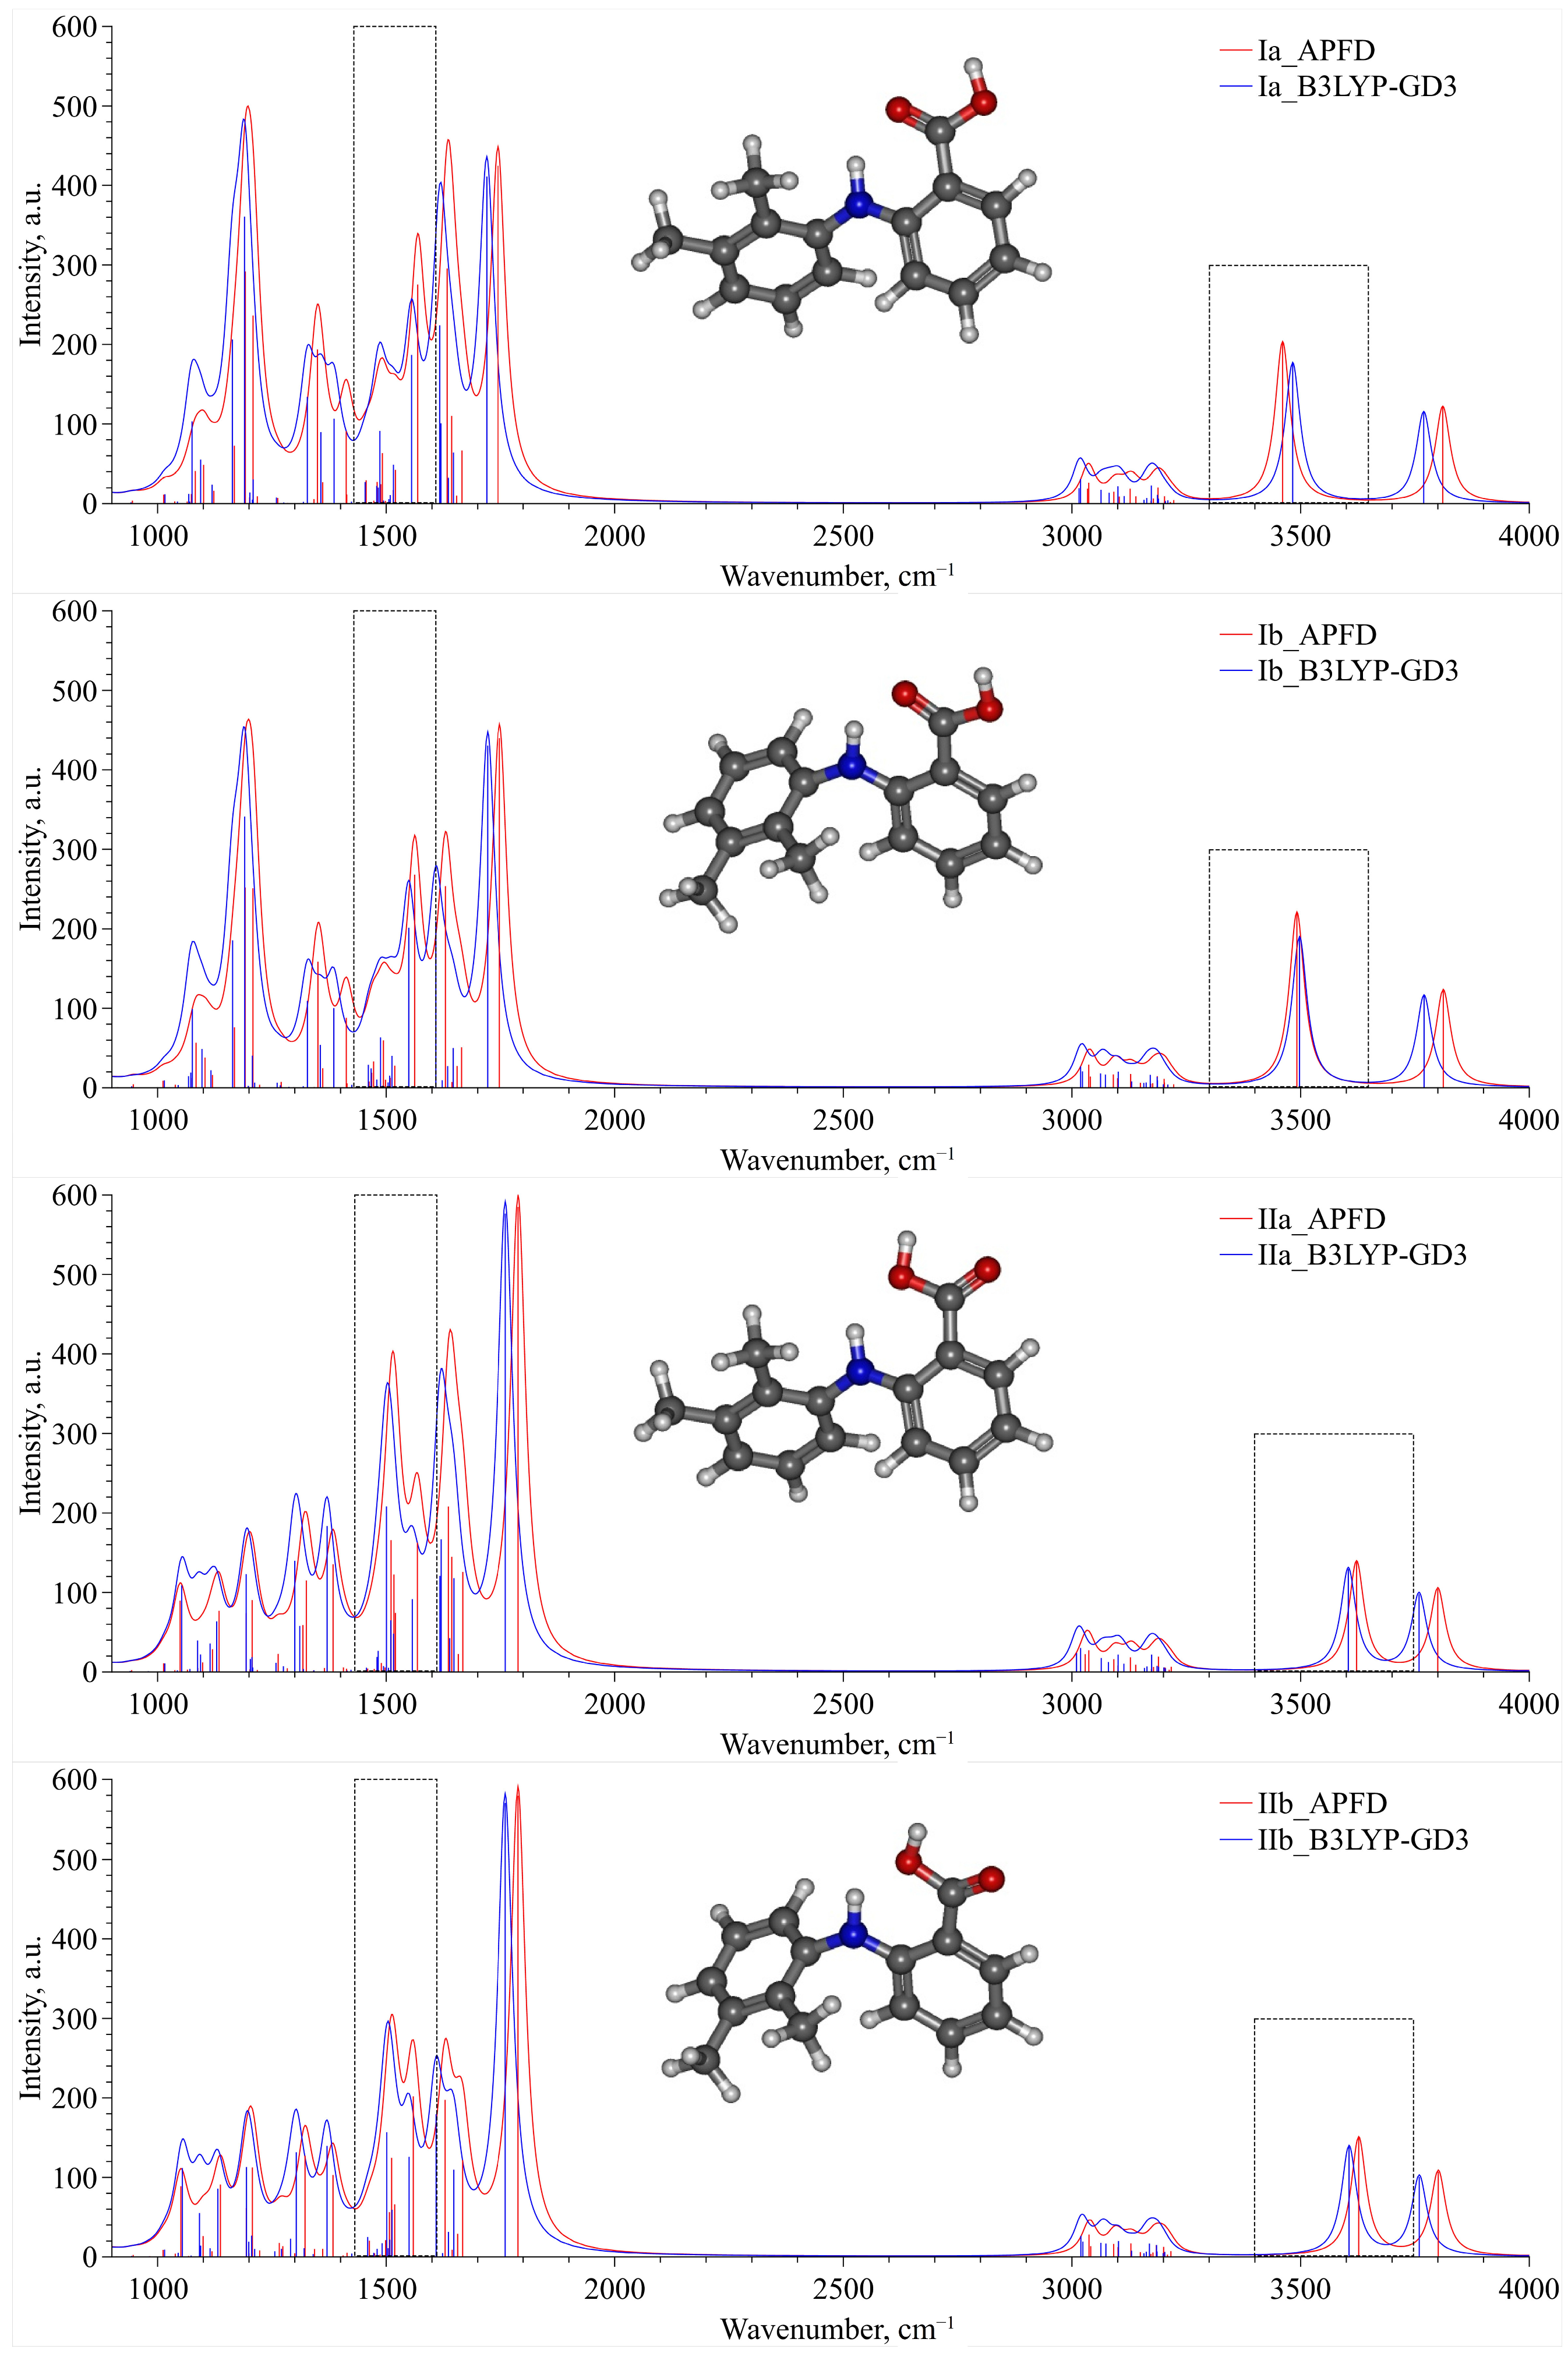
For two groups of conformers—Ia, Ib and IIa, IIb—we calculated a set of IR vibration frequencies, presented in
Figure 5, within QCC using B3LYP–GD3 and APFD functionals. The presented spectra for each conformer, which were calculated using these two functionals, are in good qualitative agreement and can be used to analyze the experimental IR spectra. For convenience of presentation, each vibration frequency was described by a Lorentzian profile with the same dispersion. An analysis of this set of spectra allowed us to select two spectral domains lying in the wavenumber ranges of 1430–1610 cm
−1 and 3300–3750 cm
−1. These domains are bounded by dashed-line rectangles in
Figure 5 and can be chosen as analytical ones when analyzing the experimental IR spectra. In the first domain (1430–1610 cm
–1), the high-frequency contribution is associated only with the N–H group rocking vibration, whereas the low-frequency one contains several vibrational bands that are mainly related to the complex vibrations of the MA molecule aromatic system. The second wavenumber range (3300–3750 cm
−1) contains only one spectral contribution related to the stretching vibration of the N–H functional group of the MA molecule.
The choice of these spectral domains as analytical ones was prompted by the fact that changing the MA conformations induces a direct change in the N–H vibrations because the amino-group is directly involved in the formation of an intramolecular hydrogen bond with the carbonyl or hydroxyl oxygen of the carboxylic fragment, depending on the orientation of the latter. Consequently, the change in the parameters of these H-bonds induced by the conformational transition directly affects the vibration parameters of the N–H group. On the other hand, the conformational transition can also indirectly influence the aromatic system vibration through electronic density redistribution. It occurs owing to its close positions to the MA functional groups (in particular, C=O, N–H, and O–H) that are sensitive to the conformation changes. Therefore, the appearance of a new spectral contribution in the considered domains, for instance, at a temperature increase, can be a signature of the new MA conformer emergence. In our recent works [
6,
7,
8] we also showed the advantage of using the spectral domain associated with the aromatic system vibrations for screening conformational transitions of pharmaceutical molecules in the scCO
2 phase.
Moreover, in our work [
8] we demonstrated another reason for using the N–H stretching vibration mode as an analytical one. It is associated with the conformational type of MA polymorphism and with the difference in the N–H stretching band position for various MA polymorphs. The authors of [
18,
19] also showed that the transition from polymorph I to polymorph II shifts the position of this band from 3312 cm
−1 to 3353 cm
−1 and this shift can be considered a classical indicator of this polymorphic transition. Such changes indicate weakening of the intramolecular hydrogen bond, the formation of which involves the amino-group proton.
Additionally, analyzing the spectra presented in
Figure 5 in the chosen analytical spectral domains, we can clearly divide conformers Ia, Ib, IIa and IIb into two groups. For the second group (IIa–IIb), the N–H stretching band is blue-shifted compared to that for the first one (Ia–Ib). On the contrary, in the spectral domain related to the N–H rocking vibration, the corresponding spectral band for the second group is slightly red-shifted relative to that for the first group. Finally, the complex spectral band for the second group, which is associated with the MA aromatic system vibration, is blue-shifted compared to that for the first group. Thus, this division of the conformers into two groups is in perfect agreement with the classification based on energetic and structural criteria presented above.
Finally, taking into account the probable dimerization of MA molecules in the solution, which involves the carbonyl oxygen and the hydroxyl group proton, we calculated the frequencies of the stretching vibration band of the C=O group for the dimers of conformers Ia and IIa. As this group is directly involved in the intermolecular H-bonding (see, e.g., [
14,
15]), these data allow us to determine the probability of dimer formation in the solution, based on the analysis of the ν(C=O) spectral band. Using the B3LYP–GD3 functional we found that this spectral band is centered at 1683 cm
–1 for conformer Ia and at 1698 cm
–1 for conformer IIa. According to
Figure 5, their positions for monomeric conformers Ia and IIa are 1719 cm
−1 and 1760 cm
−1, respectively (such difference is related to the absence of the intramolecular H-bond, which involves the C=O group for conformer IIa). Thus, in the case of dimerization in the solution, where there is an equilibrium of two conformers, along with two ν(C=O) spectral contributions related to conformers Ia and IIa, in the experimental spectrum one can expect the appearance of at least one new spectral contribution red-shifted in relation to the spectral component of conformer Ia.
3.3. Conformational Analysis IR Spectroscopy
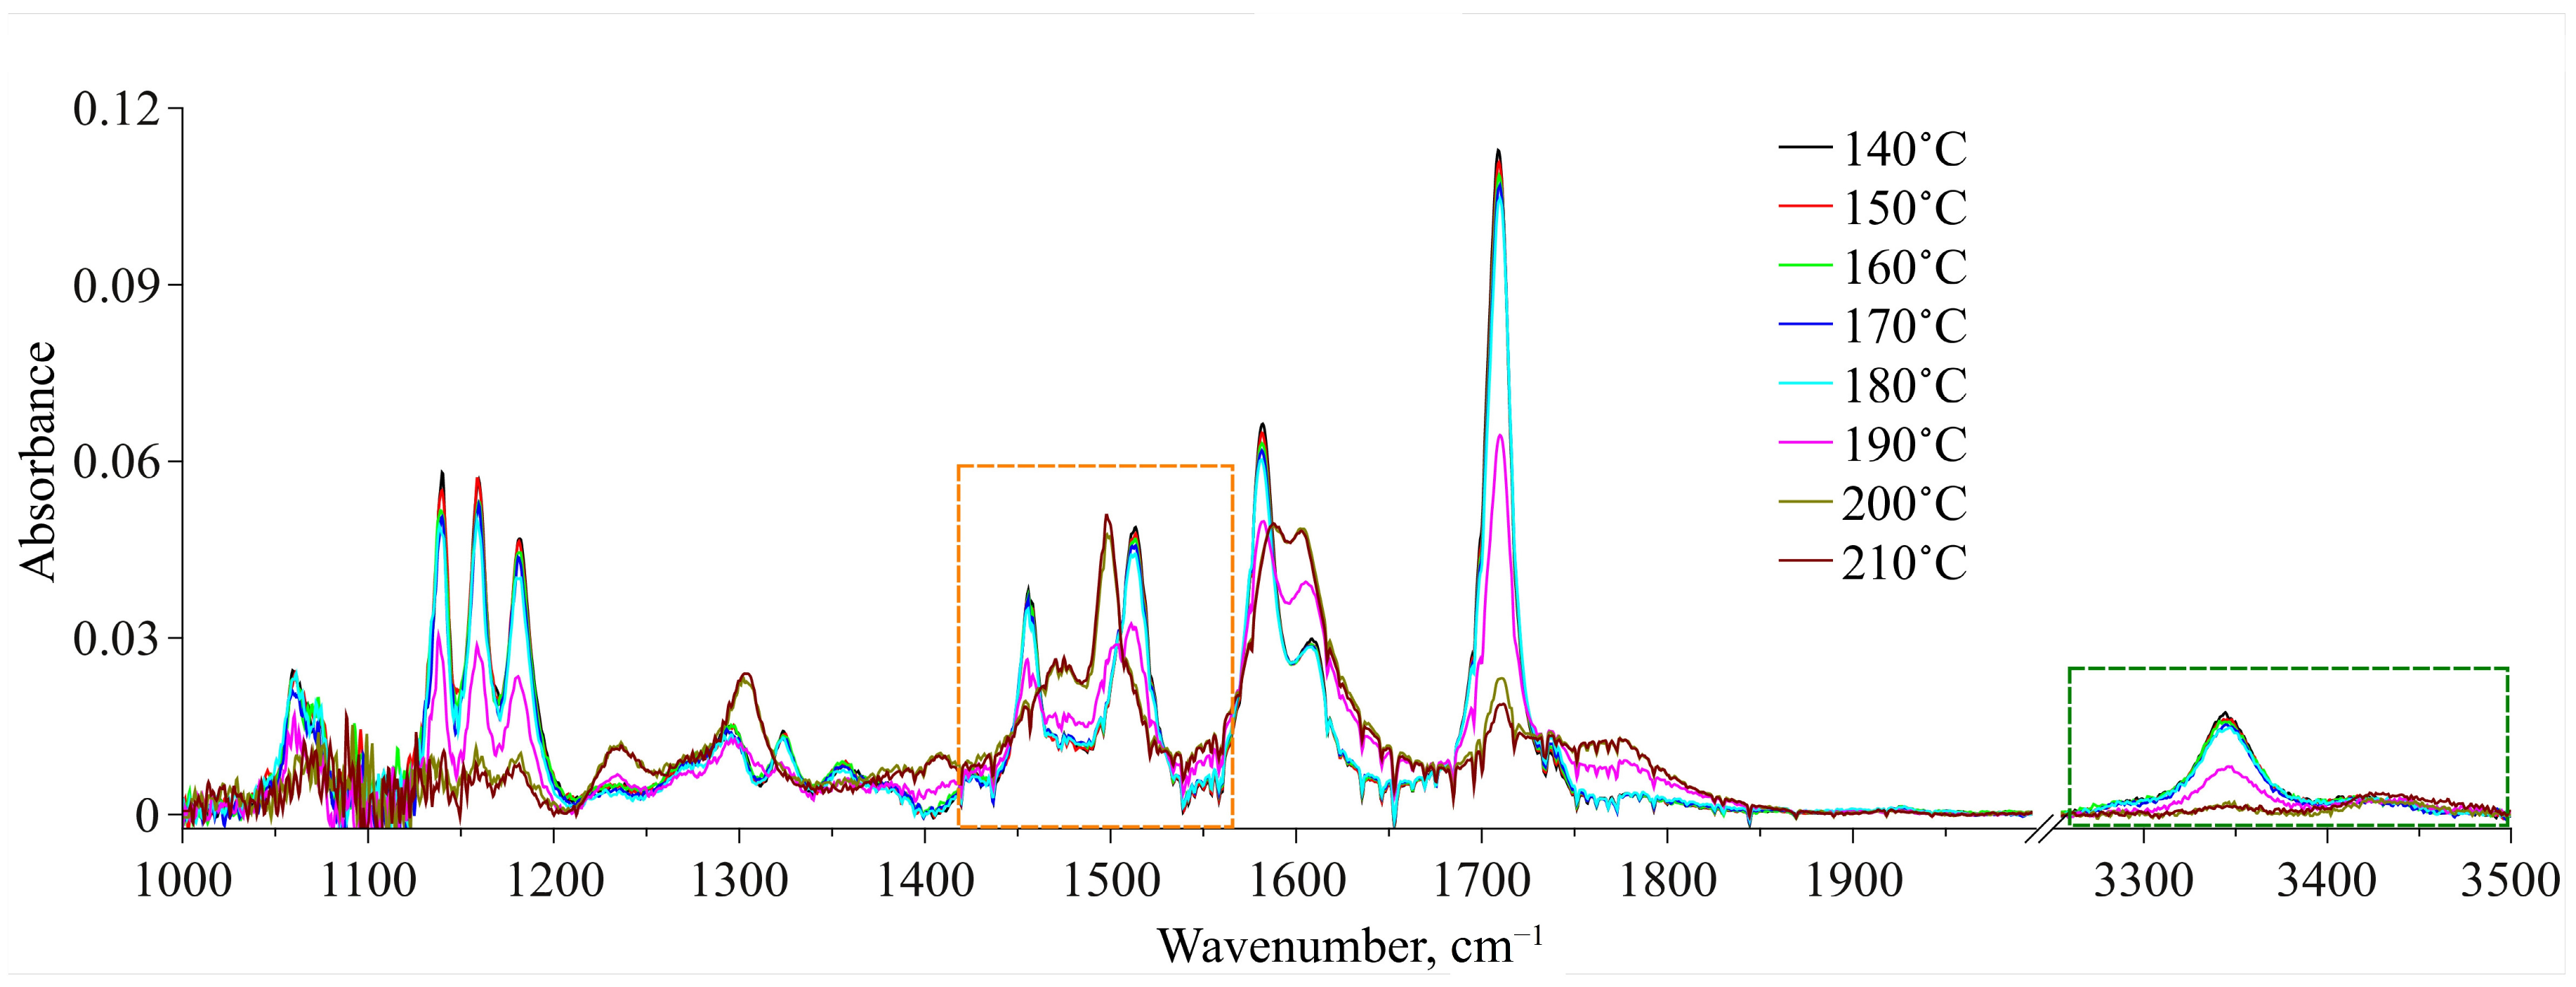
The obtained IR spectra of MA dissolved in scCO
2 in the temperature range of 140–210 °C along the 1.1
ρcr.(CO
2) isochore are presented in
Figure 8 for two spectral domains—1000–2000 cm
−1 and 3250–3500 cm
−1. For each temperature we showed an equilibrium spectrum at the target temperature (see the experimental details in
Section 2.2.3). First, an analysis of the ν(C=O) spectral band allowed us to exclude the dimerization of the molecules of MA in its solution in scCO
2 over the whole temperature range studied. Indeed, according to QCC data, we could expect the emergence of a low-frequency spectral band shifted by 21–36 cm
−1 in relation to that of conformer Ia centered at 1709 cm
−1 (see
Figure 8). However, as it can be seen from this figure, such spectral band is not observed, whereas the spectral band related to conformer Ia remains almost symmetric up to 190 °C. This was also shown in our previous work [
8], where we studied a saturated MA solution in scCO
2, where the MA concentration was a lot higher. Moreover, the abrupt redistribution of the ν(C=O) spectral bands intensities, related to conformers Ia and IIa, in the temperature range of 180–200 °C corresponds to the conformational transition. In contrast, for thermal destruction of intermolecular H-bonds we can expect a gradual redistribution of these band intensities, as has been shown for liquid water in one of our works [
45].
Relying on the quantum chemical calculations and MD simulation results, we chose two spectral domains, which will be analyzed below. These areas are bounded by dashed-line rectangles in
Figure 8. A qualitative analysis of the spectral changes in the wavenumber range of 3250–3500 cm
−1, which is related to the N–H stretching vibrations, showed that in the temperature interval of 140–190 °C, there are two spectral contributions centered at 3344 cm
−1 and 3430 cm
−1. According to our QCC, the first one, which is dominant, can be assigned to MA Conf. I. Consequently, the second one, which has much lower intensity, can be assigned to MA Conf. II. Then, starting from 190 °C the intensity of the low-frequency component considerably decreases. Along with this, the intensity of the high-frequency component becomes higher. Finally, in the temperature range of 200–210 °C it becomes dominant. However, because the MA concentration in the CO
2 phase is low and, consequently, the intensities of these two spectral contributions (as well as the signal-to-noise ratio) over the whole temperature range are low too, it is not rational to use this spectral domain for the quantitative analysis of the conformational equilibrium. Nevertheless, the general trend of the spectral changes is in good agreement with that of the changes in the spectral domain related to the C=O stretching vibrations (see above), as well as with the results of our previous work, where we studied the conformational equilibrium of MA molecules in the scCO
2 phase contacting with solid MA.
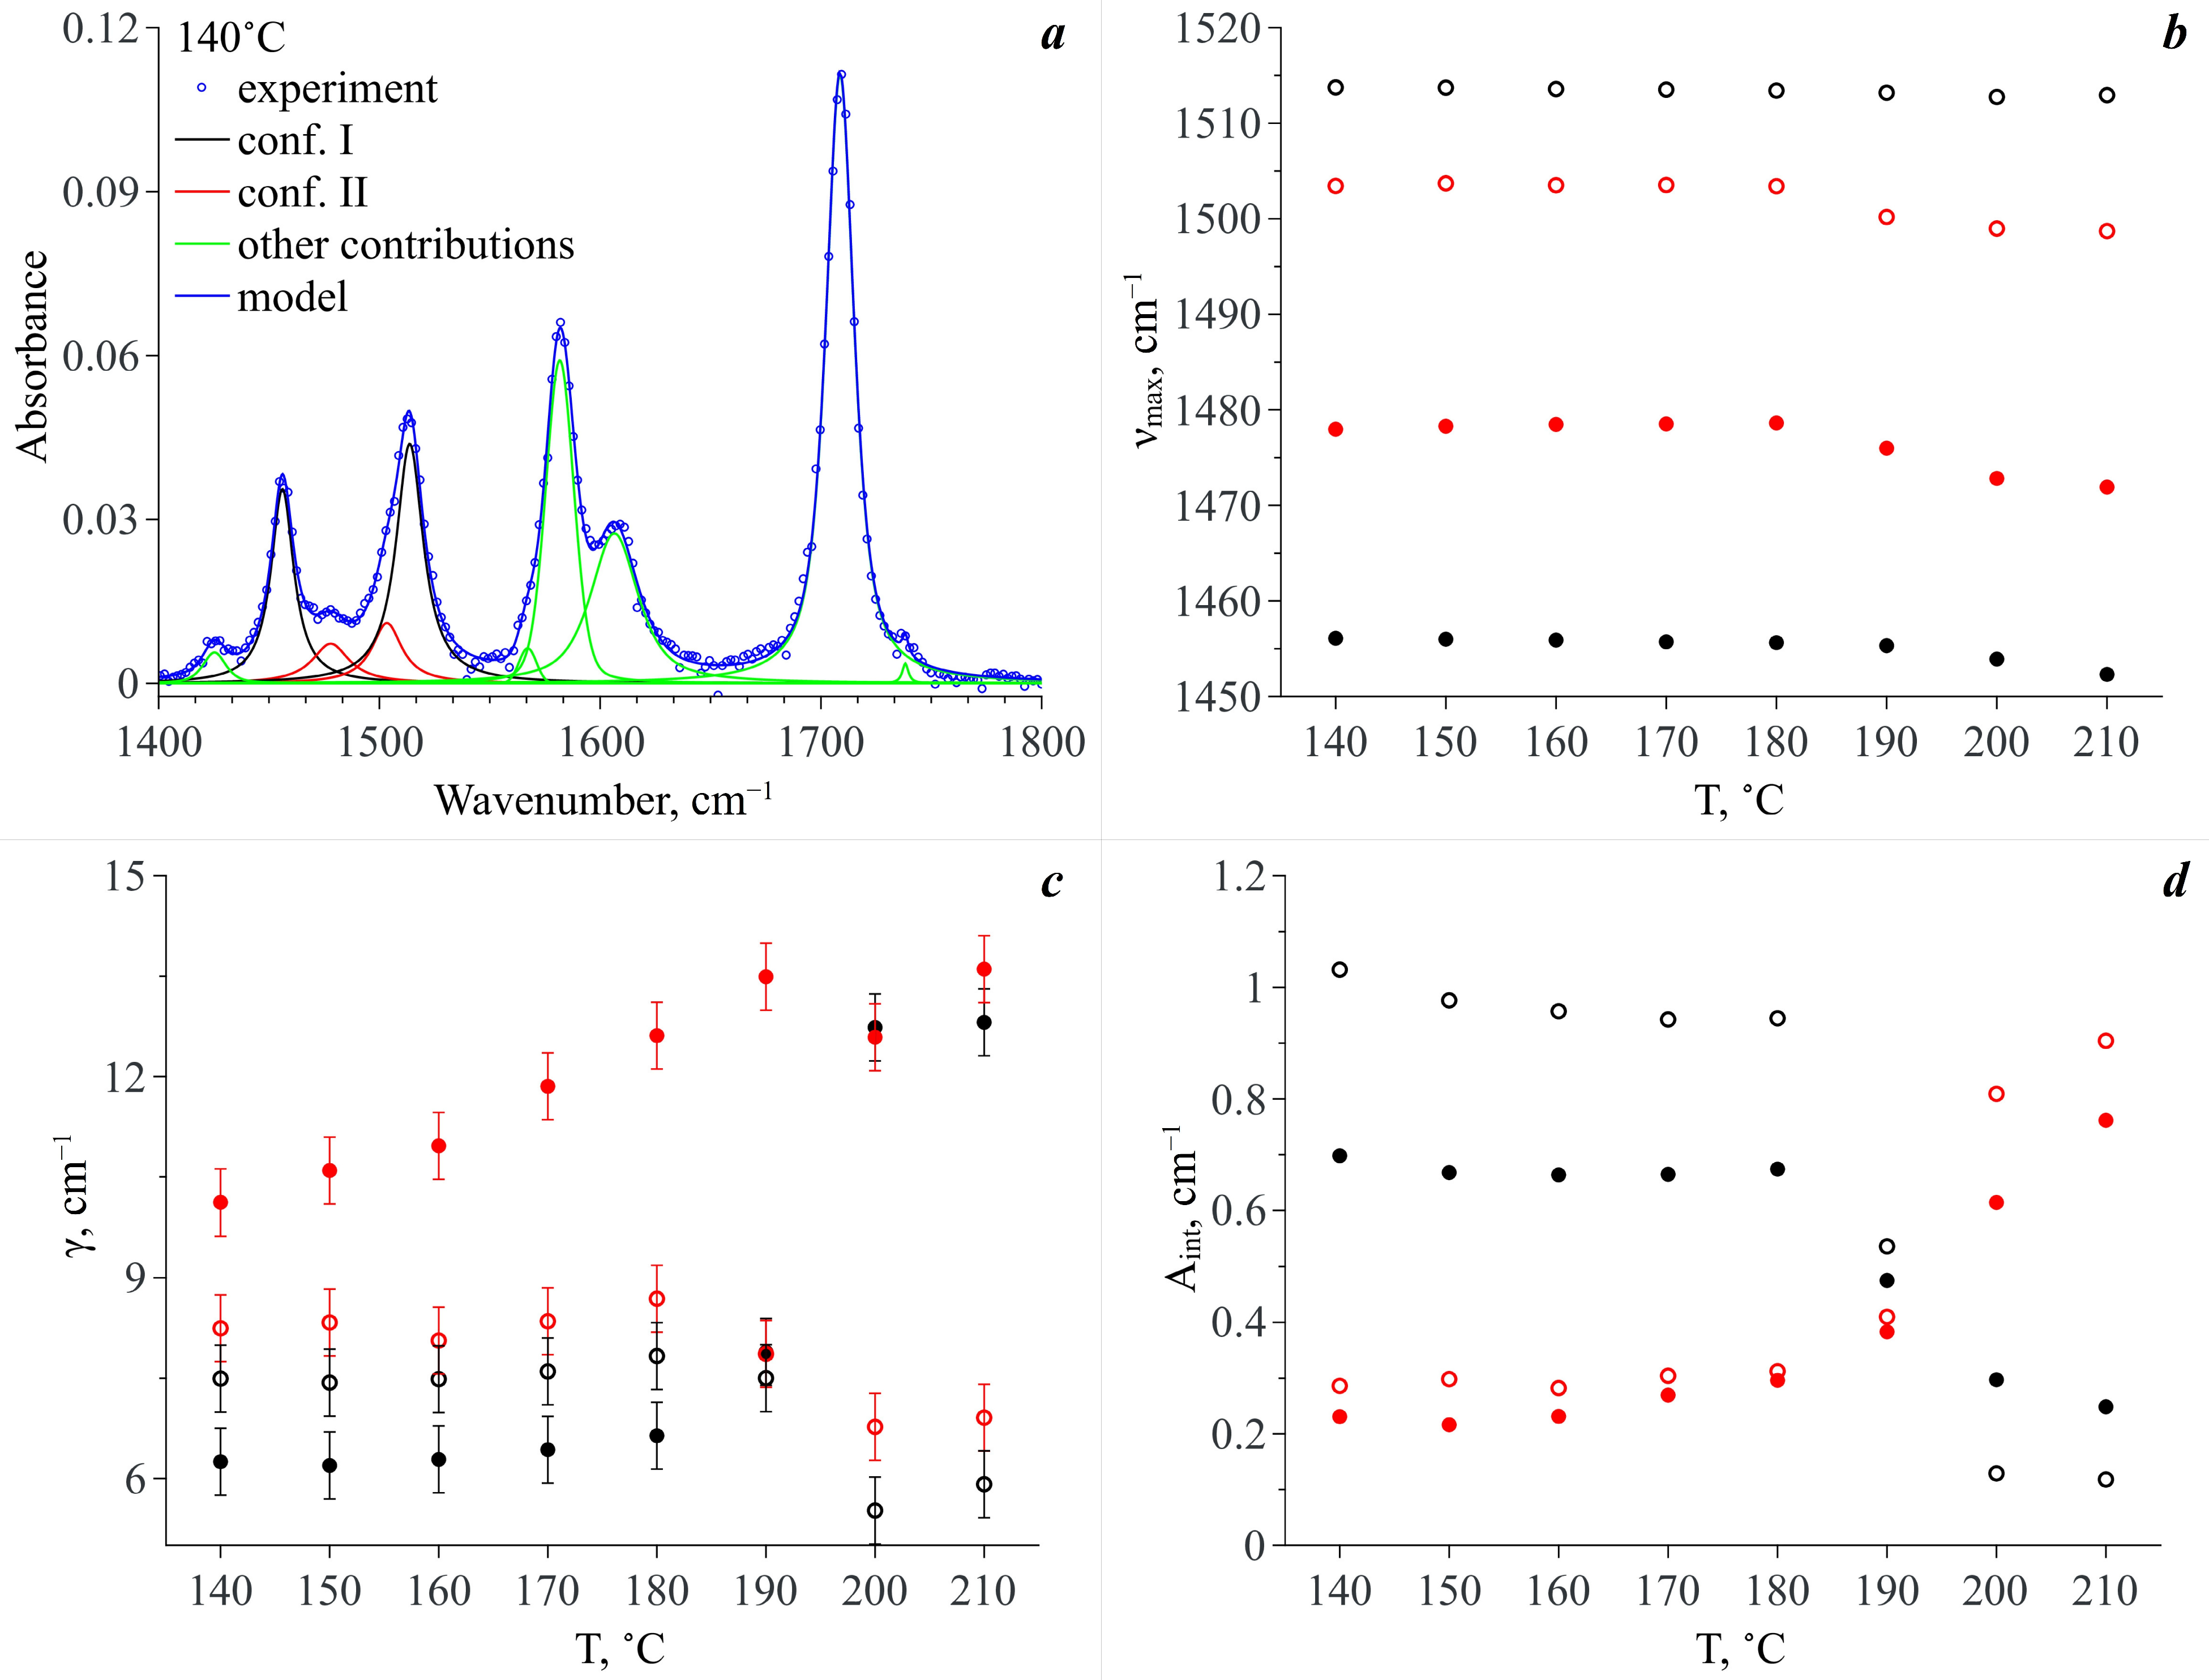
Thus, for quantitative analysis of the experimental IR spectra we took the wavenumber range of 1420–1560 cm
−1. We used the standard procedure of spectral band deconvolution into spectral components. According to our QCC, to reproduce the analytical spectral domain we applied a model that included two spectral contributions for each of the two MA conformers (see
Figure 9a). For each of the conformers, the high-frequency contribution is related to the N–H rocking vibration and the low-frequency one is associated with the complex vibrations of the MA molecule aromatic system. Within our model, we used Lorentzian profiles to approximate the spectral contributions. This choice was prompted by the fact that MA molecules exist in the CO
2 phase as monomers and the probability of the formation of hydrogen bonds between them is extremely low due to a very low concentration (~10
−4 mole fractions). Along with that, to improve the approximation quality and to properly reproduce the experimental spectra within this spectral domain, we also introduced additional spectral profiles necessary to fit the spectral bands neighboring the analytical ones (see
Figure 9a). We used Pseudo-Voigt profiles for their approximation. To realize the fitting procedure, we applied “Fityk” freeware [
46] that includes a spectrum fitting tool.
Figure 9a shows, as an example, a typical deconvolution of an experimental spectrum in the wavenumber range of 1400–1800 cm
−1 including the analytical spectral domain of 1420–1560 cm
−1 for the temperature of 140 °C. The quality of deconvolution and reproducibility of the experimental spectra in the wavenumber range corresponding to the analytical spectral domain for some of the studied temperatures are demonstrated in the
Supplementary Materials (Figure S2).
As a result of the spectra deconvolution, we obtained a set of parameters for each spectral component constituting the analytical spectral domain.
Figure 9b–d show the temperature dependences of peak positions (ν
max), dispersions of peaks or its half width at half height (γ) and integral intensity (A
int), respectively. As one can see from
Figure 9b, the temperature increase does not lead to a strong shift in the maximum positions of these spectral profiles. Even the maximum shift value does not exceed 6 cm
–1, which can be linked only to the thermal fluctuation of vibration frequencies. However, the temperature dependencies of dispersions of these spectral profiles behave differently (see
Figure 9c). Indeed, the dispersions of the spectral bands, which are attributed to the vibration of the aromatic system of Conf. I and Conf. II, considerably increase upon heating, whereas the dispersions of the spectral bands assigned to the N–H rocking vibration slightly decrease. Moreover, major changes take place in the temperature range of 190–200 °C. It is only in the case of the spectral profile attributed to the complex vibrations of the aromatic system of Conf. II that the major dispersion change takes place in the temperature range of 140–190 °C. Then this value remains almost constant.
The temperature dependencies of the integral intensities of the spectral components lying in the analytical spectral domain show the opposite behavior for conformers I and II (see
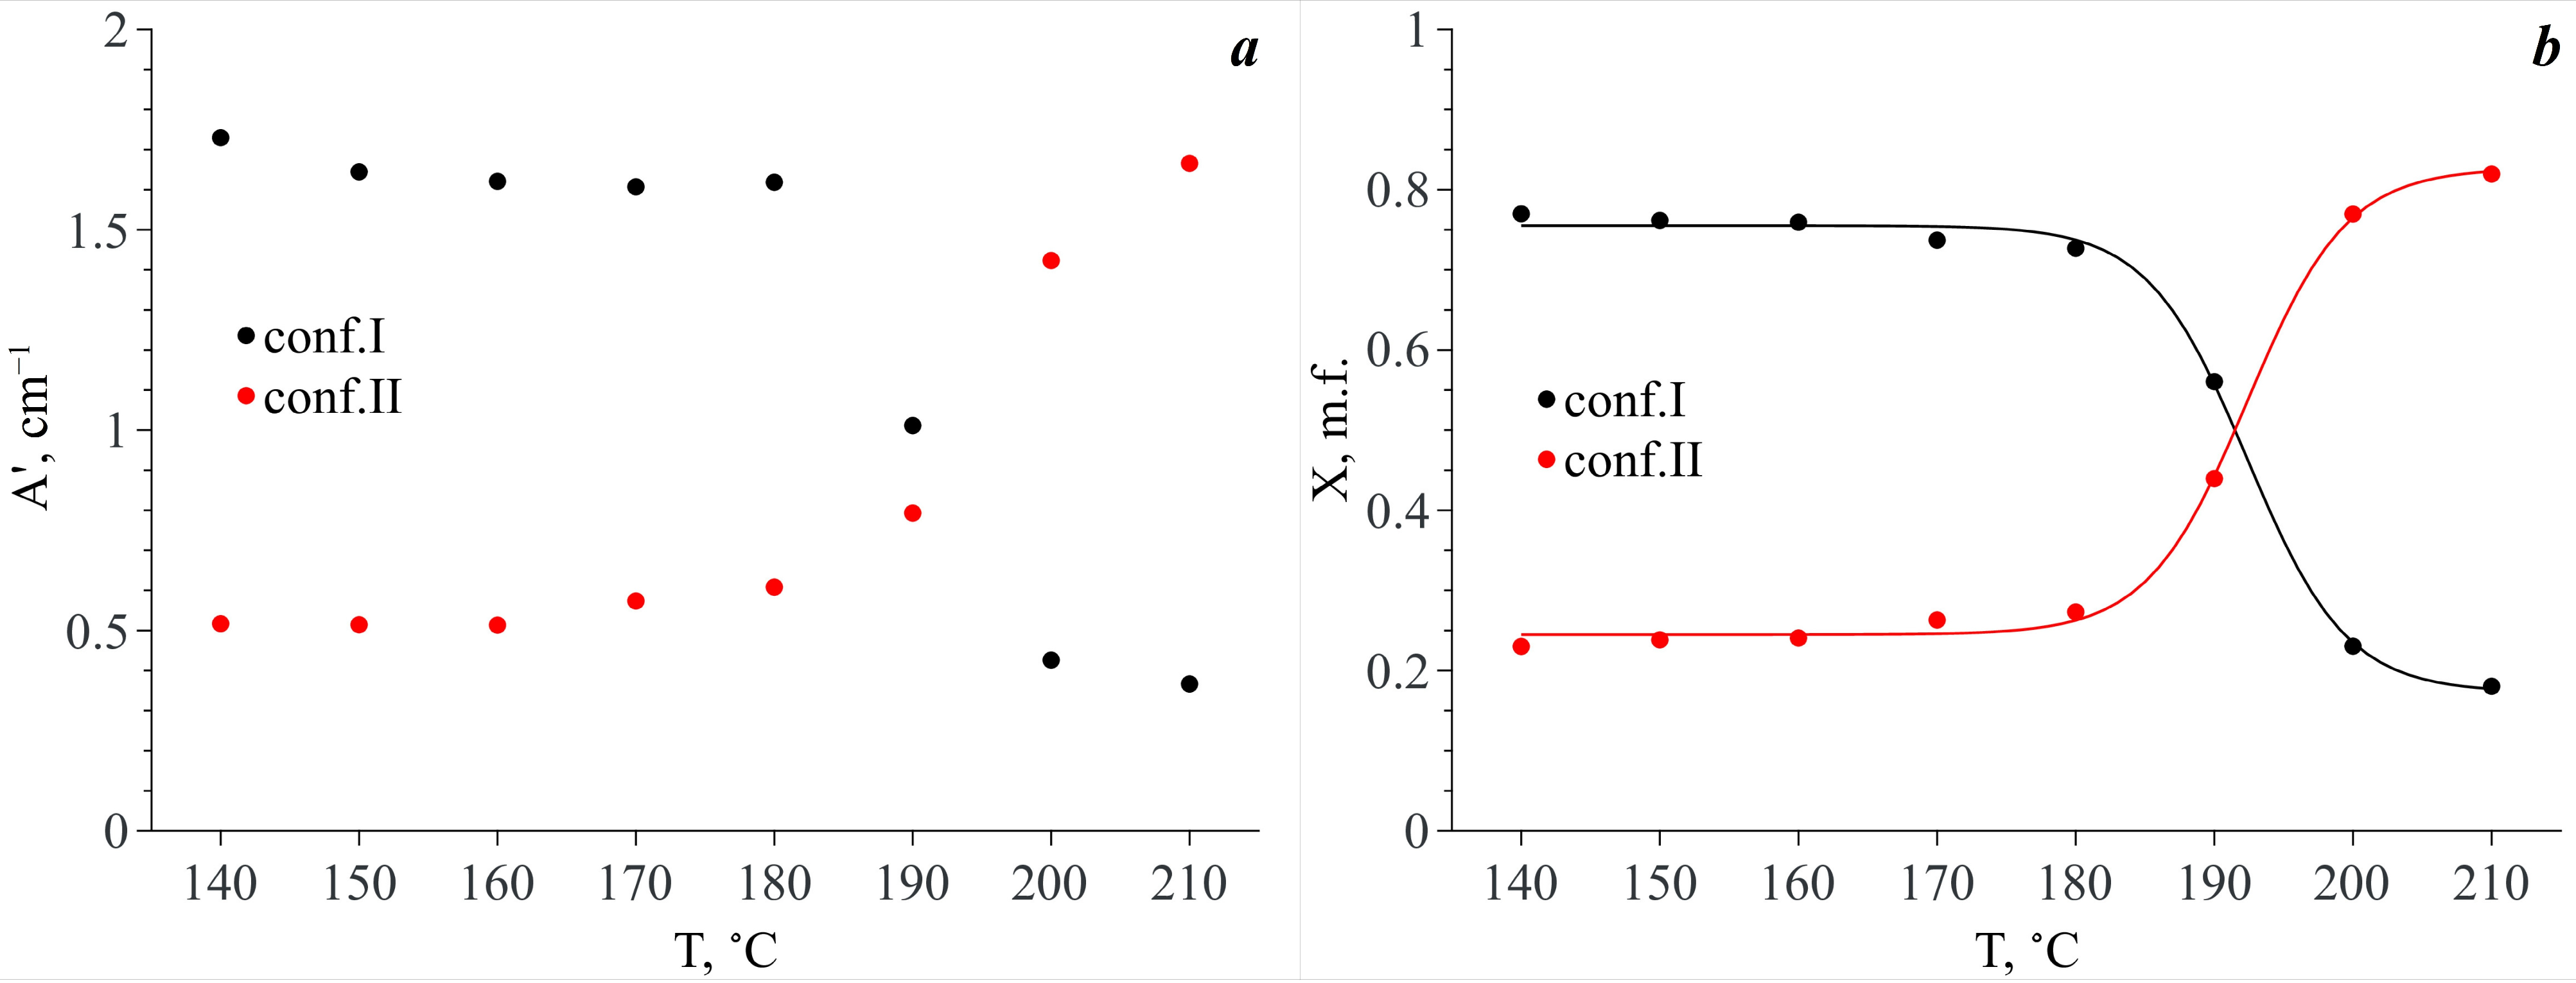
Figure 9d). Taking into account that each of the conformers is responsible for two spectral contributions to the analytical spectral domain (see above) and assuming that the extinction coefficients of these bands are similar, we summed the integral intensities of these spectral components related to each conformer by pairs. The temperature dependencies of the obtained values (A′) are presented in
Figure 10a. It is obvious that in the temperature range of 140–180 °C, the A′ value of the spectral components related to Conf. I is dominant. Along with this, the A′ values for both Conf. I and Conf. II remain almost constant. In the temperature range from 180 °C to 200 °C, abrupt redistribution of the A′ values for Conf. I and Conf. II is observed. The same behavior is also observed for the N–H and C=O stretching vibration bands. Finally, the A′ value that is related to Conf. II becomes dominant.
Based on the temperature dependences of A′ for the two conformers, we calculated their mole fractions (X
i) in scCO
2 vs. temperature as
. The X
i(
T) dependencies are presented in
Figure 10b. As one can see from this figure, in the temperature range of 140–180 °C both MA conformers exist in scCO
2, and Conf. I prevails (76–73% depending on temperature). In the temperature range of 180–200 °C abrupt redistribution of these conformer mole fractions is observed. In addition, finally, in the temperature range of 200–210 °C, Conf. II prevails (77–82%). Thus, we do not observe a total conformational transition of the MA molecules in scCO
2. However, in our previous work [
8], we showed that in the case of a heterogeneous MA–scCO
2 binary mixture, which has an excess of the MA crystalline phase, at temperatures below 160 °C, the content of Conf. II in scCO
2 is negligible and is associated with the presence of a small amount of MA polymorph II in the initial MA crystalline phase. Moreover, the total conformational transition of the MA molecules occurs in the scCO
2 phase already in the temperature range of 180–190 °C leading to the disappearance of Conf. I.
We observed a similar phenomenon in a series of our previous works, in which we studied the conformational equilibria of pharmaceuticals in the scCO
2 phase contacting with an excessive amount of these drugs. In the case when the scCO
2 phase is in contact with the drug crystalline phase [
6,
8,
11], the full conformational transition of pharmaceutical molecules occurring in the scCO
2 phase is related to the polymorphic transition in the crystalline drug phase induced by the temperature increase. On the contrary, when the scCO
2 phase is in contact with the drug that is in the amorphous state [
7,
12], in the scCO
2 phase, the temperature does not lead to a full conformational transition of the pharmaceutical molecules. Thus, when solid drugs are in contact with the scCO
2 phase, their polymorphs determine the conformational equilibrium of the molecules of those drugs in the scCO
2 phase. However, when pharmaceuticals, which are in contact with the scCO
2 phase, are amorphous, a thermodynamic conformational equilibrium of drug molecules is realized in the solution. Similar behavior was observed in the present work for an unsaturated MA solution in scCO
2, where the conformational equilibrium of MA molecules is determined only by the thermodynamic state of the system.


