4.1. Friction Characteristics in the CMP Process
The aim of the CMP process is to obtain the global planarization/polishing of the surfaces of the wafers (here covered with a selective layer), in which mechanical and chemical interactions are combined to achieve an efficient MRR. Mechanical interactions are manifested by Ff and frictional heat in the CMP process. By introducing SiO2 as an abrasive in the selective-layer CMP slurry, both Ff and MRR increase, and the calculated WNU is correlated with the COF. Additionally, the Ff allows the calculation of the Ef to facilitate the representation of mechanical action/abrasion during the CMP process.
Thus,
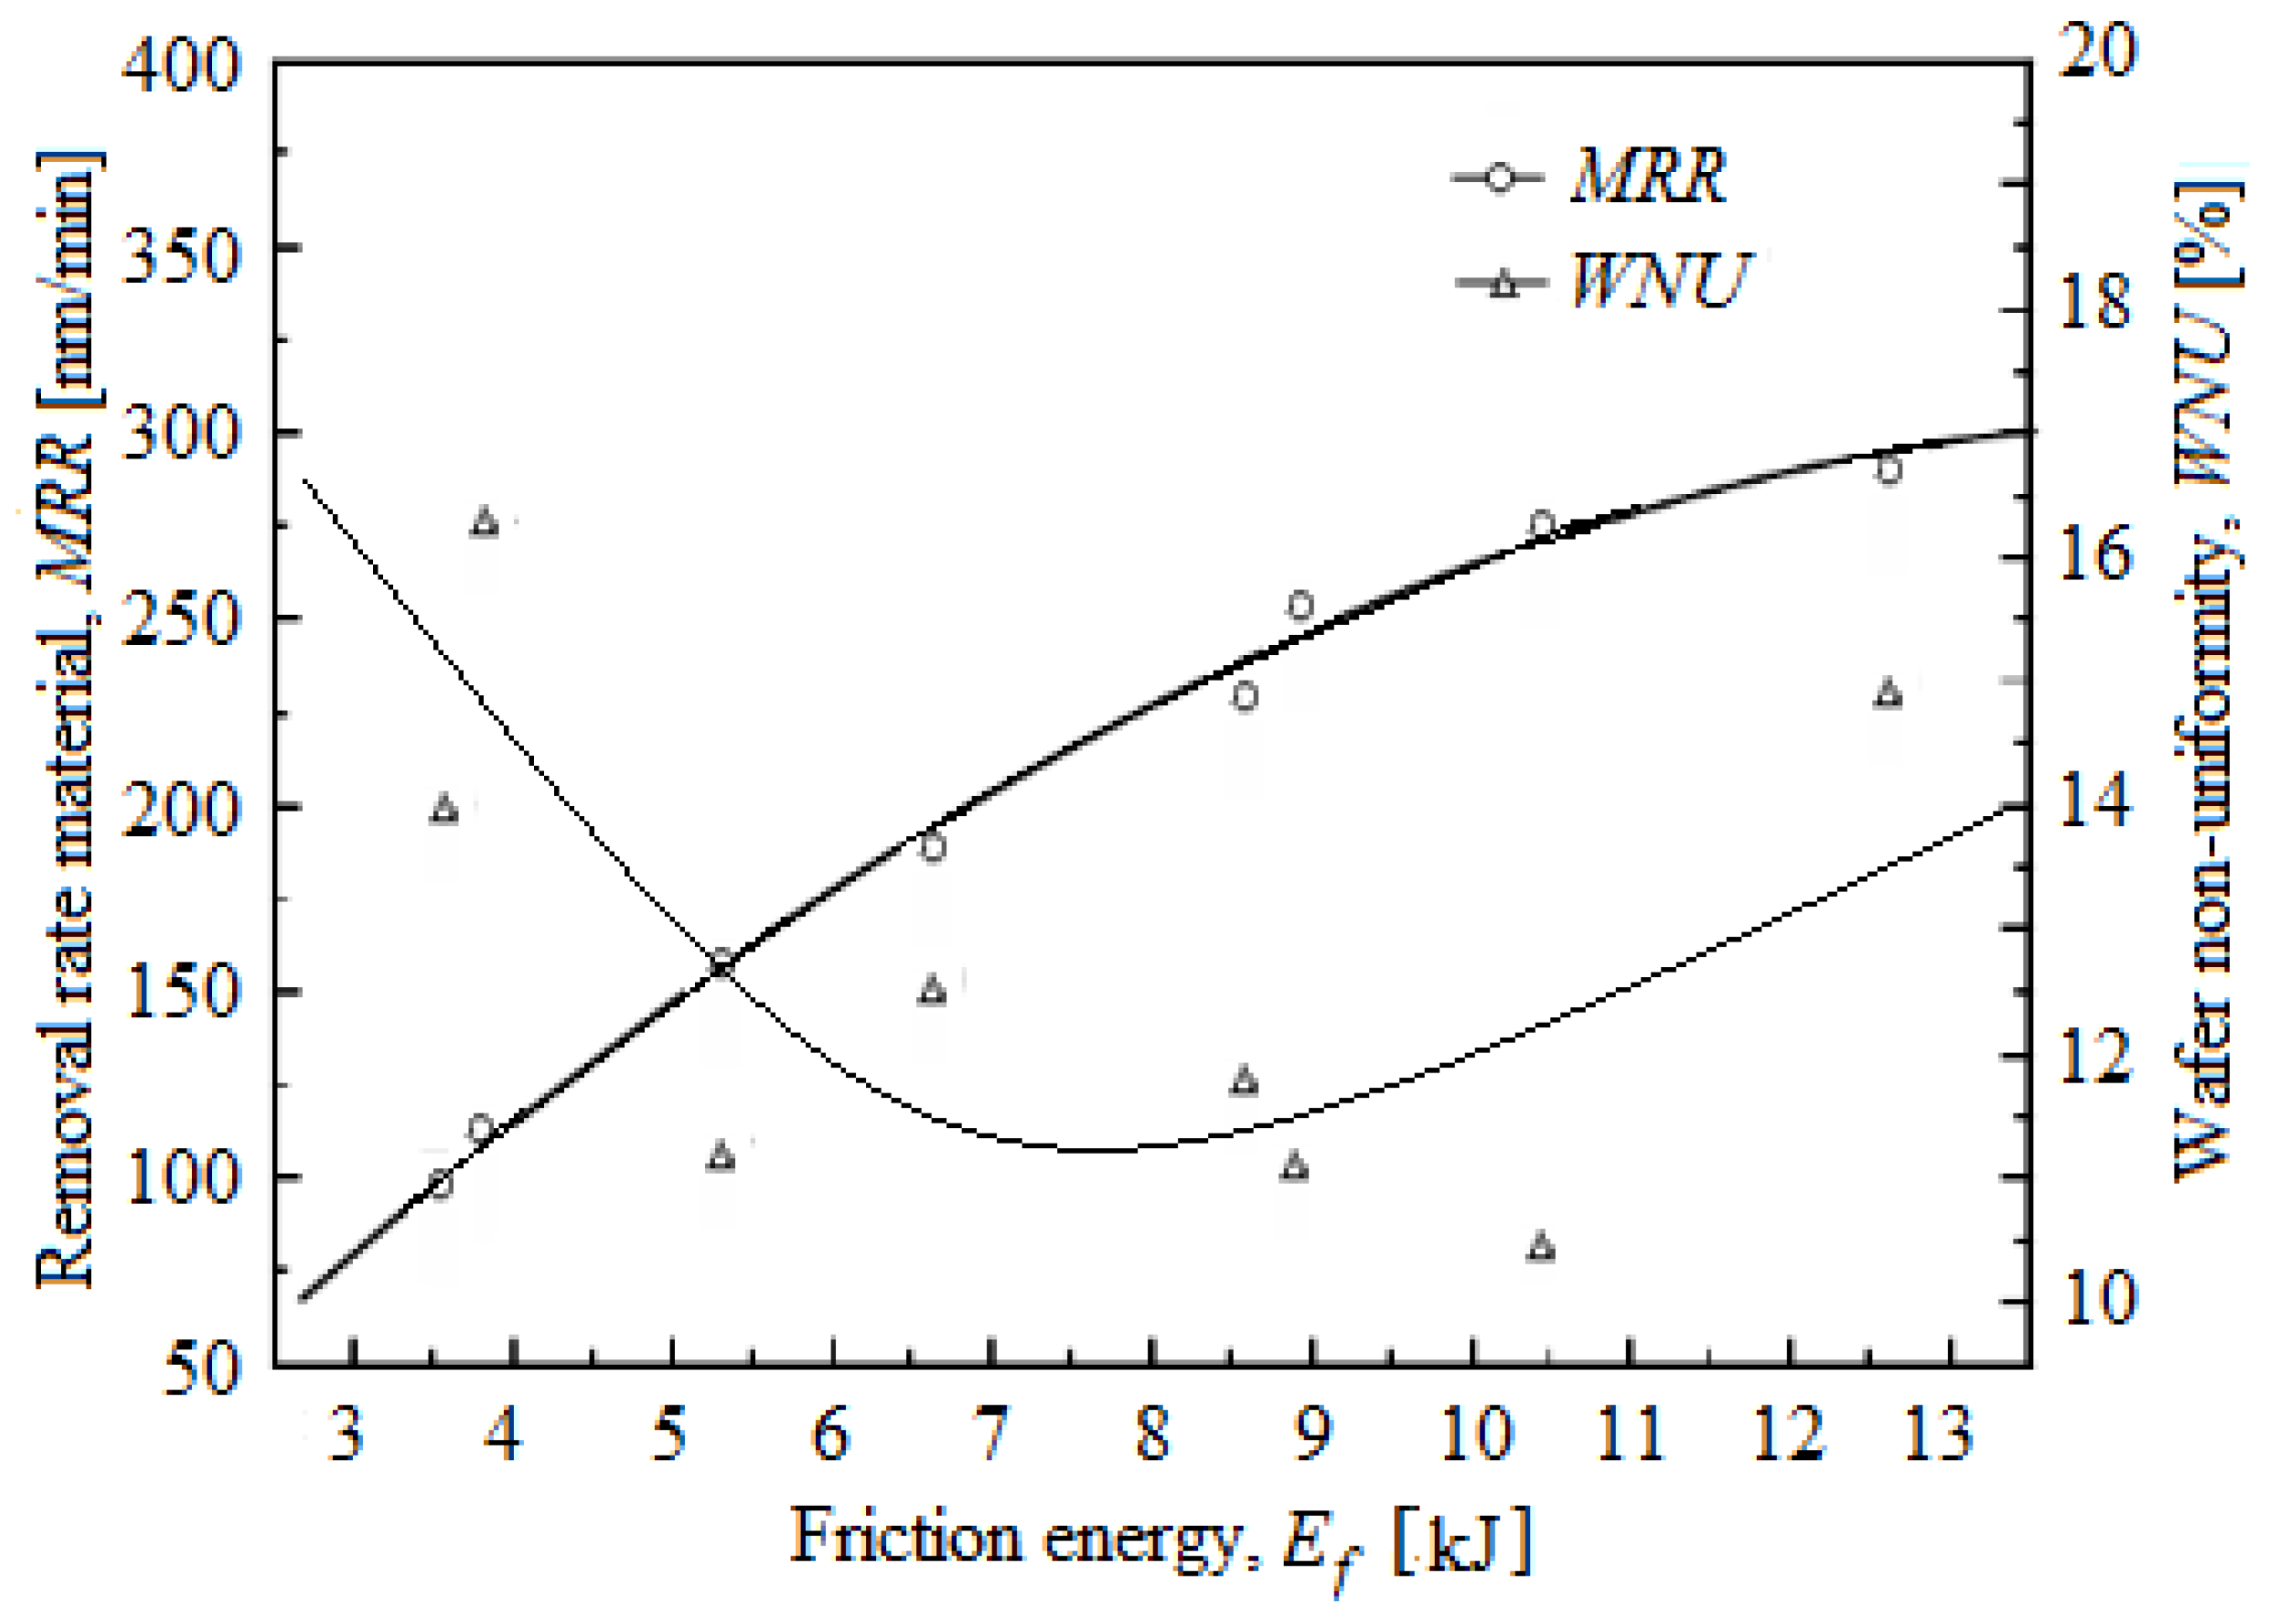
Figure 1 shows the variation of
MRR and
WNU depending on
Ef. As shown in
Figure 1,
Ef is related in particular to the
MRR, not to the
WNU. It is observed as
MRR increases with the increasing
Ef. In the CMP process of the oxides, the input energy caused by the relative speed, the chemicals, and of contact is composed of energy,
Ef, thermal,
Et, and vibration,
Ev. Among these components of energy,
Ef and
Et participate at the
MRR, and
Ev is dispersed in the surrounding environment [
15,
16]. According to
Figure 1, the
MRR is dependent on the
Ef in the CMP process; however, the
MRR is related to
Ff through the quantity removed per unit length.
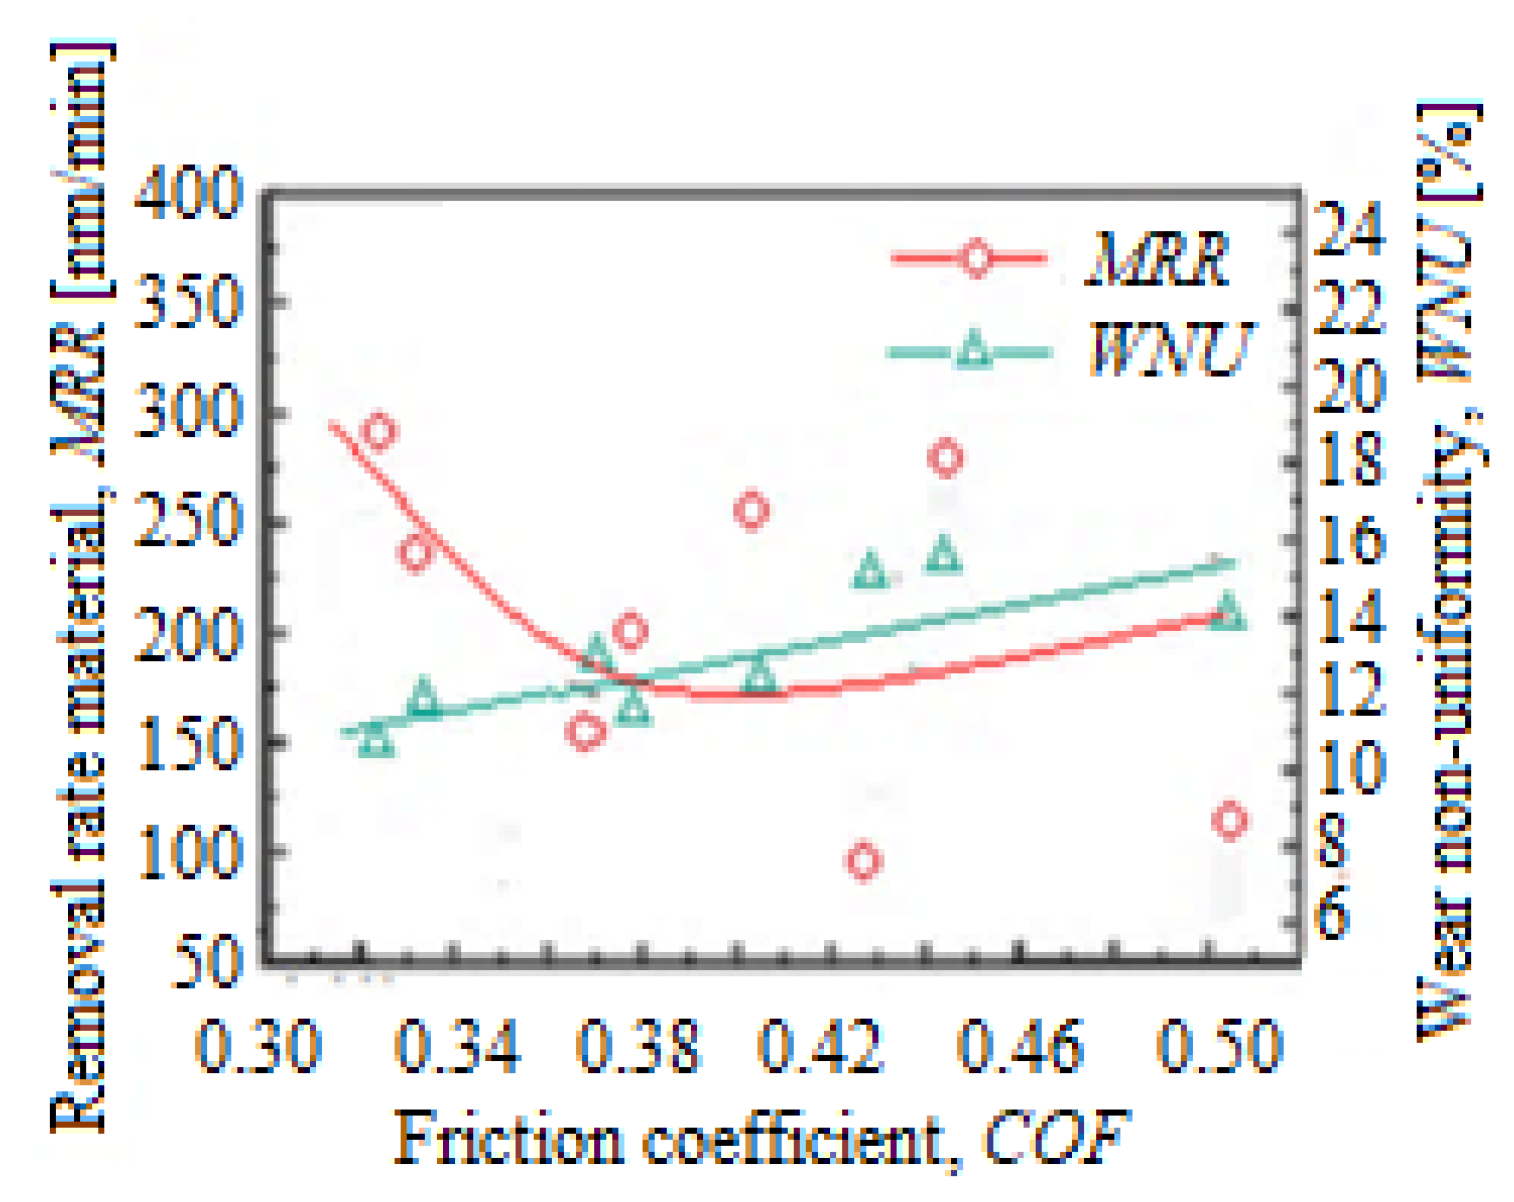
The factors that influence the
WNU in the CMP process are largely divided into processing and equipment conditions, chemicals, and consumables. Therefore, the
WNU depends on the CMP planarization mechanical characteristics in the work process if there are no changes in the consumables and the slurry composition. Experimentally, it turned out that there was a connection between the friction coefficient (
COF) and the
WNU. Thus,
Figure 2 shows the evolution of the
MRR and
WNU depending on
COF. The
COF was introduced to characterize the friction effect and was determined by measuring
Ff and establishing the resultant normal force during the CMP process. According to
Figure 2, as the
COF increases, the
WNU also grows, due to the resultant normal force’s position [
13,
20]. The resultant normal force is determined from the moment’s equilibrium equation relative to the planarization (polishing) head center, as it moves away from the planarization/polishing platen.
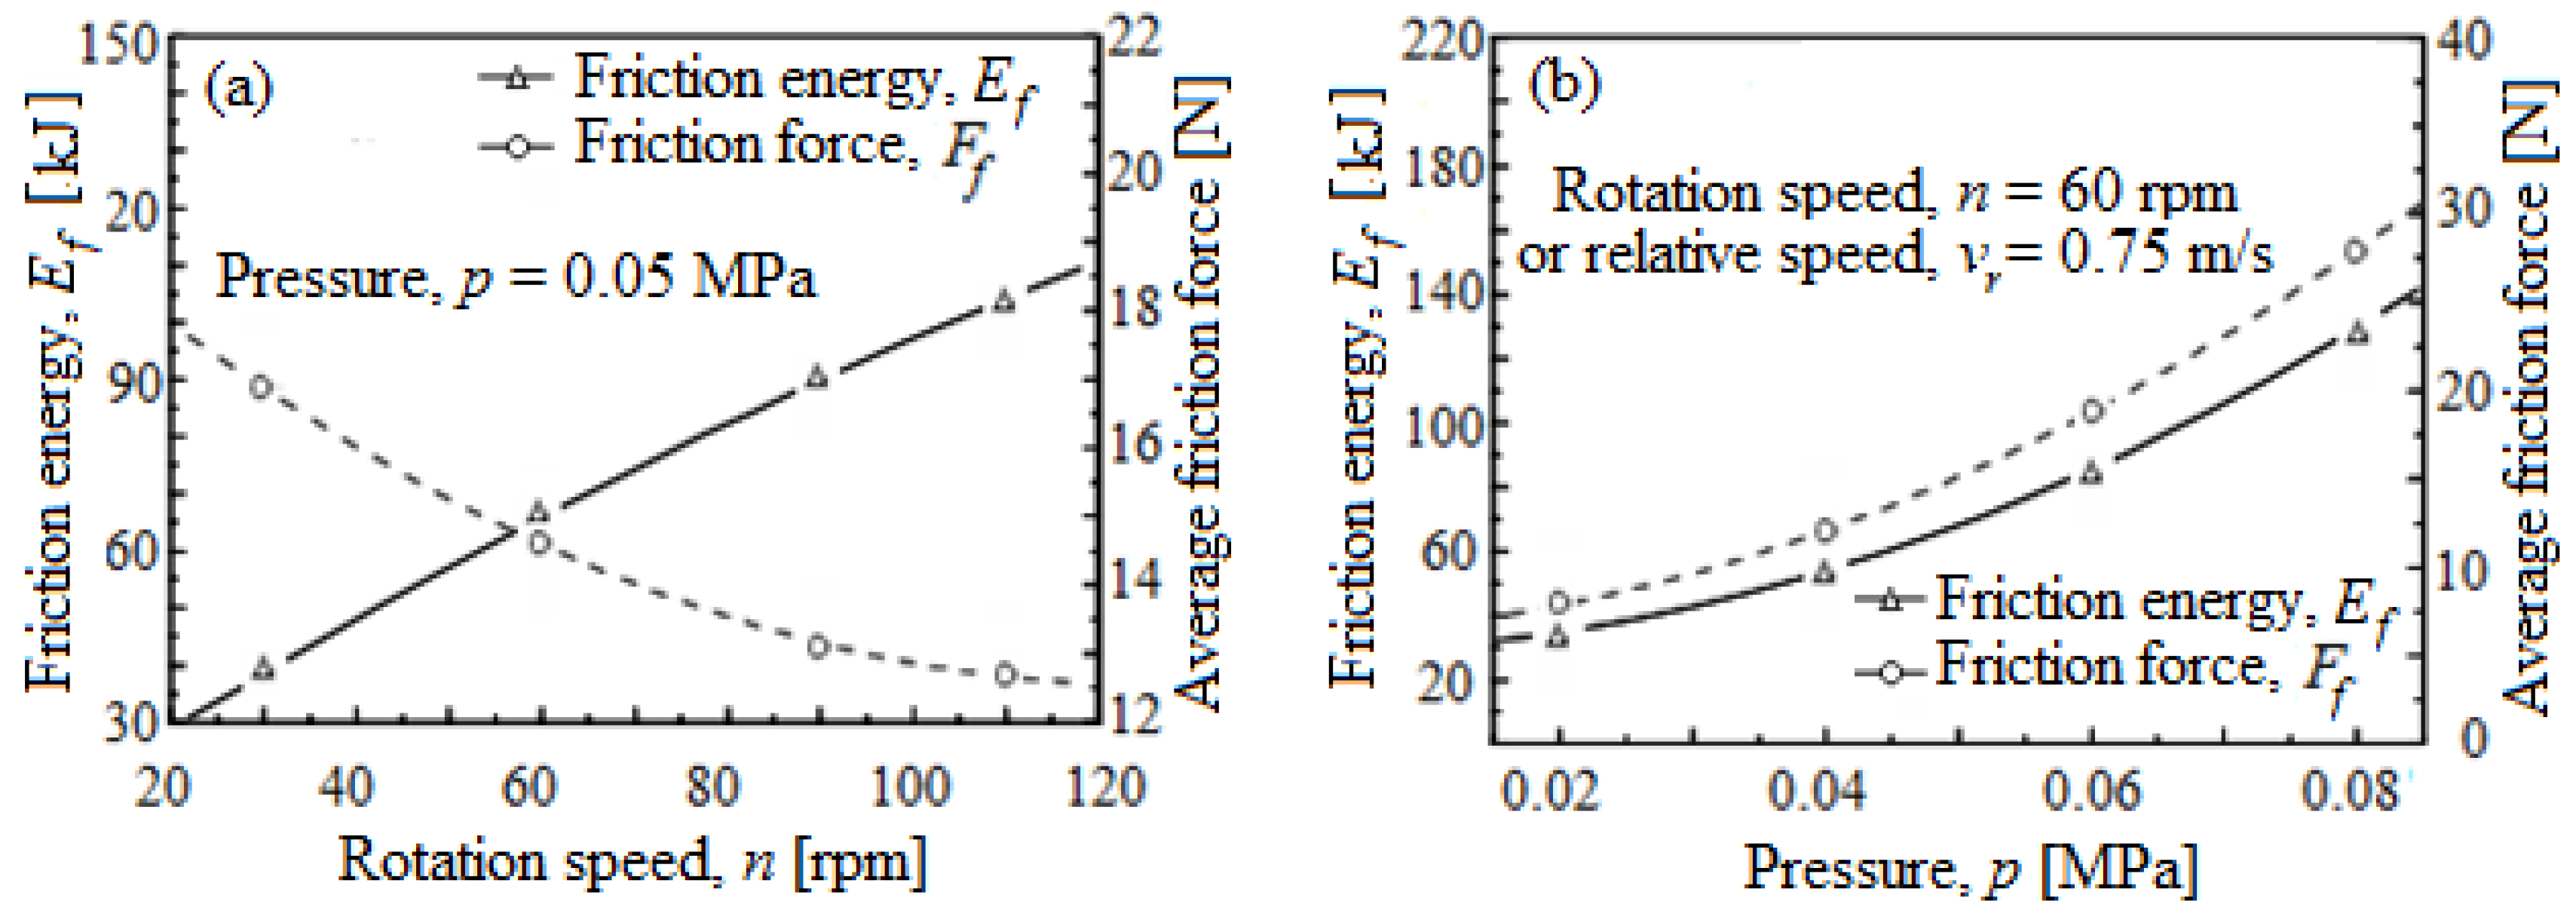
Figure 3 shows friction characteristics (friction energy,
Ef, and average friction force,
Ff) with the change of rotational speed,
n(
vr), and pressure,
p.
Figure 3a shows the variation
Ef and average
Ff with various rotating speeds at constant pressure,
p. While
n(
vr) increases, the
Ef also increases; however, the average
Ff decreases because the removed amount per unit time is prolonged with an increase in n(
vr). Moreover, the decrease in
Ff with growing
n(
vr) also takes place due to the support provided by the boundary layer between the wafer and pad formed as a result of the suspension flow via the pressure dynamic,
p [
16].
Figure 3b shows the variation of
Ff and
Ef with various
p of planarization/polishing at an
n(
vr) constant. With the increase in
p of planarization/polishing, both the
Ff and
Ef grow due to the real contact area influence, caused by the
p of planarization.
4.2. Thermal Effect in the CMP Process
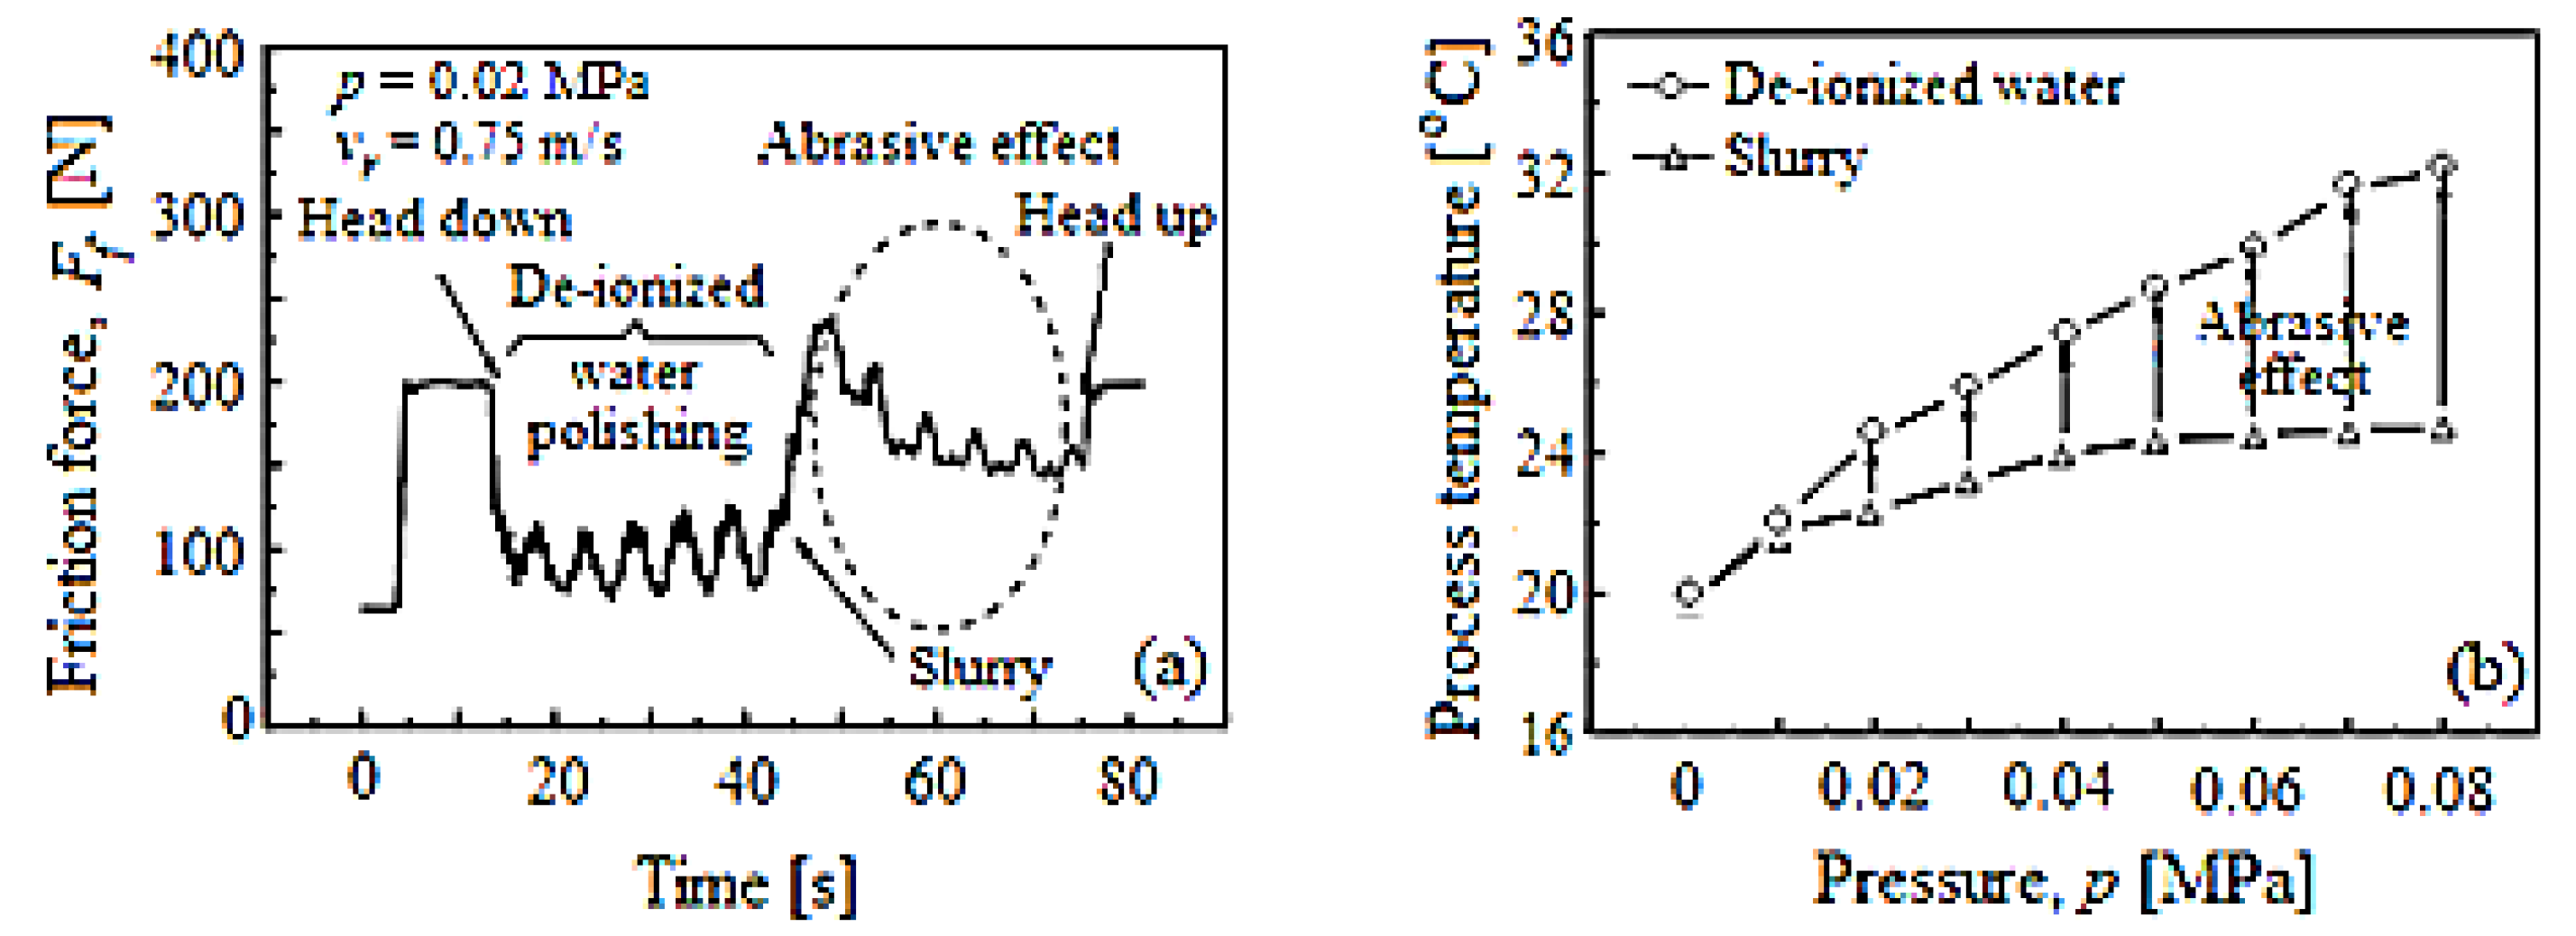
The temperature generated by the friction to the pad–wafer contact in the CMP process is a critical parameter for the
MRR. At the same time, this temperature is inevitable during the CMP process because it is provoked by
Ff due to the abrasive nanoparticles and the CMP slurry chemistry. Therefore,
Figure 4 illustrates how the CMP process friction characteristics are dependent on the material mechanical and chemical removal. Thus, the friction is caused the most by the abrasive nanoparticles in the CMP slurry, as seen in
Figure 4a. Additionally, it is observed that the CMP process temperature, depending on the pressure,
p (see
Figure 4b), generated through de-ionized water, is bigger than that that generated through the slurry. The de-ionized water was used in the experiments to significantly highlight the effect (influence) of the abrasive nanoparticles in the slurry, as seen in
Figure 4. Therefore, the process temperature also contributes to the
MRR, which is caused by
Ff in the CMP process.
Therefore, during the friction process in the CMP, the change in the CMP process temperature becomes essential. The effects of the slurry nanoparticle concentration and size were investigated by many researchers [
16,
24,
25,
26], often with contradictory results, because it influences the
MRR during the CMP process.
This discrepancy explains itself based on the size concentration and the properties of the nanoparticles in the slurry and the planarization technique. At the same time, it indicates that the different planarization processes can become dominant for a certain planarization system as a mode of CMP application.
To solve the differences between the applied planarization rates, two material removal mechanisms were explained based on the silica (SiO
2) CMP [
2,
8,
15,
27].
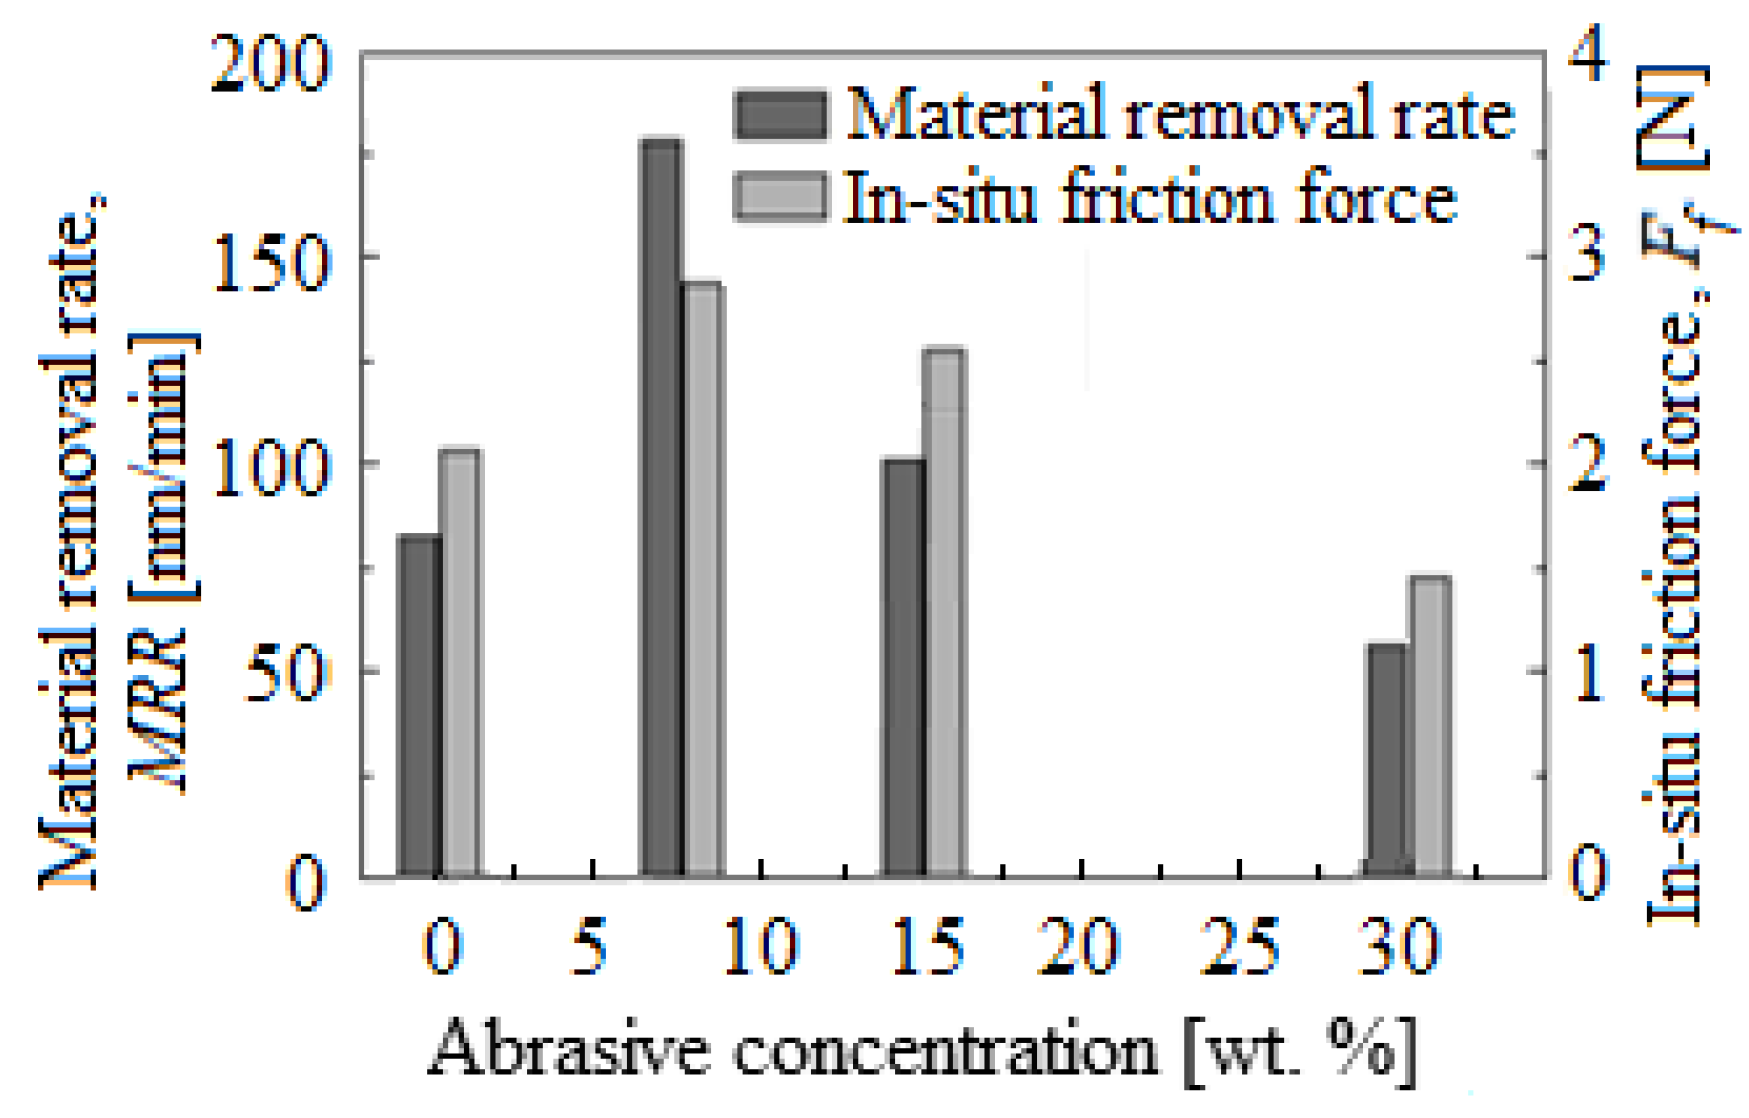
Figure 5 highlights the
MRR distribution and
Ff obtained with 50 nm nanoparticle size SiO
2 slurry depending on the slurry abrasive concentration (from 0.0 to 30 wt.%). At a low abrasive nanoparticle concentration in the slurries (0.0–7.5 wt.%), the
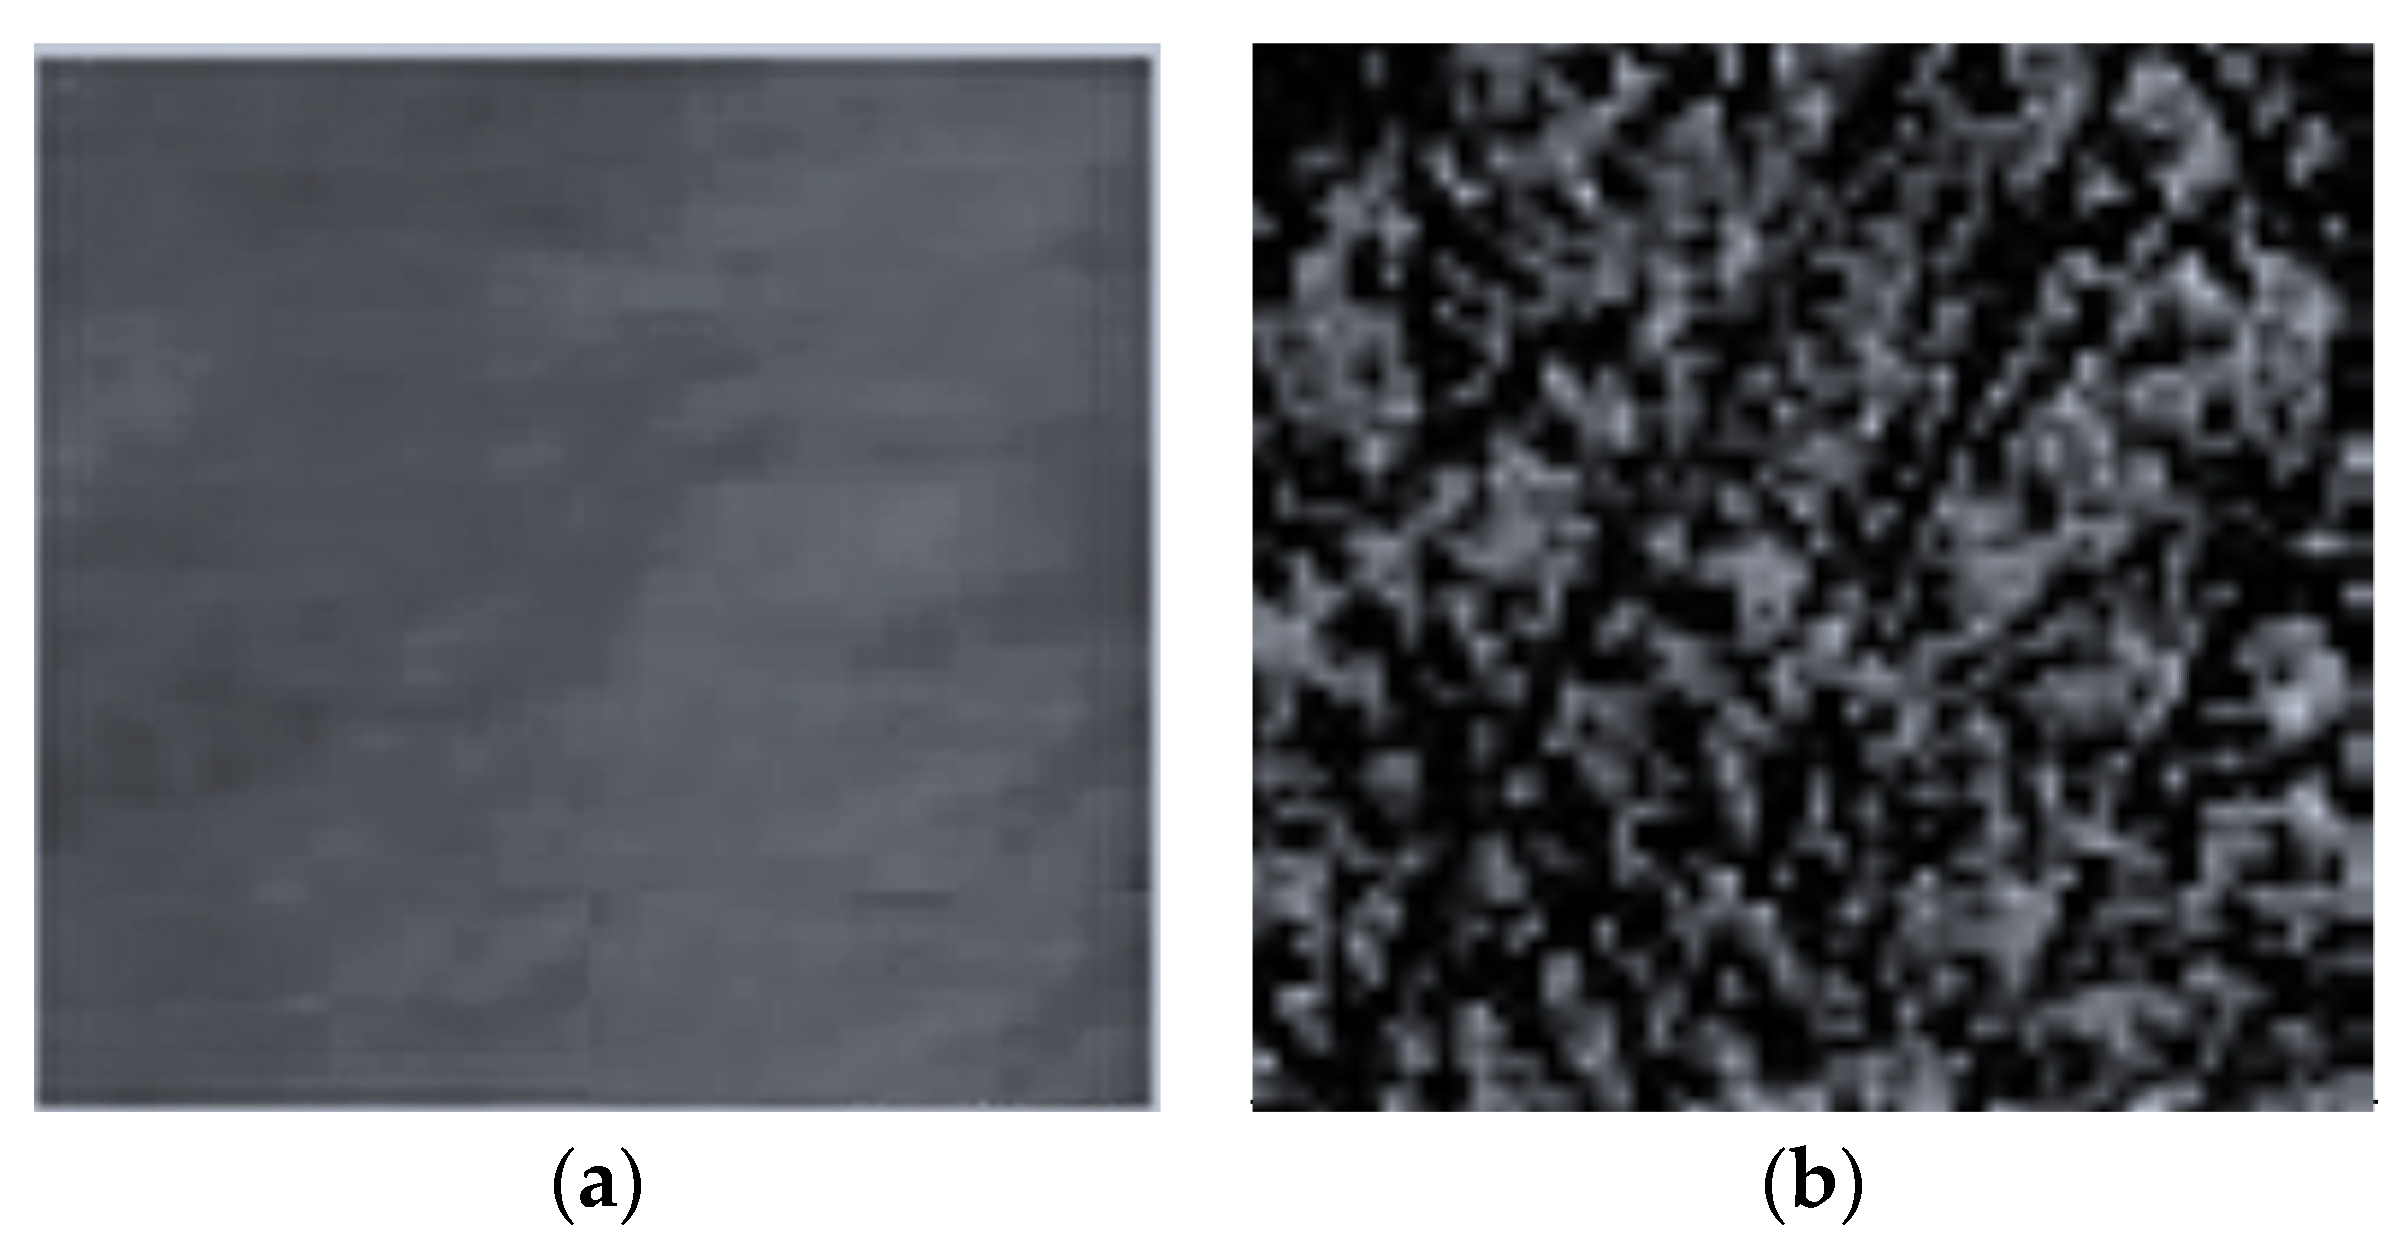
MRR increases with growth in the concentration of abrasive nanoparticles, indicating the mechanical removal mechanism. The surface micrographs of the wafer obtained with an AFM from
Figure 6 present the planarized surface in the base-slurry (
Figure 6a) and scratches on the planarized surface in the slurry with SiO
2 abrasive concentration of 15 wt.%, after the CMP process (
Figure 6b).
The surface roughness of the wafer planarized in the base-slurry (see
Figure 6a) was Ra of 1.512 nm, starting from Ra (before planarization) of 4409 nm, measured with a Portable Optical Profilometer (JR100, Nanovea SRL, European Office, Rivalta di Torino, Italy). This roughness of the wafer surface was measured after one hour of chemical–mechanical planarization.
The AFM micrograph (see
Figure 6b) shows that the nanoparticles started sliding and rolling on the wafer as a result of the friction and the
MRR. Additionally, the depth of the scratches caused by slurry SiO
2 abrasive concentration was less than 7 nm.
It is notable that
MRR reaches its maximum value at an abrasive nanoparticle concentration of 7.5 wt.%, after which a significant decrease occurs. This change is caused by the motion modification of the nanoparticles, and an increase in their number leads to the load per nanoparticle decreasing when in contact with the wafer surface. Then, for the abrasive concentrations between 7.5 and 15 wt.%, the nanoparticles start to roll faster rather than slide on the wafer surface [
16]. The surface AFM micrograph at 15 wt.% shows pitting deformations rather than scratches on the wafer surface, demonstrating the rolling motion of the abrasive nanoparticles (
Figure 6b). Therefore, at higher abrasive nanoparticle concentrations,
MRR is primarily due to chemical interactions which significantly reduce the mechanical removal action.
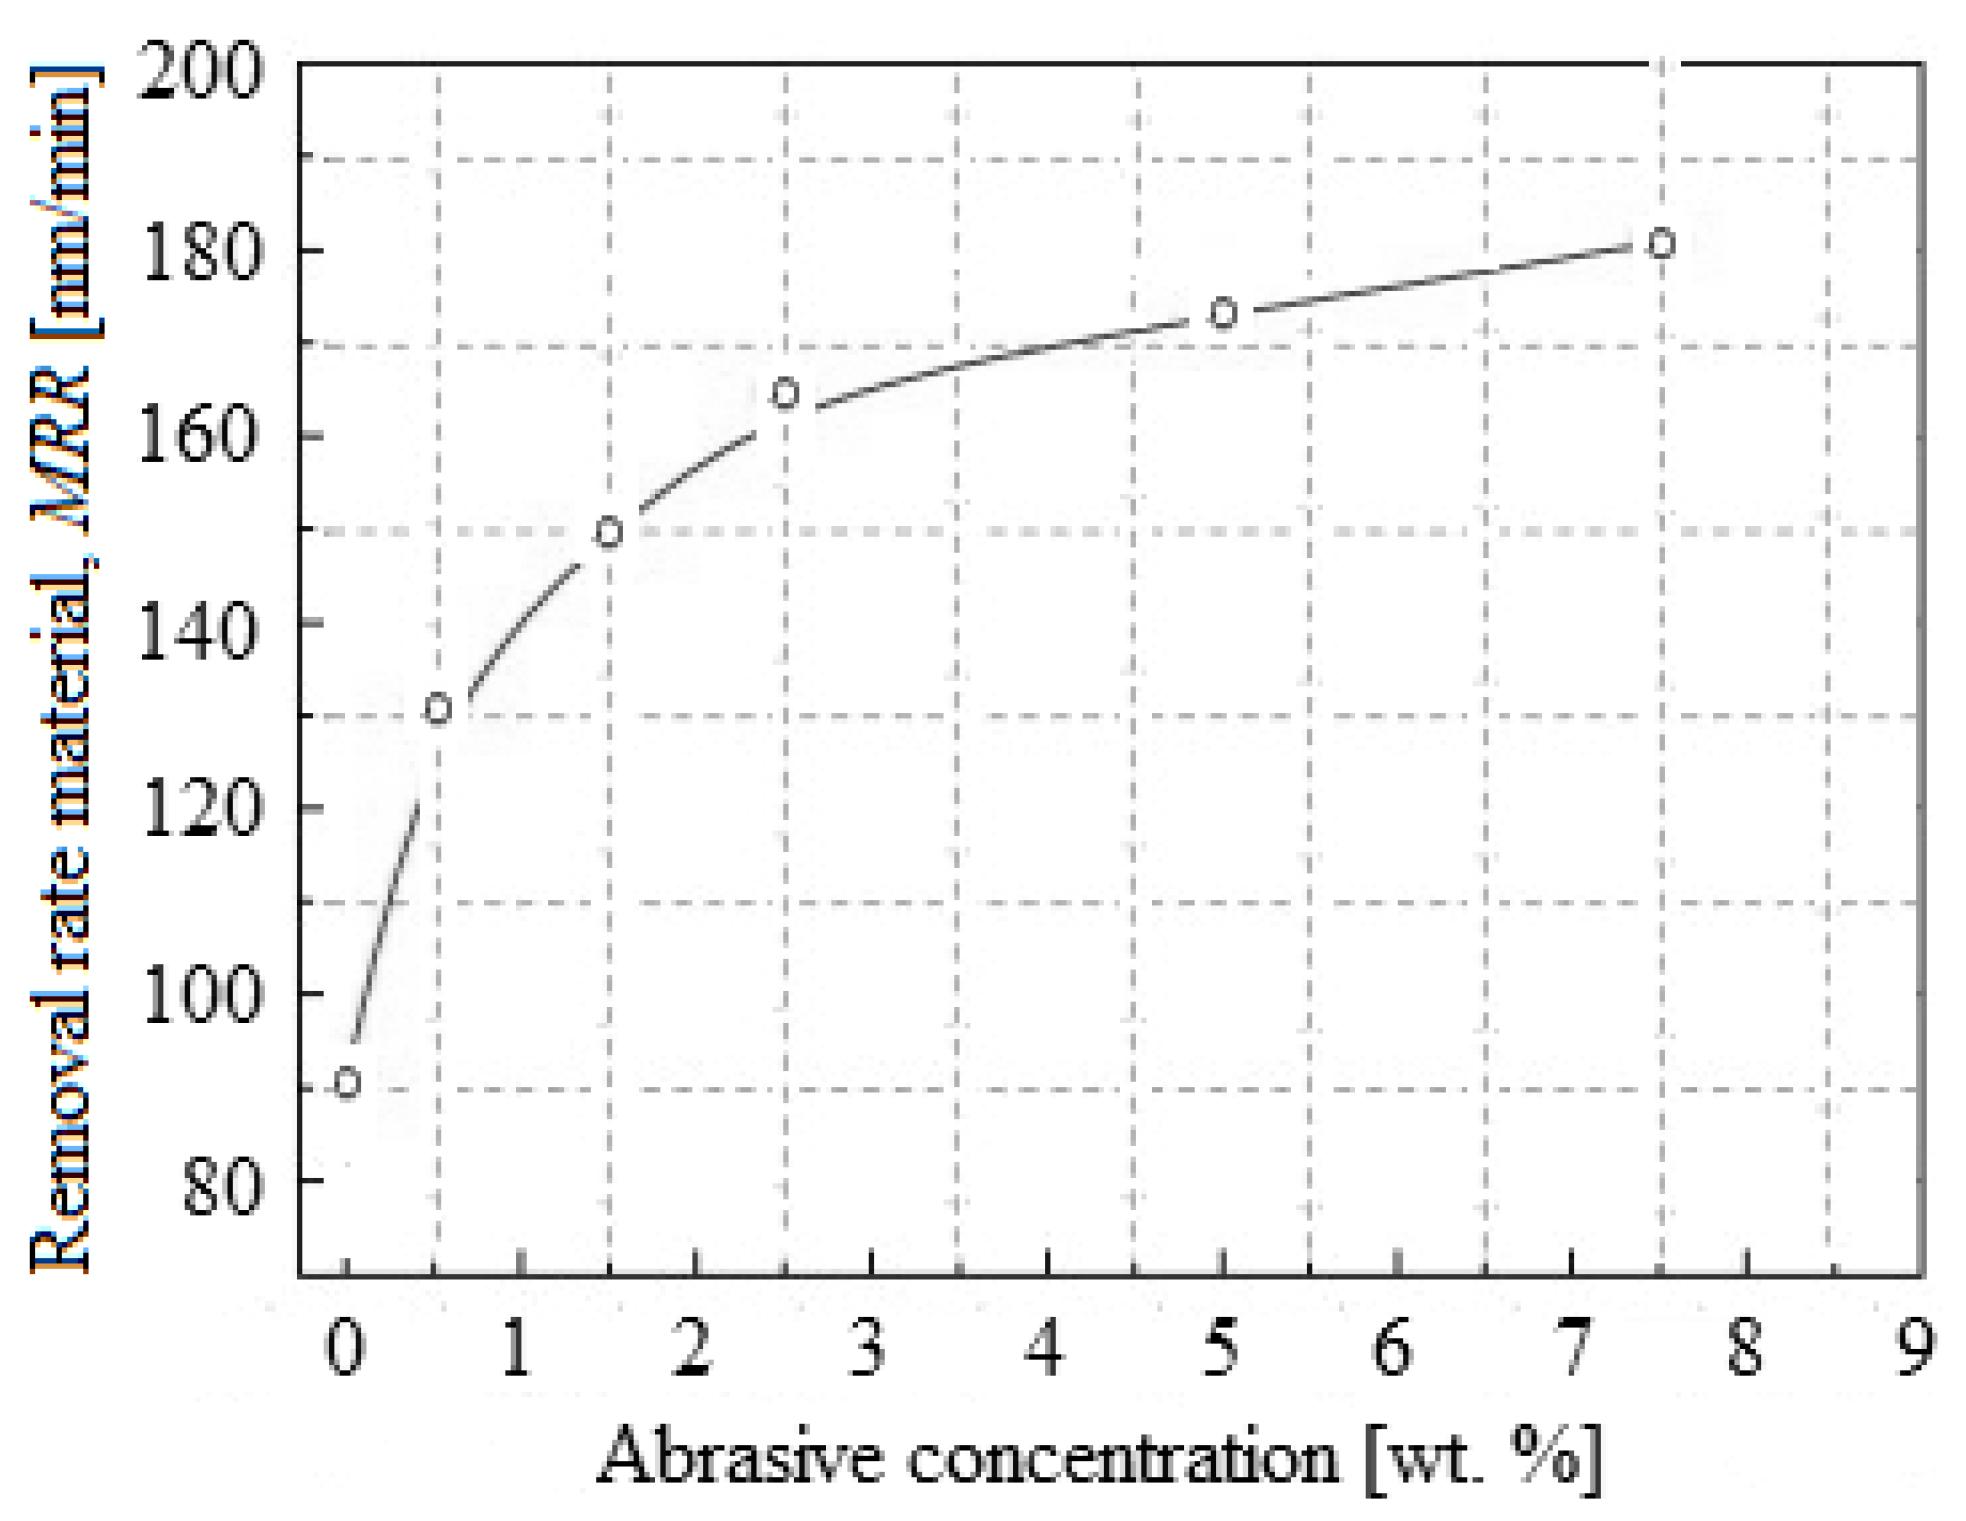
Figure 7 describes the
MRR depending on the concentration of abrasive nanoparticles (in the range 0.0–7.5 wt.%) with the 50 nm abrasive size. For planarization, a relative speed of 0.75 m/s, a pressure of 0.05 MPa, and a slurry flow of 150 mL/min were used. It can be observed that as the abrasive nanoparticle concentration increased, the
MRR of the selective layer also increased. Thus, the
MRR was about 85 nm/min when the abrasive nanoparticle concentration was 0.0 wt.%. This value is the mechanical removal/abrasion result between the pad asperities and the selective layer, respectively, by the selective-layer chemical dissolution. When 0.5 wt.% SiO
2 was added in the selective-layer CMP slurry, the
MRR reached approximately 132 nm/min. The
MRR increased rapidly until the abrasive nanoparticle concentration of 2.5 wt.%, and then increased slowly as the abrasive nanoparticle concentration grew from 2.5 wt.% to 7.5 wt.%.
In support of these observations, in situ
Ff measurements showed an evolutionary trend of the total
Ff, similar to that of the
MRR depending on the abrasive nanoparticle concentration in the slurry with the size of 50 nm (see
Figure 5).
Additionally, it was proved that in situ measurements during the CMP process are correlated with the
MRR response presented in ref. [
7], i.e., the load per particle decreases with the increasing abrasive nanoparticle concentration, at which point these start rolling, leading to the reduction of
Ff.
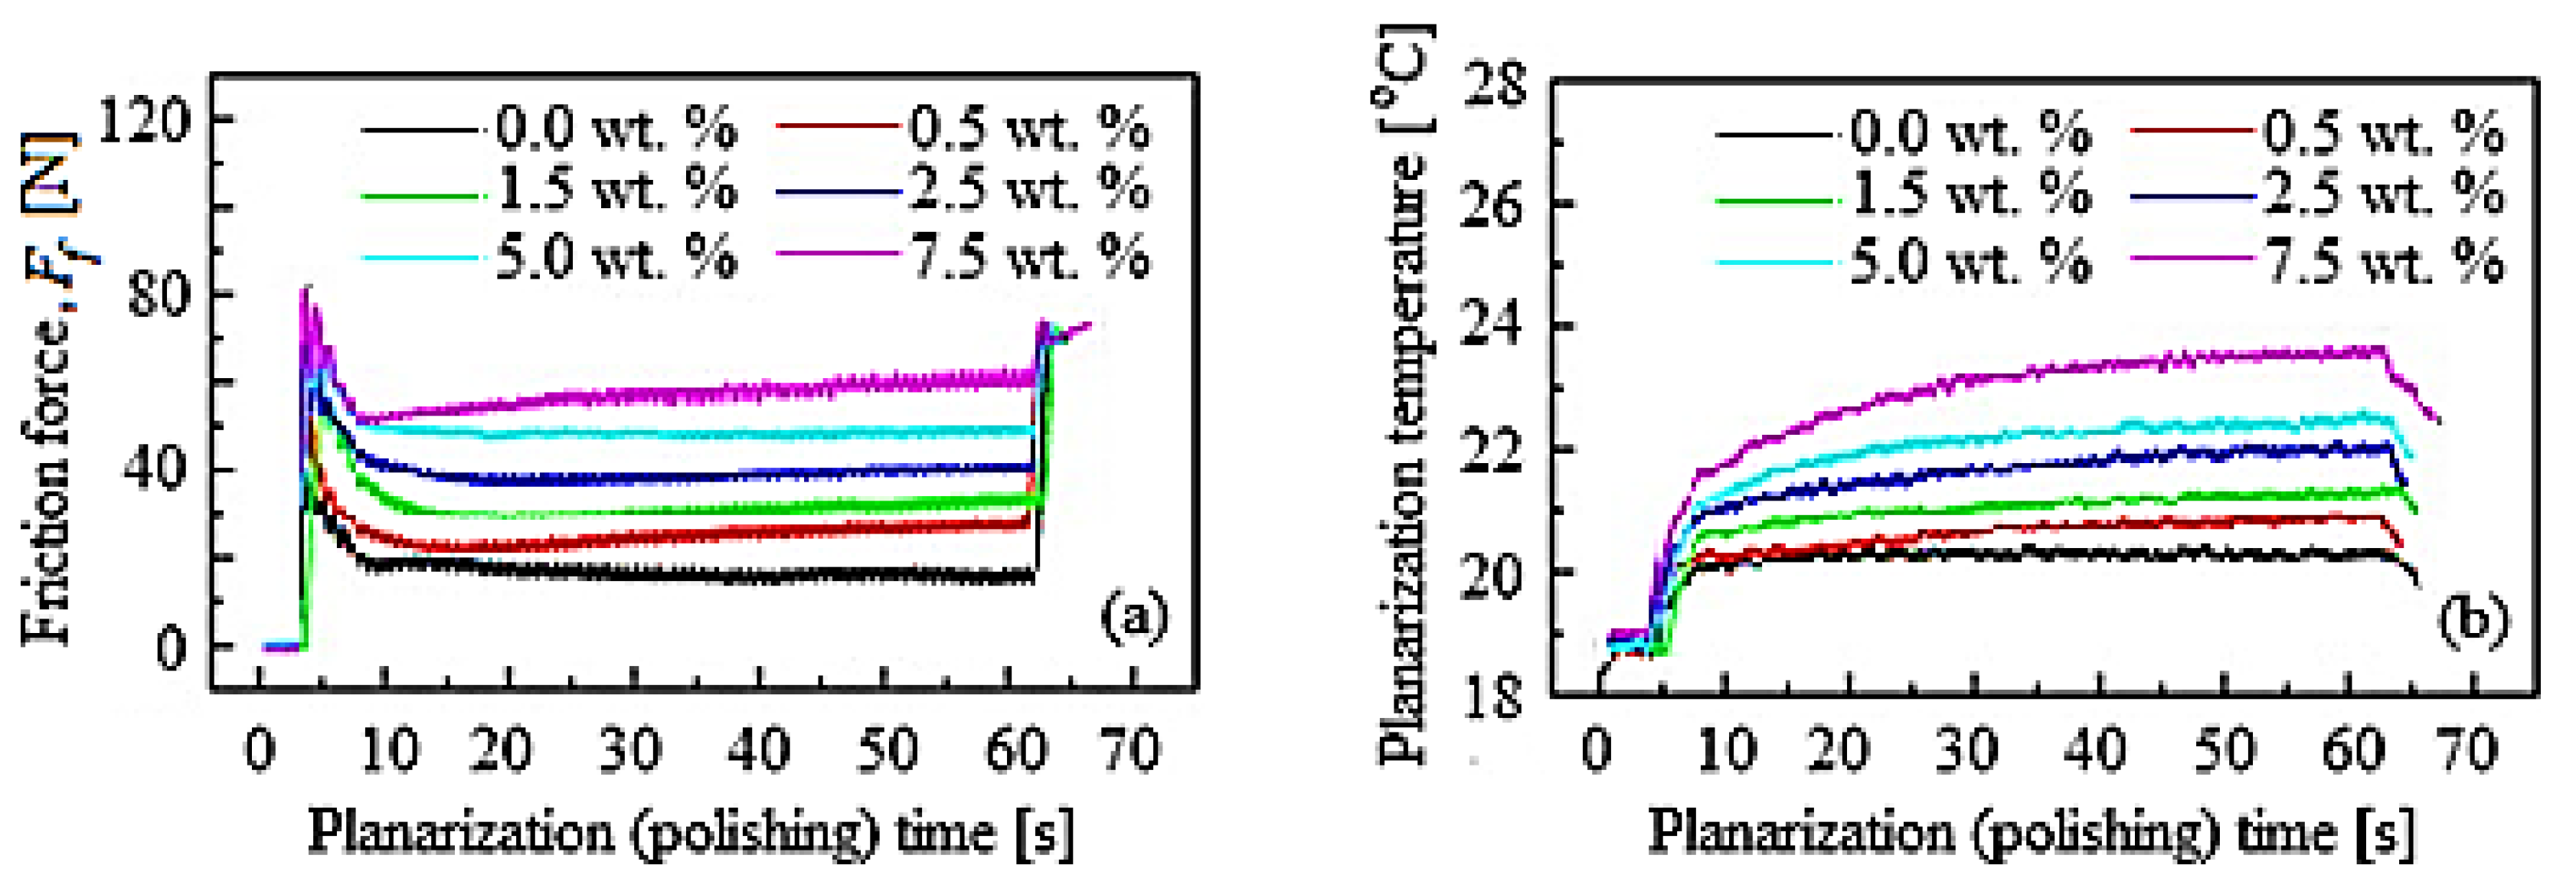
Figure 8 shows the variation
Ff and planarization/polishing temperature with the planarization time in the CMP process, under the same conditions as those shown in
Figure 7.
The friction force signals are presented in
Figure 8a, and those of the process temperature in
Figure 8b, depending on the planarization time. The friction appears in the early stage of planarization, because the
Ff is the effect of air pressure, respectively, of the relative movement between the wafer–pad when the static
Ff is exceeded. Additionally, the average
Ff increases with the growth of the abrasive nanoparticle concentration, changing from 18.50 N to 57.00 N. During the CMP, colloidal SiO
2 is chemisorbed by the passivation selective layer, because the adhesion forces of the abrasives are usually about twice as large as the van der Waals forces due to the covalent bonds present [
9]. Thus, the friction behavior and
MRR in the CMP process could be influenced by the chemical absorption of SiO
2 into the selective layer. The
Ff and
MRR could also increase as the abrasive nanoparticle concentration increases as a result of the chemisorbed active abrasives number by the selective layer. As can be seen from
Figure 8b, during the CMP process the planarization temperature increased while growing the concentration of abrasive nanoparticles. This could be related to the
Ef, because it would hasten the realization of a protective layer (soluble passivation layer) due to the chemical dissolution. Lee et al. in ref. [
28] and Kawaguchi in ref. [
29] confirmed that the inhibitor leads to the soluble passivation layer (protective layer) formation, indicating the selective-layer surface characteristic zone immersed in the slurry. Additionally, they demonstrated that the soluble layer of passivation is removed through the abrasive nanoparticle mechanical action because the protective layer covering the amount by inhibitor decreased on the selective-layer surface. As a result, the number of active abrasive nanoparticles has an effect on the growth of the
Ff; hence, the protective layer removal amount could also be increased.
The experimental results obtained in this paper during the CMP process were useful to examine the temperature distribution in the planarization pad. Additionally, a kinematic analysis of temperature distribution was performed to understand its growth, considering the friction characteristics. Therefore, the results of this examination can help in developing a more effective CMP process by estimating the temperature distribution in a planarization pad.
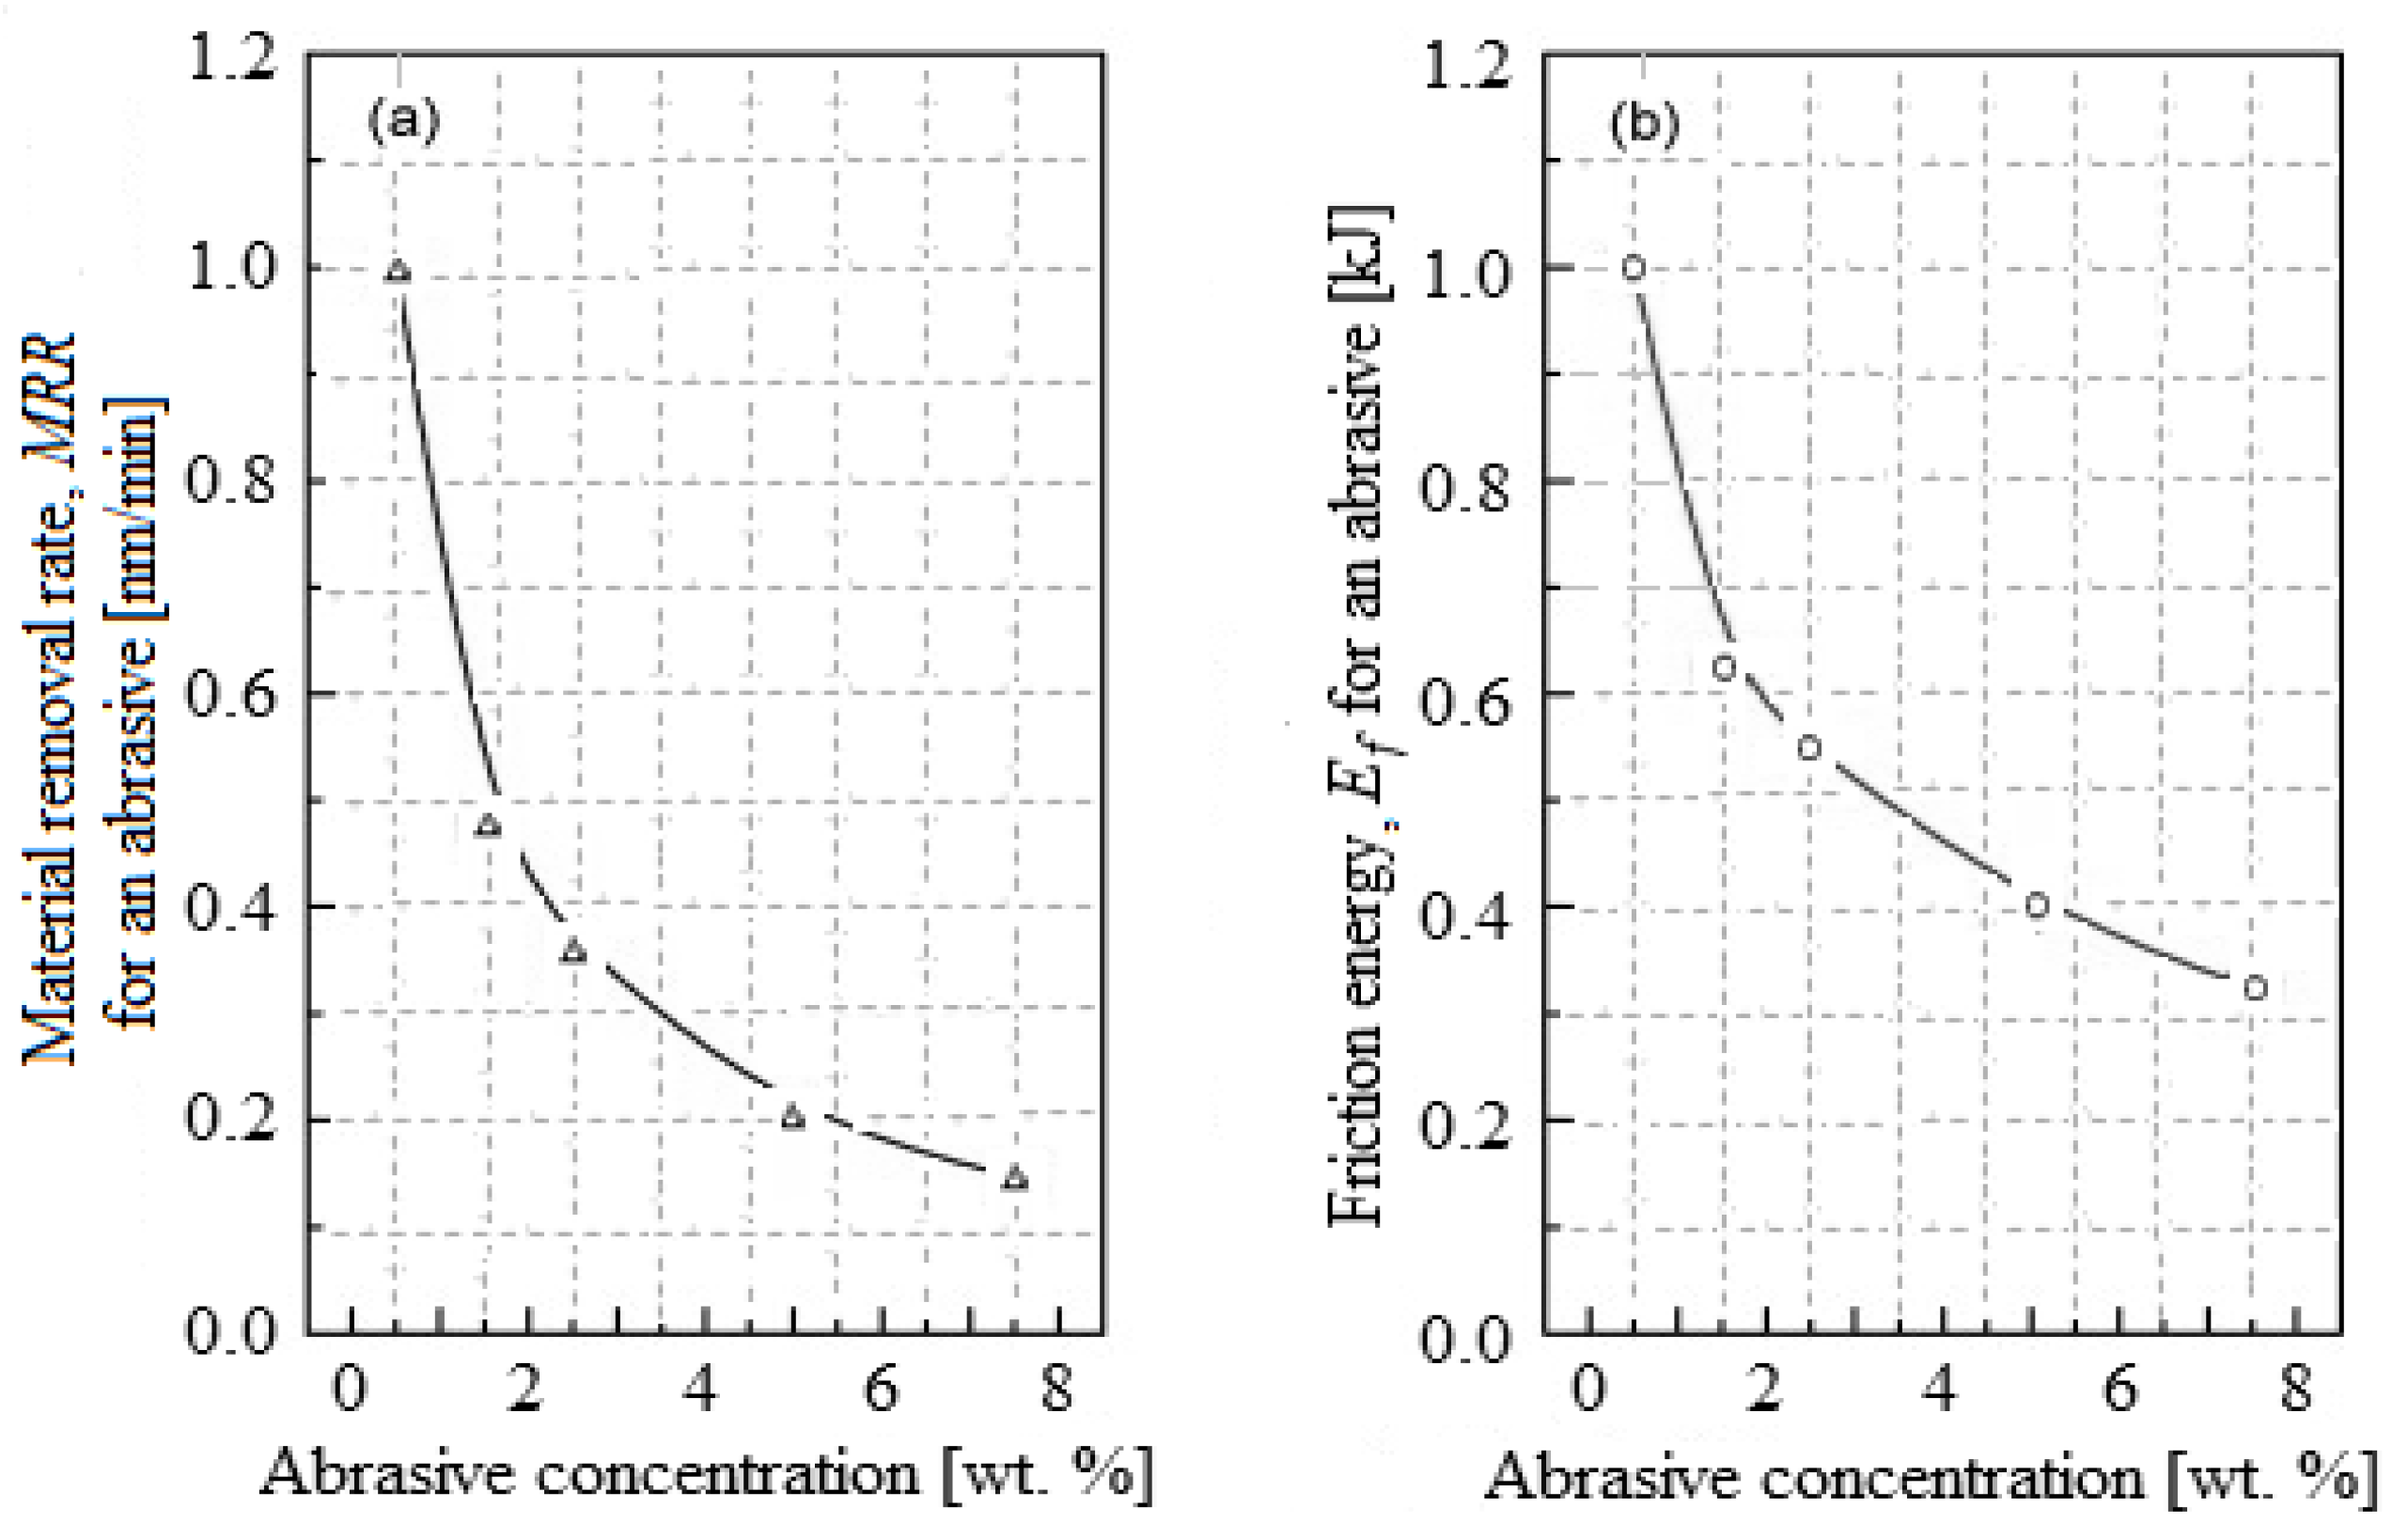
Figure 9 shows
MRR and
Ef variation for a single abrasive depending on the abrasive concentration. As shown in
Figure 9a, with the increased abrasive nanoparticle concentration, the
MRR per single abrasive decreases. The probability of the active abrasive nanoparticle being in contact with the wafer, even by their number growth at a high concentration or with the pad asperities, is possible during the CMP process. It is proven that the
MRA by using an abrasive nanoparticle is bigger than the
MRR only by the pad asperities because the planarization pad has viscoelastic a property from being made of polyurethane. During the CMP, the pressure applied on the contact surface between a single abrasive and the wafer could be reduced, but due to the active abrasives number, the contact area increases, and a higher
MRA could be obtained.
The average
Ef which is used for the characterization of friction behavior is time-dependent and cannot influence the shape of the friction curve. Hence, this characterization in the CMP process would be more reasonable with a singular
Ef because it depends on the planarization time and the friction curve shape. The
Ef, depending on abrasive concentration, for a single abrasive is plotted in
Figure 9b, where it is observed that the
Ef decreases with the increasing abrasive nanoparticle concentration. Instead, the
Ef increases, because on a single abrasive the applied pressure increases if the active abrasive nanoparticle number decreases.
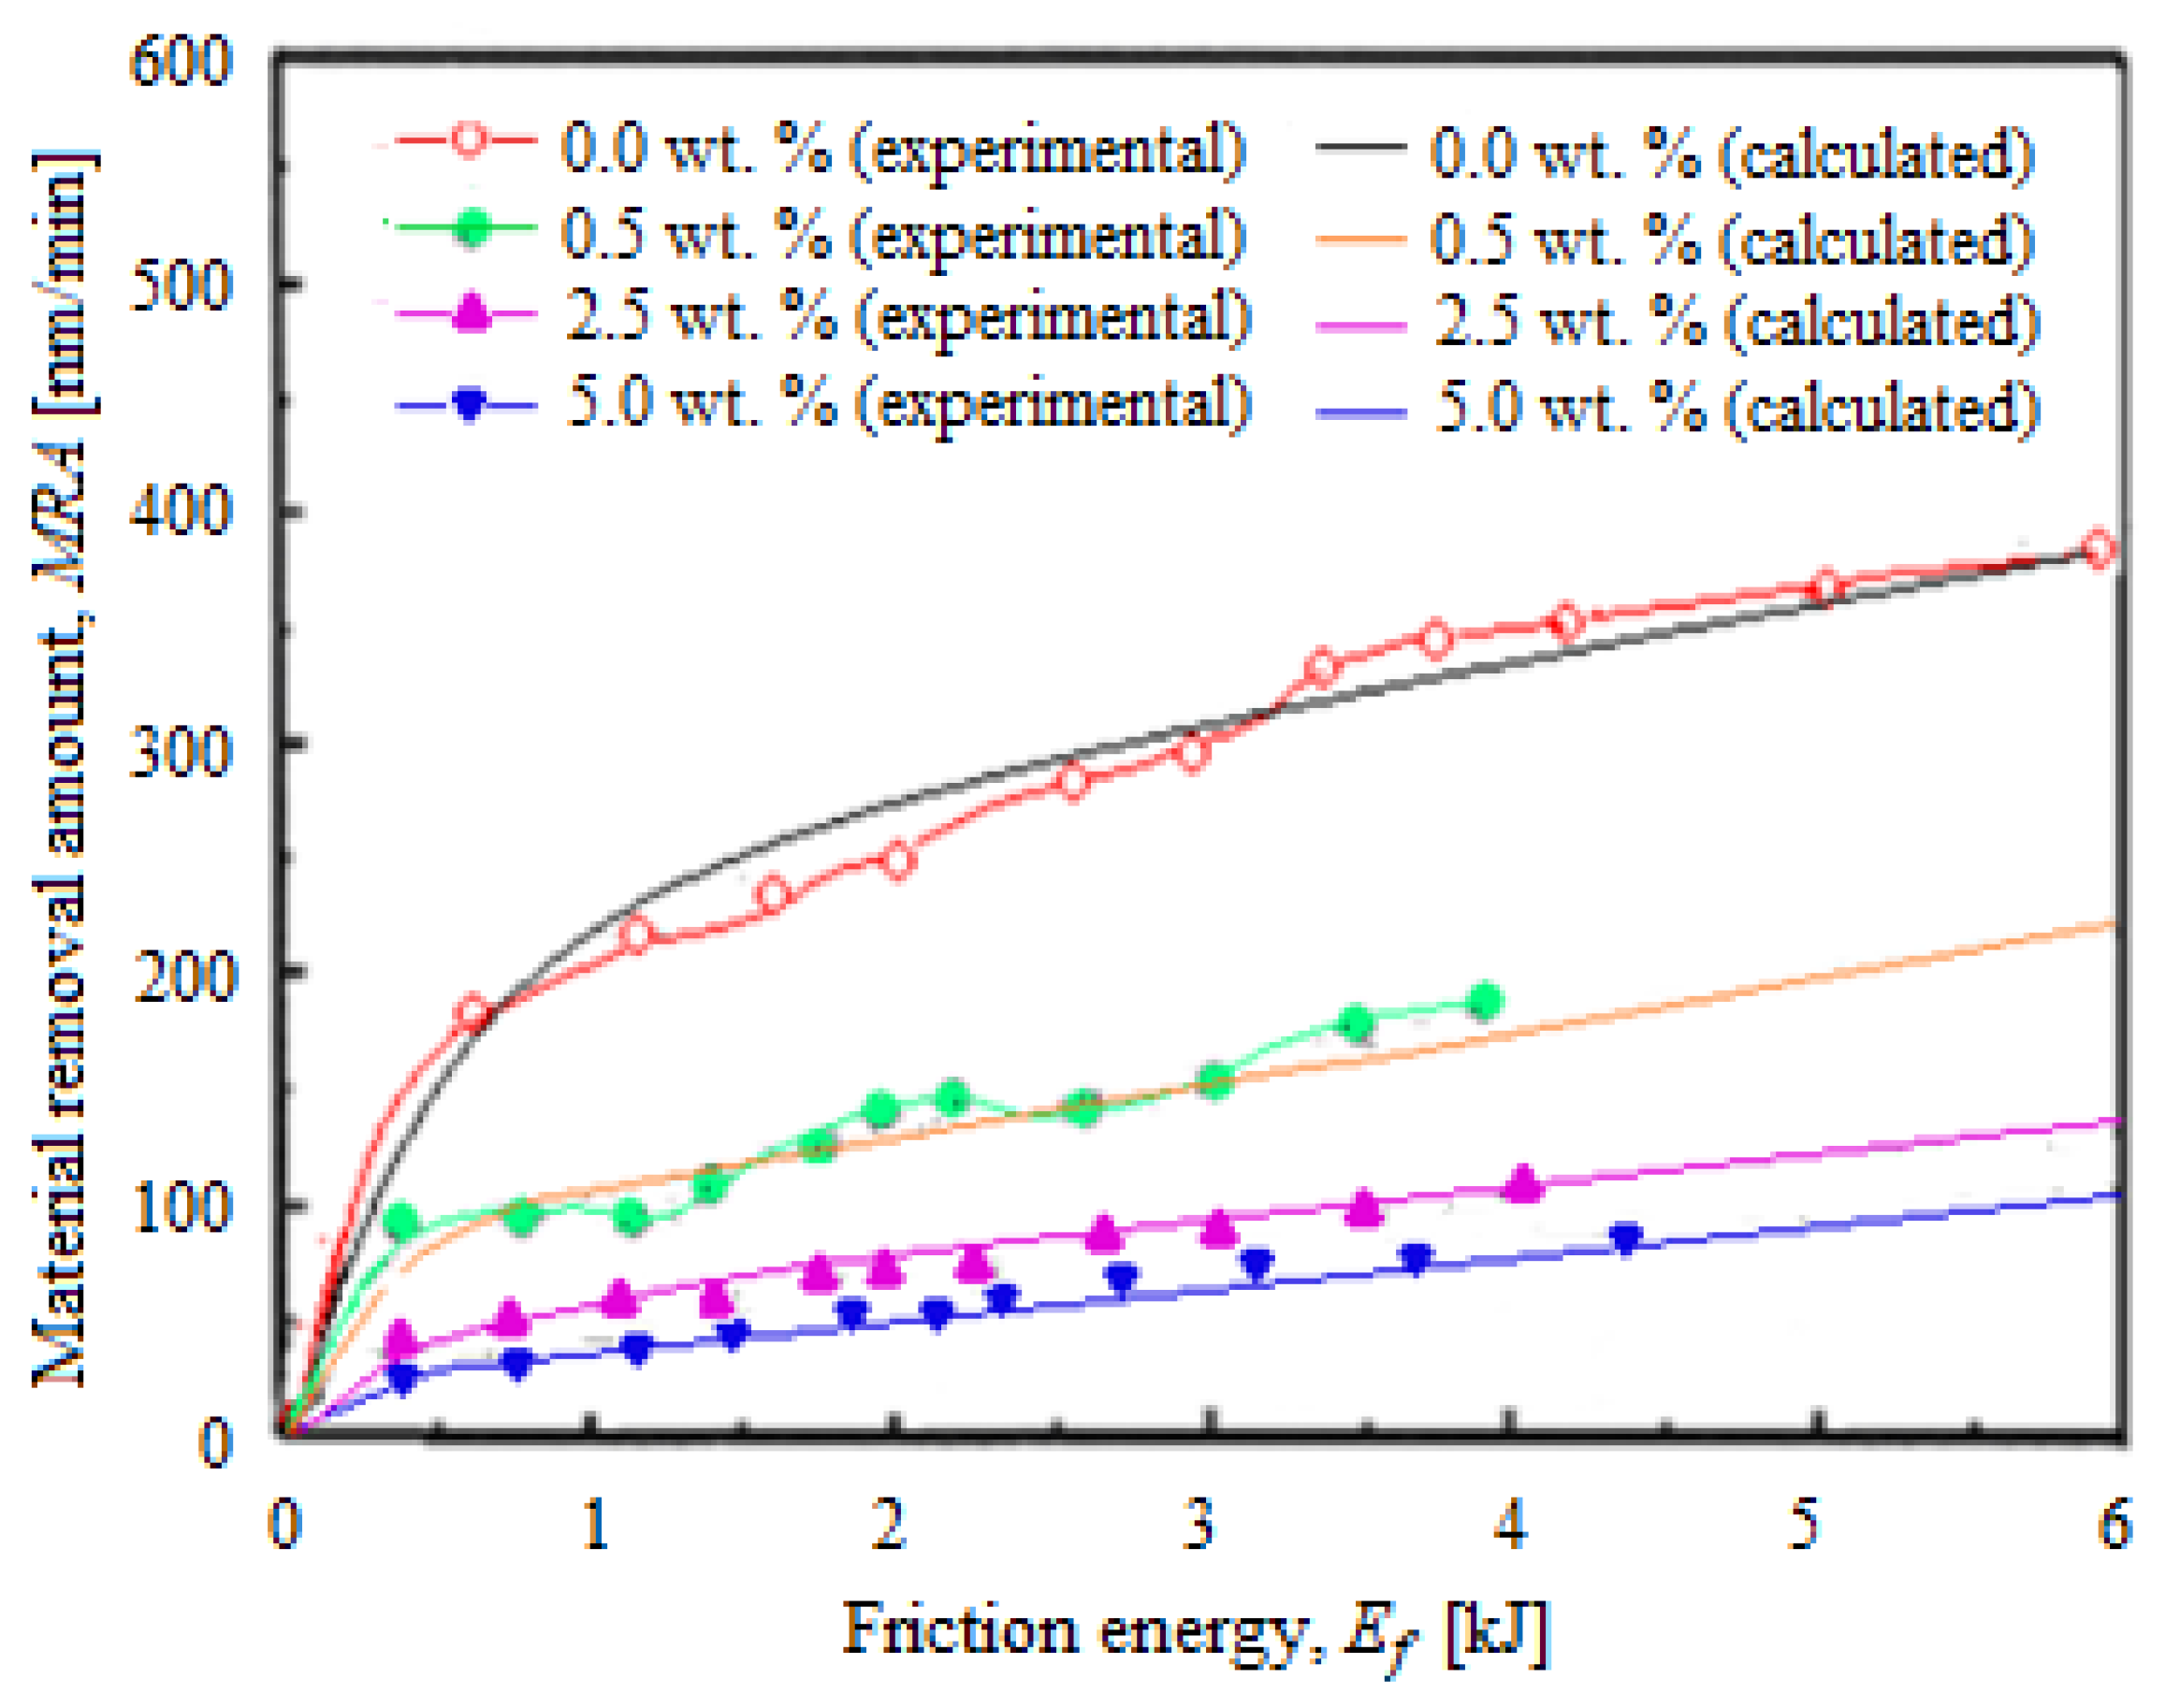
Figure 10 shows the
MRA versus
Ef in different conditions of pressures and relative speeds that generate
Ff after the selective layer CMP process. It can be observed that by decreasing the abrasive nanoparticle concentration and increasing the
Ef, it is obtains higher
MRRs.
When the
MRA is plotted represented depending on
Ef, the curves show similar trends at different concentrations (see
Figure 10), except that at the low values of
Ef (close to zero),
MRA increased rapidly after 0.5 kJ and continued to grow relatively slower (with a slower rate). It seems that the
MRA, depending on
Ef, is adequate to effectively characterize each concentration value of the abrasive nanoparticles, while the
MRA, depending on
Ff, is useful (by the
Ff monitoring) to estimate
MRR during CMP. Between the calculated
MRA with Equation (5) and that experimentally determined, there were no significant differences, indicating that the theoretical and experimental results are in correlation, which proves (confirms) the planarization slurry stability in the CMP process. When the roughness and deformation of the surface are minimal, the surface quality is considered to be optimal. Therefore, the optimal unfolding of the CMP process presents importance for both nanoparticle–nanoparticle and nanoparticle–substrate interactions [
30]. Thus, the surfactant presence can influence the lubrication between the abrasives and the planarization surface [
28,
29]; as a result, the
Ff can decrease, leading to the reduction of the
MRR.
To this, the applied force calculation during planarization on a single abrasive was necessary [
7]. This was possible by determining the contact area resulting from the applied pressure between the pad and the nanoparticle by the pad’s head [
16], which is consistent with the modeling from previous studies [
12,
18,
25,
28]. Hence, it is possible for the
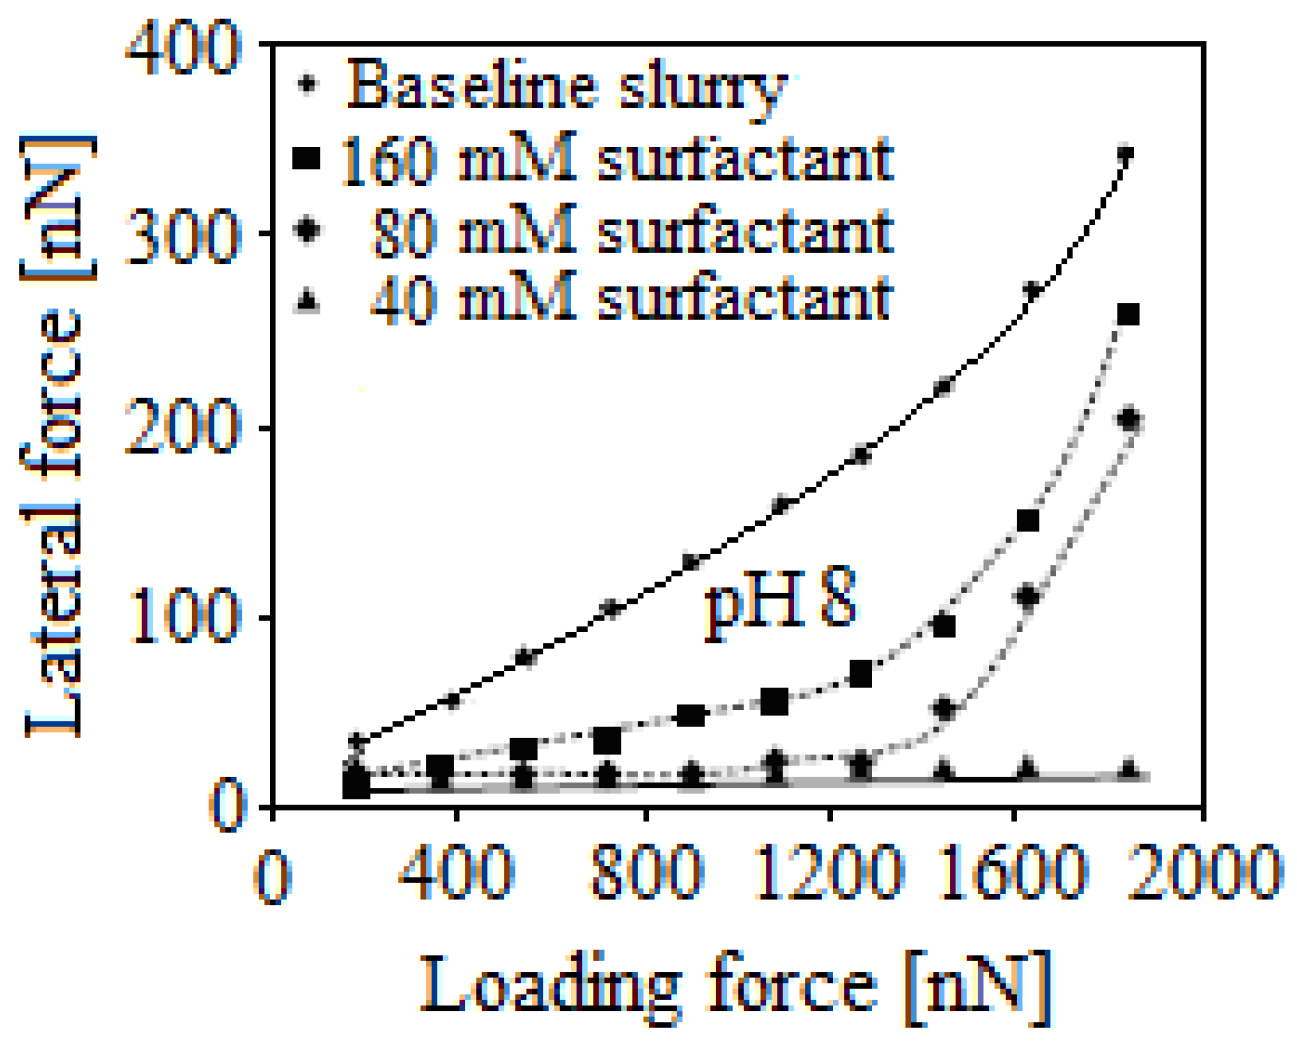
MRR to be controlled by the lubrication effect introduced by the surfactant through the friction forces between the wafer and the abrasive nanoparticles. Additionally, studies with surfactants have shown that lateral forces exhibit nonlinear behavior with respect to normal forces (
Figure 11).
Another approach for quantifying the friction forces that appear during the CMP process resulted from the observation that the
MRR values compared with the baseline slurry were lower (see
Figure 11). In-depth studies by simulation with AFM on the friction in situ between single-particle and the substrate in suspension with a surfactant highlighted the response of friction force. These simulations demonstrated that the slurry chemistry, including the composition, pH, and adhesion tension of the surfactant, could be adjusted to ensure the necessary friction force for optimal planarization performance [
25,
30]. A certain surface-active surfactant has an optimum concentration range, which ensures that the dispersion ability results in a better surface quality. Therefore, surfactants can be used to modify the nanoparticle–substrate and the nanoparticle–nanoparticle interactions in the CMP process, s, with the goal of optimizing it based on the selected/desired performance (surfactant and the optimum concentration range).


