
Crystal Structure Complexity and Approximate Limits of Possible Crystal Structures Based on Symmetry-Normalized Volumes


Abstract
:1. Introduction
2. Materials and Methods
- (1)
- The index should correlate with the complexity of structures within structure families, e.g., the coupled substitution that derives bixbyite- and pyrochlore-type phases from fluorite-type oxides or tetrahedrite-type phases from the sphalerite-structure should be reflected by the index.
- (2)
- Polymorphs that are the result of structural transitions that obey the Landau criteria should also have higher indices. For instance, the transitions from cubic to rhombohedral and from cubic to tetragonal to orthorhombic ABO3–perovskites should be reflected by the index.
- (3)
- The index should generally scale with increasing structural complexity as defined by the size of the asymmetric unit, and, more specifically, it should rank solids that assume the same space group but with vastly different sizes of their asymmetric units accordingly higher or lower.
3. Results


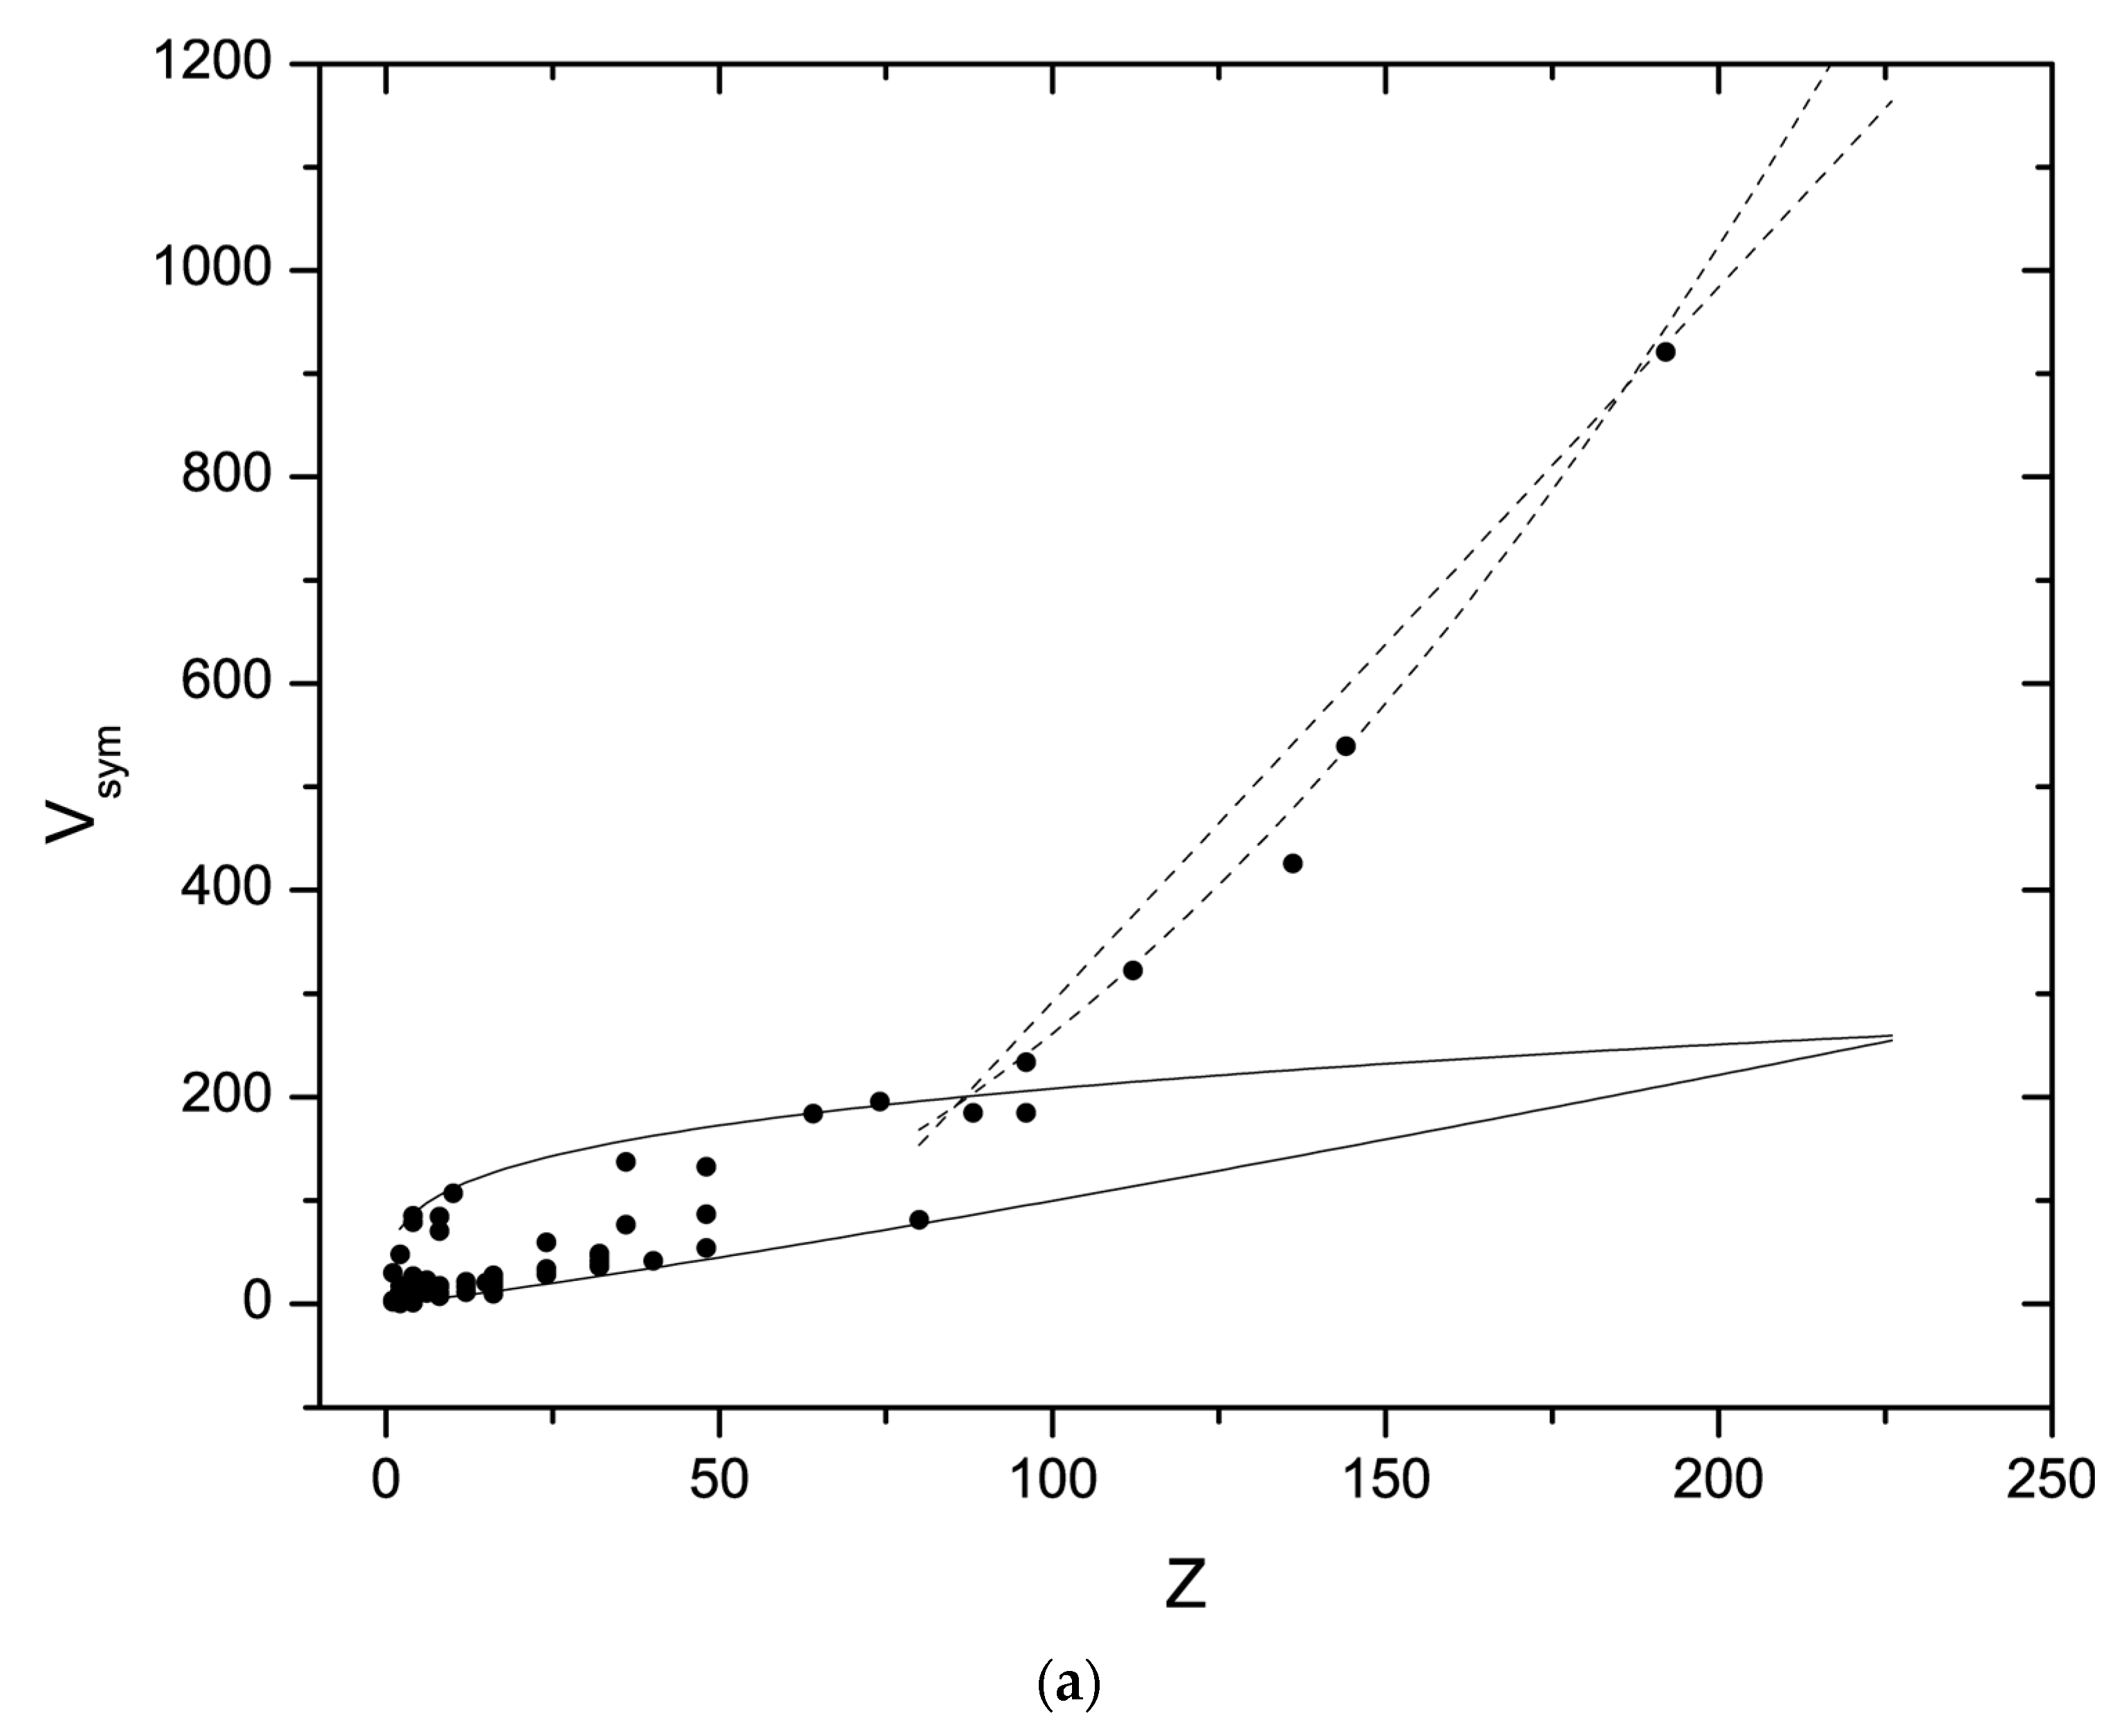
| Boundary | Z | Vsym |
|---|---|---|
| Lower * | >1 | 0.5 Z1.15 |
| Upper | 1–80 | 60 Z0.27 |
| >80 | 0.03 Z1.97 | |
| or: 6.92 Z−400 |
4. Discussion
4.1. Constraints on Possible Crystal Structures, Statistics, and Crystal Structure Prediction
4.2. Effect of Pressure and Temperature
4.3. Statistical Distribution of Structures
4.4. Index of Crystal Complexity
4.5. Limitations of Icmplx
4.6. Tentative Statistics of Crystalline Phases Based on Icmplx
5. Conclusions
Author Contributions
Funding
Data Availability Statement
Conflicts of Interest
References
- Mumpton, F.A. La roca magica: Uses of natural zeolites in agriculture and industry. Proc. Nat. Acad. Sci. USA 1999, 96, 3463–3470. [Google Scholar] [CrossRef]
- Chae, H.K.; Siberio-Pérez, D.Y.; Kim, J.; Go, Y.; Eddaoudi, M.; Matzger, A.J.; O’Keeffe, M.; Yaghi, O.M. A route to high surface area, porosity and inclusion of large molecules in crystals. Nature 2004, 427, 523–527. [Google Scholar] [CrossRef]
- Werber, J.R.; Osuji, C.O.; Elimelech, M. Materials for next-generation desalination and water purification membranes. Nat. Rev. Mat. 2016, 1, 16018. [Google Scholar] [CrossRef]
- Manos, M.J.; Kanatzidis, M.G. Metal sulfide ion exchangers: Superior sorbents for the capture of toxic and nuclear waste-related metal ions. Chem. Sci. 2016, 7, 4804–4824. [Google Scholar] [CrossRef] [PubMed]
- Goodenough, J.B. Rechargeable batteries: Challenges old and new. J. Solid State Electrochem. 2012, 16, 2019–2029. [Google Scholar] [CrossRef]
- Lyakhov, A.O.; Oganov, A.R.; Stokes, H.T.; Zhu, Q. New developments in evolutionary structure prediction algorithm USPEX. Comput. Phys. Commun. 2013, 184, 1172–1182. [Google Scholar] [CrossRef]
- Hazen, R.M.; Morrison, S.M.; Prabhu, A.; Williams, J.R.; Wong, M.L.; Krivovichev, S.V.; Bermanec, M. On the Attributes of Mineral Paragenetic Modes. Can. J. Mineral. Petrol. 2023, 61, 653–673. [Google Scholar] [CrossRef] [PubMed]
- Hazen, R.M.; Morrison, S.M. On the paragenetic modes of minerals: A mineral evolution perspective. Am. Mineral. 2022, 107, 1262–1287. [Google Scholar] [CrossRef]
- Hazen, R.M.; Papineau, D.; Bleeker, W.; Downs, R.T.; Ferry, J.M.; McCoy, T.J.; Sverjensky, D.A.; Yang, H. Mineral evolution. Am. Mineral. 2008, 93, 1693–1720. [Google Scholar] [CrossRef]
- Urusov, V.S. Symmetry statistics of mineral species and the evolutionary dissymmetrization of mineral matter. Geol. Ore Depos. 2007, 49, 497–504. [Google Scholar] [CrossRef]
- Bermanec, M.; Vidović, N.; Gavryliv, L.; Morrison, S.M.; Hazen, R.M. Evolution of symmetry index in minerals. Geosci. Data J. 2024, 11, 69–85. [Google Scholar] [CrossRef]
- Hummer, D.R. Fractal distribution of mineral species among the crystallographic point groups. Am. Mineral. 2021, 106, 1574–1579. [Google Scholar] [CrossRef]
- Baur, W.H.; Tillmanns, E.T.; Hofmeister, W. Topological analysis of crystal structures. Acta Cryst. 1983, B39, 669–674. [Google Scholar] [CrossRef]
- Estevez-Rams, E.; Gonzalez-Ferez, R. On the concept of long-range order in solids: The use of algorithmic complexity. Z. Krist. 2009, 224, 179–184. [Google Scholar] [CrossRef]
- Krivovichev, S.V. Structural complexity of minerals: Information storage and processing in the mineral world. Min. Mag. 2013, 77, 275–326. [Google Scholar] [CrossRef]
- Krivovichev, S.V. Structural complexity of minerals and mineral parageneses: Information and its evolution in the mineral world. In Highlights in Mineralogical Crystallography; Danisi, R., Armbruster, T., Eds.; Walter de Gruyter: Berlin, Germany, 2015; pp. 31–73. [Google Scholar]
- Tschauner, O. Pressure-Dependent Crystal Radii. Solids 2023, 4, 235–253. [Google Scholar] [CrossRef]
- Pauling, L. The theoretical prediction of the physical properties of many-electron atoms and ions. Proc. R. Acad. Ser. A 1927, 114, 181–211. [Google Scholar]
- Shannon, R.D. Revised effective ionic-radii and systematic studies of interatomic distances in halides and chalcogenides. Acta Cryst. A 1976, 32, 751–767. [Google Scholar] [CrossRef]
- Available online: https://icsd.fiz-karlsruhe.de (accessed on 2 April 2024).
- Available online: https://mindat.org (accessed on 19 May 2024).
- Tschauner, O. Systematics of Crystalline Oxide and Framework Compression. Crystals 2024, 14, 140. [Google Scholar] [CrossRef]
- Tschauner, O.; Ma, C. Discovering High-Pressure and High-Temperature Minerals. In Celebrating the International Year of Mineralogy; Bindi, L., Cruciani, G., Eds.; Springer: Berlin/Heidelberg, Germany, 2023; pp. 169–206. [Google Scholar]
- Hawthorne, F.C. Hydrogen, the Principal Agent of Structural and Chemical Diversity in Minerals. In Celebrating the International Year of Mineralogy; Bindi, L., Cruciani, G., Eds.; Springer: Berlin/Heidelberg, Germany, 2023; pp. 327–359. [Google Scholar]
- Bermanec, M.; Vidović, N.; Ma, X.; Hazen, R.M. The Average Symmetry Index of Minerals Co-Varies with Their Hydrogen Content, Rarity, and Paragenetic Mode. Minerals 2024, 14, 387. [Google Scholar] [CrossRef]
- Tschauner, O. Corresponding States for Volumes of Elemental Solids at Their Pressures of Polymorphic Transformations. Crystals 2022, 12, 1698. [Google Scholar] [CrossRef]
- Clementi, E.; Raimondi, D.L. Atomic Screening Constants from SCF Functions. J. Chem. Phys. 1963, 38, 2686–2689. [Google Scholar] [CrossRef]
- Rahm, M.; Zeng, T.; Hoffmann, R. Electronegativity Seen as the Ground-State Average Valence Electron Binding Energy. J. Am. Chem. Soc. 2019, 141, 342–351. [Google Scholar] [CrossRef] [PubMed]
| Phase | Z | Icmplx | ISG | Vion [Å3] | V [Å3] |
|---|---|---|---|---|---|
| CaSiO3 Davemaoite | 1 | 2.13872 | 0.03472 | 38.23544 | 74.1 |
| Cu1−xFexS4 Isocubanite | 4 | 5.99751 | 0.04167 | 22.3364 | 148.04 |
| FeS, NiAs-type | 2 | 6.01746 | 0.07833 | 23.84129 | 61.19 |
| ThO2 Thorianite | 4 | 7.66796 | 0.03125 | 38.0769 | 175.92 |
| FeS Mackinawite | 2 | 9.08926 | 0.125 | 22.56732 | 67.92 |
| SiO2 Stishovite | 2 | 9.58896 | 0.1875 | 15.872 | 46.61 |
| SiO2 β-Quartz | 3 | 28.0573 | 0.5 | 15.48049 | 113.53 |
| (Ni,Fe)9S8 Pentlandite | 2 | 37.25551 | 0.03186 | 362.9161 | 1032.6 |
| γ-Al2O3 | 10 | 40.36082 | 0.09722 | 25.7689 | 500.94 |
| MgAl2O4 Spinel | 8 | 42.76356 | 0.09722 | 34.12799 | 527.28 |
| SiO2 α-Quartz | 3 | 56.1146 | 0.75 | 15.48049 | 113.25 |
| KAlSiO4 Kalsilite | 2 | 64.0879 | 0.40404 | 49.22811 | 200.51 |
| (Fe,Ni)3+xS4 Smythite | 3 | 64.91754 | 0.14583 | 92.10339 | 359.76 |
| FeS2 Pyrite | 4 | 68.52611 | 0.25 | 42.53511 | 159.04 |
| MgCO3 Magnesite | 6 | 72.06815 | 0.27778 | 26.8402 | 279.43 |
| Cu2FeSnS4 Stannite | 2 | 75.30975 | 0.25 | 93.49162 | 317.98 |
| SiO2 α-Cristobalite | 4 | 76.71165 | 0.75 | 15.872 | 153.15 |
| CaCO3 Calcite | 6 | 82.2767 | 0.27778 | 30.64215 | 366.63 |
| CuFeS2 Chalkopyrite | 4 | 95.73091 | 0.3333 | 44.57059 | 291.57 |
| LaAlO3 | 6 | 102.0812 | 0.27778 | 38.01764 | 326.93 |
| FeS2 Markasite | 2 | 102.7892 | 0.75 | 42.53511 | 81.63 |
| (Ca1.29, U0.50…) (Ti1.09, Nb0.79…) O6 (O0.98, F0.02) Betafite | 8 | 105.448 | 0.10417 | 78.54114 | 1081.21 |
| Al2O3 Corundum | 6 | 111.6213 | 0.41667 | 27.71396 | 255.89 |
| Al2O3 Corundum 2170K | 6 | 111.6214 | 0.41667 | 27.71396 | 269.66 |
| Al2O3 Corundum 1173 | 6 | 111.6222 | 0.41667 | 27.71396 | 260.6 |
| CoAsS Pa3 | 4 | 112.4699 | 0.27777 | 62.83221 | 173.93 |
| CaTiO3 Perovskite | 4 | 117.0592 | 0.625 | 29.0641 | 224.63 |
| CaCO3 Aragonite | 4 | 130.7108 | 0.625 | 32.45361 | 226.97 |
| CoAsS P23 | 4 | 134.9541 | 0.3333 | 62.83221 | 173.93 |
| Mg2SiO4 Forsterite | 4 | 135.4082 | 0.58333 | 36.02152 | 289.58 |
| Forsterite 948K | 4 | 138.2444 | 0.58333 | 36.77582 | 295.83 |
| FeTiO3 Ilmenite | 6 | 155.4843 | 0.55556 | 28.95314 | 315.84 |
| Na6(AlSi O4)6 Sodalite, anhydrous | 1 | 177.354 | 0.4583 | 240.2053 | 759.05 |
| Mg2Al3(AlSi5O18) Cordierite | 2 | 215.8368 | 0.4524 | 148.0691 | 771.68 |
| SiO2 Moganite | 12 | 276.1619 | 0.9 | 15.872 | 455.99 |
| MgSiO3 Protoenstatite 1633K | 8 | 276.573 | 0.83333 | 25.75101 | 447.57 |
| Ca(Al2Si2O8) Dmisteinbergite | 4 | 283.7405 | 0.48485 | 90.81244 | 333.67 |
| Ca(Al2Si2O8) Svyatoslavite | 2 | 292.6064 | 1 | 90.81244 | 355.23 |
| SiO2 Coesite | 16 | 319.9136 | 0.8214 | 15.10948 | 549.47 |
| CuFe2S3 Cubanite | 4 | 324.1224 | 0.75 | 67.06243 | 447.97 |
| MgSiO3 Clinoenstatite (LP) | 8 | 324.7162 | 1 | 25.19448 | 418.16 |
| κ-Al2O3 | 8 | 331.0387 | 1 | 25.68504 | 361.3 |
| Al13Si5O20(OH,F)18Cl Zunyite | 4 | 339.0025 | 0.2788 | 188.6869 | 2665.61 |
| K(AlSi3O8) Orthoclase | 4 | 399.0778 | 0.8125 | 76.21943 | 715.15 |
| CoAsS Cobaltite | 4 | 404.9029 | 1 | 62.83221 | 173.93 |
| FeAsS Arsenopyrite | 4 | 407.2117 | 1 | 63.19049 | 175.46 |
| Cu6(Cu4Fe2)Sb4S13Tetrahedrite | 2 | 445 | 0.22917 | 602.65 | 1071.23 |
| Na3K(Al4Si4O16)Nepheline | 2 | 446.2287 | 0.90909 | 152.3392 | 726.25 |
| Sc2O3 Kangite | 16 | 470.4255 | 0.55556 | 32.8497 | 954.1 |
| Si24O48 | 24 | 477.9892 | 0.81818 | 15.10948 | 1386.3 |
| Na4Al3Si9O24Cl Marialite | 2 | 482.812 | 0.6406 | 233.9121 | 1093.33 |
| SiO2 Linde-L framework | 1 | 513.061 | 0.45076 | 706.5085 | 2204.67 |
| SiO2 Chabasite | 36 | 525.7893 | 0.6 | 15.10948 | 2337.86 |
| K2Cr2O7 Lopezite | 4 | 536.1572 | 1 | 83.20006 | 733.82 |
| Mg3Al2Si3O12 Pyrope | 8 | 604.4317 | 0.41667 | 112.5537 | 1503.48 |
| MgSiO3 Enstatite | 16 | 649.4323 | 1 | 25.19448 | 832.49 |
| NaMg3Al6(Si6O18)(BO3)3(OH)3(OH) Dravite | 3 | 744.5194 | 0.631 | 244.1276 | 1600 |
| SiO2 ZSM48 | 48 | 751.1308 | 0.64286 | 15.10948 | 2409.07 |
| SiO2 PTS_24 | 4 | 755.4774 | 0.70536 | 166.2043 | 2395.23 |
| SiO2 Ferrierite | 36 | 788.6839 | 0.9 | 15.10948 | 1952.36 |
| Cu3AsS4 Enargite | 2 | 921.18 | 1 | 285.89 | 293.97 |
| K0.04Al0.06Si0.44O STA-30 | 144 | 1018.365 | 0.5141 | 8.53856 | 4428.3 |
| SiO2 | 64 | 1099.686 | 0.70588 | 15.10948 | 3680.06 |
| Fe7S8 | 4 | 1132.578 | 0.9375 | 187.4685 | 696.84 |
| Mg4(Mg3Al9)O4[Si3Al9O36] Sapphirine | 4 | 1166.724 | 1 | 181.0504 | 1312.11 |
| CaAl2Si2O8 Anorthite | 8 | 1202.271 | 1 | 93.28329 | 1342 |
| SiO2 SSZ_58 | 74 | 1315.5 | 0.7303 | 15.10948 | 4035.5 |
| Ti2O3 Panguite | 16 | 1317.65 | 1 | 51.11772 | 938.69 |
| Fe1−x S Pyrrhotite-5C | 4 | 1441.106 | 0.951 | 235.1511 | 1181.93 |
| KAlSi2O6 Leucite | 16 | 1578.023 | 1 | 61.21882 | 2356 |
| SiO2 EU1-framework | 112 | 1846.86 | 0.67742 | 15.10948 | 6169.52 |
| SiO2 ZSM11-framework | 96 | 1911.957 | 0.81818 | 15.10948 | 5400.4 |
| Na2B2Si2O6 | 24 | 1938.914 | 0.75 | 66.86172 | 3058 |
| SiO2 Dodecasile | 136 | 2009.82 | 0.6071 | 15.10948 | 7303.64 |
| (K,Na)AlSiO4 Panunzite | 32 | 2030.274 | 0.875 | 45.00784 | 3110.17 |
| SiO2 ZSM5-framework 70K | 88 | 2212.032 | 0.94738 | 16.46933 | 5394.38 |
| SiO2 ZSM5-framework | 96 | 2413.125 | 0.94738 | 16.46933 | 5386.53 |
| Si0.73Al0.27O2 Linde-Y | 192 | 2595.843 | 0.526 | 15.95449 | 14451.9 |
| Cs7AsMo8O30 | 8 | 2677.822 | 0.5 | 415.5403 | 6773.13 |
| Si152O292 | 1 | 2691.434 | 0.75676 | 2207.592 | 9088.23 |
| K3YB6O12 | 15 | 2794.109 | 0.797 | 145.0726 | 4583.29 |
| LiRbP2O6 | 32 | 3437.44 | 1 | 66.67709 | 4586.48 |
| KCoPO4 | 48 | 3620.86 | 1 | 46.8233 | 4736.48 |
| Pb4Zn8P8O32 | 8 | 3862.882 | 1 | 299.7181 | 5793.63 |
| CuP2O4F4 | 48 | 4027.021 | 0.8889 | 58.5843 | 8454.3 |
| SiO2 Faujasite | 1 | 4206.314 | 0.9 | 2901.02 | 14292 |
| Mn11Na4.35(PO4)9 | 12 | 4254.594 | 0.891 | 246.9964 | 8859.67 |
| Na96(BePO4)96 | 1 | 4258.52 | 0.74 | 3572.058 | 12,760.41 |
| LiPbB9O15 | 24 | 4269.365 | 0.852 | 129.5997 | 6978.43 |
| Cs12Zn4B20O40 | 4 | 4305.496 | 1 | 668.1203 | 4947.65 |
| CsTi2P3O12 | 32 | 4681.997 | 0.7037 | 129.058 | 7891.3 |
| CsTi2As3O12 | 32 | 4838.574 | 0.7037 | 133.3741 | 8608.82 |
| Rb3Sc2As3O12 | 16 | 5756.523 | 0.765 | 291.9244 | 4805.33 |
Disclaimer/Publisher’s Note: The statements, opinions and data contained in all publications are solely those of the individual author(s) and contributor(s) and not of MDPI and/or the editor(s). MDPI and/or the editor(s) disclaim responsibility for any injury to people or property resulting from any ideas, methods, instructions or products referred to in the content. |
© 2024 by the authors. Licensee MDPI, Basel, Switzerland. This article is an open access article distributed under the terms and conditions of the Creative Commons Attribution (CC BY) license (https://creativecommons.org/licenses/by/4.0/).
Share and Cite
Tschauner, O.; Bermanec, M. Crystal Structure Complexity and Approximate Limits of Possible Crystal Structures Based on Symmetry-Normalized Volumes. Materials 2024, 17, 2618. https://doi.org/10.3390/ma17112618
Tschauner O, Bermanec M. Crystal Structure Complexity and Approximate Limits of Possible Crystal Structures Based on Symmetry-Normalized Volumes. Materials. 2024; 17(11):2618. https://doi.org/10.3390/ma17112618
Chicago/Turabian StyleTschauner, Oliver, and Marko Bermanec. 2024. "Crystal Structure Complexity and Approximate Limits of Possible Crystal Structures Based on Symmetry-Normalized Volumes" Materials 17, no. 11: 2618. https://doi.org/10.3390/ma17112618