Article

Enhancing the Mechanical Properties of AM60B Magnesium Alloys through Graphene Addition: Characterization and Regression Analysis

by
Song-Jeng Huang
,
Jeffry Sanjaya
*,
Yudhistira Adityawardhana
and
Sathiyalingam Kannaiyan
*
Department of Mechanical Engineering, National Taiwan University of Science and Technology, Taipei 106336, Taiwan
*
Authors to whom correspondence should be addressed.
Materials 2024, 17(18), 4673; https://doi.org/10.3390/ma17184673
Submission received: 26 August 2024 / Revised: 19 September 2024 / Accepted: 20 September 2024 / Published: 23 September 2024

Abstract

:
The light weight and high strength of magnesium alloys have garnered significant attention, rendering them suitable for various applications across industries. Nevertheless, to meet industrial requirements, the mechanical properties must be improved. This investigation explores the potential of graphene addition to enhance the mechanical properties of AM60B magnesium alloy. Tests were conducted on samples with different weight percentages (wt.%) of graphene (0 wt.%, 0.1 wt.%, and 0.2 wt.%) using stir casting. The elongation and tensile strength of the composite materials were also assessed. The phase composition, particle size, and agglomeration phenomena were analyzed using characterization techniques such as X-ray diffraction, optical microscopy, and SEM-EDS. The yield strength of the magnesium alloy was enhanced by approximately 13.4% with the incorporation of 0.1 wt.% graphene compared to the alloy without graphene. Additionally, an 8.8% increase in elongation was observed. However, the alloy tensile properties were reduced by adding 0.2 wt.% graphene. The tensile fractography results indicated a higher probability of brittle fracture with 0.2 wt.% graphene. Furthermore, regression analysis employing machine learning techniques revealed the potential of predicting the stress–strain curve of composite materials.

1. Introduction

Magnesium alloys are known for their light weight and high specific strength and have garnered significant attention for various applications in industries such as automotive, aerospace and biomedical [1,2,3]. Among these alloys, AM60B stands out due to its favorable mechanical properties and corrosion resistance, making it a popular choice for structural applications. However, to meet the evolving demands of these industries, further enhancement of their mechanical properties is necessary [4].
Recent advancements have shown that the incorporation of nano-reinforcements such as graphene can significantly improve the mechanical performance of metal matrix composites (MMCs) [5]. Graphene, which exhibits exceptional mechanical strength and electrical properties, has emerged as a promising reinforcement material [6]. The addition of graphene to magnesium alloys enhances their properties such as yield strength, tensile strength, and ductility [7]. However, the optimal concentration of graphene and its interaction with the matrix material require careful investigation to maximize these benefits without introducing adverse effects like agglomeration [8].
The main hypothesis of this study is that small additions of graphene (specifically 0.1 wt.%) can significantly improve the mechanical properties of AM60B magnesium alloy by enhancing dislocation movement and strengthening grain boundaries. However, we expect that at higher concentrations (such as 0.2 wt.% and above), graphene may lead to agglomeration, which would offset the reinforcing benefits and result in a deterioration of the alloy’s mechanical performance. This hypothesis is supported by conflicting results in the literature: some studies suggest that increased graphene content leads to better material properties [9], while others have expressed that excess graphene may result in decreased ductility due to its tendency to agglomerate [10].
In this study, the mechanical properties of AM60B alloy with varying graphene contents (0 wt.%, 0.1 wt.%, and 0.2 wt.%) were evaluated through yield strength, tensile strength, and elongation measurements. The primary objective was to determine the optimal graphene concentration that maximizes mechanical performance without introducing adverse effects like brittleness. Furthermore, this study aims to provide a detailed understanding of the metallurgical mechanisms underlying the performance differences across these compositions, focusing on how graphene affects dislocation behavior, load transfer mechanisms, and grain boundary interactions.
To achieve these objectives, the study employs a combination of advanced characterization techniques, including X-ray diffraction (XRD) for phase identification, scanning electron microscopy (SEM) for microstructural analysis, and energy-dispersive X-ray spectroscopy (EDS) to examine the elemental distribution of the composites [11,12]. In addition to the experimental analysis, regression modeling was applied to predict the stress–strain behavior of the composites based on the observed microstructural features and mechanical properties [13]. By integrating experimental data with regression analysis, this study not only investigated the optimal graphene content for strengthening AM60B but also contributed to understanding how nano-reinforcements can be effectively utilized in metal matrix composites.

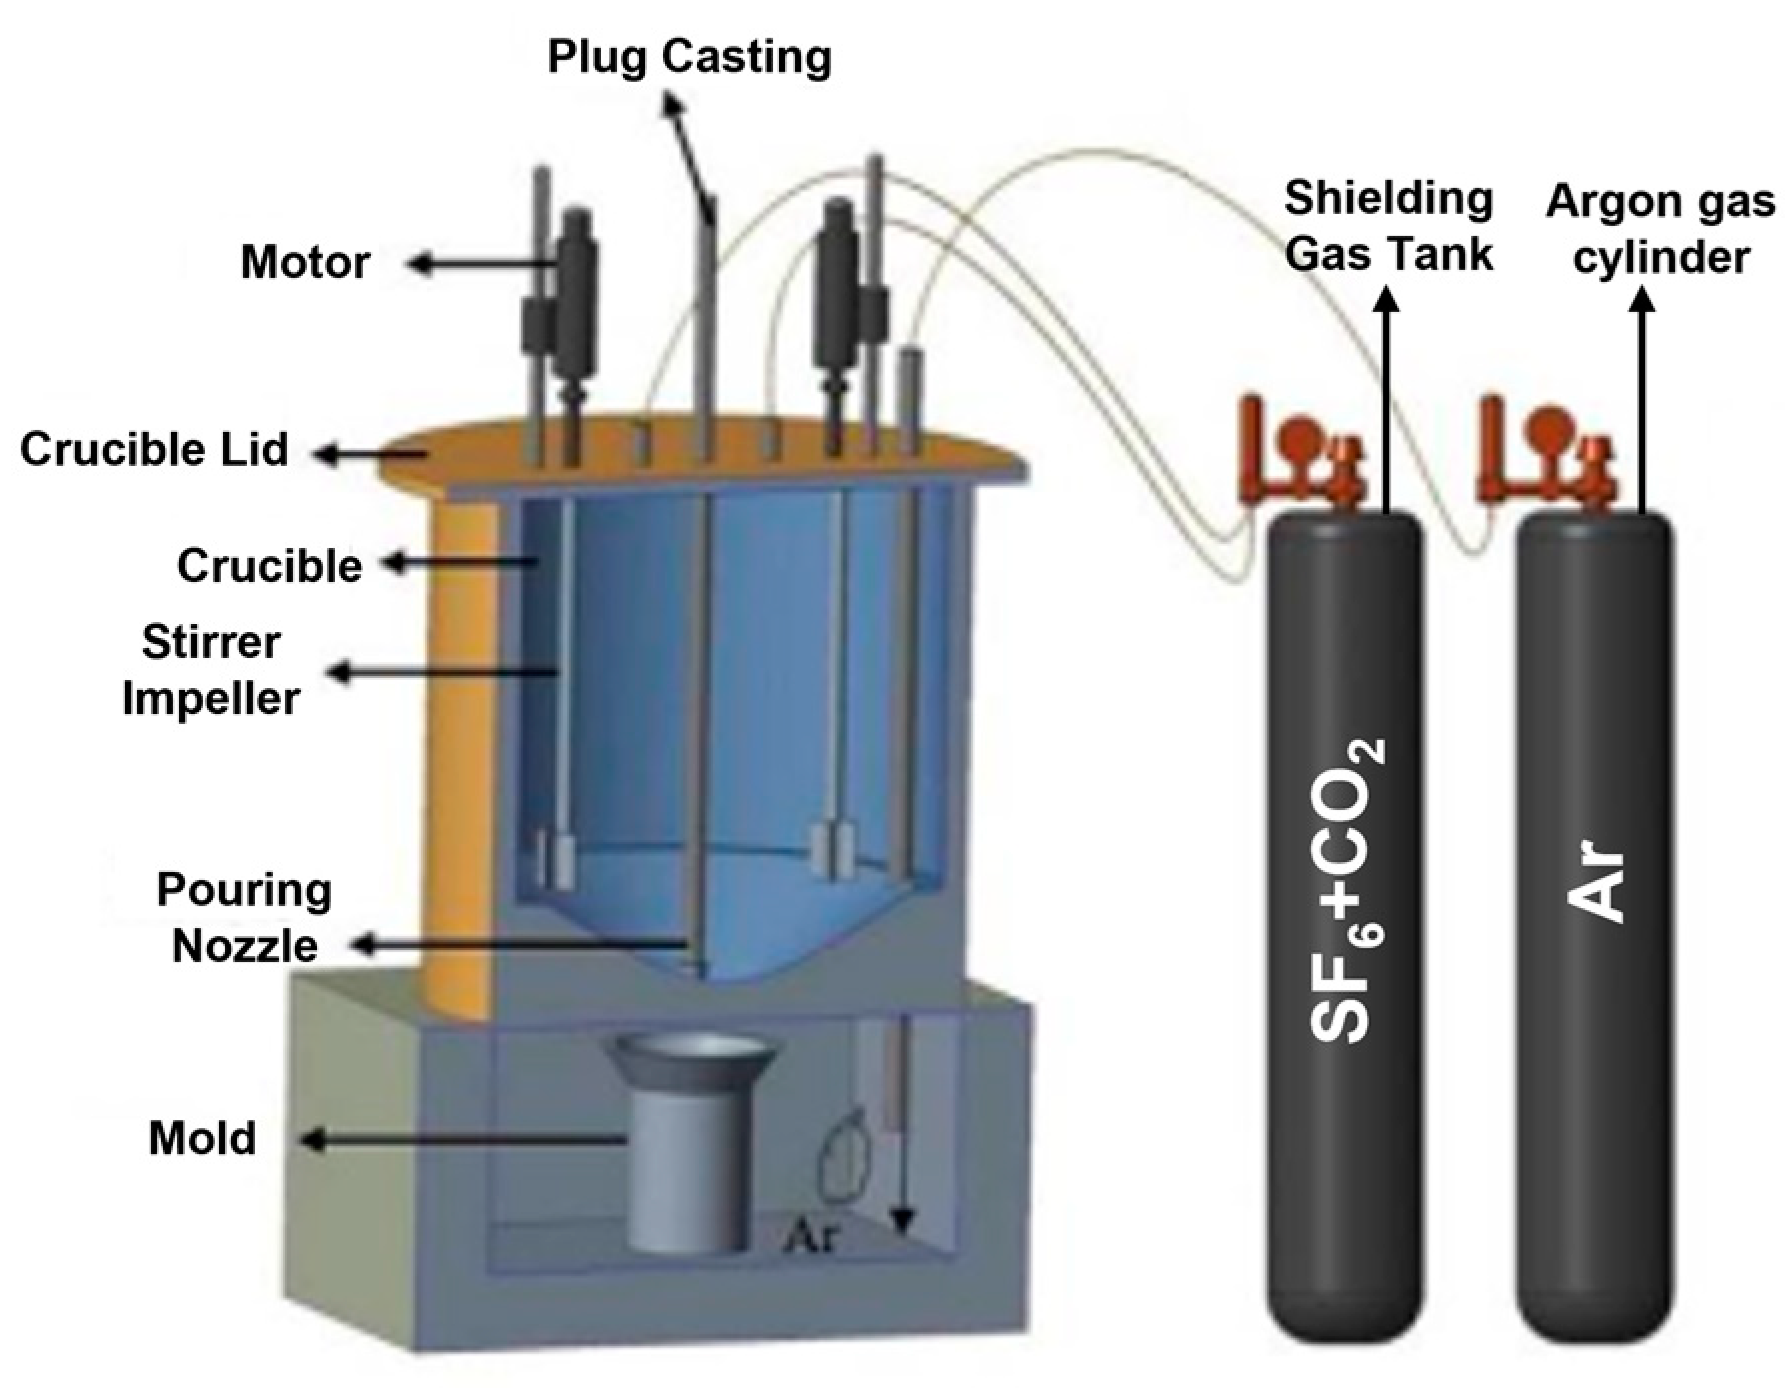
2. Materials and Methods

The base material selected for this study was AM60B magnesium alloy, known for its excellent balance of strength, ductility, and corrosion resistance, making it ideal for various structural applications. The material was purchased from Guangyu Technology Co., Ltd. (Shenzhen, China). The chemical composition of AM60B is given in Table 1. Table 2 details the compositions of the alloying elements used, expressed as percentages (wt.%).
To further enhance the mechanical properties of AM60B, graphene was selected as the reinforcement material owing to its superior mechanical properties. The graphene reinforcement was purchased from Jiehan Technology Corporation (Taichung, Taiwan), Taiwan. Composites were prepared with three different graphene contents: 0 wt.% (as a control), 0.1 wt.%, and 0.2 wt.%. This approach was used to investigate the effects of small additions of graphene on the mechanical performance and microstructure of the alloy, allowing for a comprehensive analysis of how graphene influences the material’s overall behavior.
The specific weight percentages of graphene (0.1 wt.% and 0.2 wt.%) were selected based on prior research, which indicated that higher graphene content (above 1 wt.%) could negatively affect the material’s properties. Even in earlier studies, small amounts of graphene were reported to have potentially adverse effects on composite behavior [14,15]. As a result, lower percentages of graphene were chosen to avoid these issues. Small additions of graphene can significantly enhance mechanical properties, although the effect varies depending on the matrix material. This study specifically investigates the performance of the AM60B alloy with these selected concentrations of graphene reinforcement to better understand its effects.
The composites were fabricated using the stir casting method. Initially, AM60B magnesium alloy and graphene particles were placed into a steel crucible, which was then gradually heated to 760 °C. A stabilization period of 15 min was maintained at every 100 °C rise to ensure uniform heating. At 400 °C, a protective gas mixture of carbon dioxide (CO2) and sulfur hexafluoride (SF6) was introduced to prevent the magnesium alloy from igniting [16]. As the temperature continued to rise to 700 °C, argon gas was utilized to prevent oxidation. Once the temperature reached 760 °C, the melt was mechanically stirred with two blades at 300 rpm for 5 min, ensuring a uniform dispersion of graphene particles within the AM60B alloy. The molten mixture was then poured into a mold while still in its liquid state and the solidified ingot of the composite was collected from the mold. A schematic of gravity stir casting is presented in Figure 1.
No specific method was implemented to prevent the agglomeration of graphene during fabrication. Instead, the stirring speed of 300 rpm was used to disperse the graphene within the matrix. Although this is not a standardized procedure for stirring speed, many researchers have adopted similar stirring speeds when working with composite materials that include reinforcements [15,17,18]. Graphene exhibits unique properties compared to other reinforcements, and there is limited research on how stirring speed specifically affects its distribution. Thus, the chosen speed of 300 rpm was used to focus on the metallurgical characteristics and mechanical properties produced by this stir casting process.
Figure 1. Stir casting schema used in this study [19].
Materials 17 04673 g001
For material characterization, the cast ingots were machined into billets with dimensions of 11 mm × 11 mm × 80 mm. These billets were utilized for various characterization techniques, including X-ray diffraction (XRD), optical microscopy (OM), and scanning electron microscopy (SEM), to analyze phase composition, grain size, and microstructural features. For mechanical testing, the tensile specimens were machined into a dog-bone shape according to ASTM E8-69 [20]. This standard ensures consistent dimensions and geometry of specimens, facilitating accurate and reproducible tensile testing. Dog-bone specimens were prepared to evaluate yield strength, tensile strength, and elongation at break. Figure 2 presents the specimen preparation used in this study.

3. Results

3.1. Microstructural Characterization

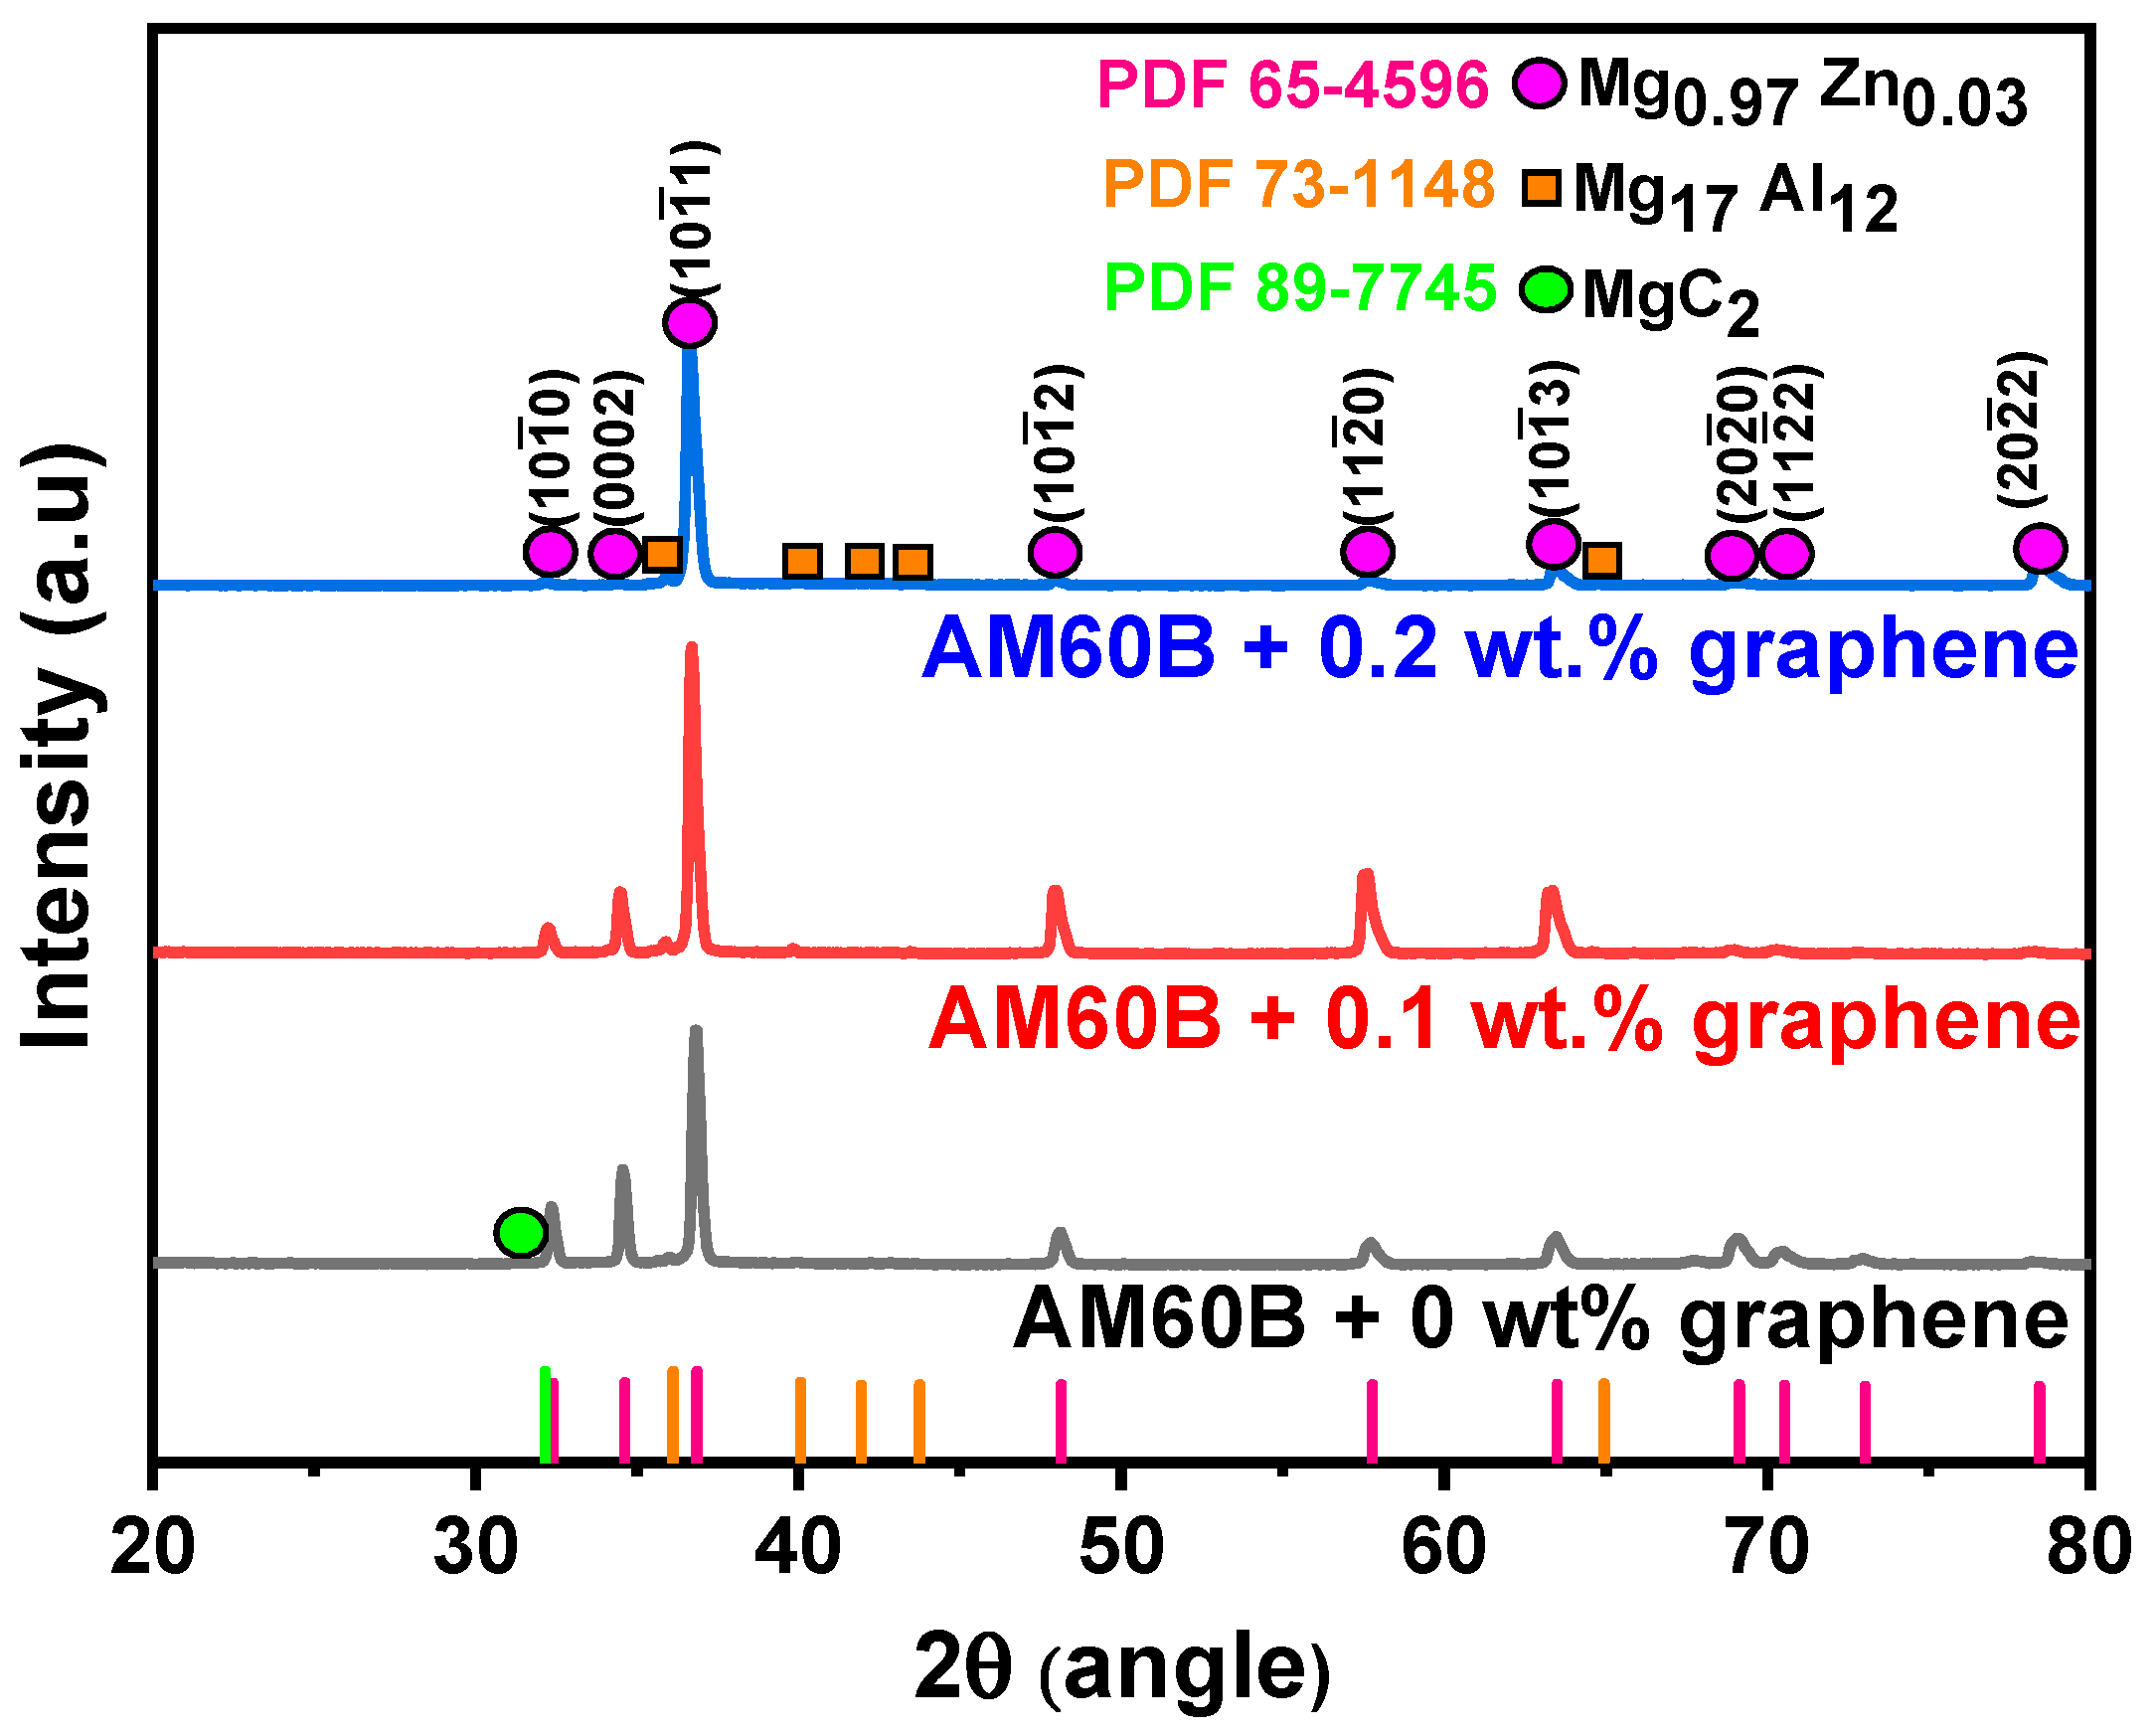
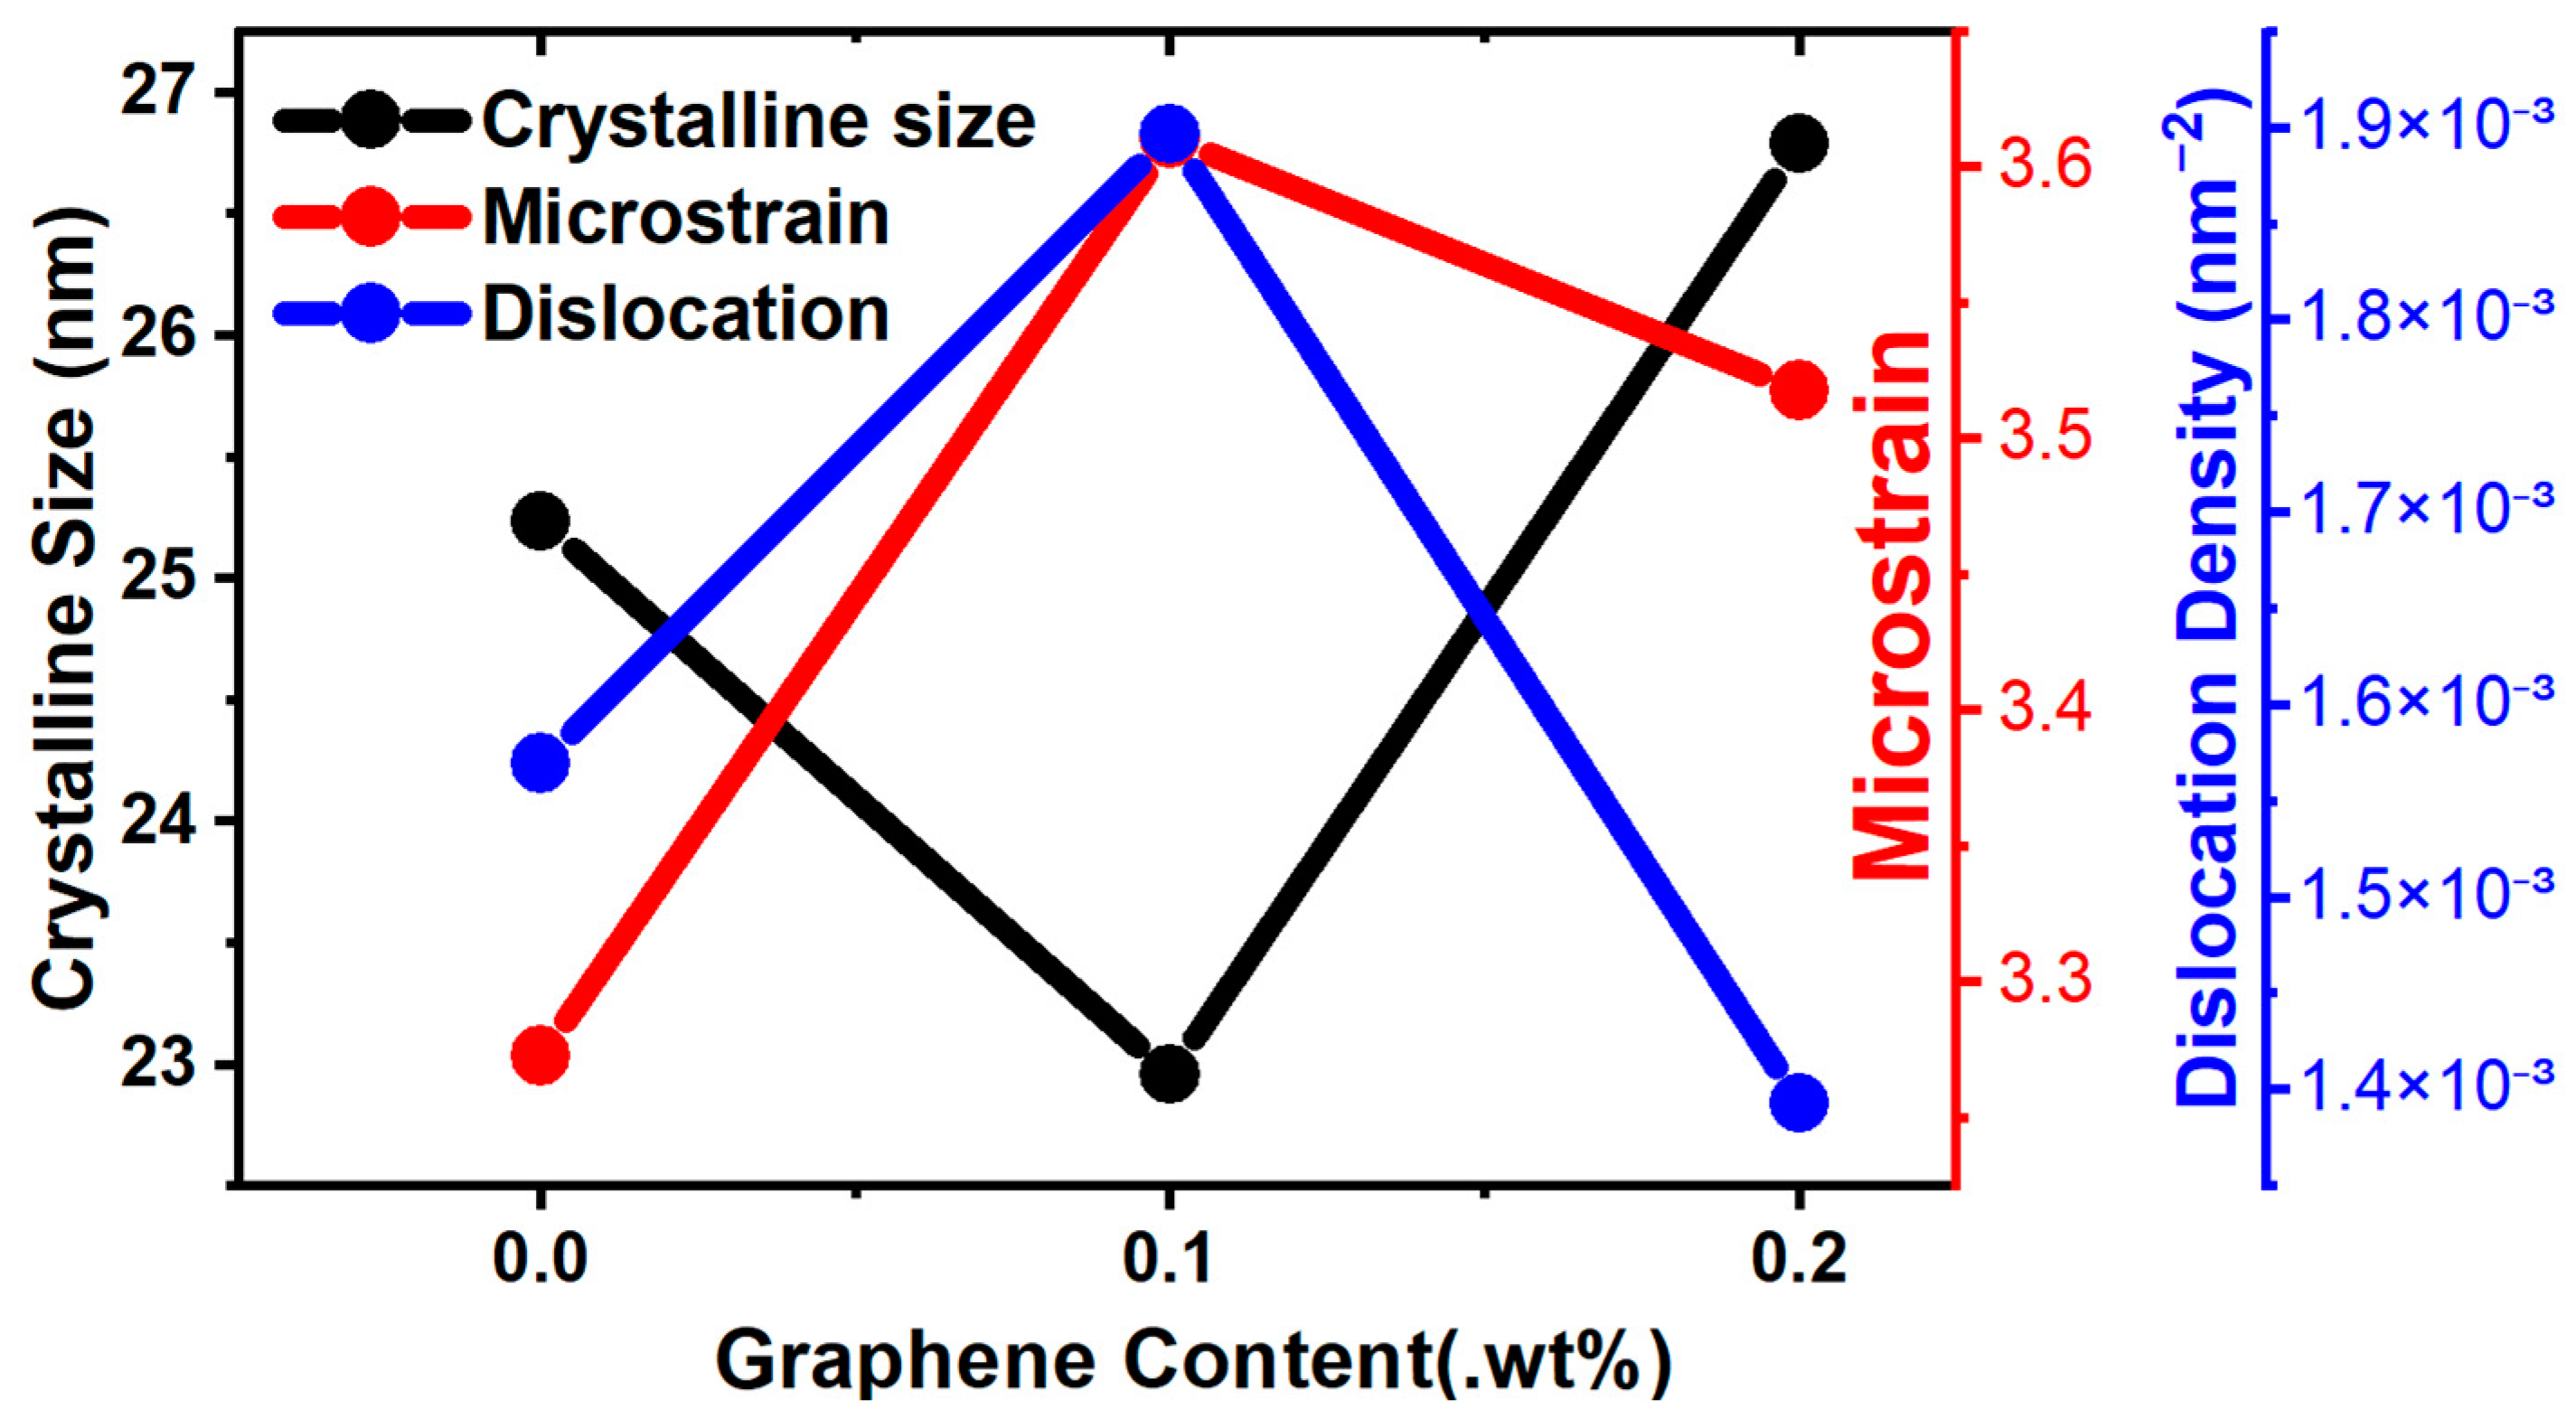
3.1.1. X-ray Diffraction

X-ray diffraction (XRD) was conducted to determine the phase proportions in the multiphase alloys used in this study, as well as to assess the crystallite size and lattice strain resulting from the addition of graphene reinforcement. Since graphene contains carbon, an initial XRD analysis was performed on the reinforcement material to confirm its composition. The XRD patterns were analyzed using a Bruker D2 PHASER X-ray Diffractometer (Bruker Co., Boston, MA, USA) to ensure accuracy in phase identification and crystallographic analysis.
Figure 3 shows the XRD pattern of graphene, which exhibits a distinct and pronounced double peak. These peaks, occurring at 26.6° and 54.79°, correspond to the (004) and (008) planes of the carbon (C) phase, respectively, confirming the presence of graphene [21]. The crystalline structure of graphene was further validated by the close agreement between these peaks with the 2θ value typically seen for the (002) plane at approximately 26.5°.
The XRD analysis of all composite samples confirmed the presence of several phases, as illustrated in Figure 4, and was conducted using Diffract EVA V4.3 software. The crystallographic planes for each peak were indexed following the Miller–Bravais system with four indices (hkil). Table 3 displays the peak positions and their corresponding phases. In all samples, the primary phase Mg0.97Zn0.03 (PDF 65–4596) and the secondary phase Mg17Al12 (PDF 73–1148) were identified [22]. Additionally, with the incorporation of graphene reinforcement, a new phase, magnesium carbide (MgC2), was anticipated based on PDF 89–7745 and supported by previous research [23]. Although the formation of this phase was expected, the graphene phase was difficult to detect in the XRD analysis due to its small concentration. Its absence does not indicate the complete lack of alloying elements; rather, the graphene content falls below the detection sensitivity of the XRD instrument.
However, phase quantification and the index plane are presented in Table 4. The reference intensity ratio method, which is well suited to bulk samples, was employed to determine the number of phases. Note that the sum of the weights of all phases must be equal to 1, and that the quantification values were governed using Equation (1):
W α = I i α R I R α c × ( k = 1 n I i k R I R k c )
On the other hand, it is important to examine the relationships among crystallite size, crystallinity, microstrain, and dislocation density, all of which can be derived from the XRD patterns. Figure 5 presents the Williamson–Hall plot, which was used to calculate the crystallite size and microstrain. The dislocation density (δ) is calculated using Equation (2), where D is the crystallite size. The Williamson–Hall plot can be represented using Equation (3):
δ = 1 D 2
βCosθ = Kλd + 4εSinθ
where β corresponds to the FWHM of each XRD peak, K represents the Scherrer constant (typically 0.9), λ denotes the wavelength of the X-ray beam (in this study, we used Cu Kα = 0.154060 nm), d denotes average crystallite size, ε shows the lattice strain, and θ denotes Bragg’s angle.
Crystallinity is highest when using a graphene percentage of 0.1 wt%. This is mostly related to the intensity shown by the same plane of the peaks from XRD, as shown in Table 5. Equation (4) is used to calculate the crystallinity index, indicating that crystallinity is the ratio of the intensity difference between the crystal peaks and the amorphous peak intensity:
C r y s t a l l i n i t y i n d e x C I =   I h k l I a m I a m × 100 %

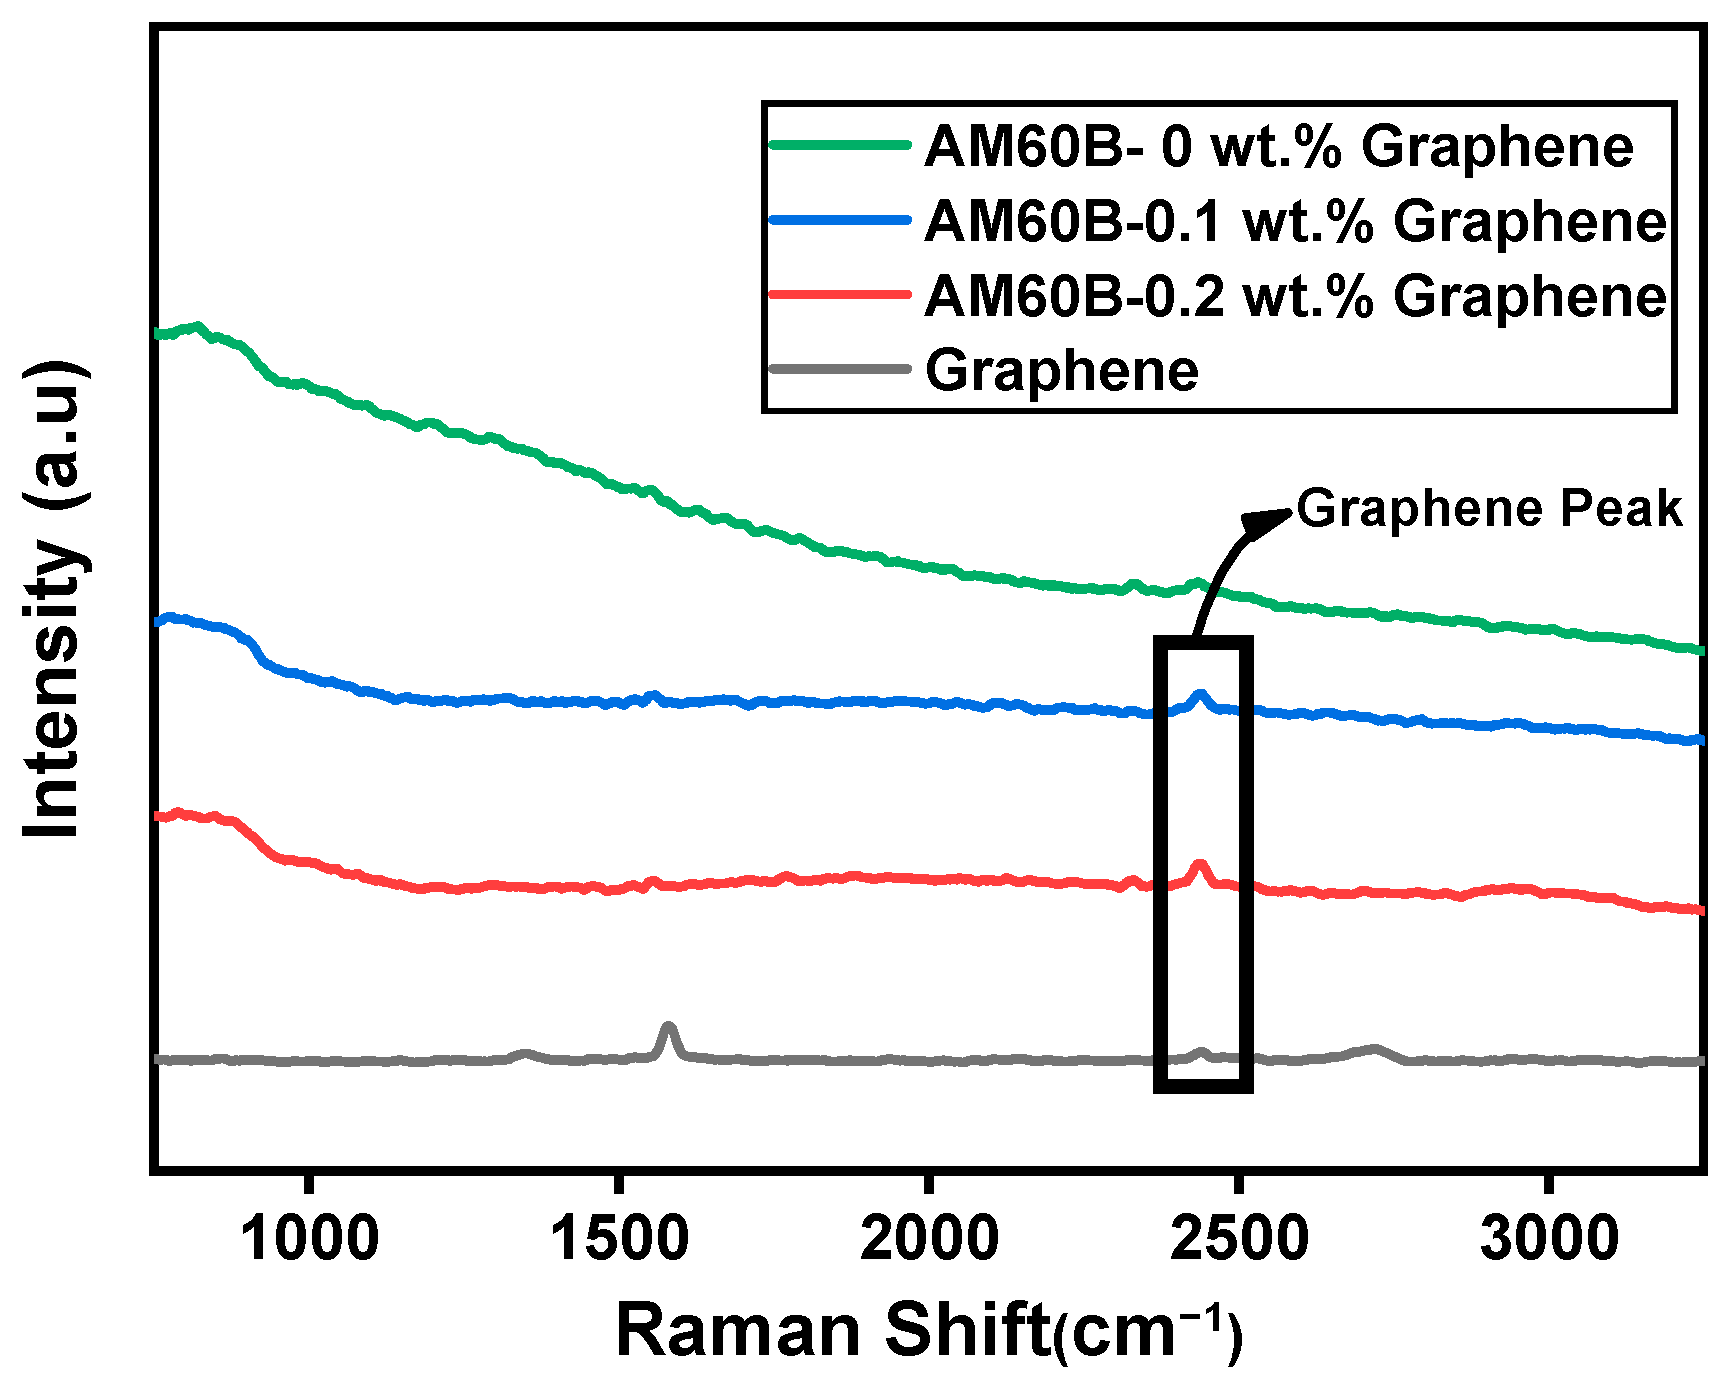
3.1.2. Raman Spectroscopy

Due to the limitations of sensitivity in XRD analysis, we employed Raman spectroscopy to further investigate the presence of the MgC2 and graphene phases. Raman spectroscopy was employed to analyze the carbon content within the material by examining the Raman shifts in the range of 1750–3750 cm−1. Raman spectroscopy was conducted using a HORIBA iHR550 spectrometer, equipped with a 532 nm laser. The results (as shown in Figure 6) exhibit a prominent Raman peak around 2435 cm−1, which is characteristic of the graphene phase. This observation is consistent with previous studies, which indicate that graphene has distinct Raman-active modes, confirming the presence of the reinforcement material. In contrast, samples without graphene reinforcement did not show significant peaks in this region. This evidence strengthens the hypothesis that the graphene phase is to be present in the reinforced sample.

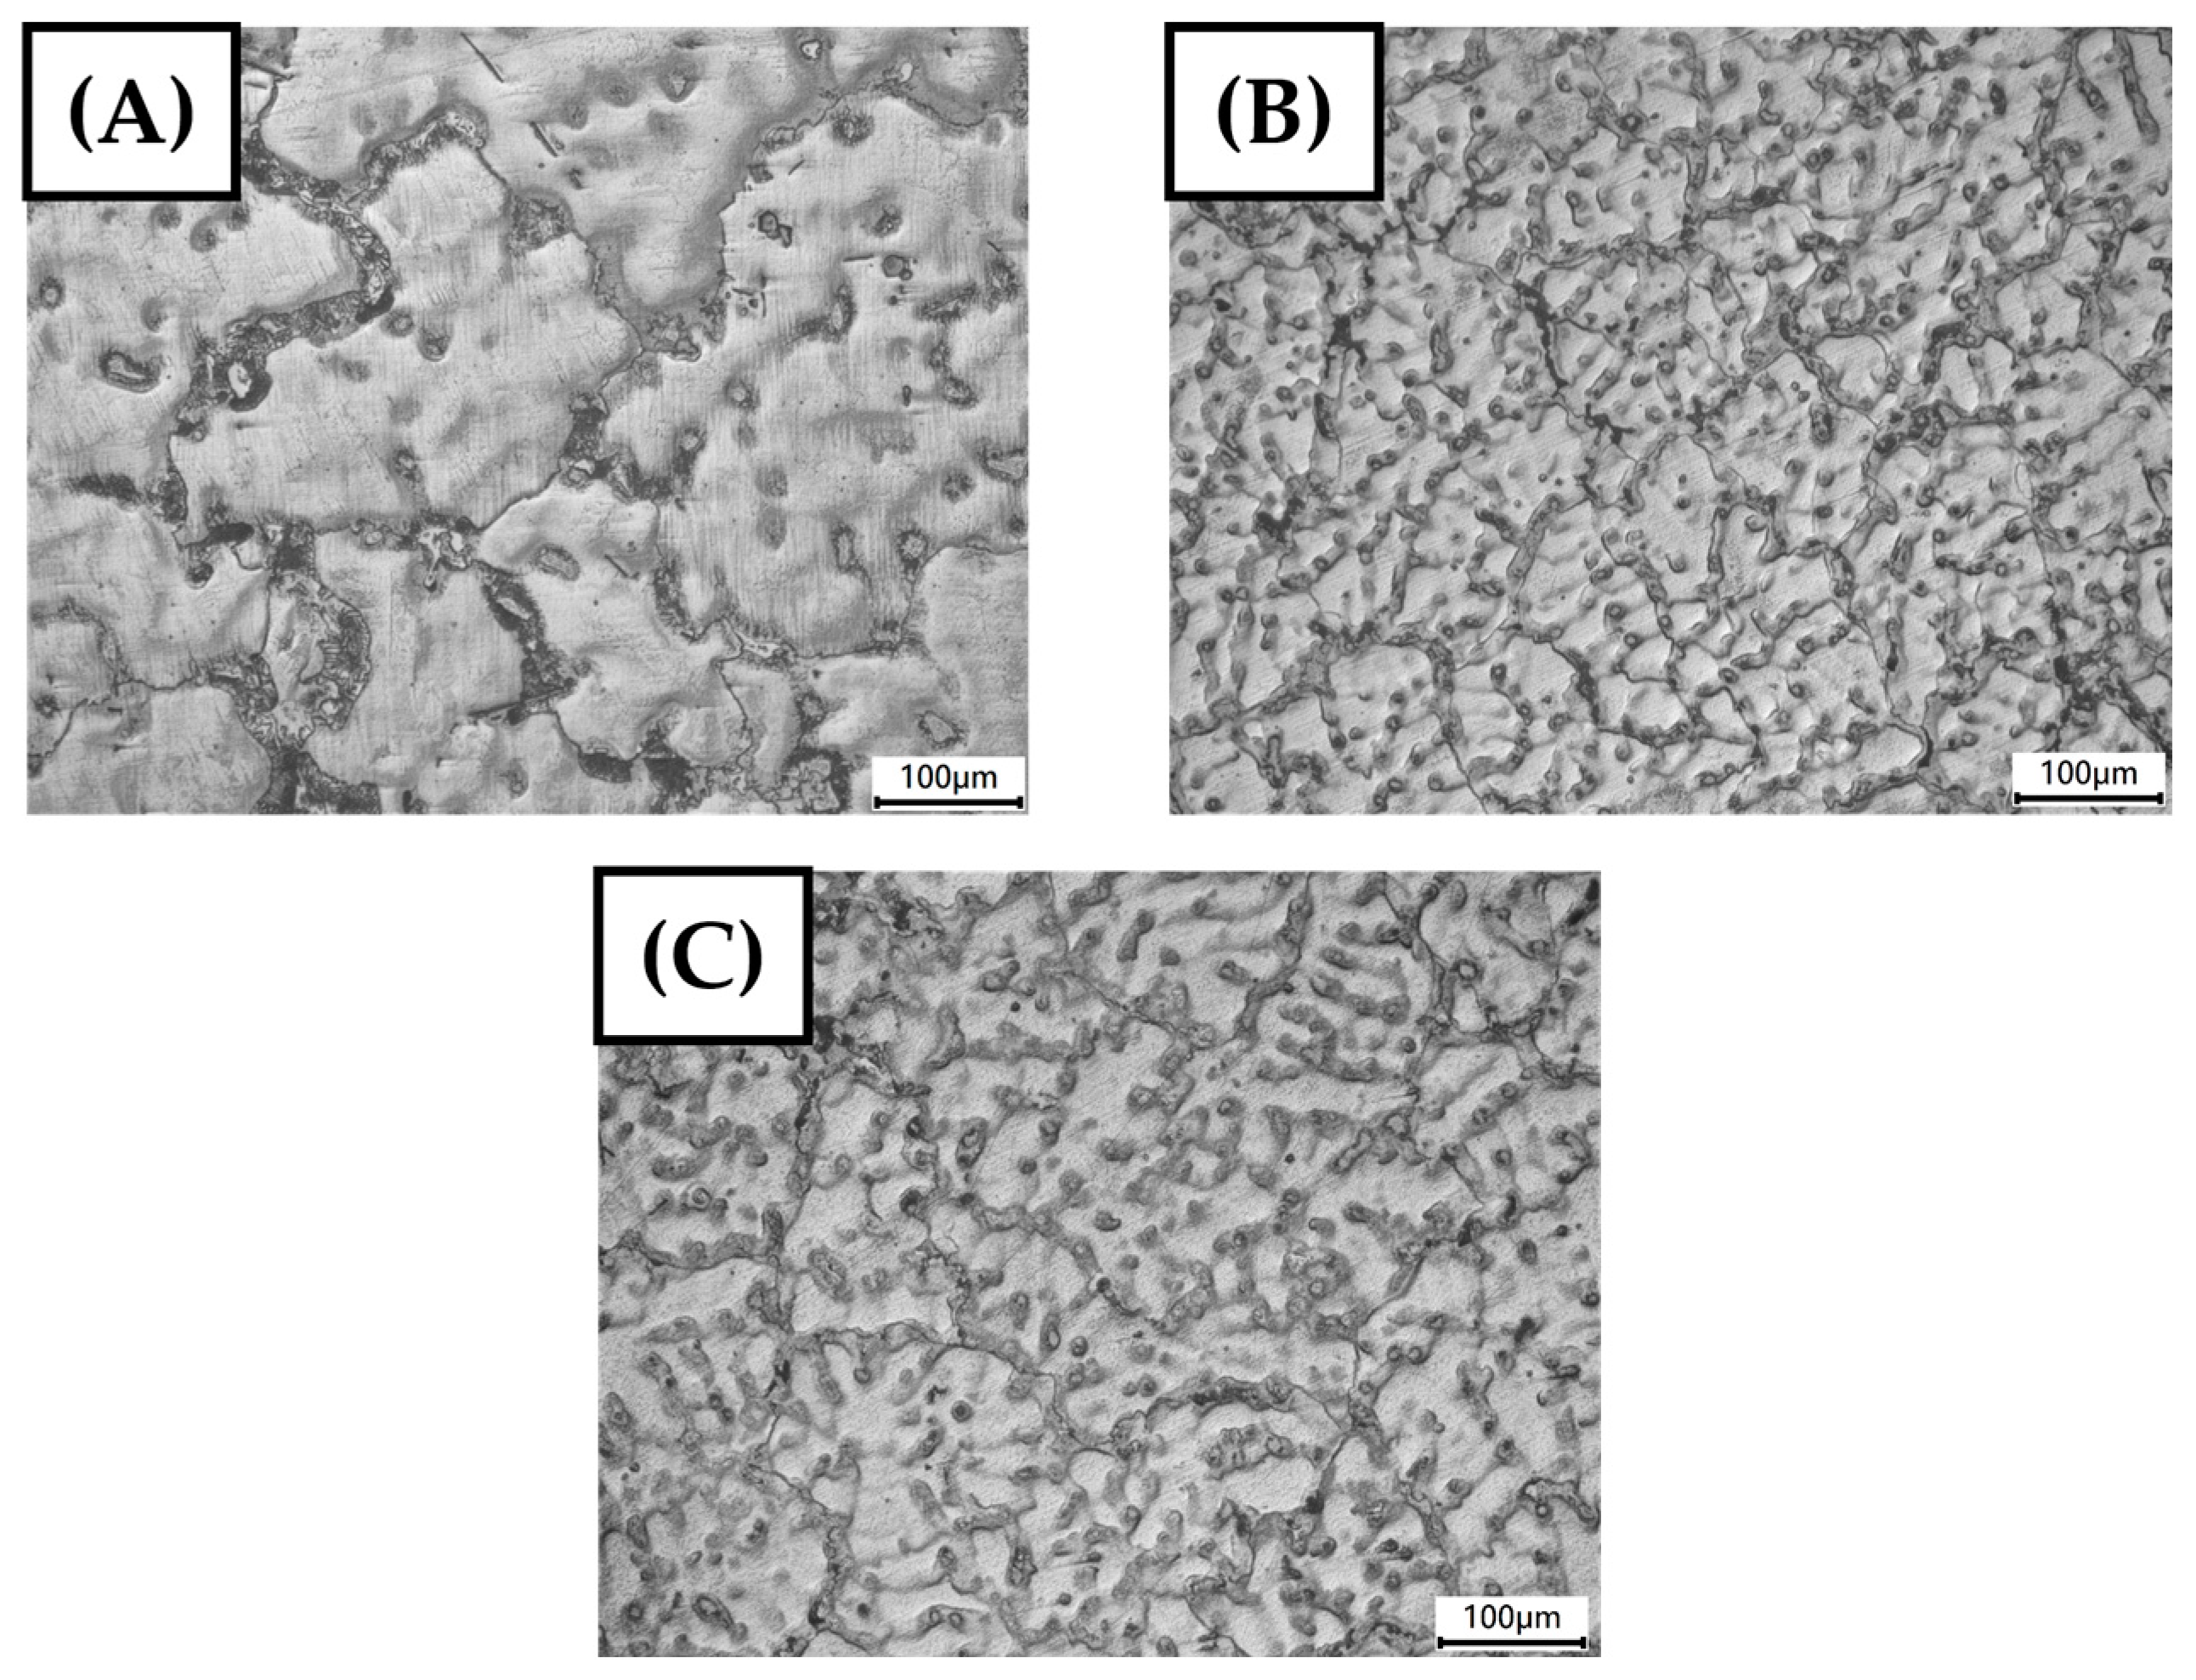
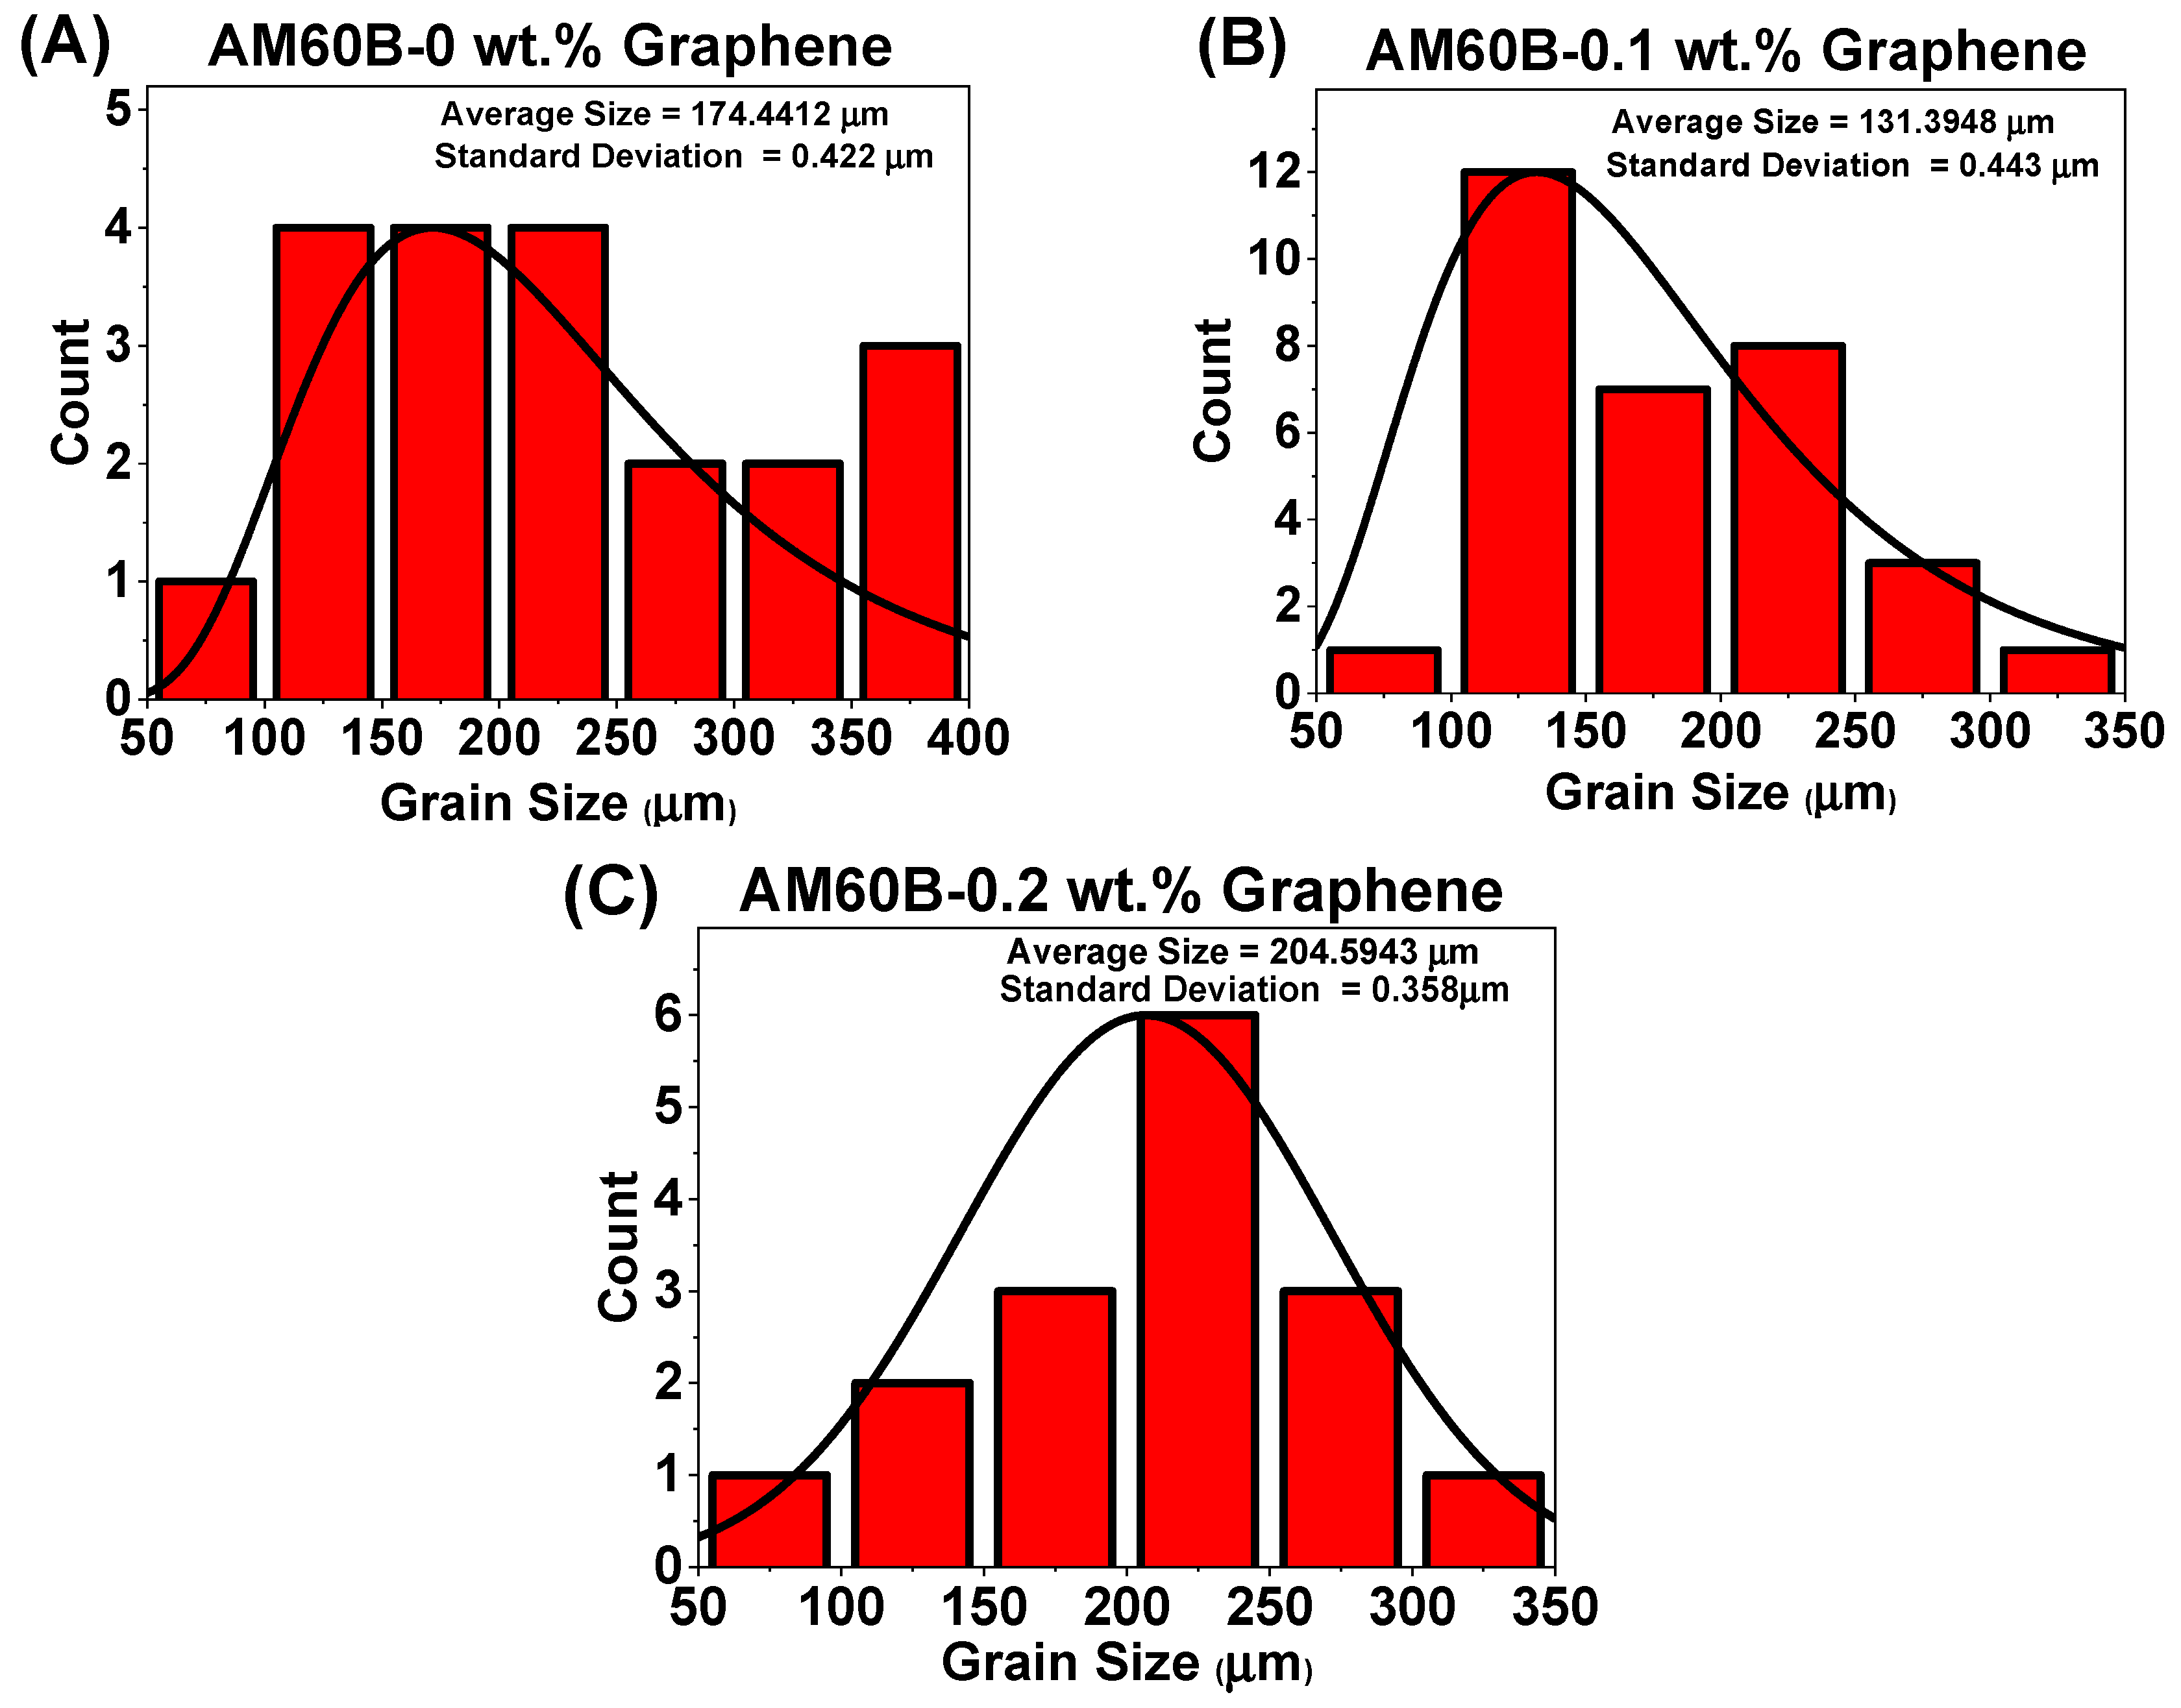
3.1.3. Optical Microscopy

The microstructural features, particularly grain size, are detailed through optical microscopy (OM) images presented in Figure 7, following the crystalline size analysis from the XRD section. OM analysis was conducted using an Olympus BX41M microscope to capture these images for visual interpretation for the microstructure feature. The graphical representation aligns well with the previous discussion. It is evident from the OM images that grain boundary strengthening occurs through the grain refinement mechanism due to the addition of graphene. This phenomenon is known as the Hall–Petch mechanism, where smaller grain sizes increase the material’s resistance to dislocation motion, enhancing its strength [24,25].
In this study, the average grain size for all composites was determined using ImageJ® version 1.54k, and the values are shown in Figure 8. The grain size distribution was plotted using a lognormal distribution due to its suitability for representing grain size data, which often exhibit a skewed distribution [26]. This distribution effectively captures the spread of grain sizes and their frequency. The standard deviation is within an acceptable range, confirming that the lognormal distribution is appropriate for calculating the grain size in this context.
It is observed that the average grain size decreases for the AM60B alloy reinforced with 0.1 wt.% graphene, indicating effective grain refinement and strengthening via the Hall–Petch mechanism. However, for the AM60B alloy with 0.2 wt.% graphene, the grain size increases, potentially leading to a reduction in mechanical performance. Previous studies have suggested that there may be a decrease in the Hall–Petch slope at extremely fine grain sizes, depending on the alloying elements and microstructural characteristics [27]. The reduction in grain size, particularly at 0.1 wt.% graphene, suggests that Hall–Petch strengthening plays a key role in enhancing the yield strength of the material.

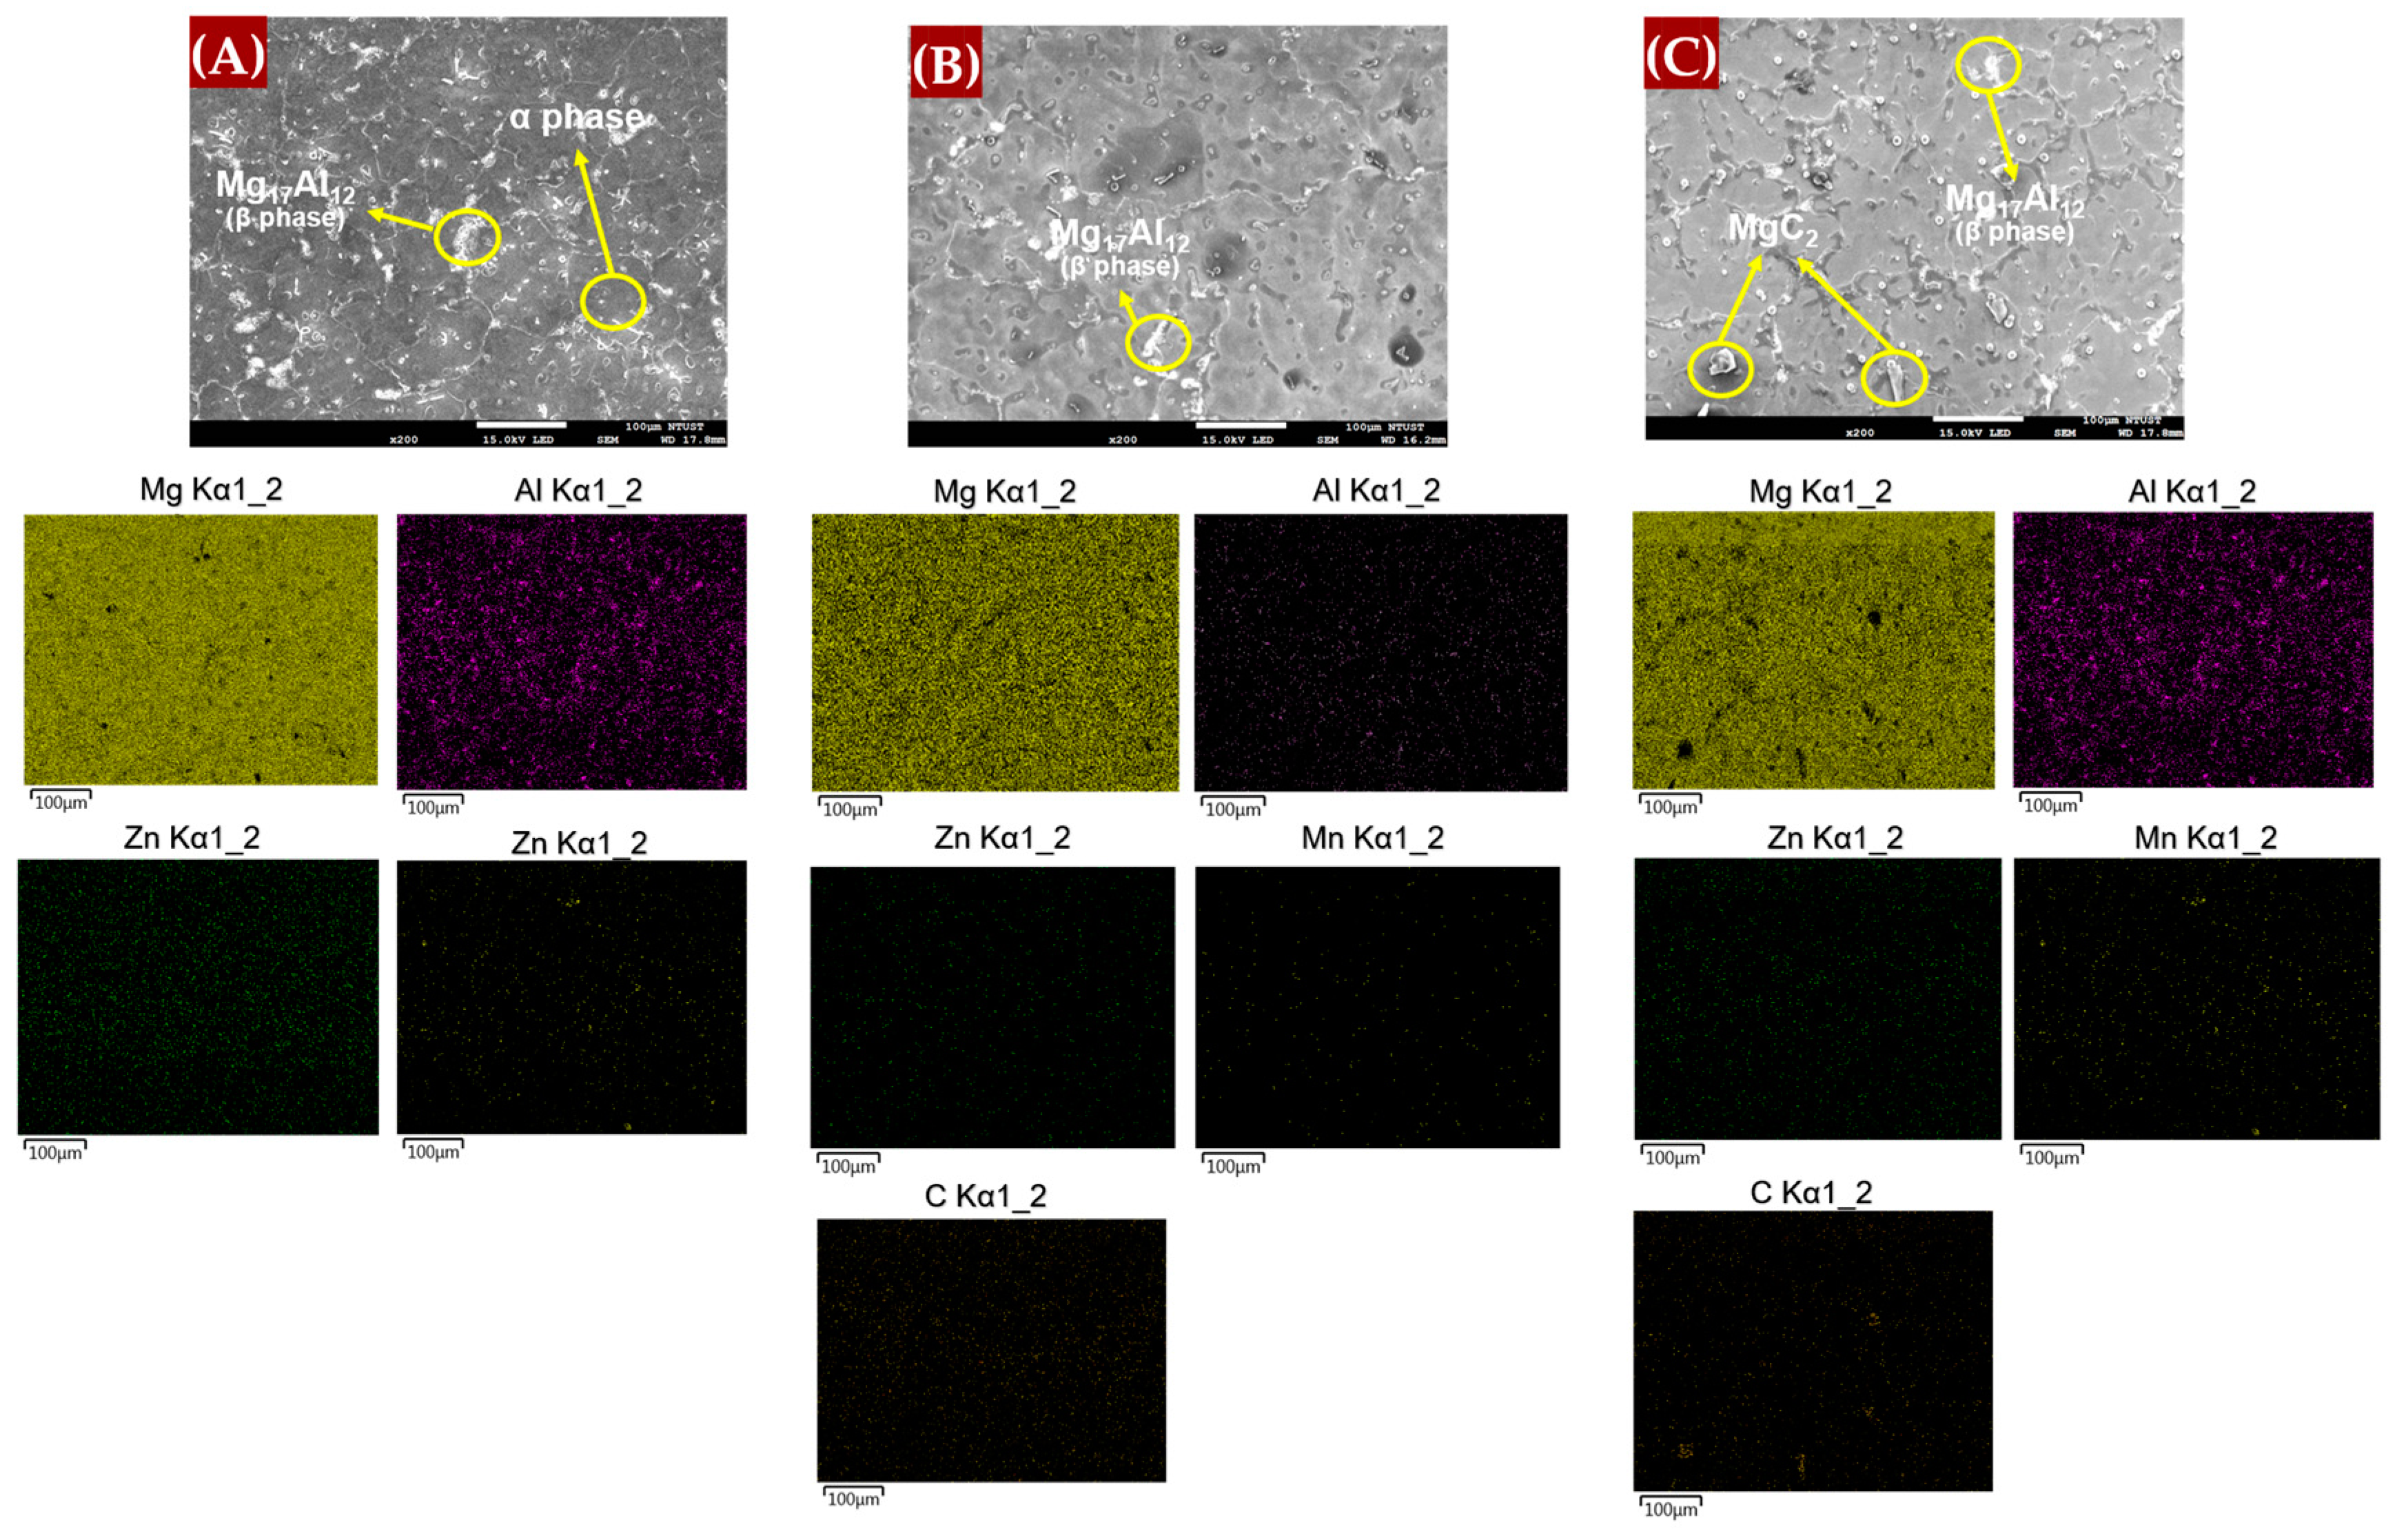
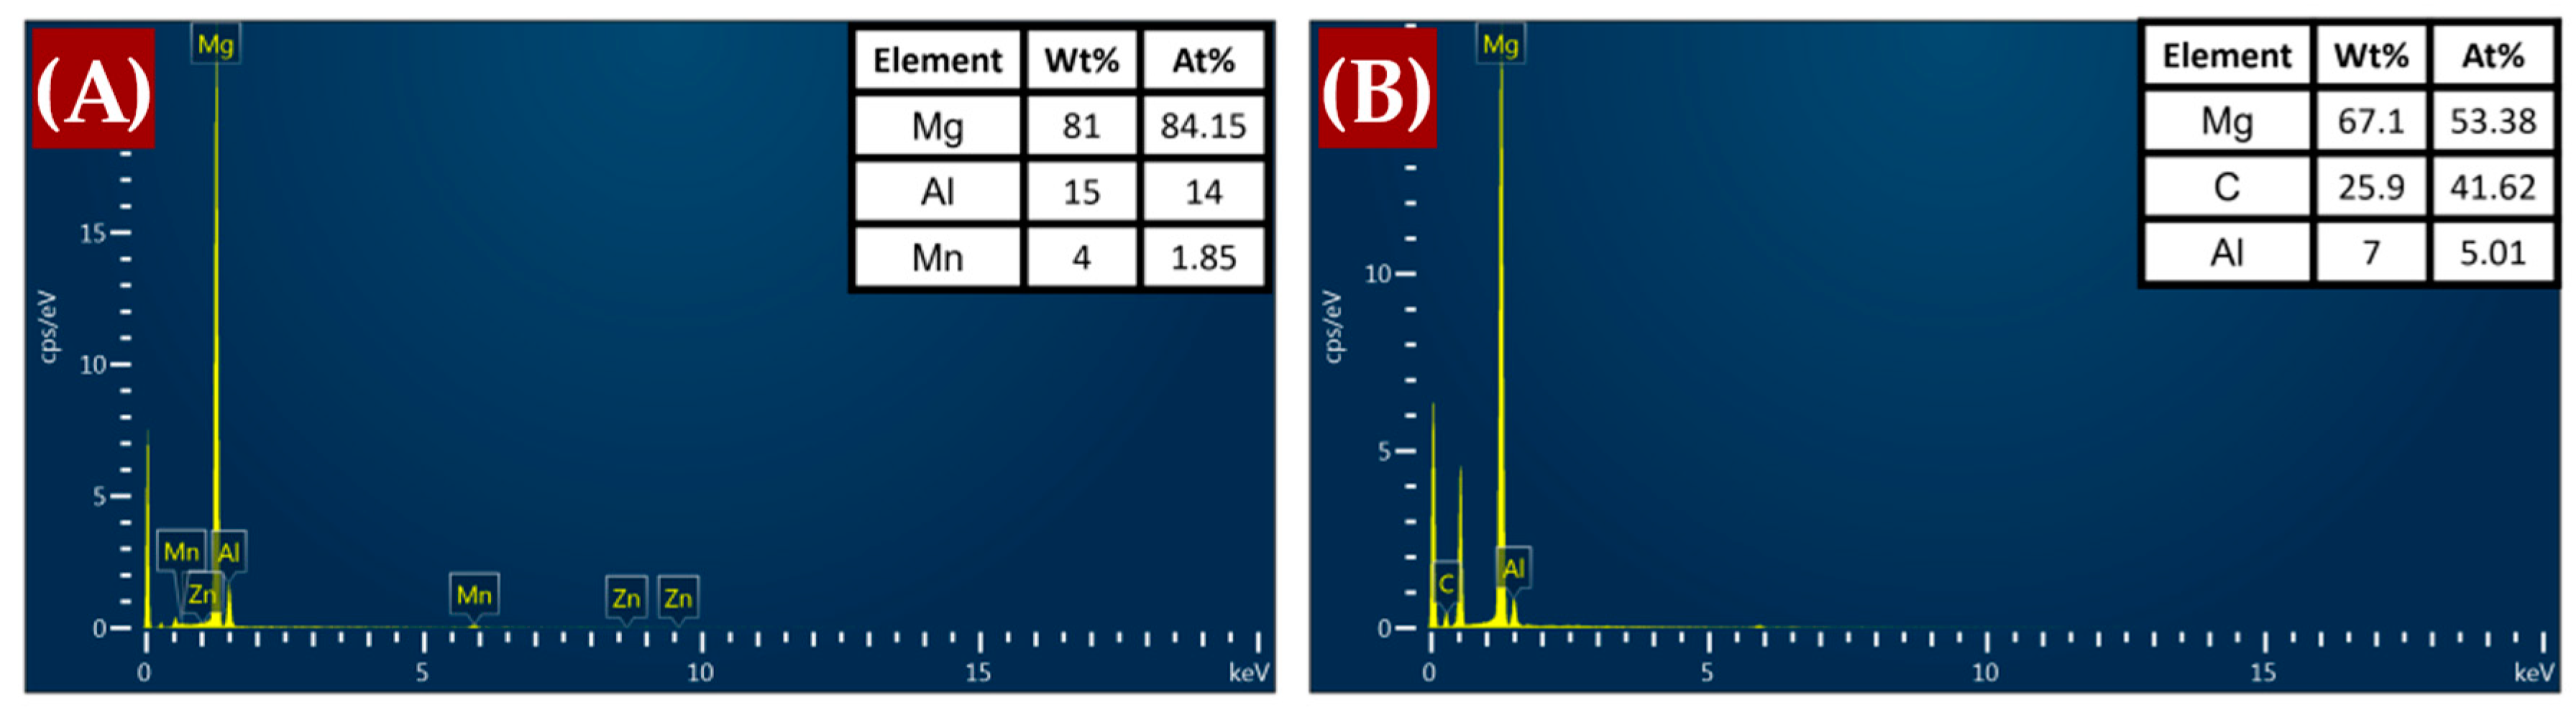
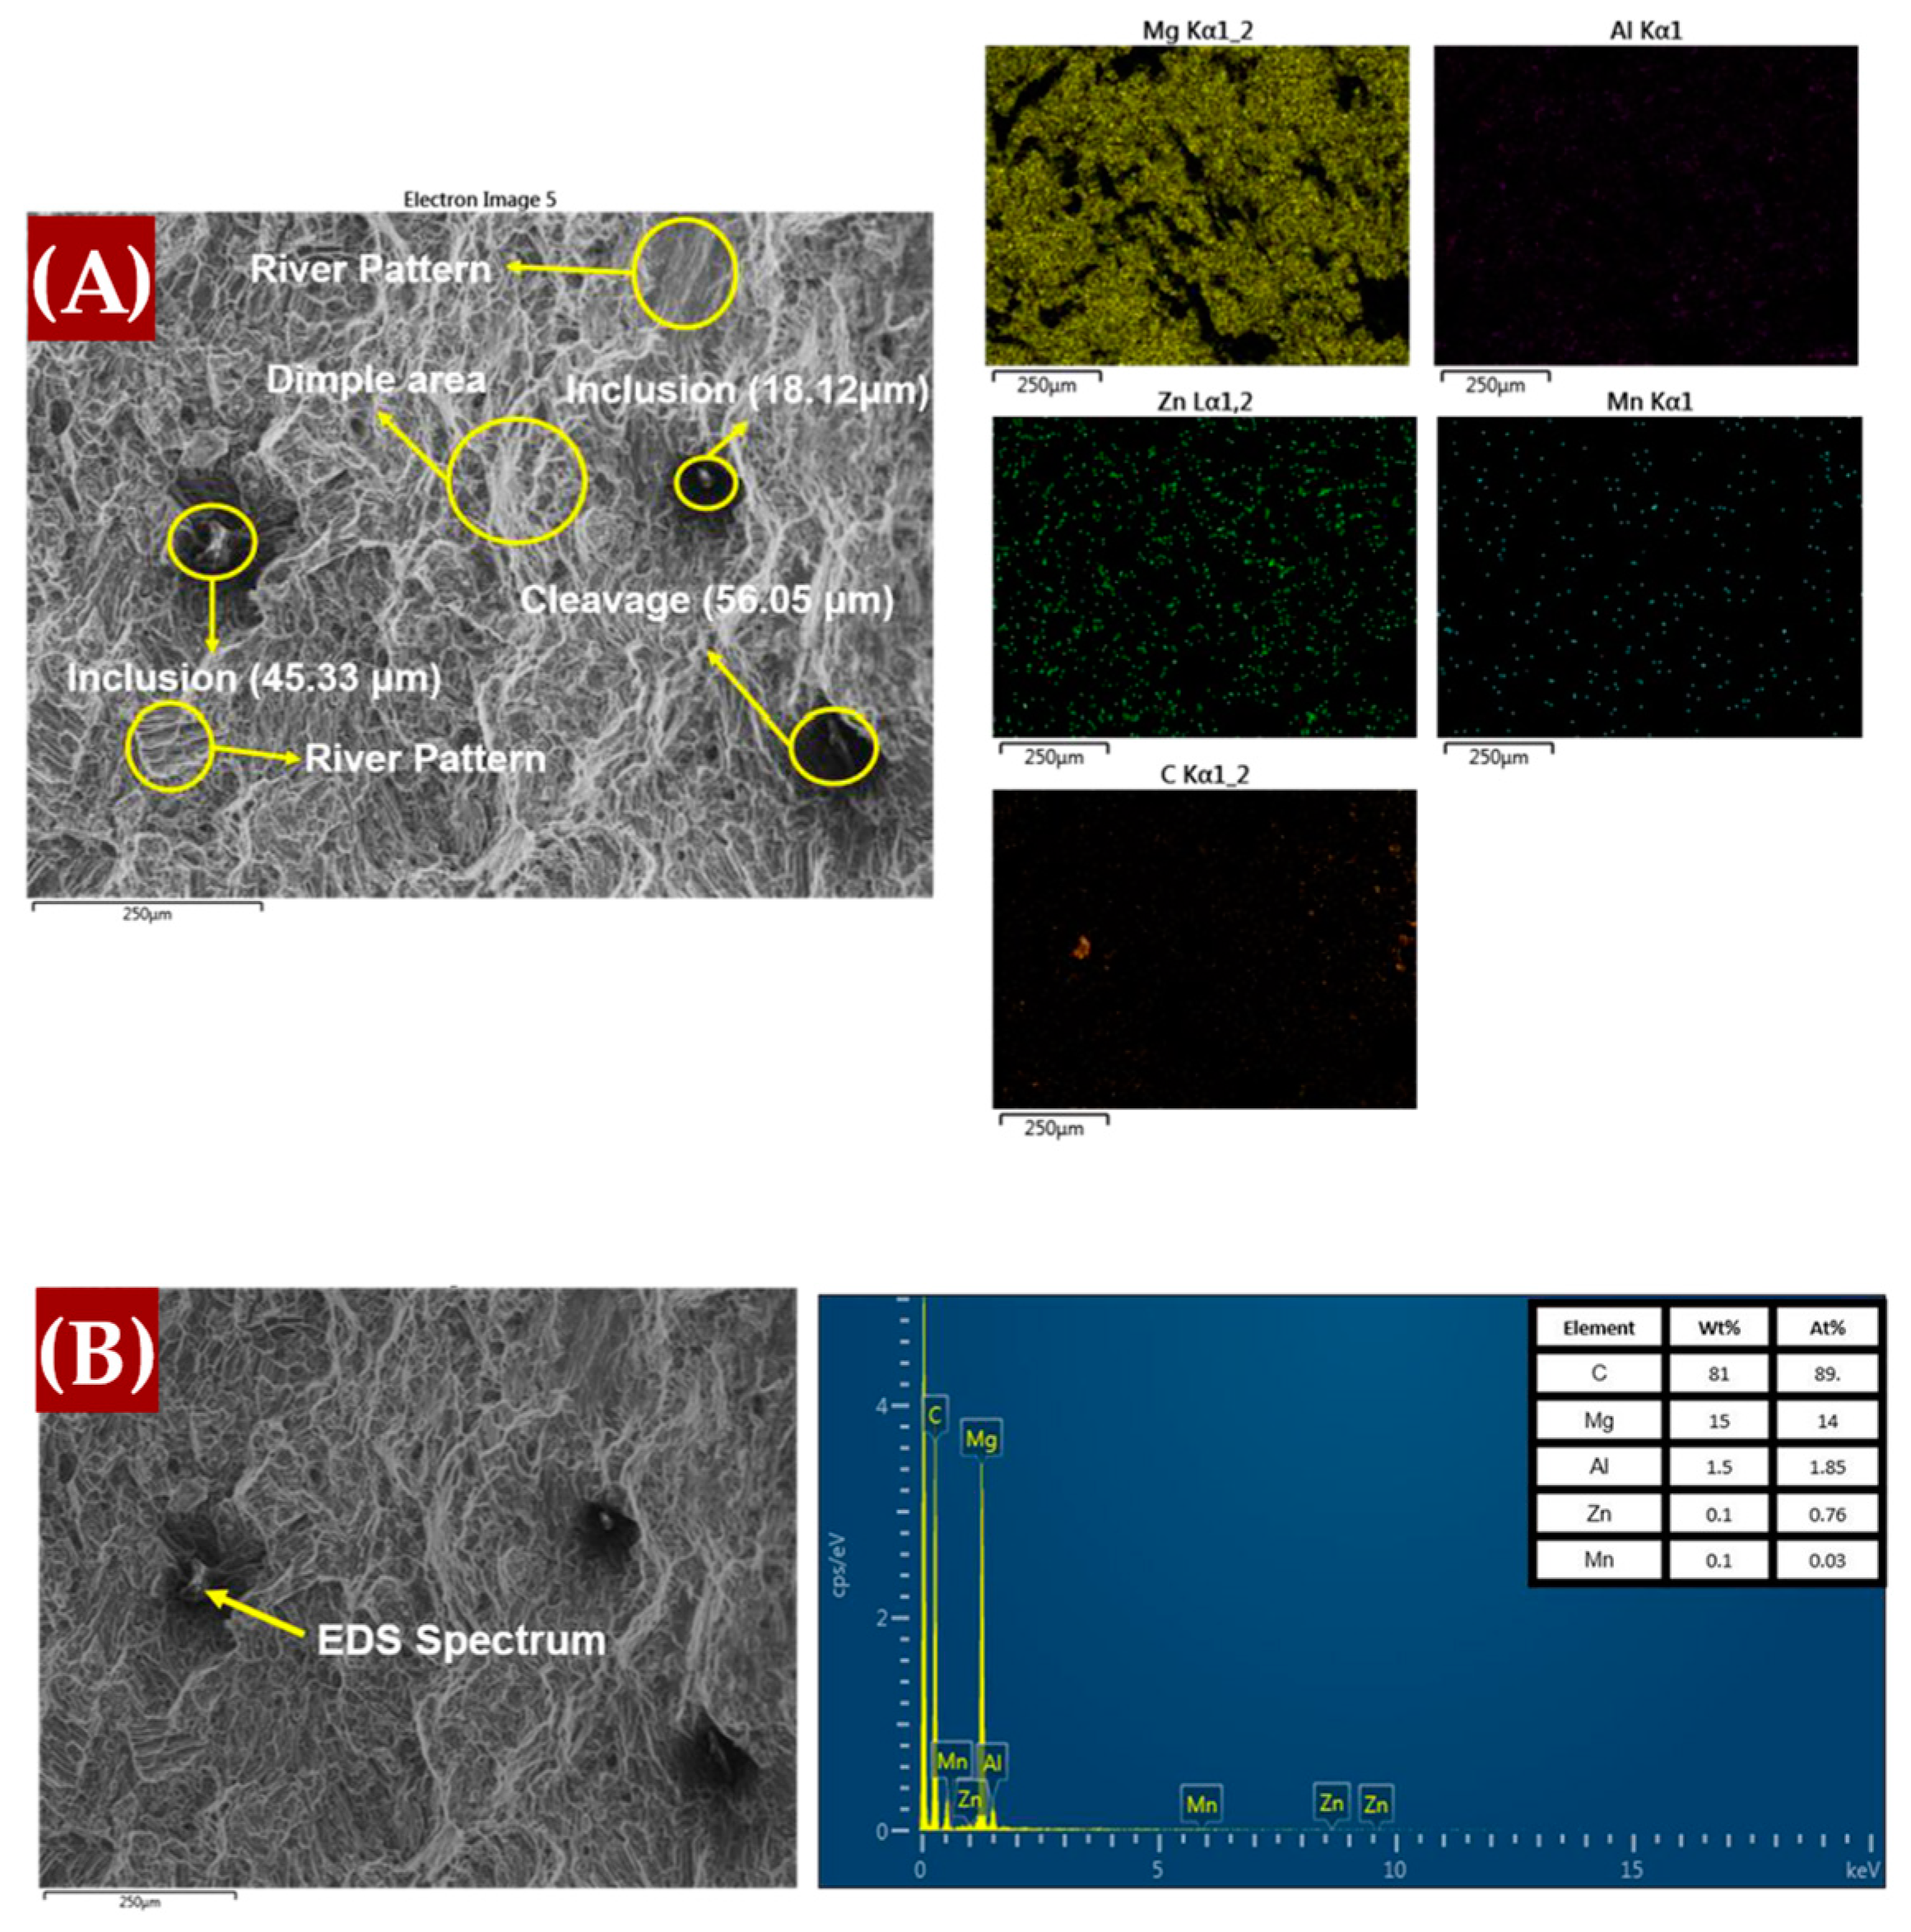
3.1.4. SEM-EDS Analysis

The fabrication process employed in this study utilized stir casting, where both the matrix and reinforcement materials are melted together. The process temperature was determined based on the matrix material, which was set at 760 °C [28]. Graphene was selected as the reinforcement, composed of carbon—a common element that typically forms interstitial solid solutions due to its smaller atomic size compared to solvent atoms. However, graphene’s unique chemical structure and high melting point, which is higher than that of magnesium alloys, suggest that it may not contribute to solid solution strengthening. Instead, graphene likely enhances the material through other strengthening mechanisms, which will be discussed later in the study. To further investigate the material’s microstructure, SEM-EDS analysis was conducted using a JEOL 7900F FE-SEM (Tokyo, Japan).
Figure 9 presents the energy-dispersive X-ray spectroscopy (EDS) mapping images for the AM60B/graphene composites with (A) 0 wt.%, (B) 0.1 wt.%, and (C) 0.2 wt.%. These images offer insights into the elemental distribution and the effects of non-metallic reinforcement inclusions. The scanning electron microscopy (SEM) observations revealed the presence of secondary Mg17Al12 intermetallic phases, which are formed with the addition of alloying elements. For the 0.1 wt.% graphene sample, the MgC2 phase is less likely to form and remains undetectable in XRD analysis (as shown in Figure 4), likely because it is below the detection limit [14]. However, at 0.2 wt.% graphene, there is evidence of carbon agglomeration in specific surface areas, which may correspond to MgC2 formation. The composition of the agglomerates is further clarified by the EDS point analysis in Figure 10.

3.2. Mechanical Testing

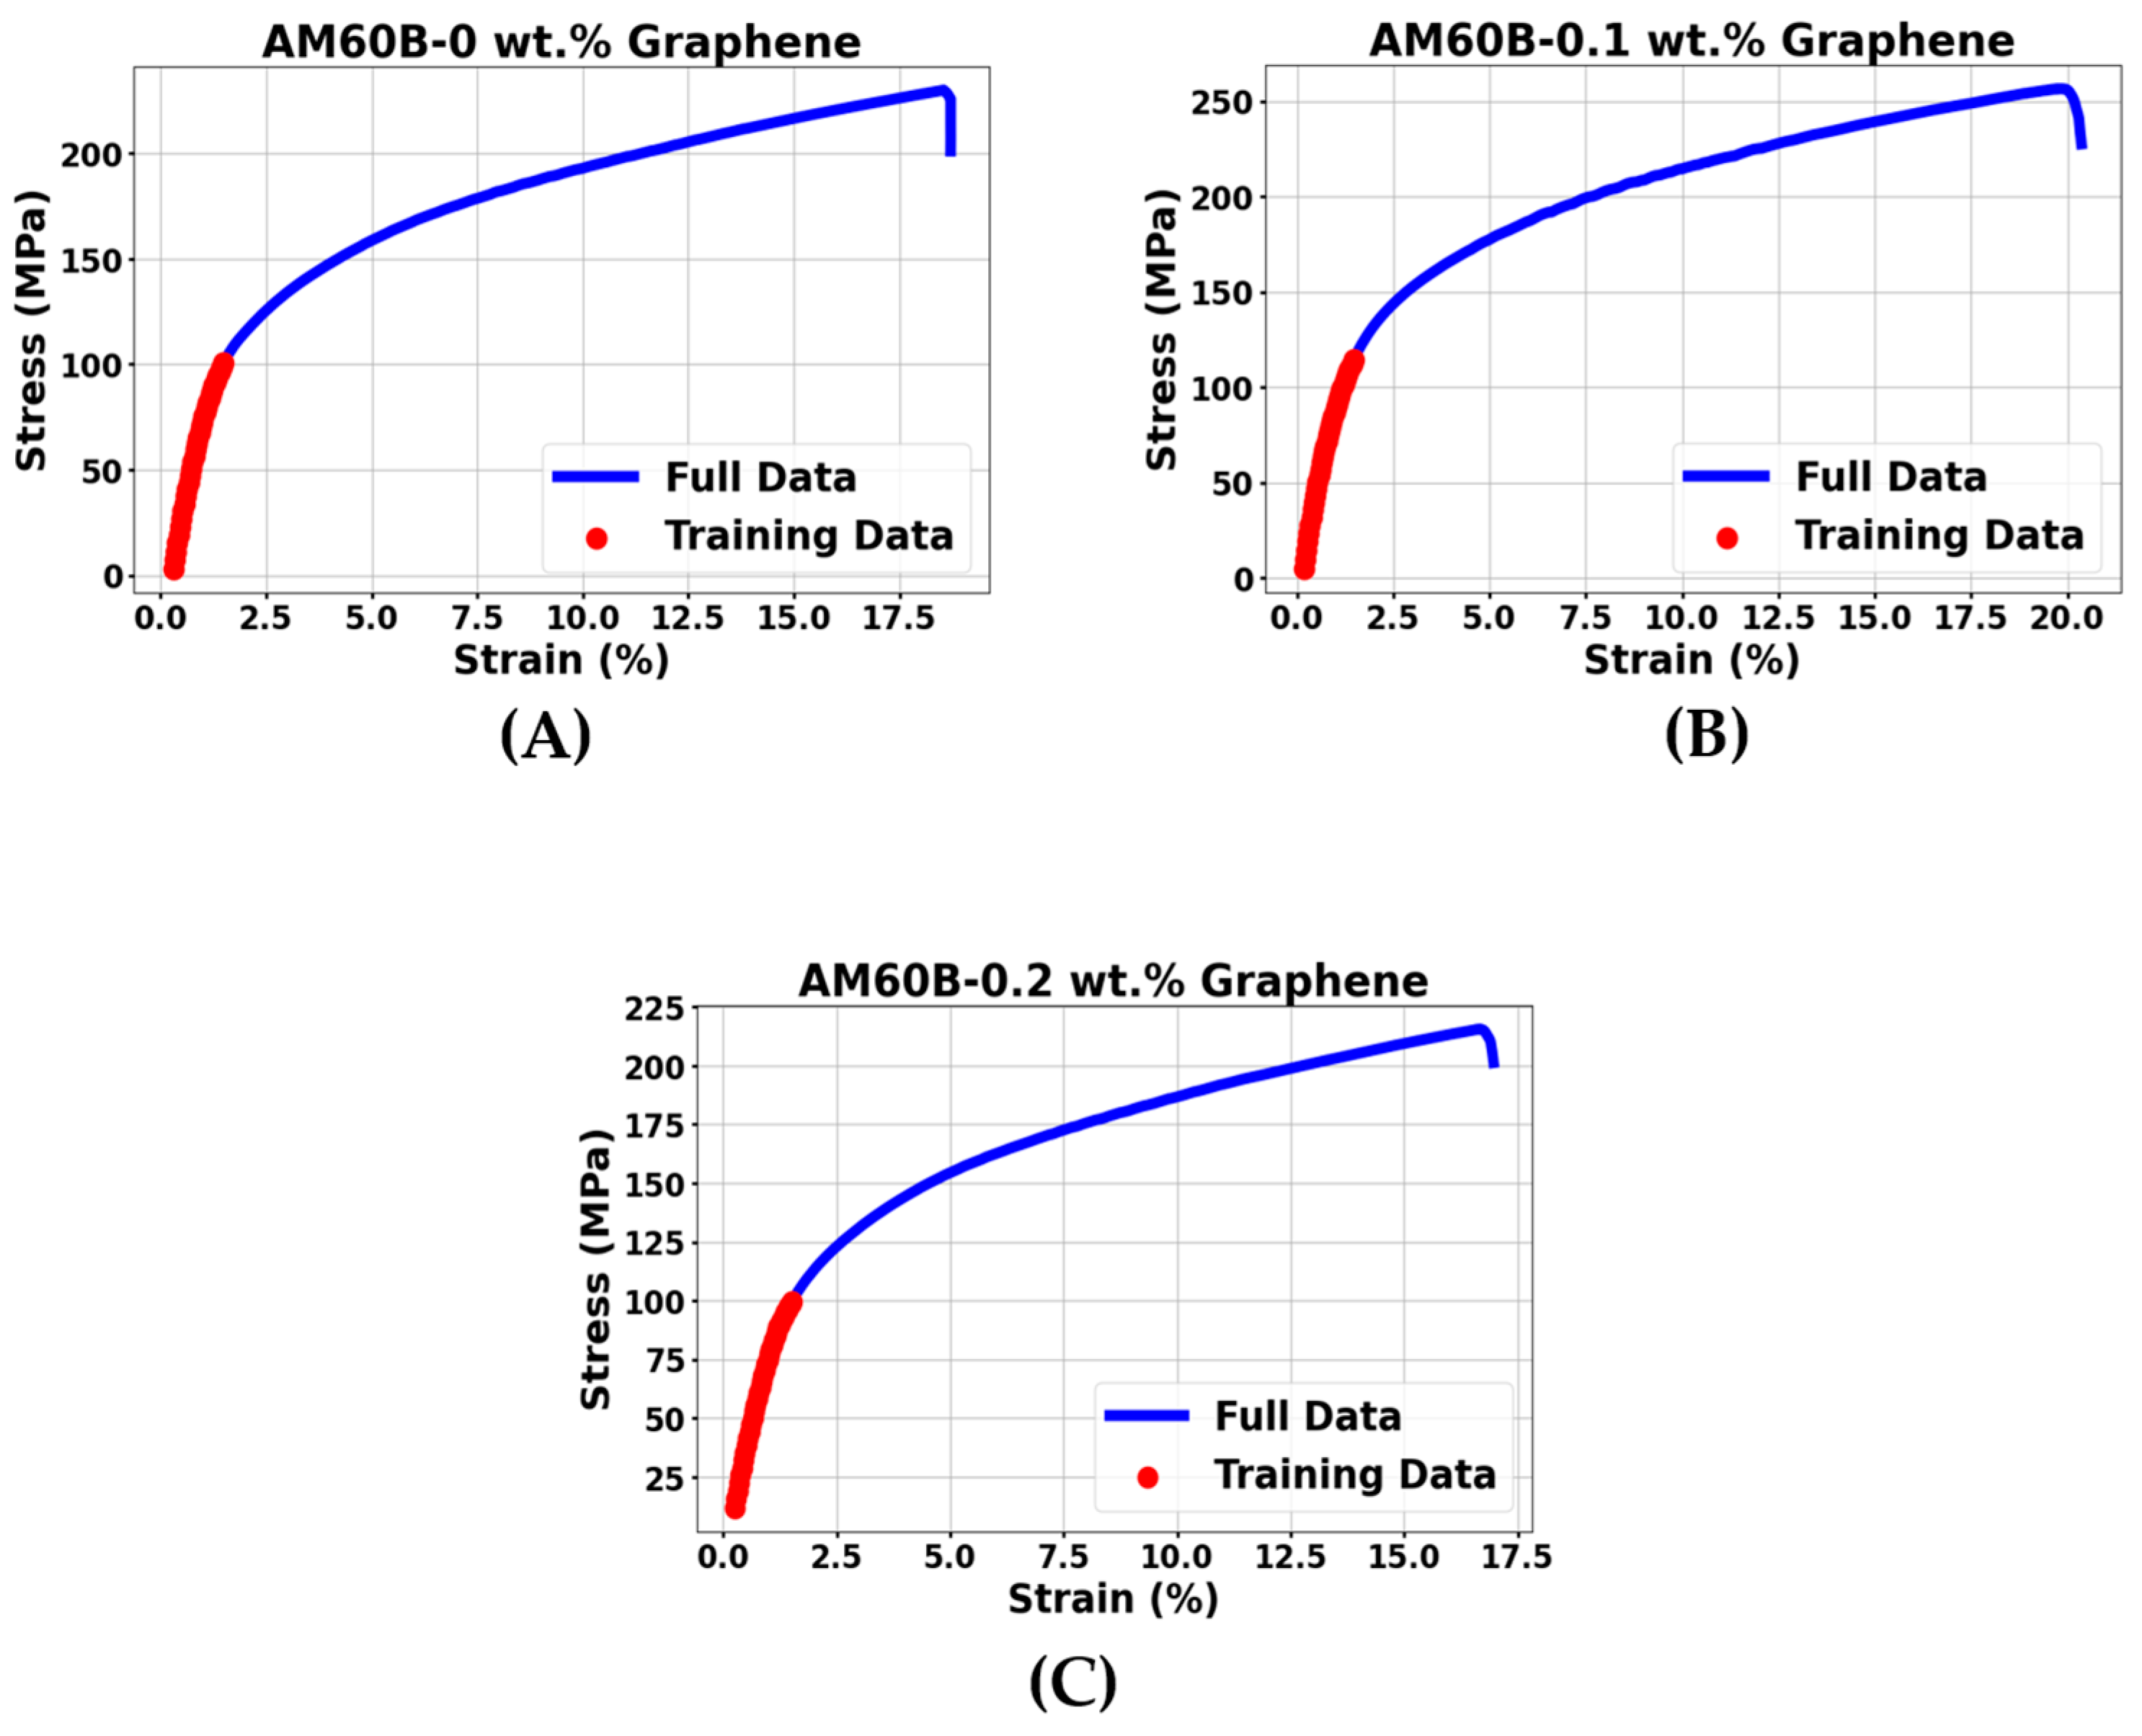
3.2.1. Tensile Testing

To evaluate the mechanical properties of the fabricated composites, tensile tests were performed using a universal testing machine (MTS Insight Electromechanical 10 kN, MTS Systems Corporation, Eden Prairie, MN, USA) at room temperature (25 °C) with a strain rate of 0.5 mm/min. For each material composition, three samples were tested, and the resulting tensile curves were averaged and presented in Figure 11. Key mechanical properties, including yield strength, ultimate tensile strength, and strain at break, were determined and are summarized in Table 6, along with a comparison to previous studies.
It is important to note that the data in Table 6 are not limited to the specific type of graphene powder used in this study, as there are various forms of graphene that can be used as reinforcements, such as graphene nanosheets, graphene nanoplatelets, and graphene oxide [29,30]. Although the types of graphene differ, these comparisons provide useful references for understanding their effects on mechanical properties.
As observed in prior studies, the use of graphene oxide and graphene nanoplatelets typically enhances the mechanical properties of composites as the graphene content increases. However, with graphene nanosheets, the mechanical properties can vary, sometimes decreasing when higher graphene percentages are used. This phenomenon highlights the need for further investigation, including metallography and characterization, to understand the underlying mechanisms. Similarly, in this study, the optimal graphene content for improving mechanical properties was found to exist within a specific range. Beyond this range, increasing the graphene content does not necessarily yield better results and can even have adverse effects.
Notably, the yield strength of the composites was highest when 0.1 wt.% graphene was employed, showing an increase of approximately 13.4% compared to the sample without reinforcement. However, upon the addition of 0.2 wt.% graphene, the yield strength began to decrease by approximately 8.3%, along with reductions in other mechanical properties such as ultimate tensile strength and strain at break. This decrease may be attributed to the higher reinforcement content, which tends to make the metal less ductile compared to that with lower graphene content [31].
Table 6. Comparison of some previous studies with the result in this study on the mechanical properties of magnesium alloys fabricated using the casting process.
MaterialYield Strength (MPa)Ultimate Tensile Strength (MPa)References
AZ31183 ± 4.3267 ± 6.5[32]
AZ31-1.5GNP187 ± 3.5284 ± 5.4
AZ31-3GNP195 ± 4.5299 ± 6.2
ZK61187 ± 1307 ± 1[33]
ZK61-0.1RGO191 ± 2307 ± 0
ZK61-0.25RGO195 ± 1 298 ± 1
ZK61-0.4RGO200 ± 2301 ± 0
ZK61-0.6RGO203 ± 2312 ± 3
AZ61 alloy184 ± 5.5300 ± 7.1[34]
AZ61-3GNP232 ± 5.5335 ± 9.1
AZ80104 ± 5.2271 ± 13.5[35]
AZ80-0.1GNP146 ± 7.3310 ± 15.5
AZ80-0.2GNP160 ± 16325 ± 32
AZ91(T4)168 ± 5.0215 ± 6.0[36]
AZ91-0.1GNS223 ± 3.6276 ± 4.2
AZ91-0.3GNS268 ± 4.6318 ± 5.0
AZ91-0.5GNS296 ± 3.7335 ± 4.8
AZ91-0.8GNS252 ± 5.5307 ± 5.0
AZ91-1.2GNS234 ± 3.0287 ± 5.0
AM60B 101.7 ± 4.9229.4 ± 4.0This Study
AM60B-0.1 wt.% graphene115.3 ± 5.6256.7 ± 3.7
AM60B-0.2 wt.% graphene93.2 ± 4.1215.4 ± 5.5

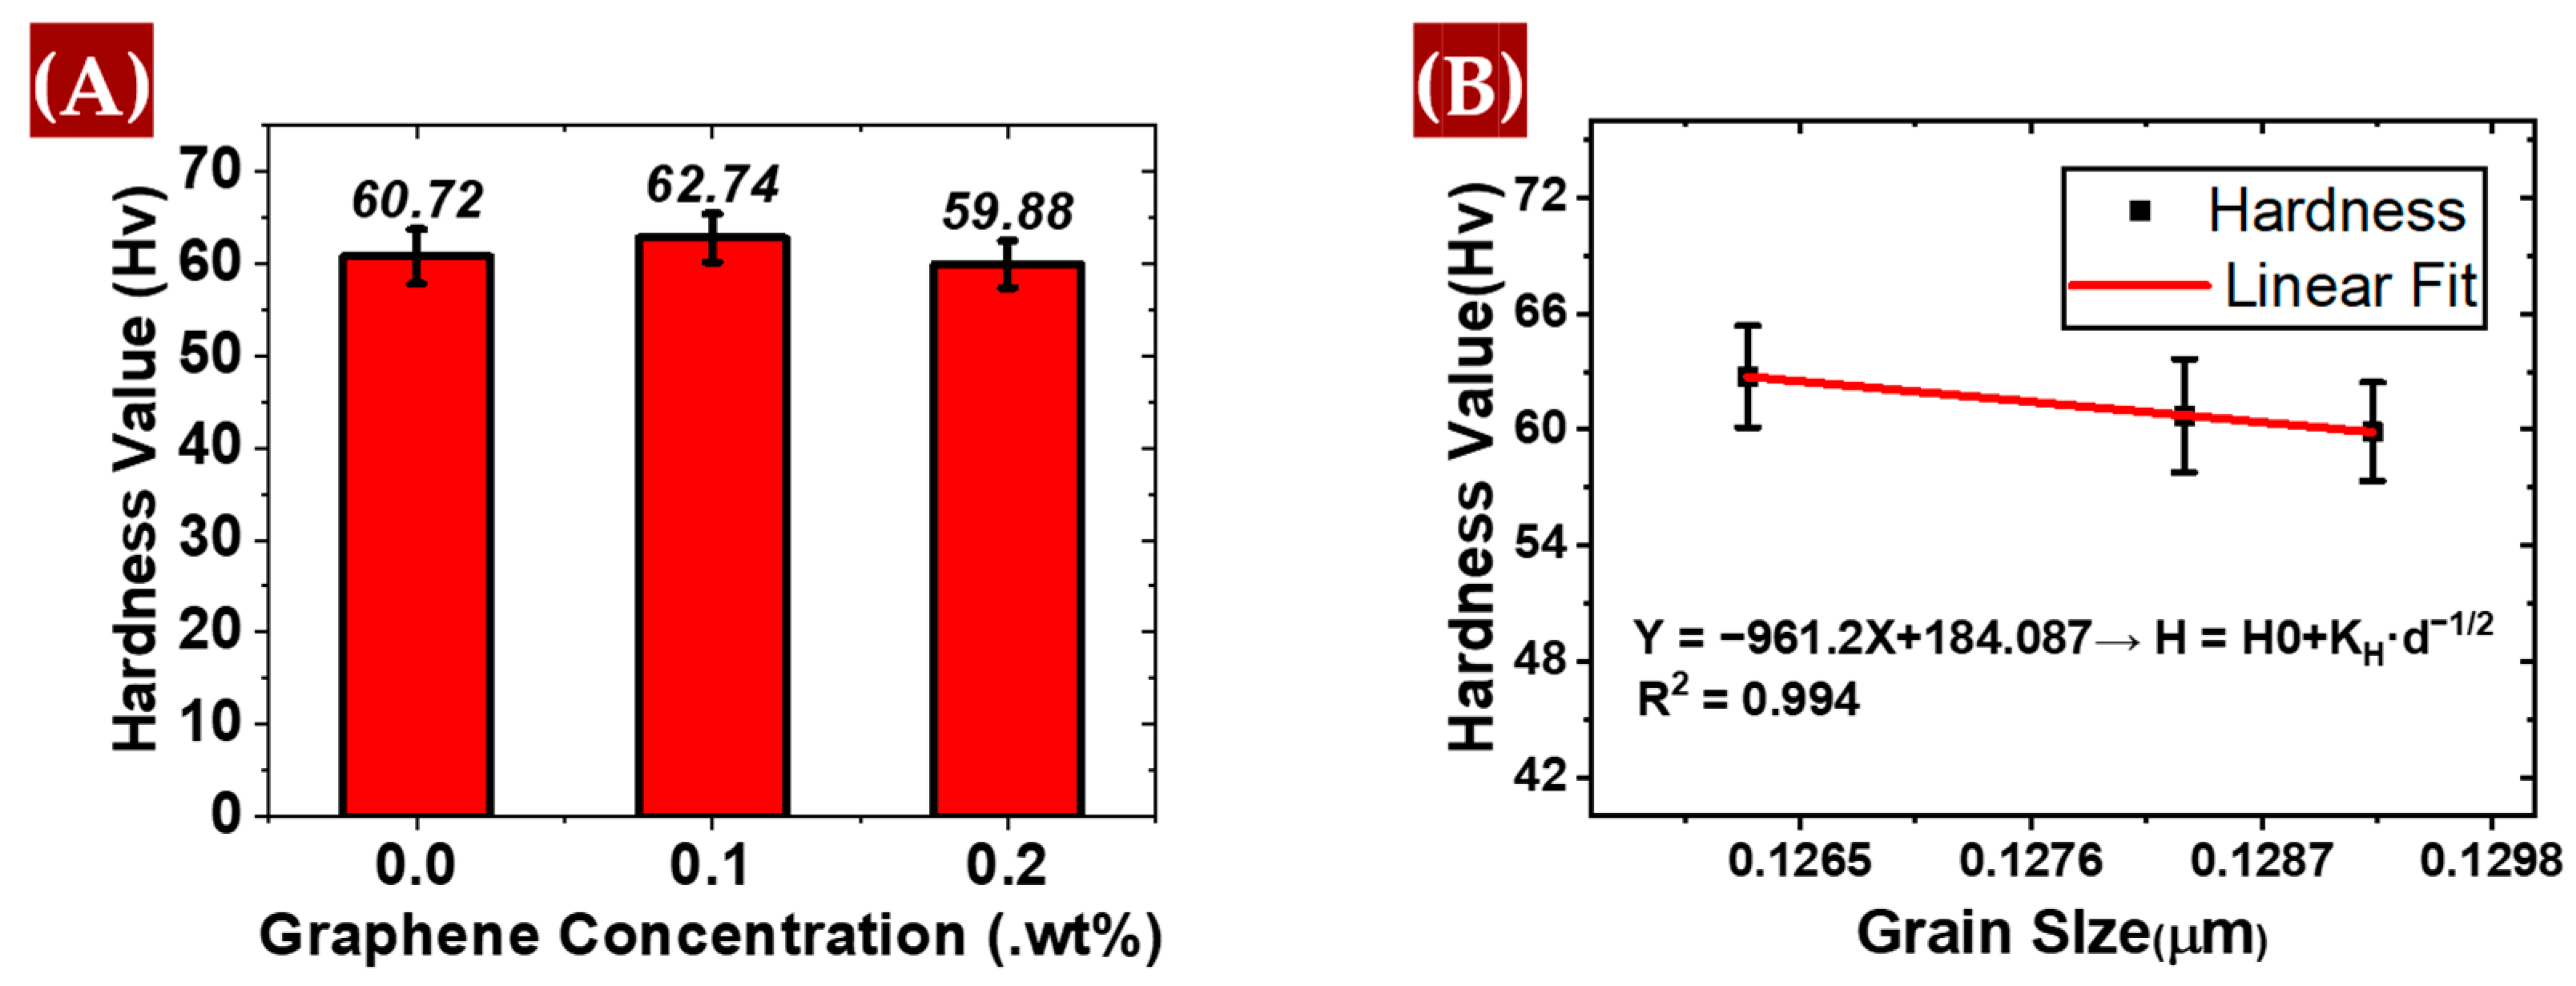
3.2.2. Microhardness Testing

Figure 12A shows that the microhardness of the material slightly increased with the addition of 0.1 wt.% graphene, indicating a marginal improvement in hardness. However, upon further addition of 0.2 wt.% graphene, a noticeable decrease in microhardness is observed. This decline suggests that while a small amount of graphene can enhance hardness, excessive amounts may reduce material strength. The microhardness of the AM60B alloys was measured using a Wilson VH1102/1202 Knoop/Vickers hardness tester. The measurements were conducted with a 300 gf load applied for 10 s using VHPro Express DiaMet VH1102 software to assess the hardness of the material accurately.
The grain size of the sample containing 0.2 wt.% graphene is larger compared to the other samples, which typically leads to lower hardness due to the reduced effectiveness of grain boundary strengthening. Grain boundary strengthening becomes more effective as the grain size decreases because a higher number of grain boundaries hinders dislocation motion, contributing to greater hardness. The observed drop in microhardness may also be attributed to the inhomogeneous distribution of graphene, which could result in areas within the grains that are inadequately reinforced [37].
As shown in Figure 12B, the plot of hardness values against grain size shows a linear relationship. As the grain size decreases, hardness increases, which is consistent with the Hall–Petch mechanism, where grain boundary strengthening contributes to improved mechanical properties [38]. This relationship arises because the grain boundaries tend to exhibit higher hardness compared to the interior of the grains, which helps in terms of impeding dislocation movement and improving overall hardness.

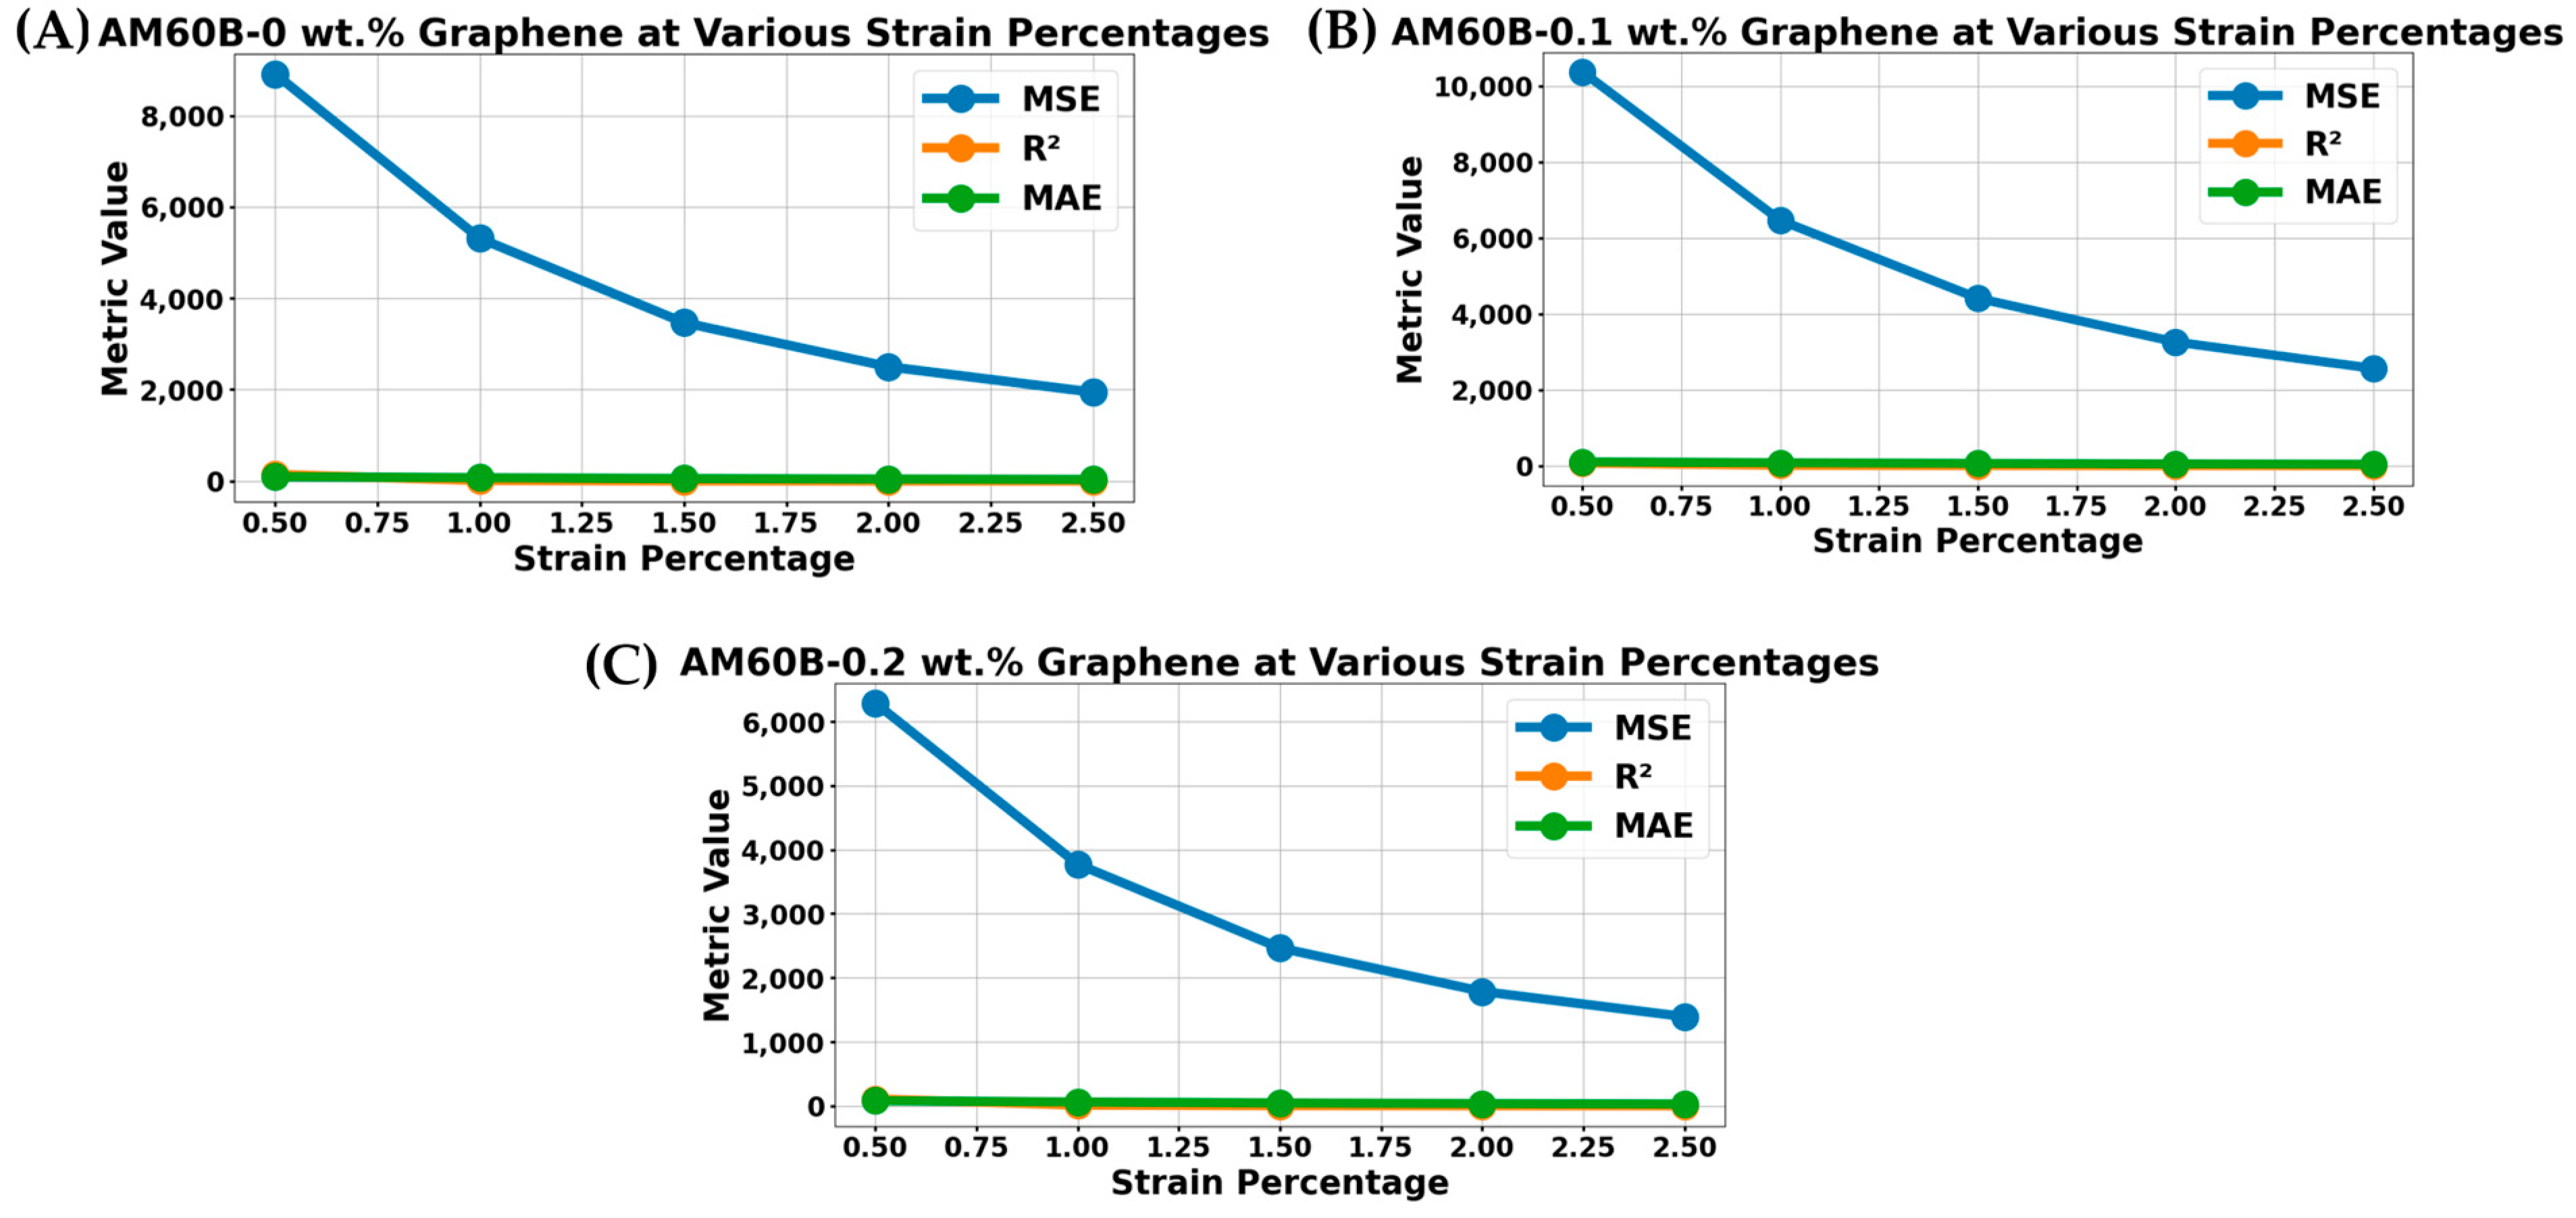
3.3. Regression Analysis Based on Mechanical Testing

In this study, a machine learning approach was employed to analyze the elastic regions of the stress–strain curves obtained from the tensile tests of AM60B magnesium alloy composites, as illustrated in Figure 13. Previous studies have explored both experimental mechanics and the application of machine learning to analyze stress–strain curves [38] and optimize material composition [39]. The objective of this study was to use machine learning regression algorithms, specifically linear regression, to model the relationship between stress and strain within the elastic region.
The elastic region is crucial because it represents the initial linear portion of the stress–strain curve. By accurately modeling this region, regression analysis can offer valuable insights into the elastic properties of the composite, such as the modulus of elasticity, and predict the material’s behavior under small deformations. The regression model was trained using the full dataset derived from the stress–strain curves of the AM60B magnesium alloy composites. To ensure the model’s validity, this study implemented an 80–20 split of the data, with 80% allocated for training and 20% for validation. This approach allowed us to test the model on unseen data and verify that it did not overfit the training set [40,41].
Although hyperparameter tuning is an important step in optimizing machine learning models, including linear regression, its impact can vary depending on the algorithm and dataset [42]. In some cases, the default parameters may yield satisfactory results, and further tuning may provide only marginal gains. As the current regression analysis performed well within the elastic region, extensive hyperparameter optimization was not pursued.
The machine learning regression analysis was performed by fitting a linear model to the data points within the elastic region. This model allows for the prediction of stress based on strain values, which is fundamental to understanding the mechanical behavior of materials. To evaluate the performance of the regression model, various machine learning metrics, such as R-squared (R2) and mean absolute error (MAE), were calculated. These metrics help determine the accuracy and reliability of the model, ensuring that the predictions closely match the experimental data. As shown in Figure 14, which presents the regression lines generated for the elastic region, the green regression lines fit well within the elastic region for all three compositions. The accuracy and performance of the regression model will be assessed using specific machine learning metrics, which will be discussed in detail in the later sections of this study.

4. Discussion

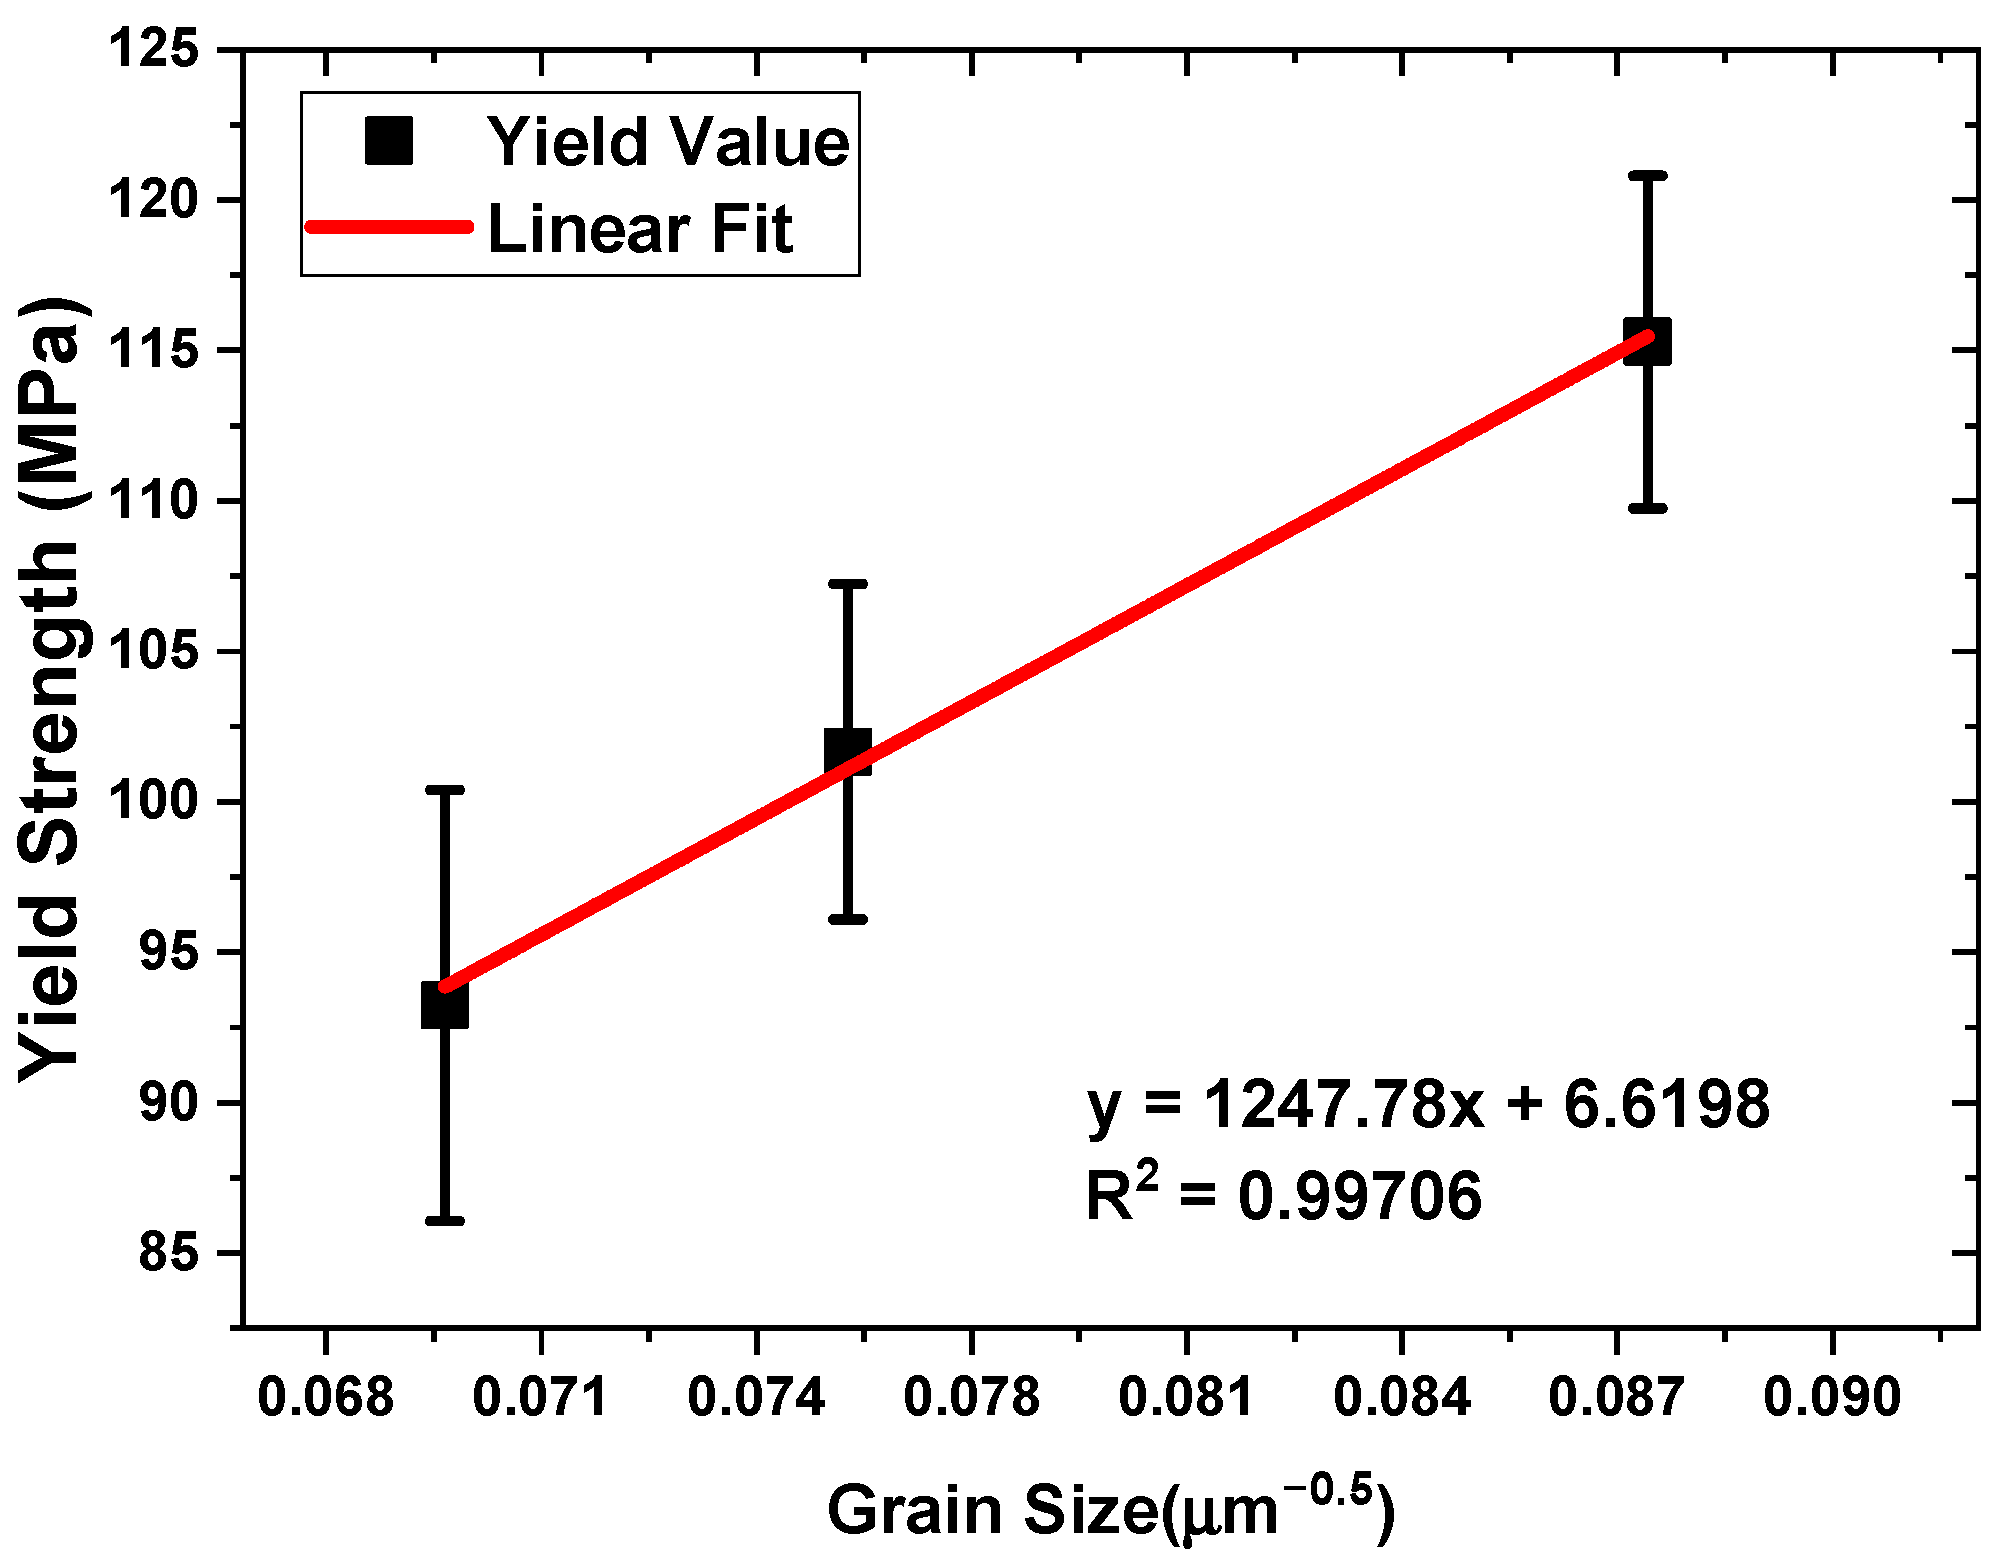
4.1. Strengthening Mechanism

When studying the impact of small reinforcement additions on mechanical properties, it is crucial to consider the various strengthening mechanisms at play. These mechanisms, which influence the dislocation motion, directly affect material strength. As the dislocation mobility decreases, the material strength increases [43]. Strengthening mechanisms can be categorized into several types, including obstacle strengthening (Orowan), the Hall–Petch effect, thermal expansion mismatch (CTE), and load transfer strengthening. Each mechanism plays a distinct role in enhancing the mechanical properties of the material [44].
Obstacle strengthening, also known as Orowan strengthening, occurs when dislocations encounter obstacles such as precipitates or particles that impede their motion. The interaction between the strain field of a dislocation and these obstacles increases the material strength by increasing the energy required for dislocation movement. The length of the dislocation is directly related to the strain energy introduced into the material, which can be expressed as the elastic energy per unit length. This energy ( E ) is expressed by Equation (5) involving the shear modulus (μ), the magnitude of the Burgers vector (b), the radius of influence around the dislocation (R), and the core radius of the dislocation (ro) [45,46]:
E = μ b 2 4 π l n R r o
From the concept of elastic energy, the relationship can be further extended to calculate yield strength. Using the Orowan–Ashby equation, it is important to note that some of the symbols in the equation may differ. In this context, b represents the Burgers vector, Gm is the shear modulus, dp denotes the mean particle size, and Vf refers to the volume fraction, which can be calculated using Equation (6). The symbol λ represents the interparticle distance between graphene particles, which can be determined using Equation (7). Once λ is found, Equation (8) can then be applied to calculate the Orowan strengthening contribution:
V f = W R × ρ R W m × ρ m
λ = d p ( 1 V f 1 / 3 1 )
σ o = 0.13 G m b γ ln d p 2 b
Another strengthening mechanism is grain boundary strengthening, known as the Hall–Petch effect, shown in Equation (9), which describes the relationship between the yield strength of the composite (σy), material-specific constants (σo and K), and grain size (d) [47]. The constant K can be determined by plotting the yield strength as a function of the inverse square root of the grain size (d) in Figure 15.
Despite having only three samples, the plot shows that the R2 value is within an acceptable range, indicating a reliable fit. This strengthening mechanism is distinct from obstacle strengthening because it specifically focuses on the influence of grain size and boundaries on material strength [48]. The Hall–Petch equation can be further expanded and expressed in Equation (9) to determine the extent to which the grain size contribution affects the yield strength:
σ y = σ 0 + K d 1 2
Δ σ HP = K d composite 1 2 d AM 60 B 1 2
Δ σ CTE = α G m b B V f Δ CTE Δ T b d p ( 1 V f )
The final strengthening mechanism considered in this study is load transfer (LT). LT tends to contribute significantly to the overall strengthening of composite materials, primarily because it is directly related to the yield strength of the material [49]. The load transfer equation is given by Equation (12). In composite systems, the reinforcement, such as graphene, bears part of the applied load, thereby reducing the stress on the matrix and effectively increasing the composite’s overall yield strength. This mechanism becomes particularly important when the reinforcement exhibits a much higher stiffness and strength than the matrix, allowing it to carry a substantial portion of the load and thereby enhancing the mechanical properties of the entire composite [50]:
Δ σ L T = S σ m V f 4
All the constants used for the strengthening mechanisms are compiled in Table 7. Some constants are derived from the experimental data in this study, while others are taken from references. Due to the complexity of the equations, Table 8 provides a summary of the calculation procedures. After performing the calculations, Table 9 presents the contributions of each strengthening mechanism.
The purpose of these tables is not to directly compare the mechanisms for each composition, but rather to highlight which mechanisms contribute significantly more and which contribute less. Among the two compositions studied, the load transfer mechanism is the most significant contributor to yield strength, as expected, since it is directly proportional to the material’s yield strength.
The second-most influential mechanism is the Hall–Petch effect, related to the grain boundaries observed in all samples. While this mechanism strengthens the material, its impact is less than that of load transfer. Orowan strengthening is the third-most significant mechanism, likely less pronounced due to the lower volume fraction of reinforcement in the compositions. Finally, the coefficient of thermal expansion (CTE) mismatch contributes the least, which is reasonable given that no heat treatment was applied to enhance its effects.

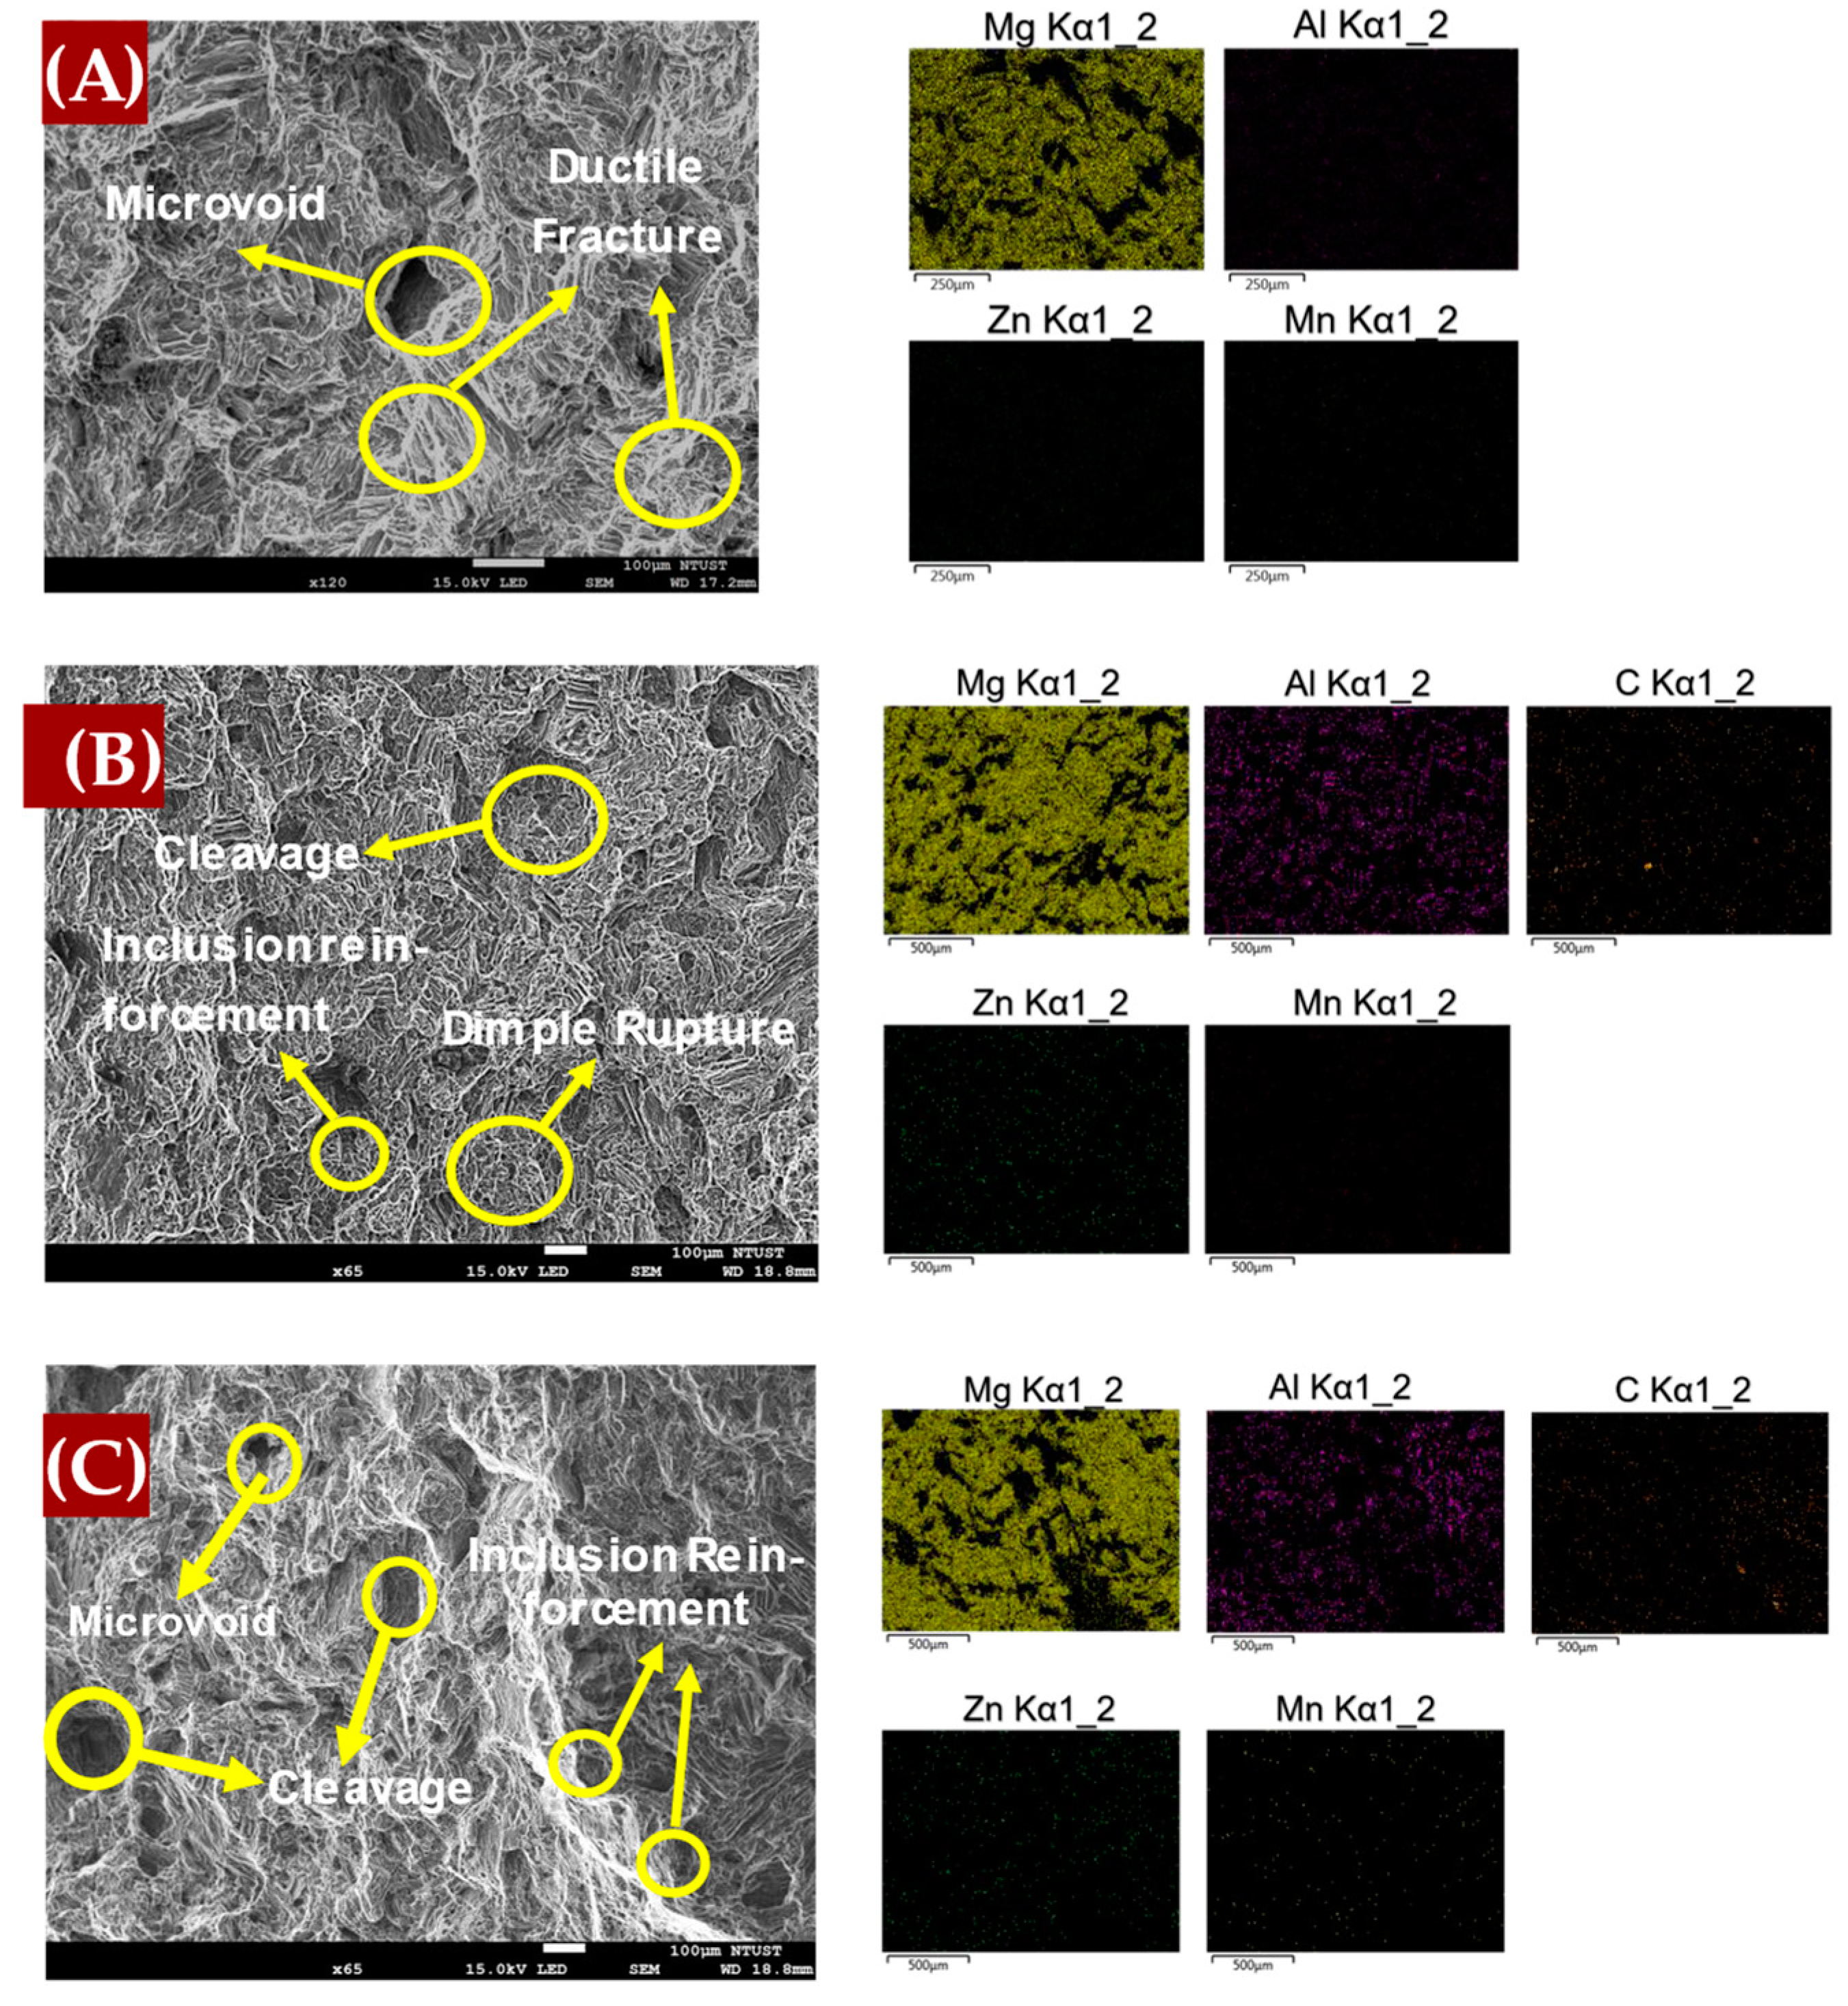
4.2. Fracture Surface Study

The fracture surfaces of the samples used in this study were analyzed to understand the failure mechanisms during tensile testing. Typically, fracture surfaces can be classified into two main categories: brittle and ductile. Each of these fracture types revealed important information about the material’s behavior under stress, particularly in relation to the microstructural features of the composite. For the as-cast 0 wt.% graphene sample, the SEM images in Figure 16A reveal distinct microvoids and dimples characteristic of ductile fracture behavior. These microvoids suggest that the material underwent significant plastic deformation before failure. The presence of cup-like structures further corroborates the ductile nature of this sample, indicating that the material retains a more ductile response under tensile stress.
In contrast, the introduction of 0.1 wt.% graphene, as observed in Figure 16B, resulted in a noticeable shift toward brittle fracture behavior. The SEM images exhibit clear cleavage planes marked by river patterns, which indicate a brittle fracture mechanism. This suggests that even a small addition of graphene can induce brittleness in the material. Moreover, inclusions of non-metallic reinforcement, identified as graphene with elemental carbon content, were evident in the EDS images. As the graphene content increased to 0.2 wt.%, as shown in Figure 16C, the fracture surface analysis revealed a mix of ductile and brittle features. While microvoids were still present, indicating some ductile behavior, the increased prevalence of cleavage planes suggested a stronger tendency toward brittleness. This behavior can be attributed to the higher graphene content, which may lead to the agglomeration of graphene particles, which act as stress concentrators and reduce the overall ductility of the material.
As observed, the 0.2 wt.% graphene addition tends to increase the brittleness of the material compared to other concentrations. Consequently, further SEM-EDS analysis was conducted to better understand the fracture behavior at this level of graphene content. Figure 17 provides a detailed examination of the fracture surface for the 0.2 wt.% graphene composite. In Figure 17A, EDS mapping highlights the presence of graphene agglomerations, as evidenced by the elevated carbon content. The EDS element maps confirm the presence of carbon-rich regions, indicative of graphene clusters, which likely contribute to the observed brittleness by acting as stress concentrators [57]. Figure 17B shows the EDS spectrum, which reveals a high percentage of carbon, confirming the presence of graphene within the material. This finding supports the notion that the increased graphene content leads to agglomeration, thus reducing ductility and promoting brittle failure mechanisms.

4.3. Regression Analysis Using Machine Learning Metrics

Figure 18 illustrates the evaluation metrics used in the regression analysis of the stress–strain curves for the samples in this study. From Figure 18A–C, it is evident that all machine learning metrics decrease as the strain percentage increases. This trend indicates that regression analysis becomes increasingly accurate as the strain percentage increases. The exact values of these metrics are given in Table 6, Table 7 and Table 8.
Interestingly, the mean squared error (MSE) was higher for the sample with 0.1 wt.% graphene reinforcement than for the sample without reinforcement. However, the sample with 0.2 wt.% graphene exhibited the highest MSE, suggesting that the machine learning model found it more challenging to converge with increasing reinforcement. This could be due to the complexity introduced by the reinforcement, which may have affected the model’s ability to accurately predict the stress–strain relationship. Moreover, the R2 metric, which is negative in some cases, indicates that the model does not adequately capture variance in the data.
Despite this, Table 10 shows that the evaluated strain was 0.5 %, which is in the elastic region. The evaluated elastic modulus varied, with AM60B with 0.1 wt.% graphene exhibiting the highest. Note that the machine learning metric for all samples is the AM60B model without reinforcement, featuring minimum error. The mean absolute error (MAE) follows a similar trend to the MSE, further highlighting the challenges faced by the regression model with different reinforcement levels. This study shows that regression analysis, particularly linear regression, can be a useful tool for understanding the material behavior in the elastic region. Materials may not always exhibit perfectly linear behavior in this region, and slight deviations can occur.

5. Conclusions

This study evaluates the impact of incorporating graphene as a reinforcement in AM60B magnesium alloy, revealing important insights into the relationship between graphene content and alloy mechanical properties.
  • Incorporating 0.1 wt.% graphene into the AM60B magnesium alloy resulted in a significant improvement in yield strength, achieving a 12% increase compared to the alloy without graphene. These results indicate that a modest addition of graphene effectively enhances the alloy’s mechanical performance.
  • The addition of 0.1 wt.% graphene not only enhanced the yield strength by approximately 13.4% but also increased the strain at break by 8.8%. This suggests that a small amount of graphene slightly improves both the strength and ductility of the alloy, making it more robust and versatile for various applications.
  • However, increasing the graphene content to 0.2 wt.% reduced the tensile strength. This decline was likely due to the agglomeration of graphene particles and the resulting increase in brittleness, which compromised the alloy’s overall mechanical properties.
  • Regression analysis of the tensile curves showed that the addition of 0.1 and 0.2 wt.% graphene slightly reduced the model accuracy, as reflected by the mean squared error (MSE) of approximately 0.065. However, the accuracy remained high, indicating the model’s robustness despite the challenges posed by the reinforcement.
  • The thermal stability of AM60B/graphene composites, particularly in relation to the formation of the MgC2 phase, was not assessed in this study. Given that graphene is well-regarded for its excellent thermal stability, investigating this aspect could provide valuable insights into how it influences the thermal behavior of the composites.
  • In future work, the exploration of more complex regions of the stress–strain curve, such as the plastic region, may benefit from hyperparameter tuning to improve model performance.

Author Contributions

Conceptualization, resources, and validation, S.-J.H.; formal analysis and investigation, J.S. and Y.A.; writing—original draft preparation, J.S.; writing—review and editing, J.S., Y.A. and S.K.; supervision, Y.A. and S.K. All authors have read and agreed to the published version of the manuscript.

Funding

This research was funded by the National Science and Technology Council, Taiwan, under grant number NSTC 111-2221-E-011-096-MY3.

Institutional Review Board Statement

Not applicable.

Informed Consent Statement

Not applicable.

Data Availability Statement

The raw data supporting the conclusions of this article will be made available by the authors upon request.

Acknowledgments

The authors acknowledge the support and services of the Precious Instrumentation Center at the National Taiwan University of Science and Technology.

Conflicts of Interest

The authors declare no conflicts of interest.

References

  1. Ni, F.; Peng, J.; Liu, X.; Gao, P.; Nie, Z.; Hu, J.; Zhao, D. Modification of Microstructure and Mechanical Properties of Extruded AZ91-0.4Ce Magnesium Alloy through Addition of Ca. Materials 2024, 17, 3359. [Google Scholar] [CrossRef]
  2. Alaneme, K.K.; Okotete, E.A. Enhancing plastic deformability of Mg and its alloys—A review of traditional and nascent developments. J. Magnes. Alloys 2017, 5, 460–475. [Google Scholar] [CrossRef]
  3. Huang, S.-J.; Li, C.; Sarkar, M.; Li, W.; Kannaiyan, S.; Bilgili, H.K.; Al-Mallahi, D.A.F.; Todoh, M. Mechanical Study Reinforced Magnesium-Yttrium Alloys by Eggshell Powder Using Resistance Casting. J. Alloys Compd. 2024, 1008, 176458. [Google Scholar] [CrossRef]
  4. Yang, Q.; Jiang, B.; Gao, L.; Gao, Y.; Liang, B.; Lan, S.; Qin, Z.; Zou, W.; Yang, F.; Pan, F. Study on Plastic Constitutive Relation and Ductile Fracture Criterion of AM60B Magnesium Alloy. Materials 2024, 17, 1684. [Google Scholar] [CrossRef]
  5. Khan, M.; Tahir, M.N.; Adil, S.F.; Khan, H.U.; Siddiqui, M.R.H.; Al-Warthan, A.A.; Tremel, W. Graphene Based Metal and Metal Oxide Nanocomposites: Synthesis, Properties and their Applications. J. Mater. Chem. A 2015, 3, 18753–18808. [Google Scholar] [CrossRef]
  6. Vlassiouk, I.; Polizos, G.; Cooper, R.; Ivanov, I.; Keum, J.K.; Paulauskas, F.; Datskos, P.; Smirnov, S. Strong and Electrically Conductive Graphene-Based Composite Fibers and Laminates. ACS Appl. Mater. Interfaces 2015, 7, 10702–10709. [Google Scholar] [CrossRef]
  7. Fan, Y.; Ye, L.; Tian, Q.; Zhuang, Y.; Zhang, Y.; Li, X. Effects of aligned graphene sheets on mechanical properties of ZK61 alloy. Mater. Sci. Eng. A 2021, 801, 140417. [Google Scholar] [CrossRef]
  8. Shahil, K.M.F.; Balandin, A.A. Graphene-multilayer graphene nanocomposites as highly efficient thermal interface materials. Nano Lett. 2012, 12, 861–867. [Google Scholar] [CrossRef]
  9. Huang, S.-J.; Adityawardhana, Y.; Kannaiyan, S. Enhancement strength of AZ91 magnesium alloy composites reinforced with graphene by T6 heat treatment and equal channel angular pressing. Arch. Civ. Mech. Eng. 2024, 24, 235. [Google Scholar] [CrossRef]
  10. Prashantha Kumar, H.G.; Anthony Xavior, M. Graphene Reinforced Metal Matrix Composite (GRMMC): A Review. Procedia Eng. 2014, 97, 1033–1040. [Google Scholar] [CrossRef]
  11. Chen, Z.; Taplin, D.J.; Weyland, M.; Allen, L.J.; Findlay, S.D. Composition measurement in substitutionally disordered materials by atomic resolution energy dispersive X-ray spectroscopy in scanning transmission electron microscopy. Ultramicroscopy 2017, 176, 52–62. [Google Scholar] [CrossRef] [PubMed]
  12. Stangl, J.; Mocuta, C.; Diaz, A.; Metzger, T.H.; Bauer, G. X-Ray Diffraction as a Local Probe Tool; Wiley-VCH Verlag: Hoboken, NJ, USA, 2009. [Google Scholar] [CrossRef]
  13. Zhao, W.; Liu, J.K.; Chen, Y.Y. Material behavior modeling with multi-output support vector regression. Appl. Math. Model 2015, 39, 5216–5229. [Google Scholar] [CrossRef]
  14. Huang, S.J.; Selvaraju, S.; Subramani, M.; Li, C. The synergistic impact of graphene and copper on microstructure, corrosion behaviors and biocompatibility of a magnesium metal matrix composite in Hank’s solution. J. Taiwan Inst. Chem. Eng. 2024, 162, 105596. [Google Scholar] [CrossRef]
  15. Huang, S.J.; Wang, C.F.; Subramani, M.; Selvaraju, S.; Rajagopal, V.; Chiang, C.C.; Fan, F.F. The Impact of Graphene on the Mechanical Properties, Corrosion Behavior, and Biocompatibility of an Mg–Ca Alloy. J. Am. Ceram. Soc. 2024. [Google Scholar] [CrossRef]
  16. Cashion, S.P.; Ricketts, N.J.; Hayes, P.C. Characterisation of protective surface films formed on molten magnesium protected by air/SF 6 atmospheres. J. Light Met. 2002, 2, 37–42. [Google Scholar] [CrossRef]
  17. Huang, S.J.; Subramani, M.; Ali, A.N.; Alemayehu, D.B.; Aoh, J.N.; Lin, P.C. The Effect of Micro-SiCp Content on the Tensile and Fatigue Behavior of AZ61 Magnesium Alloy Matrix Composites. Int. J. Met. 2021, 15, 780–793. [Google Scholar] [CrossRef]
  18. Morsiya, C.H.; Pandya, S. Effect of stir casting process parameters and stirrer blade geometry on mechanical properties of al MMCs—A review. Arch. Metall. Mater. 2023, 68, 1473–1495. [Google Scholar] [CrossRef]
  19. Huanga, S.J.; Kannaiyan, S.; Subramani, M. Effect of nano-Nb2O5 on the microstructure and mechanical properties of AZ31 alloy matrix nanocomposites. Adv. Nano Res. 2022, 13, 407–416. [Google Scholar] [CrossRef]
  20. Subramani, M.; Huang, S.J.; Borodianskiy, K. Effect of SiC Nanoparticles on AZ31 Magnesium Alloy. Materials 2022, 15, 1004. [Google Scholar] [CrossRef]
  21. Rashad, M.; Pan, F.; Asif, M.; Chen, X. Corrosion behavior of magnesium-graphene composites in sodium chloride solutions. J. Magnes. Alloys 2017, 5, 271–276. [Google Scholar] [CrossRef]
  22. Kiełbus, A.; Jarosz, R.; Gryc, A. Effect of modification on microstructure and properties of AZ91 magnesium alloy. Crystals 2020, 10, 536. [Google Scholar] [CrossRef]
  23. Kim, S.; Kim, K.; Koo, J.; Lee, H.; Min, B.I.; Kim, D.Y. Pressure-induced phase transitions and superconductivity in magnesium carbides. Sci. Rep. 2019, 9, 20253. [Google Scholar] [CrossRef] [PubMed]
  24. Cordero, Z.C.; Knight, B.E.; Schuh, C.A. Six Decades of the Hall–Petch Effect—A Survey of Grain-Size Strengthening Studies on Pure Metals; Taylor and Francis Ltd.: Abingdon, UK, 2016. [Google Scholar] [CrossRef]
  25. Wang, B.B.; Xie, G.M.; Wu, L.H.; Xue, P.; Ni, D.R.; Xiao, B.L.; Liu, Y.D.; Ma, Z.Y. Grain size effect on tensile deformation behaviors of pure aluminum. Mater. Sci. Eng. A 2021, 820, 141504. [Google Scholar] [CrossRef]
  26. Rickman, J.M.; Lawrence, A.; Rollett, A.D.; Harmer, M.P. Calculating probability densities associated with grain-size distributions. Comput. Mater. Sci. 2015, 101, 211–215. [Google Scholar] [CrossRef]
  27. Furukawa, M.; Horita, Z.; Nemoto, M.; Valiev, R.Z.; Langdon, T.G. Microhardness measurements and the Hall-Petch relationship in an Al-Mg alloy with submicrometer grain size. Acta Mater. 1996, 44, 4619–4629. [Google Scholar] [CrossRef]
  28. Huang, S.J.; Li, C.; Feng, J.H.; Selvaraju, S.; Subramani, M. Mechanical and Corrosion Tests for Magnesium–Zinc/Ti-6Al-4V Composites by Gravity Casting. Materials 2024, 17, 1836. [Google Scholar] [CrossRef]
  29. Naseer, A.; Ahmad, F.; Muhsan, A.S.; Aslam, M. ScienceDirect Investigation of suitable graphene reinforcements for copper based PIM feedstock. Mater. Today Proc. 2019, 16, 2052–2059. [Google Scholar] [CrossRef]
  30. Du, X.; Du, W.; Wang, Z.; Liu, K.; Li, S. Defects in graphene nanoplatelets and their interface behavior to reinforce magnesium alloys. Appl. Surf. Sci. 2019, 484, 414–423. [Google Scholar] [CrossRef]
  31. Tiwari, J.K.; Mandal, A.; Rudra, A.; Sathish, N.; Kumar, S.; Singh, A.K. Influence of graphene content on the mechanical properties of severely deformed graphene/aluminum composite. Mater. Chem. Phys. 2020, 248, 122939. [Google Scholar] [CrossRef]
  32. Rashad, M.; Pan, F.; Liu, Y.; Chen, X.; Lin, H.; Pan, R.; Asif, M.; She, J. High temperature formability of graphene nanoplatelets-AZ31 composites fabricated by stir-casting method. J. Magnes. Alloys 2016, 4, 270–277. [Google Scholar] [CrossRef]
  33. Liu, F.; Wang, Z.; Du, X.; Li, S.; Du, W. Microstructure and Mechanical Properties of Magnesium Matrix Composites Reinforced by In Situ Reduced Graphene Oxide. Materials 2023, 16, 2303. [Google Scholar] [CrossRef] [PubMed]
  34. Rashad, M.; Pan, F.; Lin, D.; Asif, M. High temperature mechanical behavior of AZ61 magnesium alloy reinforced with graphene nanoplatelets. Mater. Des. 2016, 89, 1242–1250. [Google Scholar] [CrossRef]
  35. Parizi, M.T.; Ebrahimi, G.R.; Ezatpour, H.R. Effect of graphene nanoplatelets content on the microstructural and mechanical properties of AZ80 magnesium alloy. Mater. Sci. Eng. A 2019, 742, 373–389. [Google Scholar] [CrossRef]
  36. Yuan, Q.H.; Zhou, G.H.; Liao, L.; Liu, Y.; Luo, L. Interfacial structure in AZ91 alloy composites reinforced by graphene nanosheets. Carbon 2018, 127, 177–186. [Google Scholar] [CrossRef]
  37. Venkatesan, S.; Anthony Xavior, M. Tensile behavior of aluminum alloy (AA7050) metal matrix composite reinforced with graphene fabricated by stir and squeeze cast processes. Sci. Technol. Mater. 2018, 30, 74–85. [Google Scholar] [CrossRef]
  38. Huang, S.J.; Mose, M.P.; Kannaiyan, S. A study of the mechanical properties of AZ61 magnesium composite after equal channel angular processing in conjunction with machine learning. Mater. Today Commun. 2022, 33, 104707. [Google Scholar] [CrossRef]
  39. Huang, S.J.; Adityawardhana, Y.; Sanjaya, J. Predicting Mechanical Properties of Magnesium Matrix Composites with Regression Models by Machine Learning. J. Compos. Sci. 2023, 7, 347. [Google Scholar] [CrossRef]
  40. Xu, Y.; Goodacre, R. On Splitting Training and Validation Set: A Comparative Study of Cross-Validation, Bootstrap and Systematic Sampling for Estimating the Generalization Performance of Supervised Learning. J. Anal. Test. 2018, 2, 249–262. [Google Scholar] [CrossRef]
  41. Snee, R.D. Validation of Regression Models: Methods and Examples. Technometrics 1977, 19, 415–428. [Google Scholar] [CrossRef]
  42. Sipper, M. High Per Parameter: A Large-Scale Study of Hyperparameter Tuning for Machine Learning Algorithms. arXiv 2022, arXiv:2207.06028. [Google Scholar]
  43. Fan, H.; Wang, Q.; El-Awady, J.A.; Raabe, D.; Zaiser, M. Strain rate dependency of dislocation plasticity. Nat. Commun. 2021, 12, 1845. [Google Scholar] [CrossRef]
  44. Kostryzhev, A.G. Strengthening mechanisms in metallic materials. Metals 2021, 11, 1134. [Google Scholar] [CrossRef]
  45. Li, C.L.; Mei, Q.S.; Li, J.Y.; Chen, F.; Ma, Y.; Mei, X.M. Hall-Petch relations and strengthening of Al-ZnO composites in view of grain size relative to interparticle spacing. Scr. Mater. 2018, 153, 27–30. [Google Scholar] [CrossRef]
  46. Singh, H.; Kumar, D. Validation of Novel Geometrically Necessary Dislocations Calculation Model Using Nanoindentation of the Metal Matrix Nanocomposite. Metall. Mater. Trans. A Phys. Metall. Mater. Sci. 2020, 51, 6700–6705. [Google Scholar] [CrossRef]
  47. Huang, S.J.; Abbas, A.; Ballóková, B. Effect of CNT on microstructure, dry sliding wear and compressive mechanical properties of AZ61 magnesium alloy. J. Mater. Res. Technol. 2019, 8, 4273–4286. [Google Scholar] [CrossRef]
  48. Hadadzadeh, A.; Amirkhiz, B.S.; Mohammadi, M. Contribution of Mg2Si precipitates to the strength of direct metal laser sintered AlSi10Mg. Mater. Sci. Eng. A 2019, 739, 295–300. [Google Scholar] [CrossRef]
  49. Zong, B.Y.; Zhang, F.; Wang, G.; Zuo, L. Strengthening mechanism of load sharing of particulate reinforcements in a metal matrix composite. J. Mater. Sci. 2007, 42, 4215–4226. [Google Scholar] [CrossRef]
  50. Várdai, R.; Lummerstorfer, T.; Pretschuh, C.; Jerabek, M.; Gahleitner, M.; Faludi, G.; Móczó, J.; Pukánszky, B. Comparative study of fiber reinforced PP composites: Effect of fiber type, coupling and failure mechanisms. Compos. Part A Appl. Sci. Manuf. 2020, 133, 105895. [Google Scholar] [CrossRef]
  51. Yoo, M.H.; Song, J.; Oh, J.; Kang, S.; Kim, K.; Yang, S.; Moon, M. Development of a bus armrest fabrication process with a high-vacuum, high-pressure die-casting process using the AM60 alloy. Robot. Comput. Integr. Manuf. 2019, 55, 154–159. [Google Scholar] [CrossRef]
  52. Jan, R.; Habib, A.; Abbasi, H.Y. High aspect ratio graphene nanosheets cause a very low percolation threshold for polymer nanocomposites. Acta Phys. Pol. A 2016, 129, 478–481. [Google Scholar] [CrossRef]
  53. Tang, Y.; Xie, C.; Chen, J.; Wang, X. Atomistic Insights into the Competition between Damage and Dynamic Recrystallization Stimulated by the Precipitate Mgi7Ali2 in Magnesium Alloys. Metals 2022, 12, 633. [Google Scholar] [CrossRef]
  54. Arsenault, R.J.; Shi, N. Dislocation Generation Due to Differences between the Coefficients of Thermal Expansion. Mater. Sci. Eng. 1986, 81, 175–187. [Google Scholar] [CrossRef]
  55. Lukáč, P.; Rudajevová, A. Thermal expansion in magnesium composites. Kov. Mater.-Met. Mater. 2003, 41, 281–292. [Google Scholar]
  56. Yoon, D.; Son, Y.W.; Cheong, H. Negative thermal expansion coefficient of graphene measured by raman spectroscopy. Nano Lett. 2011, 11, 3227–3231. [Google Scholar] [CrossRef] [PubMed]
  57. Alexopoulos, N.D.; Paragkamian, Z.; Poulin, P.; Kourkoulis, S.K. Fracture related mechanical properties of low and high graphene reinforcement of epoxy nanocomposites. Compos. Sci. Technol. 2017, 150, 194–204. [Google Scholar] [CrossRef]
Figure 2. Specimen preparation.
Materials 17 04673 g002
Figure 3. XRD Analysis of Graphene for Reinforcement.
Materials 17 04673 g003
Figure 4. XRD results for all samples.
Materials 17 04673 g004
Figure 5. Crystalline size, microstrain, and dislocation density derived from XRD data.
Materials 17 04673 g005
Figure 6. Raman spectroscopy of all samples.
Materials 17 04673 g006
Figure 7. Optical microscopy images of AM60B graphene grains: (A) x = 0, (B) x = 0.1, and (C) x = 0.2.
Materials 17 04673 g007
Figure 8. Calculated grain size with the addition of reinforcement AM60B-xGraphene: (A) x = 0, (B) x = 0.1, and (C) x = 0.2.
Materials 17 04673 g008
Figure 9. SEM-EDS of AM60B/graphene composites with (A) 0 wt.%, (B) 0.1 wt.%, and (C) 0.2 wt.%.
Materials 17 04673 g009
Figure 10. EDS points of the phase formed in the sample (A) Mg17Al12; (B) MgC2.
Materials 17 04673 g010
Figure 11. Tensile stress–strain curve of all samples.
Materials 17 04673 g011
Figure 12. (A) Microhardnesses of the alloys and composites, (B) Plot hardness vs. grain size for all the samples.
Materials 17 04673 g012
Figure 13. Training data for regression analysis AM60B-xGraphene: (A) x = 0, (B) x = 0.1, and (C) x = 0.2.
Materials 17 04673 g013
Figure 14. Regression lines of AM60B-xGraphene: (A) x = 0, (B) x = 0.1, and (C) x = 0.2.
Materials 17 04673 g014
Figure 15. Linear fit yield strength vs. grain size.
Materials 17 04673 g015
Figure 16. Fracture Surface Study of AM60B-xGraphene (A) x = 0, (B) x = 0.1, (C) x = 0.2.
Materials 17 04673 g016
Figure 17. Additional SEM-fracture surface of AM60B-0.2wt.%. (A) EDS mapping. (B) EDS spectra.
Materials 17 04673 g017
Figure 18. MSE, R2, and MAE for the stress–strain curve AM60B-xGraphene: (A) x = 0, (B) x = 0.1, (C) x = 0.2.
Materials 17 04673 g018
Table 1. Elemental composition of the matrix material in wt.%.
ElementsAlMnZnSiFeCuNiMg
wt.%5.8000.3200.2200.1000.0050.010.002Bal
Table 2. Compositions of the composites used in this study.
No.Matrix (AM60B) (wt.%)Reinforcement (Graphene) (wt.%)
11000
299.90.1
399.80.2
Table 3. Peak positions and the associated phases.
Associated PhasesPeak Positions
Mg0.97Zn0.0332.391
34.611
36.854
48.131
57.776
63.499
67.812
69.13
70.525
73.017
78.424
Al12Mg1736.12
40.079
41.943
43.742
64.94
MgC232.15
Table 4. Phase quantification in this study.
SampleAssociated PhasePatternPercentage (%)Structure
AM60B 0 wt.% grapheneMg0.97Zn0.03PDF 65–459681.4Hexagonal
Mg17Al12PDF 73–114818.6Cubic
AM60B 0.1 wt.% grapheneMg0.97Zn0.03PDF 65–459687.7Hexagonal
Mg17Al12PDF 73–11488.9Cubic
MgC2PDF 89–77453.4Tetragonal
AM60B 0.2 wt.% grapheneMg0.97Zn0.03PDF 65–459683.6Hexagonal
Mg17Al12PDF 73–114811.3Cubic
MgC2PDF 89–77455.1Tetragonal
Table 5. Estimated crystalline size, dislocation density, and microstrain from XRD analysis.
SamplesCrystalline Size (nm)MicrostrainDislocation Density (nm−2)
AM60B25.2373.2730.00157
AM60B-0.1 Gr22.963.6110.0019
AM60B-0.2 Gr26.793.5180.00139
Table 7. Parameters for calculating the strengthening mechanism.
ParameterDefinitionValueReferences
KHall–Petch Constant1247.78 MPa μm0.5Calculated
VfVolume Fraction of Reinforcement0.077% and 0.154% Calculated and [51]
SAspect Ratio1272[52]
VmVolume Fraction of Matrix99.9232% and 99.9846% Calculated
σmYield Strength of Matrix101.665 MPaExperimental
αThermal Constant1.25[52]
GmShear Modulus8.132 GPaExperimental
bBurgers Vector0.32 nm[53]
BGeometric Constant12[54]
AmThermal Expansion of Matrix25:2 × 10⁻⁶ C−1[55]
ArThermal Expansion of Reinforcement−8 × 10⁻⁶/°C[56]
TtTesting Temperature for Tensile25 °CTemperature during Testing
dpReinforcement Size3.9 µmCalculated from Purchased Certificate
Table 8. Summary of strengthening mechanism and association equations.
Strengthening MechanismAssociating Equation
Orowan StrengtheningEquation (6); the rest of the constants are tabulated in Table 4
Hall–PetchEquation (7) to plot the linear fit and then Equation (8) to calculate the Hall–Petch value
Load TransferUse the value of yield strength matrix (σm), the aspect ratio (S) from reference and calculate (Vf) from the equation (use Equation (10) with respect to the constant in Table 7)
CTEDirectly use Equation (9) with respect to the constant in Table 7
Table 9. Each strengthening mechanism contribution.
MaterialsHP LT CTE Orowan
AM60B 0.1 wt%14.386928.230154260.0016990.078315446
AM60B 0.2 wt%7.23745.657575040.0023760.028294488
Table 10. Evaluation of the modulus elasticity compared with the machine learning metric for each sample.
MaterialEvaluated Strain (%)MSER2MAEE(MPa)
AM60B0.50.0105090.9994860.098703124.000253
AM60B-0.1 wt.% Graphene0.50.0651180.9991840.21435135.742772
AM60B-0.2 wt.% Graphene0.50.0045080.9998080.058588104.550762
Disclaimer/Publisher’s Note: The statements, opinions and data contained in all publications are solely those of the individual author(s) and contributor(s) and not of MDPI and/or the editor(s). MDPI and/or the editor(s) disclaim responsibility for any injury to people or property resulting from any ideas, methods, instructions or products referred to in the content.

