
Experimental Study on Acoustic Emission Features and Energy Dissipation Properties during Rock Shear-Slip Process


Abstract
:1. Introduction
2. Rock Shear-Slip Test
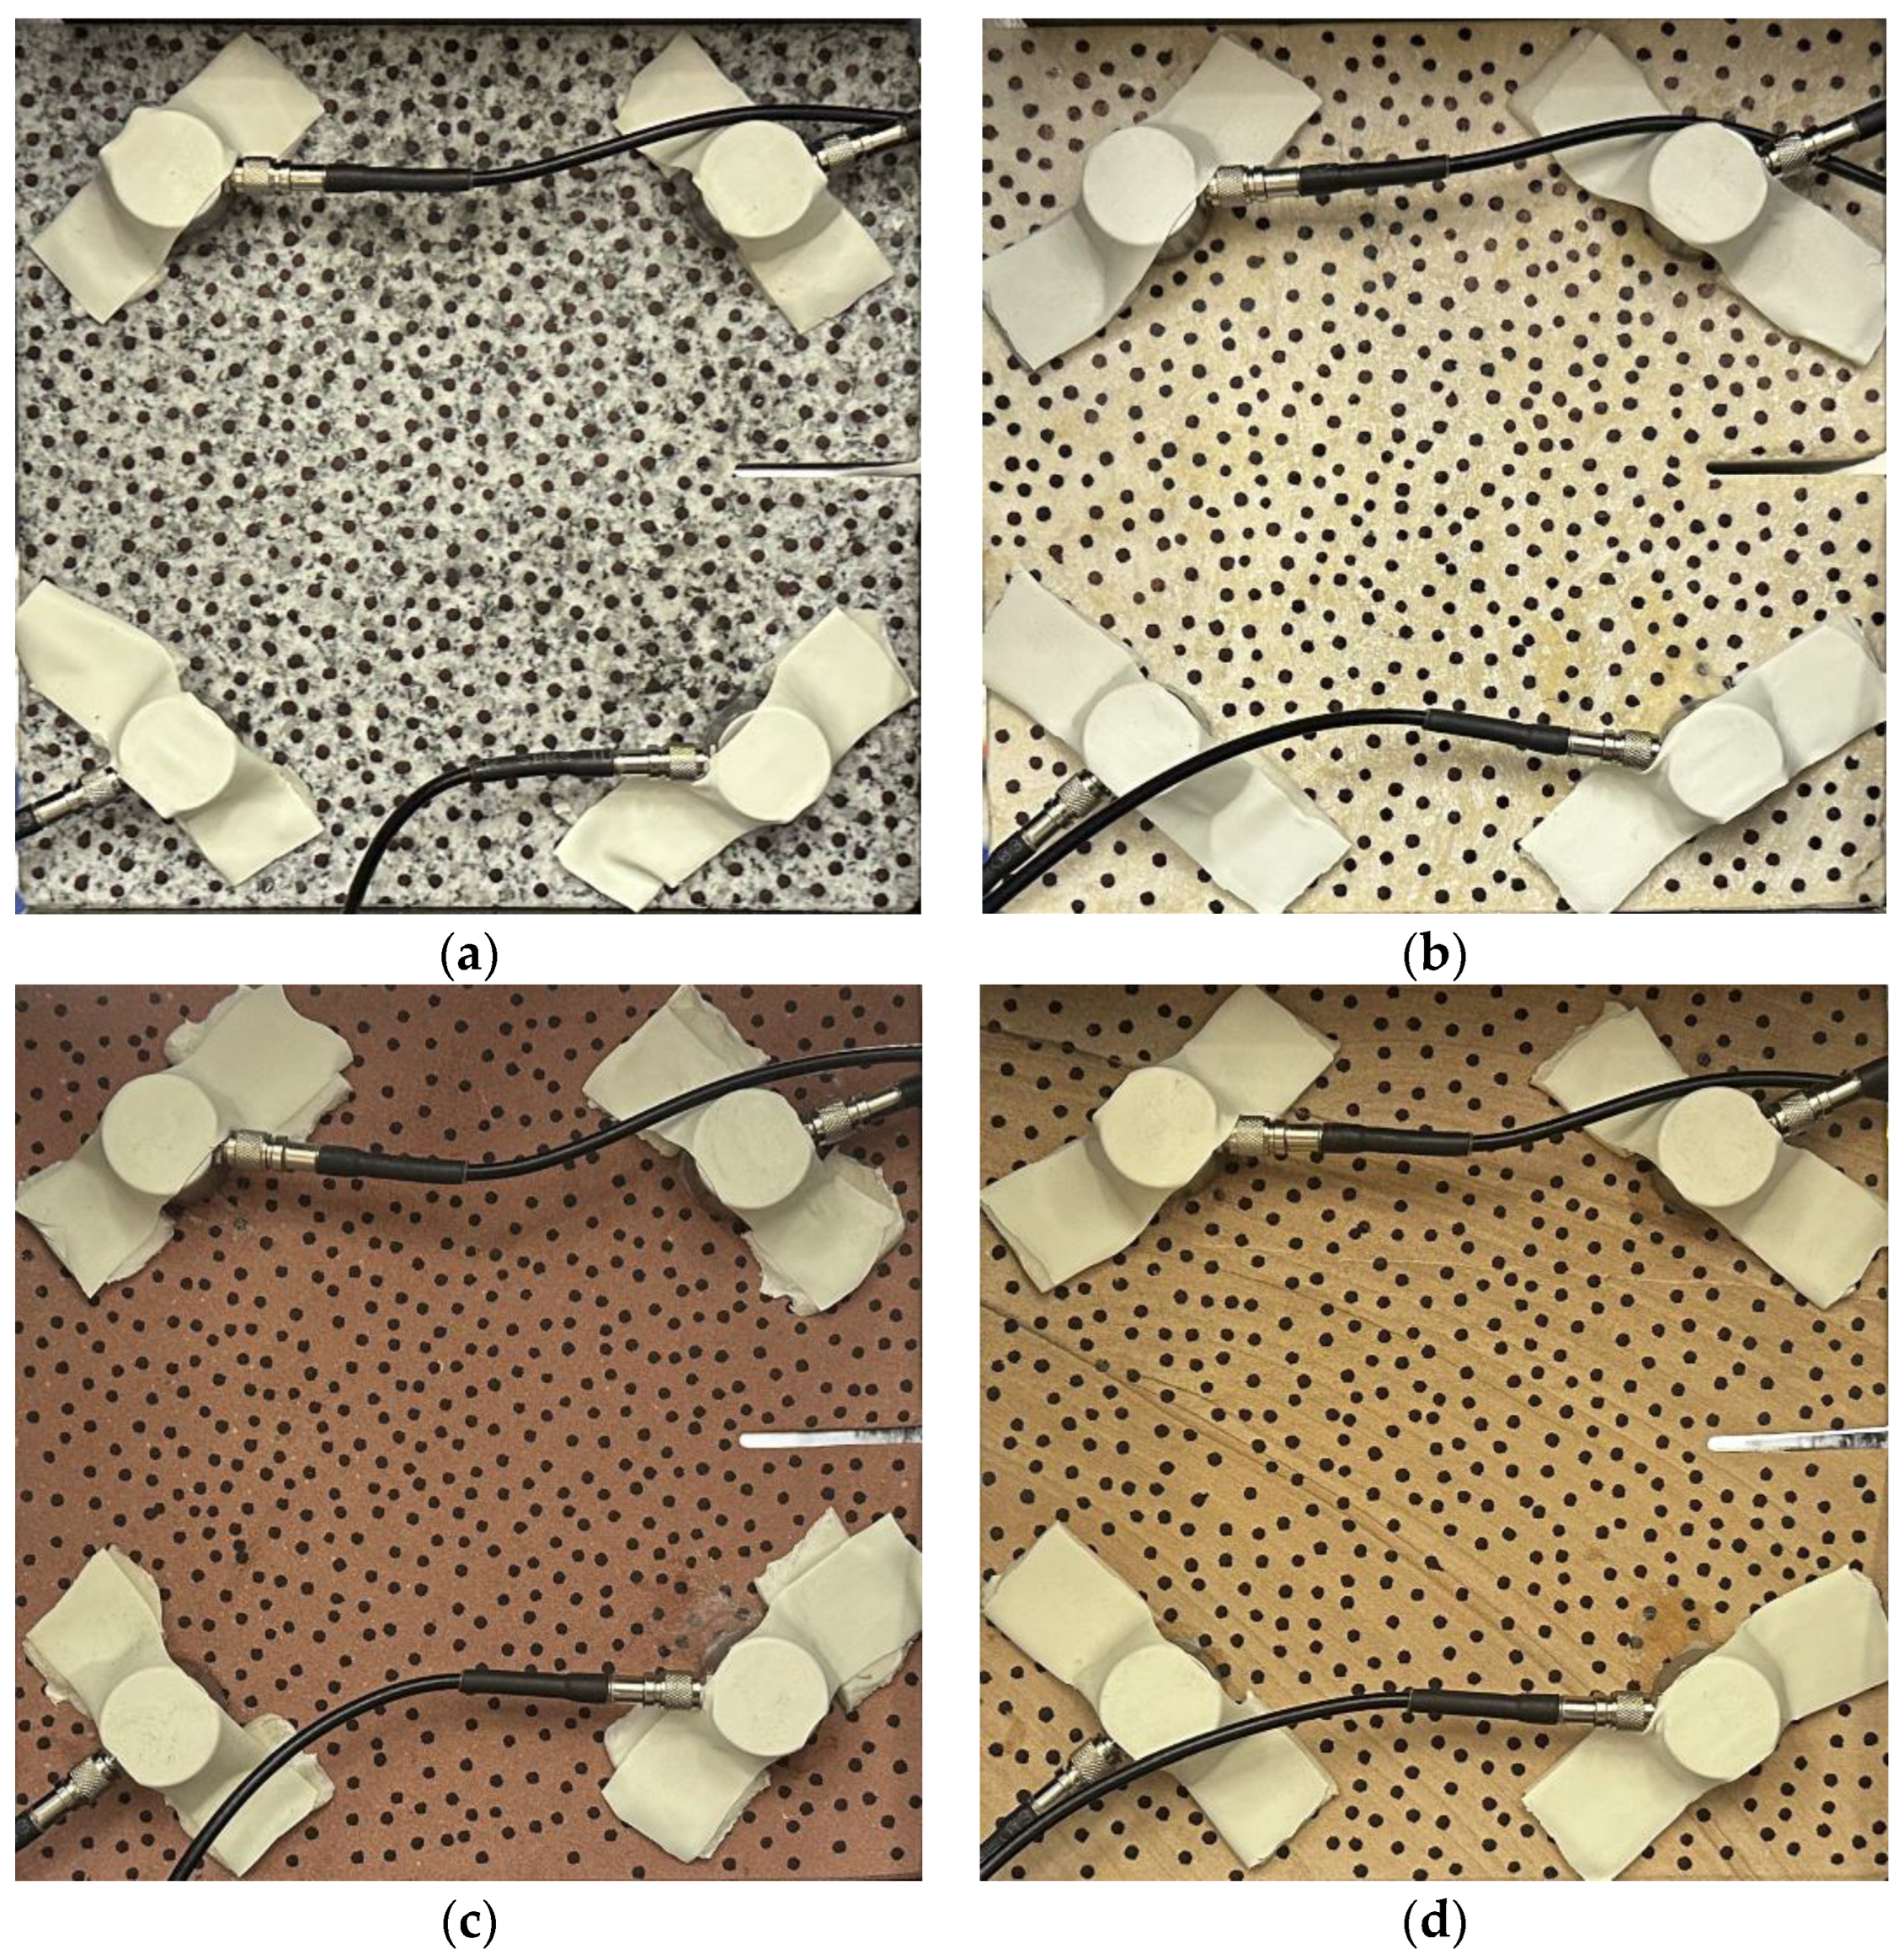
2.1. Rock Specimens
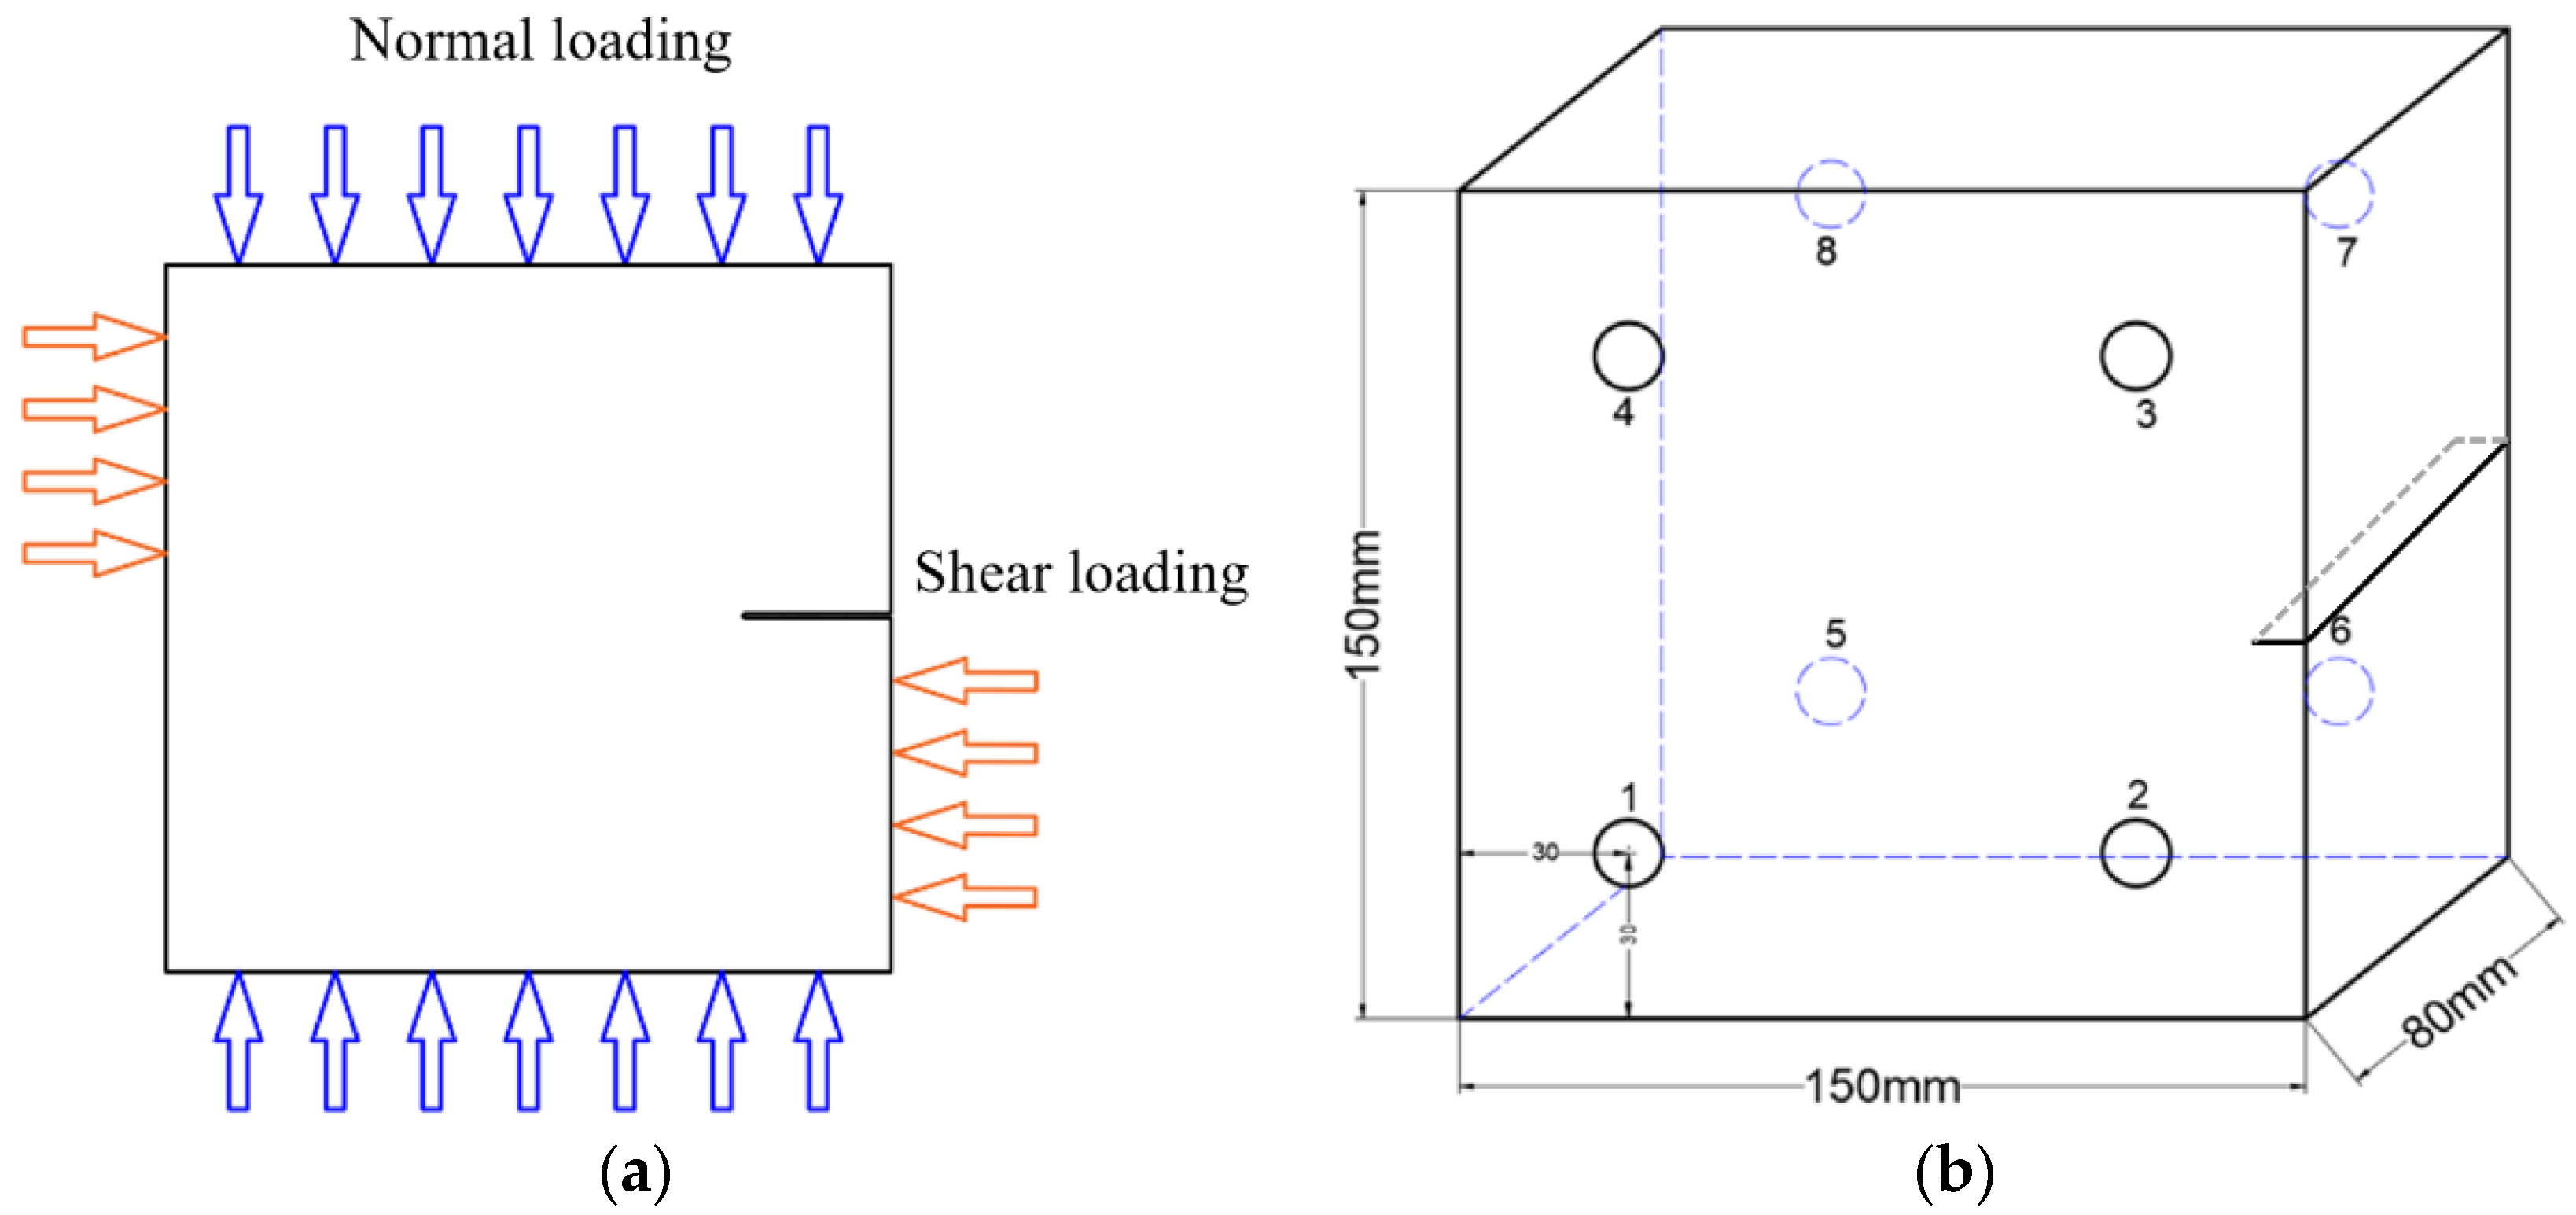
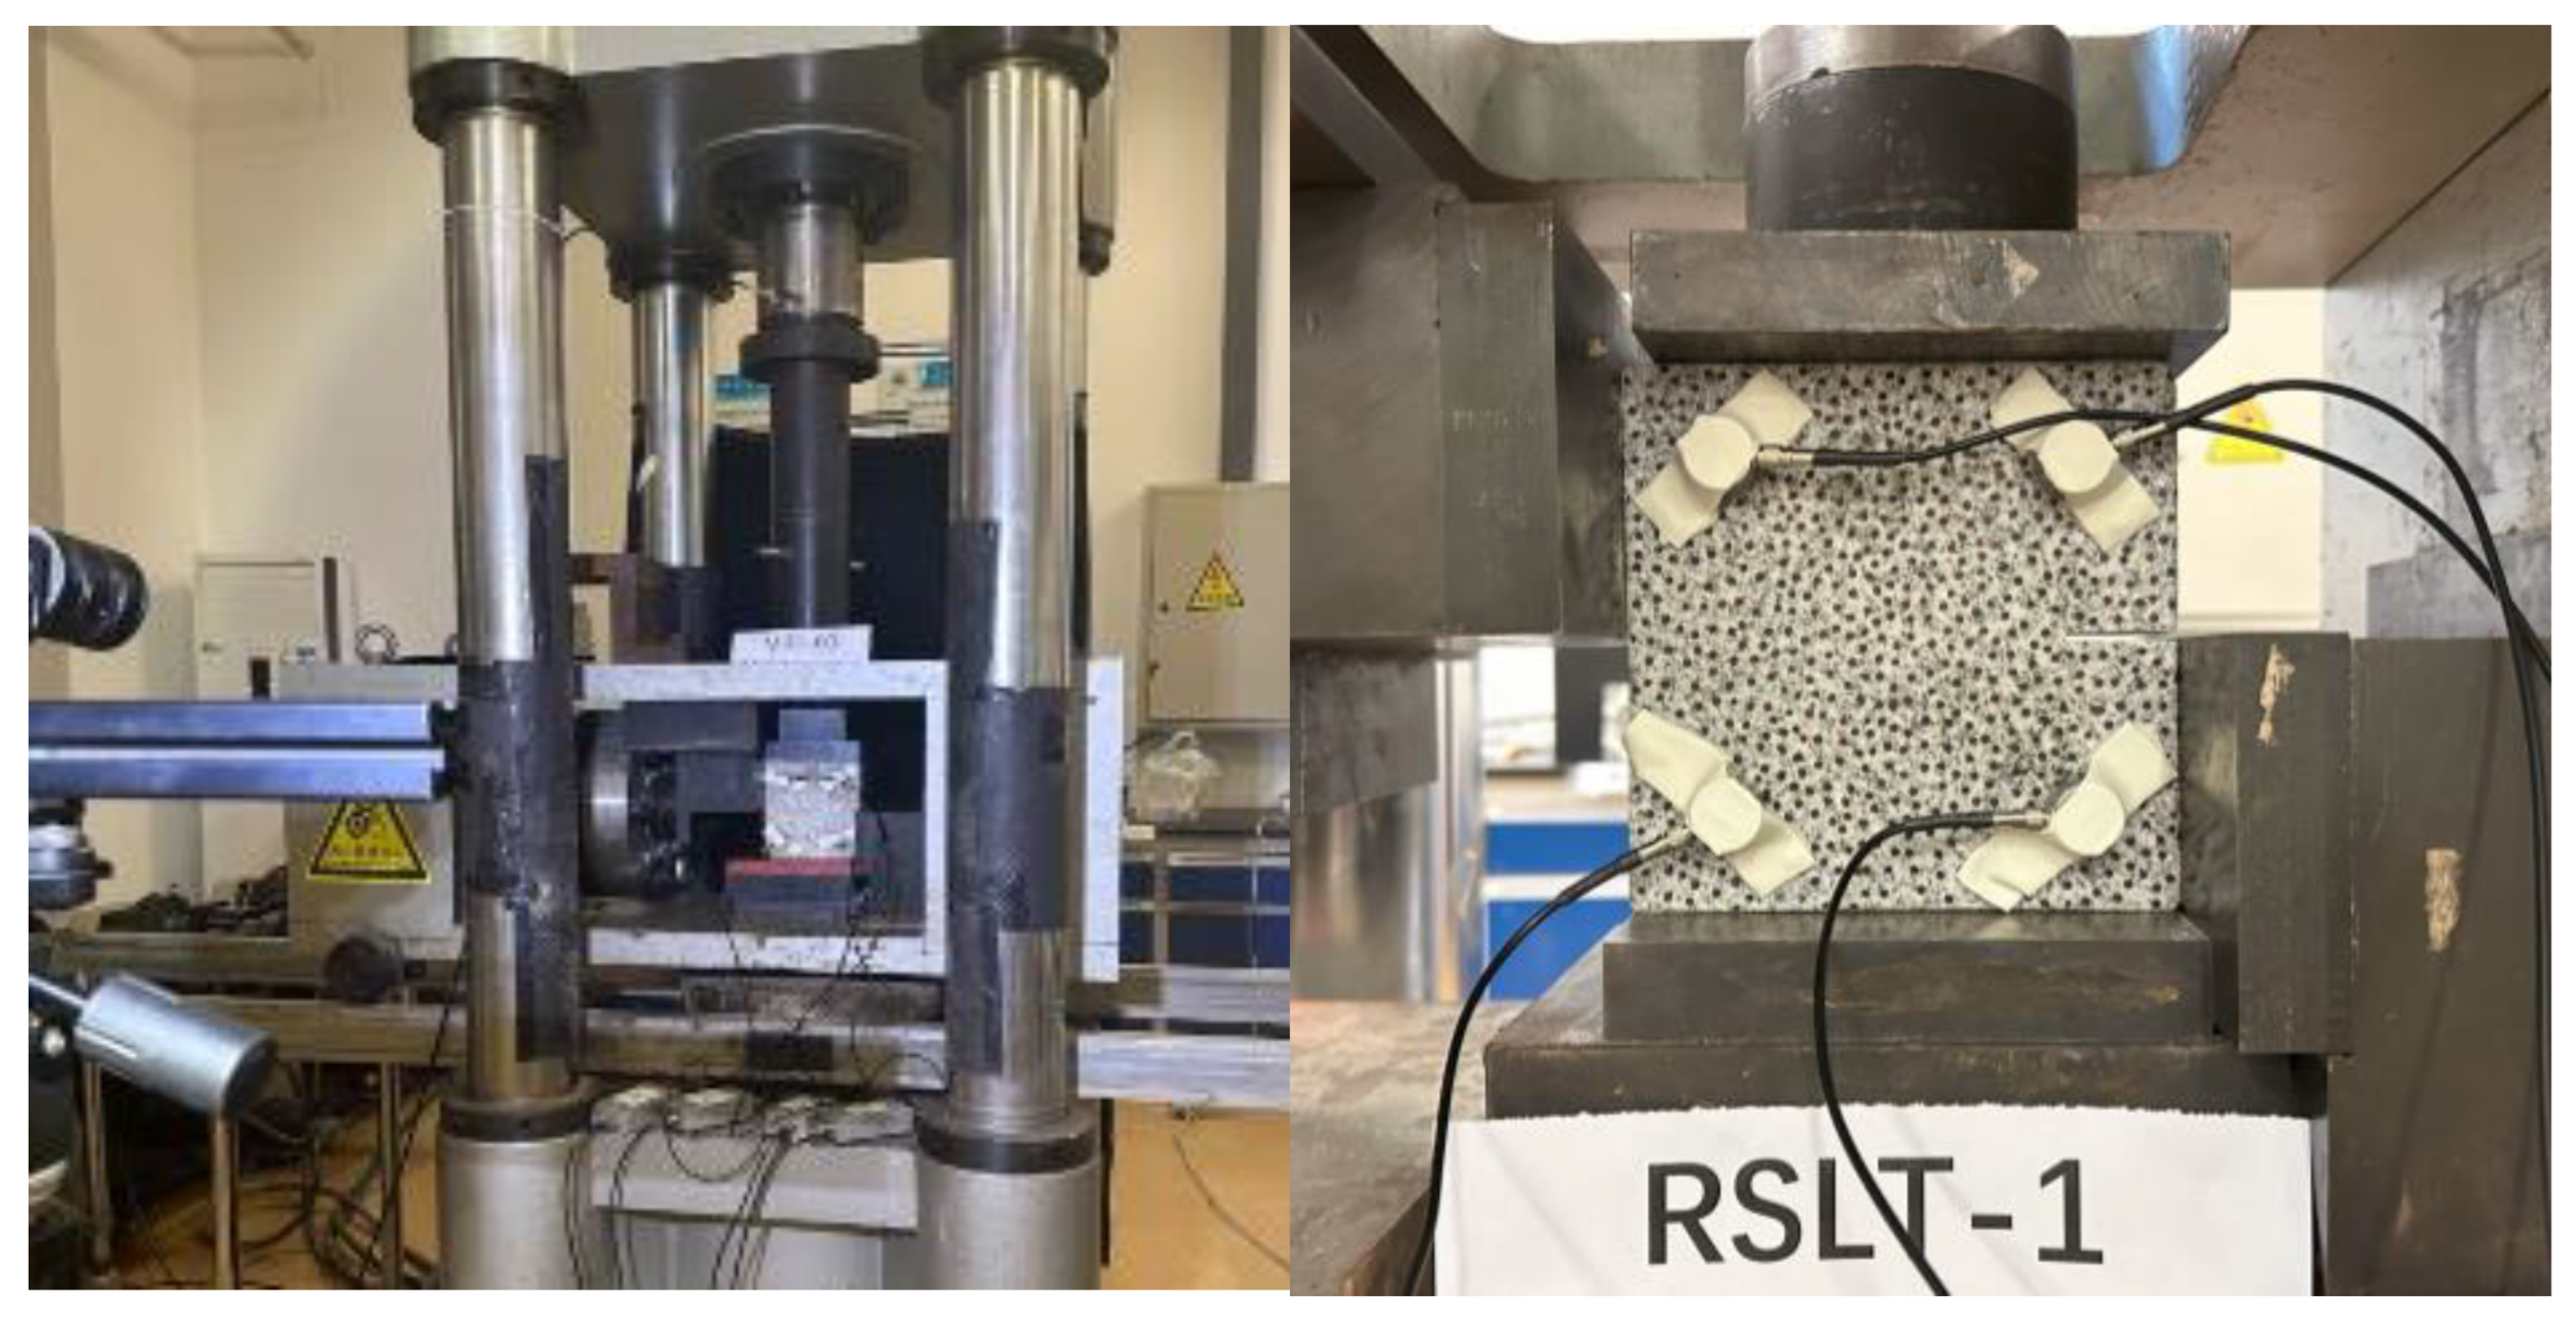
2.2. Test System
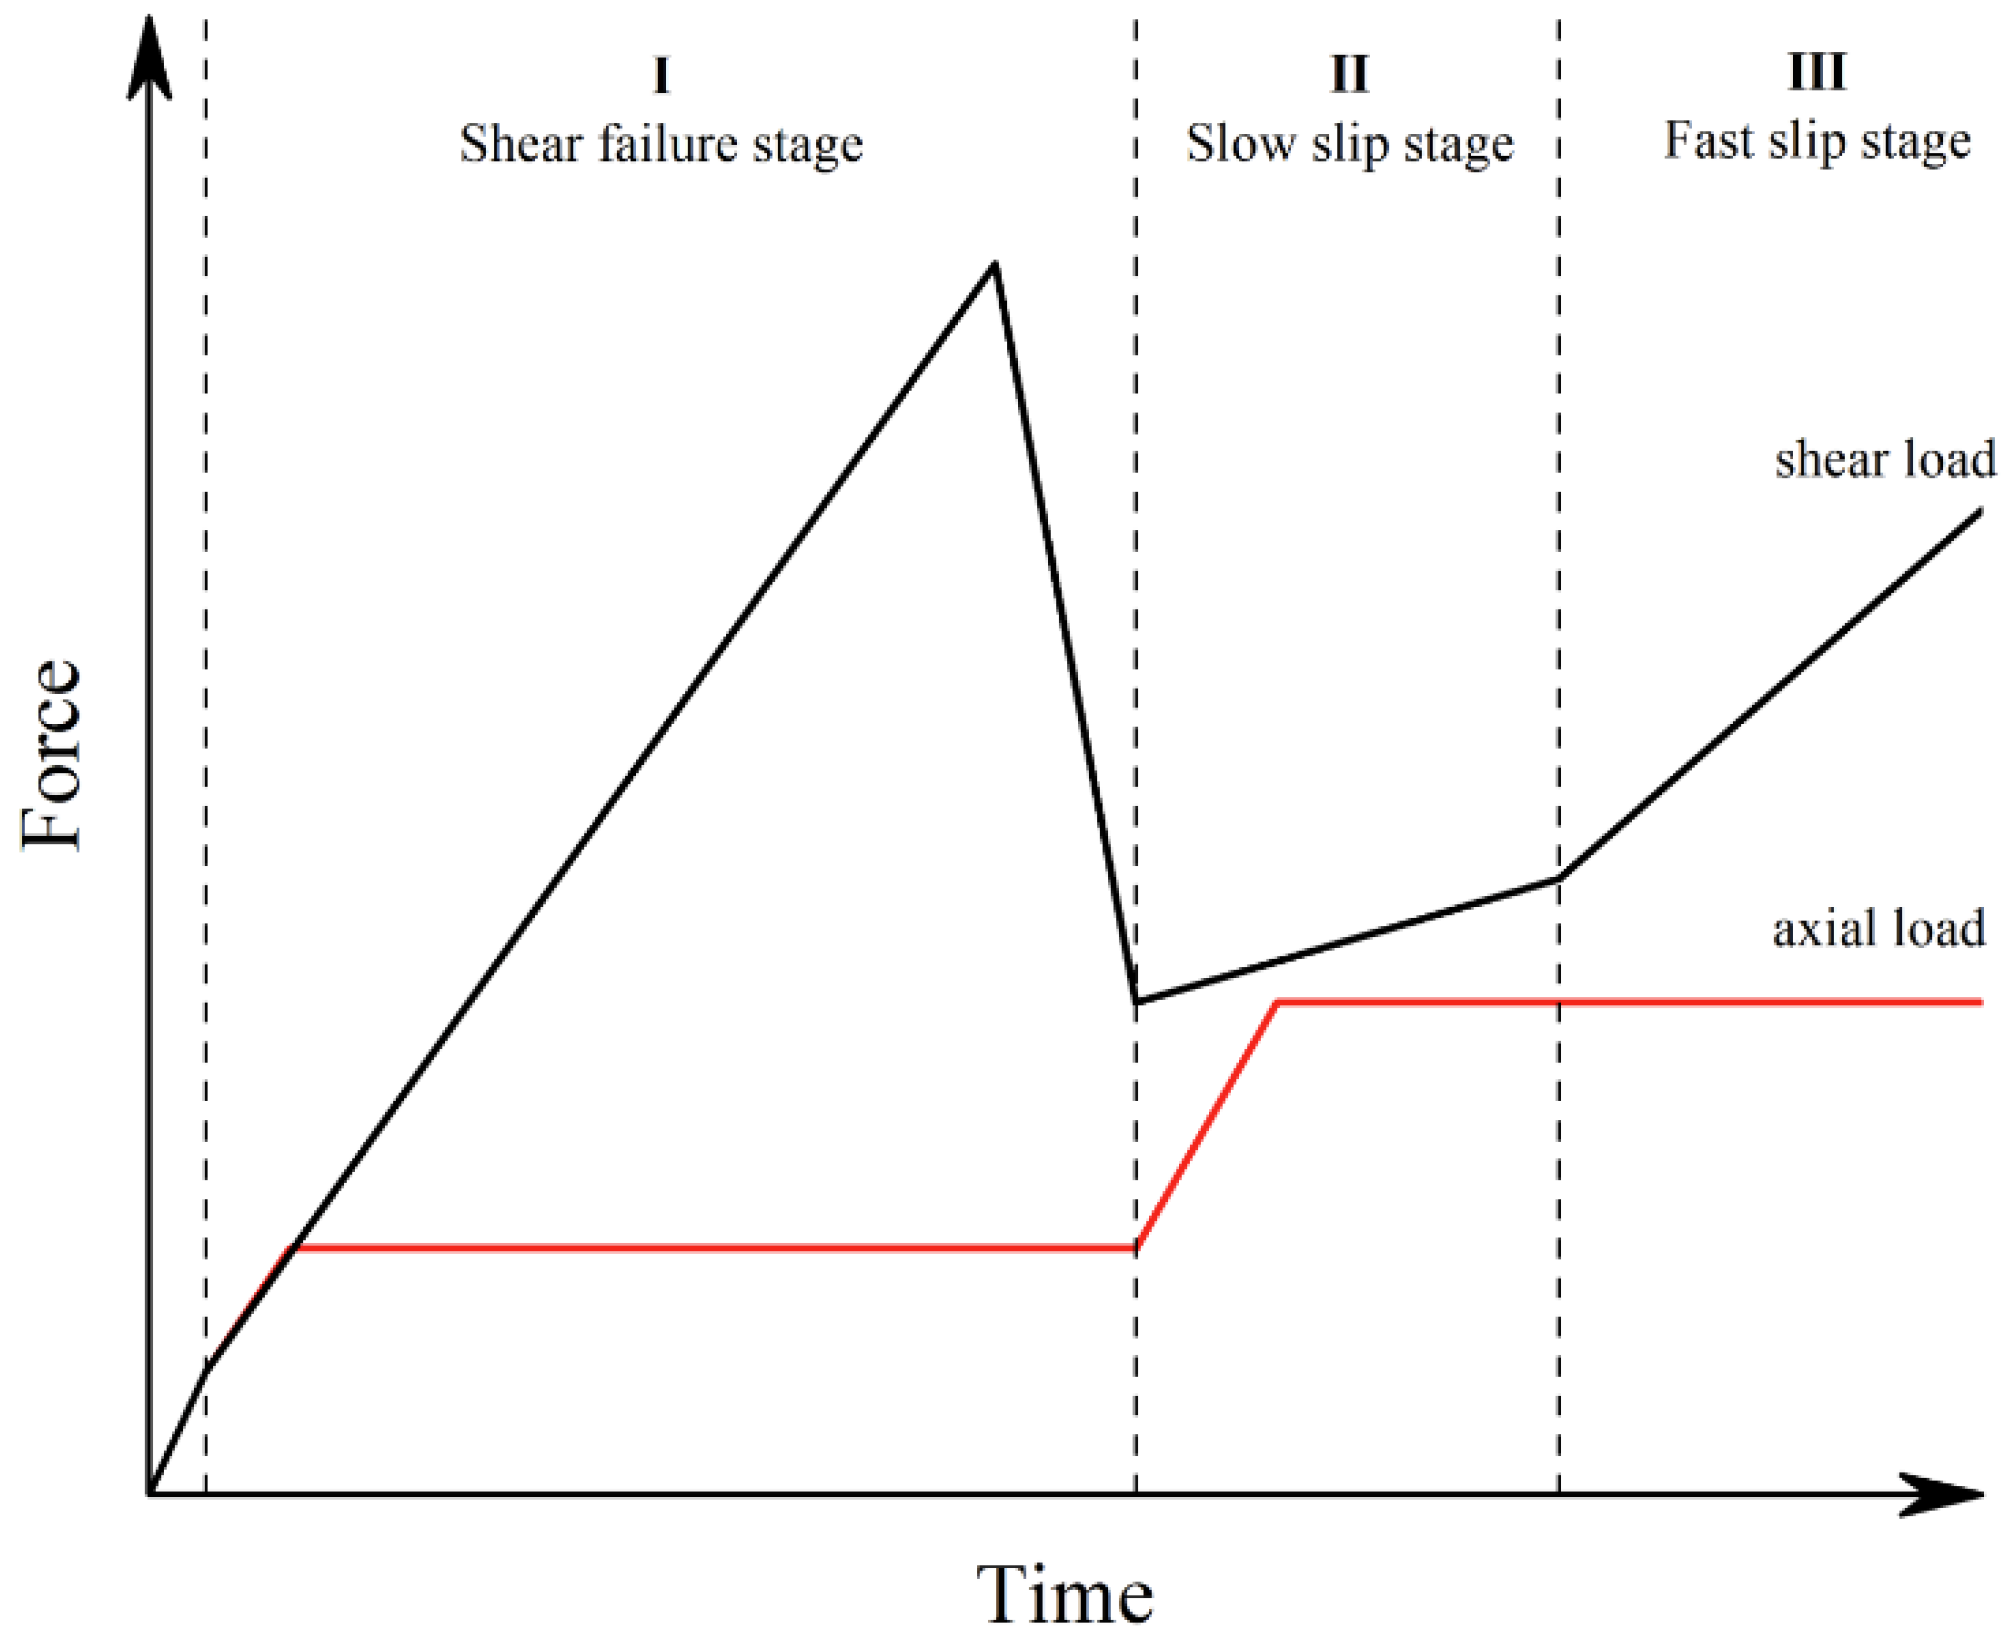
- I, Shear failure phase: Loading to 100 kN in the normal direction at a rate of 500 N/s, and at a rate of 0.15 mm/min to shear failure in the shear direction.
- II, Slow slip phase: Normal load is to 200 kN at a rate of 500 N/s, and the shear direction of slip magnitude is 1.5 mm at a rate of 0.12 mm/min.
- III, Fast slip phase: Normal direction remains unchanged, and the shear direction of slip magnitude is 1.5 mm by 0.3 mm/min. Then, the test is over.
2.3. Results
2.3.1. Mechanical Analysis
- Granite RSLT-1 specimen: It exhibits the highest shear strength, the lowest strength in the slip phase, the largest stress drops after the peak, and the largest shear strain in the shear failure phase.
- White sandstone RSLT-3 specimen: The shear strength of the specimen closely resembles that of RSLT-1. The strength of the slip phase is significantly higher than that of the other specimens. The stress drop after the peak is the smallest. The shear strain in the shear failure phase is lower than that of the RSLT-1 specimen.
- Red sandstone RSLT-4 specimen: The shear and slip phases exhibit characteristics with low values. The difference between the two values is minimal. The shear strain in the shear failure phase is lower than that of the white sandstone RSLT-3 specimen.
- Yellow sandstone RSLT-5 specimen: The shear strength is the lowest. The shear failure time is the earliest. The post-peak stress is reduced to the preloading stress level, but the strength of the slip phase is relatively high. The shear strain in the shear failure phase is the smallest.
2.3.2. Fracture Features
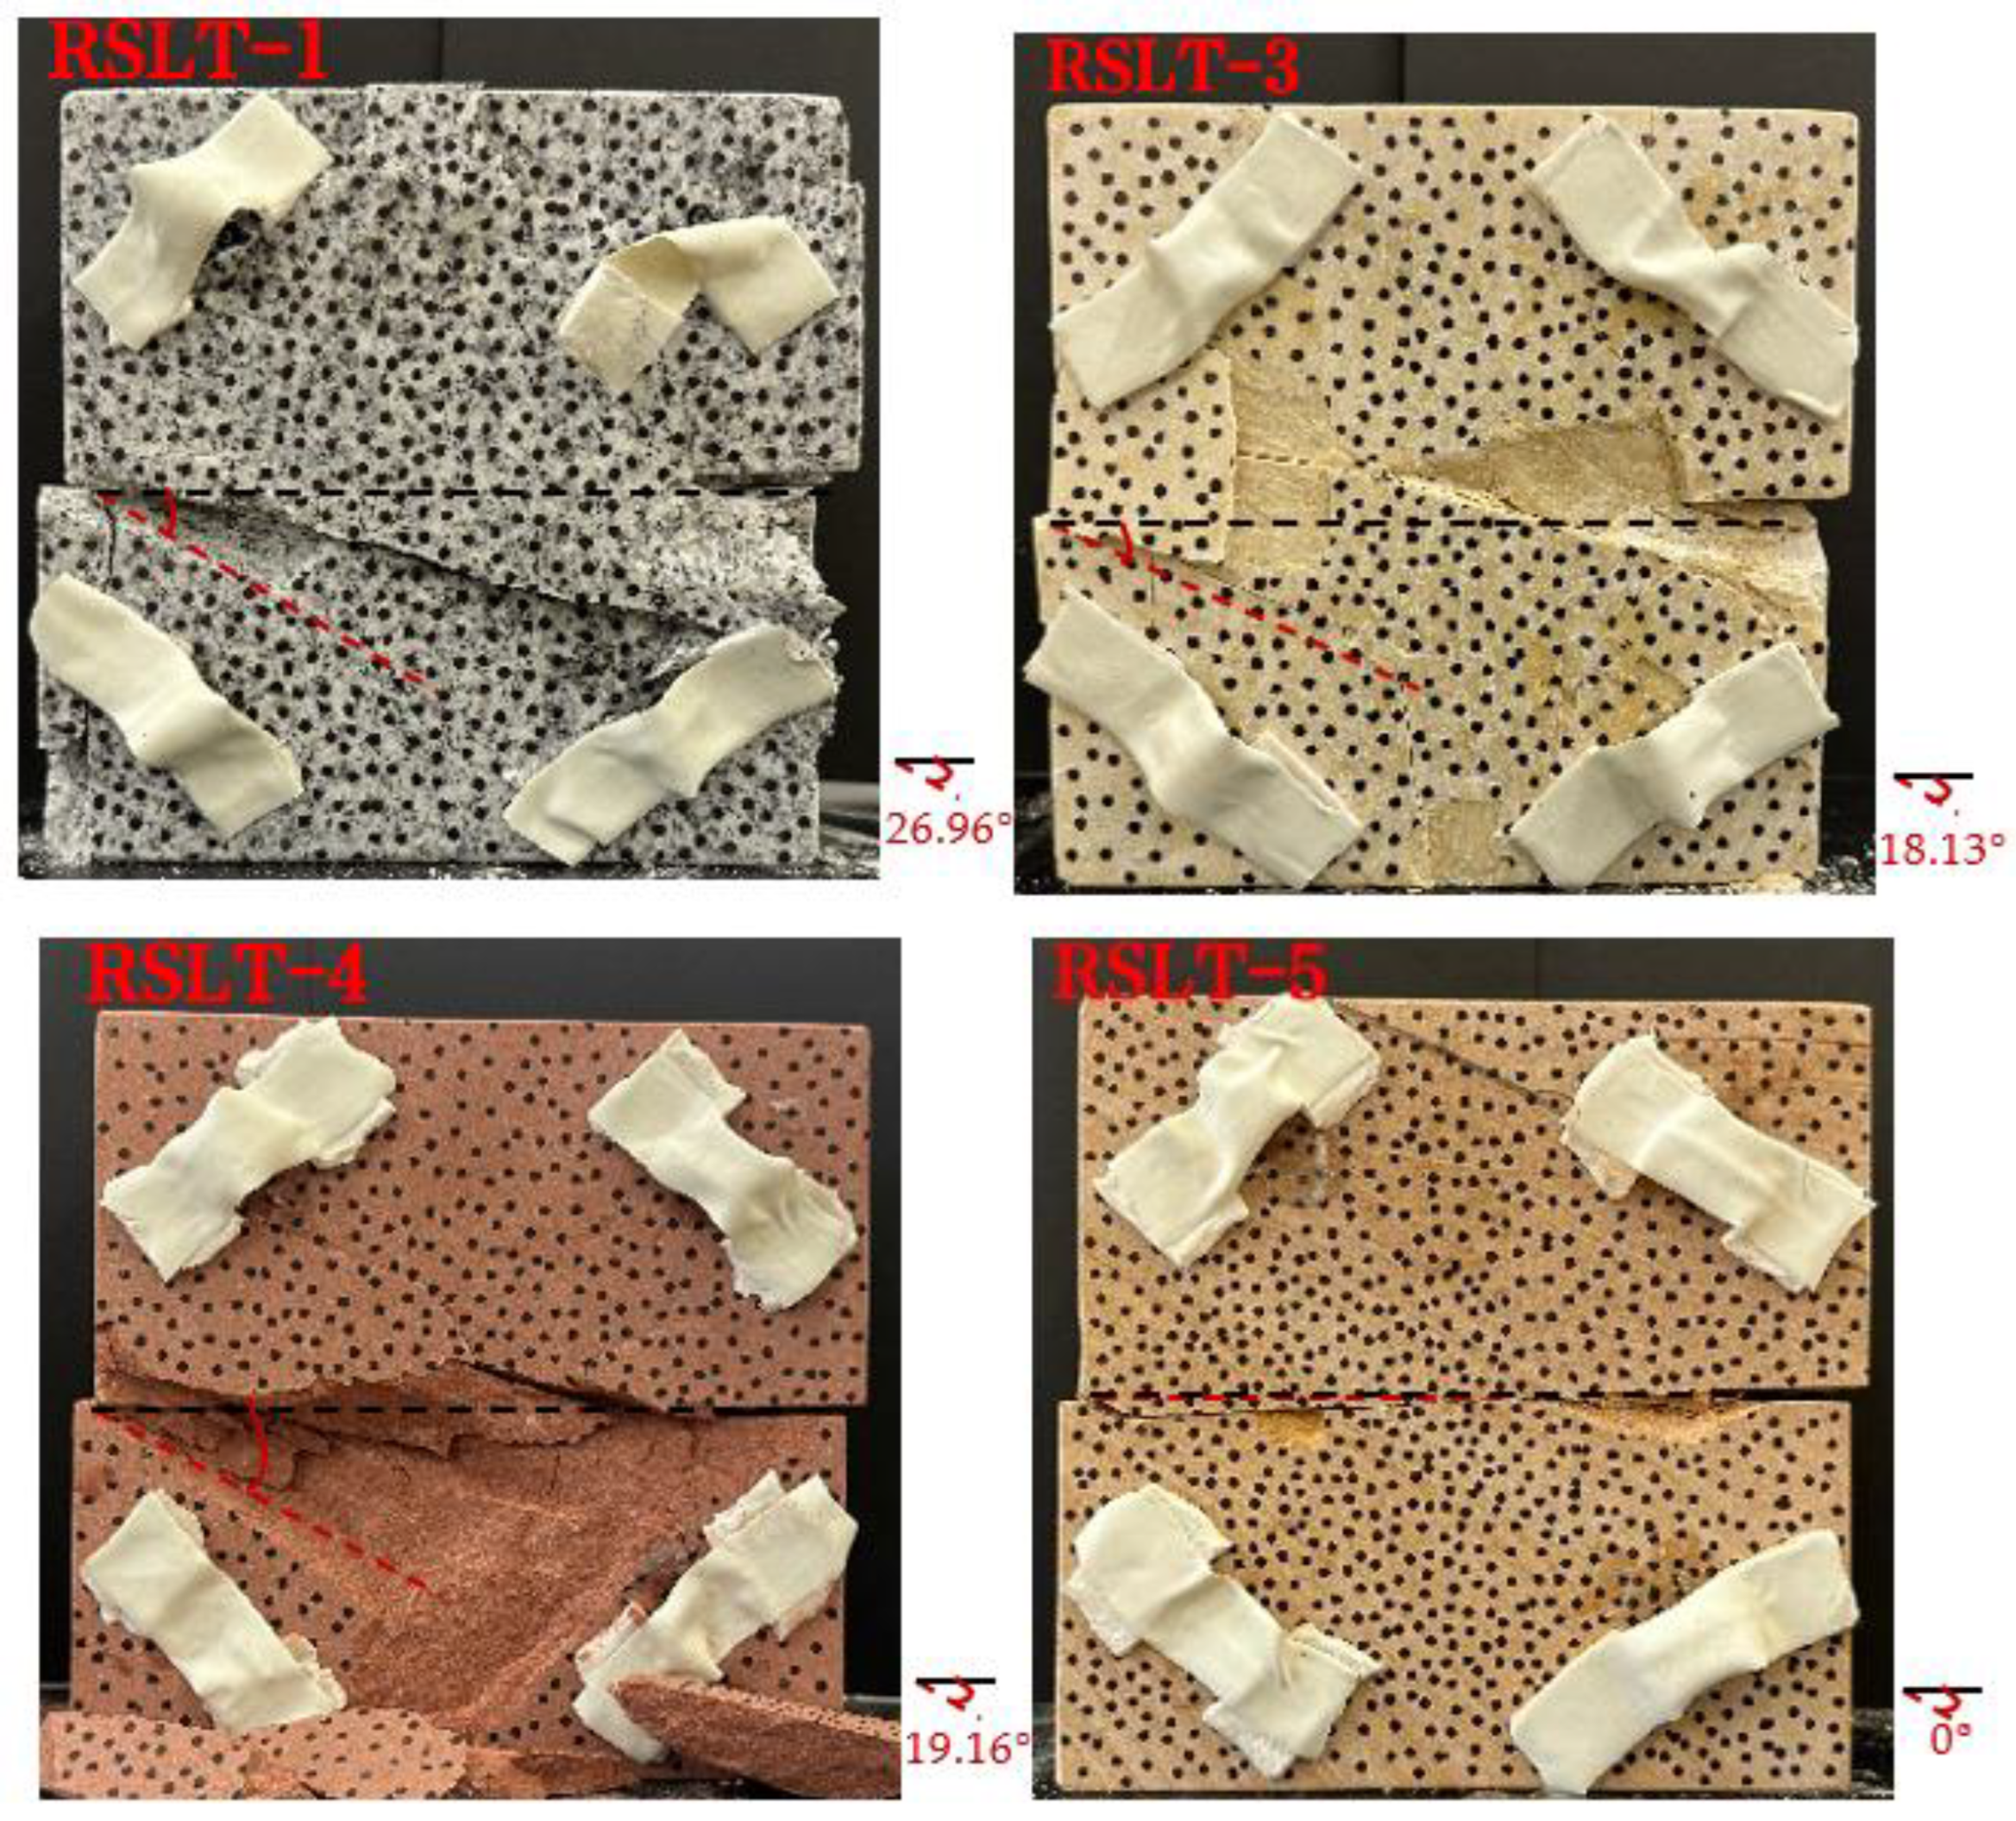
- Granite RSLT-1 specimen: The dominant crack in this specimen is not parallel to the prefabricated fracture. The dominant crack is at a dip of 26.96° to the shear direction. The secondary crack exhibits outward collapse with tensile fracture, leaving a small crater on the surface of the specimen. Due to the combined effects of axial and shear loads, a significant peeling surface is created, causing the front side to be almost entirely detached from the specimen.
- White sandstone RSLT-3 specimen: The shear crack surface of the specimen does not penetrate the prefabricated fracture, and the dominant crack is not parallel to it. The dominant crack is at a dip of 18.13° to the shear direction. The secondary crack is distributed in the middle of the specimen. Some flakes are peeled off, which extend upward from the crack initiated to the upper edge of the specimen. Compression-shear cracks are formed under the combined action of axial and shear loads.
- Red sandstone RSLT-4 specimen: The shear crack surface of the specimen penetrates from the prefabricated fracture and the dominant crack surface is not parallel to the prefabricated fracture. The dominant crack is at a dip of 19.16° to the shear direction. Under the development of a secondary crack, a large area of thin spalled slices appears on the surface of rock specimens, with most of the spalled flakes being wedge-shaped.
- Yellow sandstone RSLT-5 specimen: The shear crack surface of the specimen extends from the prefabricated fracture, and the primary crack surface is almost parallel to the shear direction. The dominant crack is at a dip of 0° to the shear direction. The rock specimen exhibits minimal fragmentation, developing only a shear fracture surface near the prefabricated fracture. Additionally, there are a few cracks along the intrinsic bedding plane of the specimen at this site, and only a few rock blocks have dislodged.
- Granite RSLT-1 specimen: The macro-scale crack does not penetrate from the prefabricated crack but expands obliquely downward at a certain dip. The continuous compression at the loading end near the prefabricated crack forms a fracturing area and a small number of rock fragments. Towards the end of the slow slip phase, a new crack is initiated by the peeling of thin sections on the rock surface due to the expansion of the rock specimen. As the rapid slip phase concludes, a dominant crack develops a branch obliquely to the upper left due to mutual friction, and a vertical tensile fracture emerges in the lower left corner of the specimen.
- White sandstone RSLT-3 specimens: The crack initiation position is closely related to the prefabricated crack. At the end of the slow slip phase, cracks that originate at the prefabricated crack develop horizontally to the left, and a large number of cracks are distributed in the shear crack zone. At the end of the rapid slip phase, a new shear crack parallel to the dominant crack is formed at the contact position on the left side of the specimen. A small amount of rock flakes peels off at the bottom of the specimen.
- Red sandstone RSLT-4 specimen: The rock specimen originates from the dominant crack, and several secondary cracks are formed. The secondary cracks extend and are arranged like a plume. At the end of the slow slip phase, the secondary crack expands, and a small area of rock flake spalling occurs. At the end of the rapid slip phase, the dominant and secondary cracks cause many fragments. The fragments of the shear zone in the middle of the specimen are wedge-shaped. The secondary cracks in the upper part of the specimen further extend.
- Yellow sandstone RSLT-5 specimens: The rock specimen is formed with horizontally dominant cracks. An unopened crack along the rock horizon is formed in the upper part of the shear plane. At the end of the slow slip phase, secondary cracks controlled by layered structures appear near the dominant crack, arranged in a plume. Small-area rock lamellar detachment occurs at the prefabricated opening. At the end of the rapid sliding phase, a small fragment falls from the secondary crack on the left. There is no obvious change in the crack morphology on the surface of the specimen.
2.3.3. The Features of Fracturing Evolution
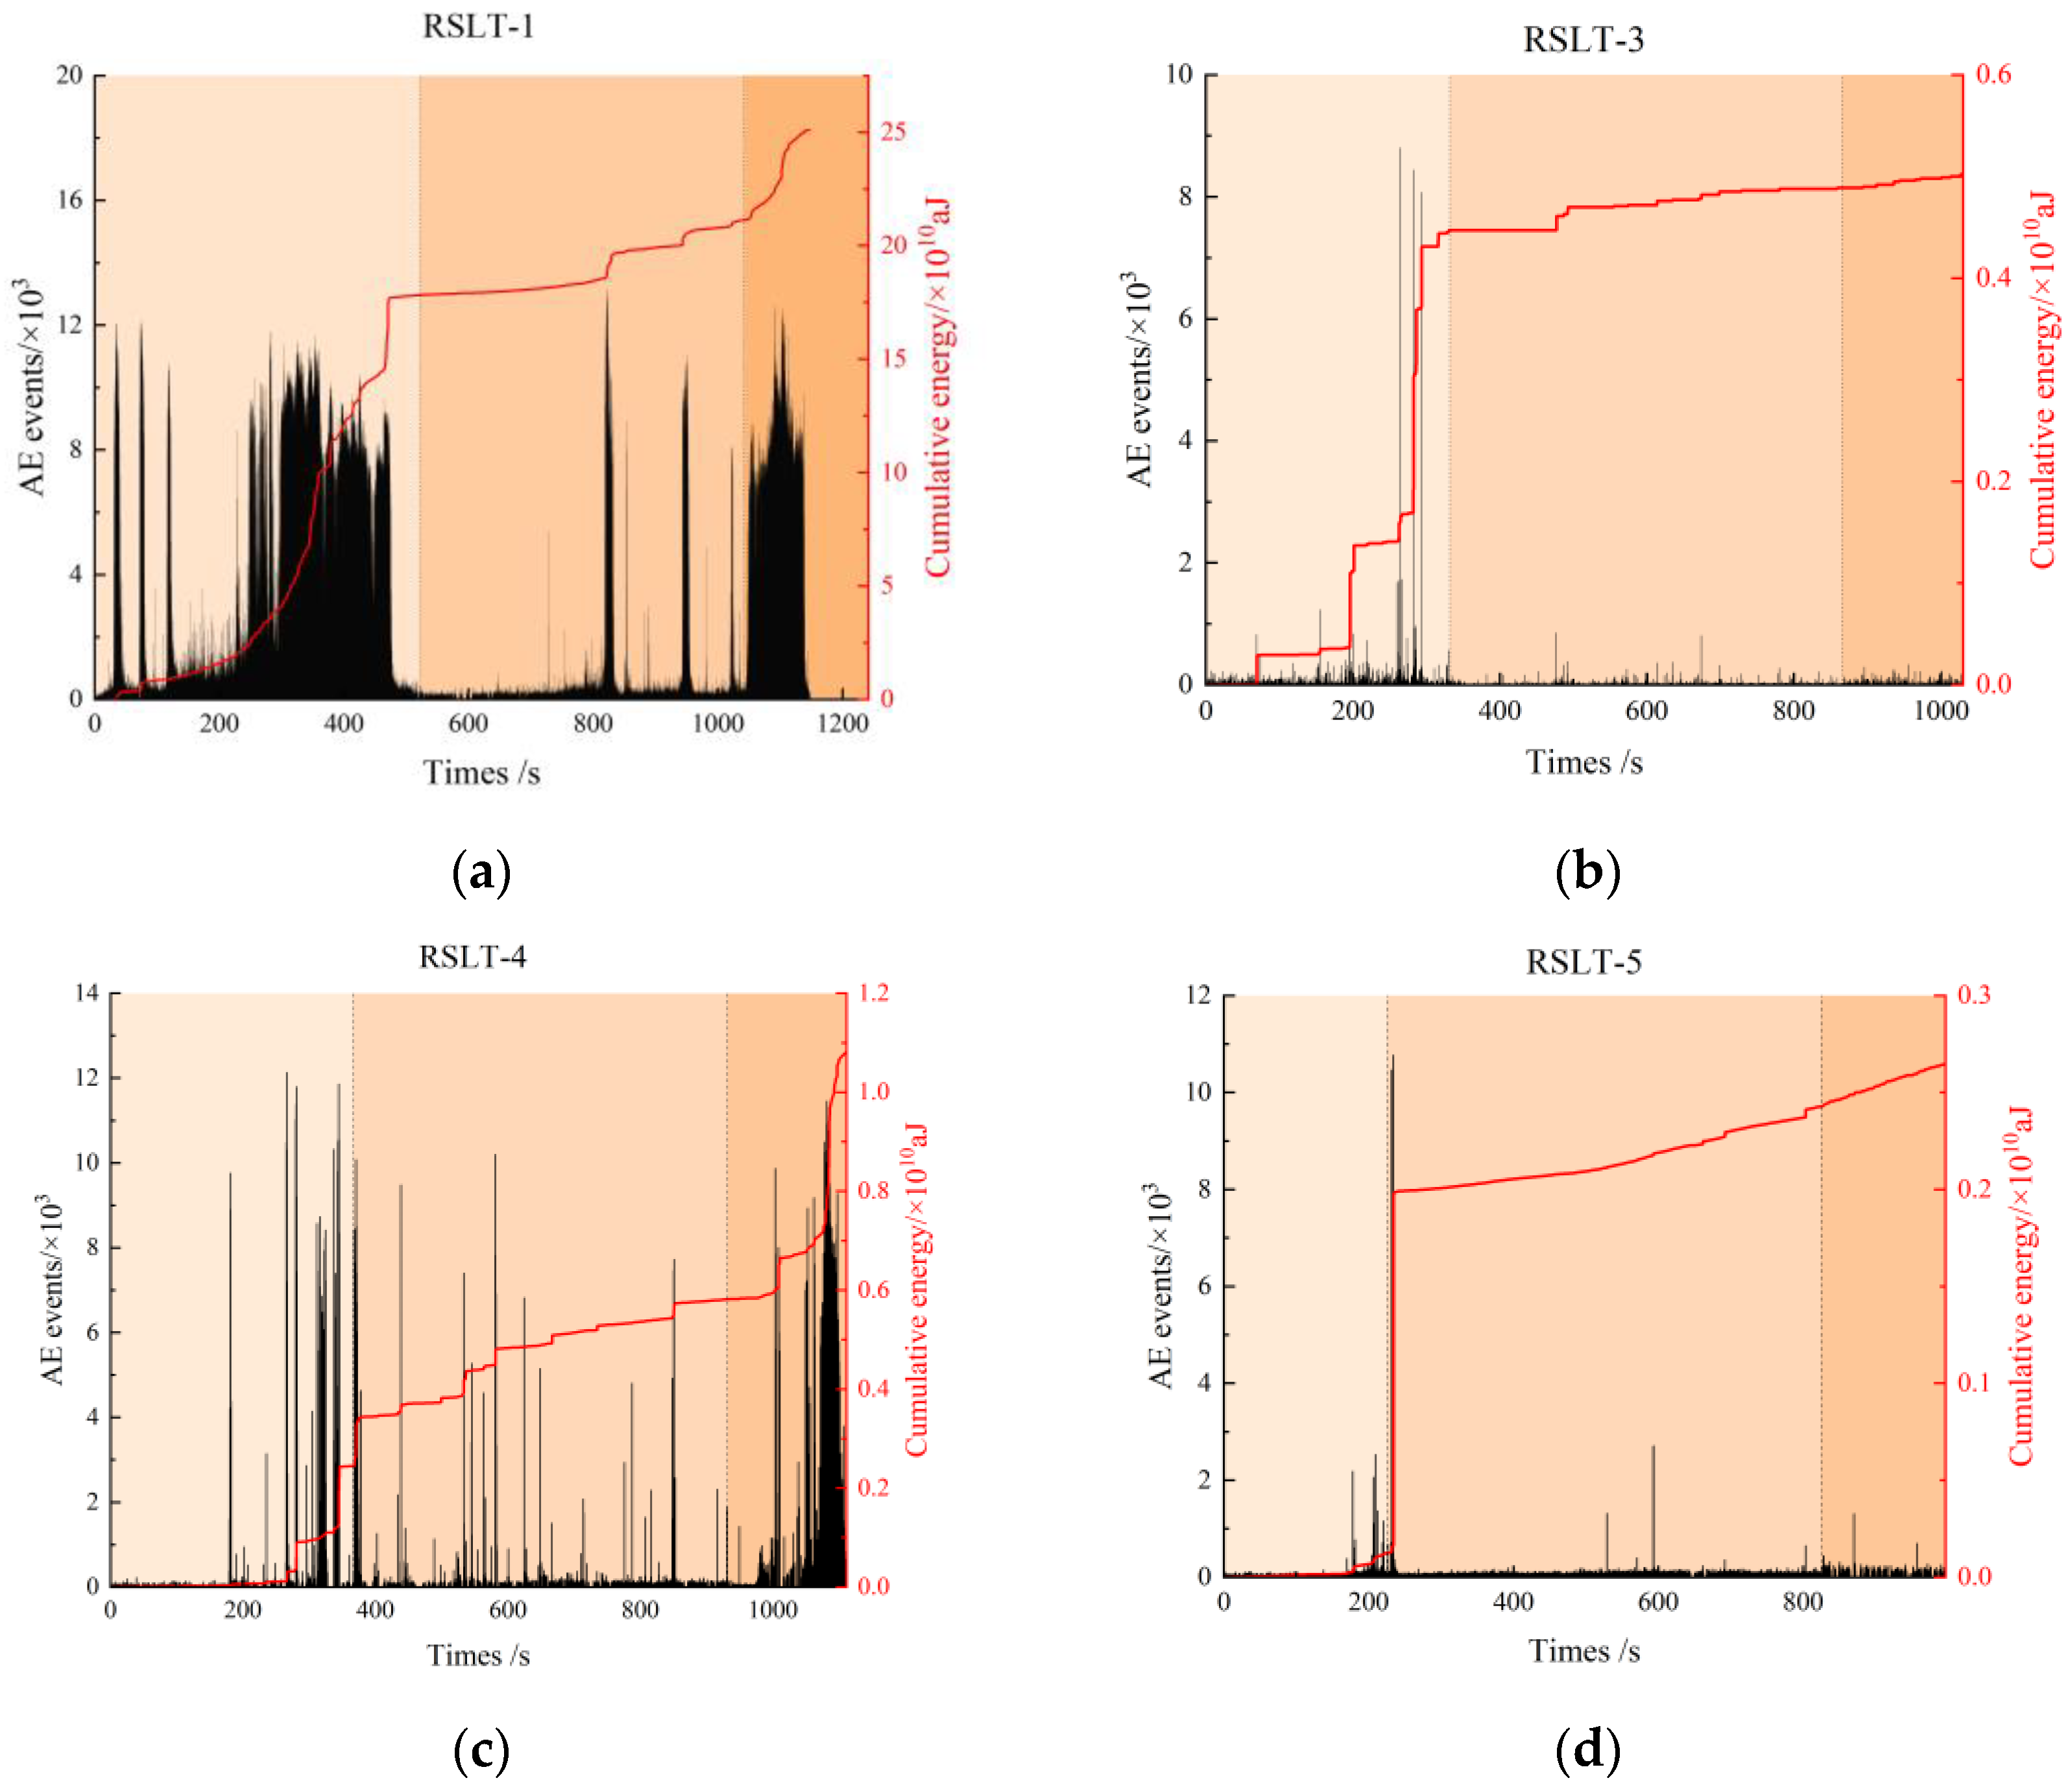
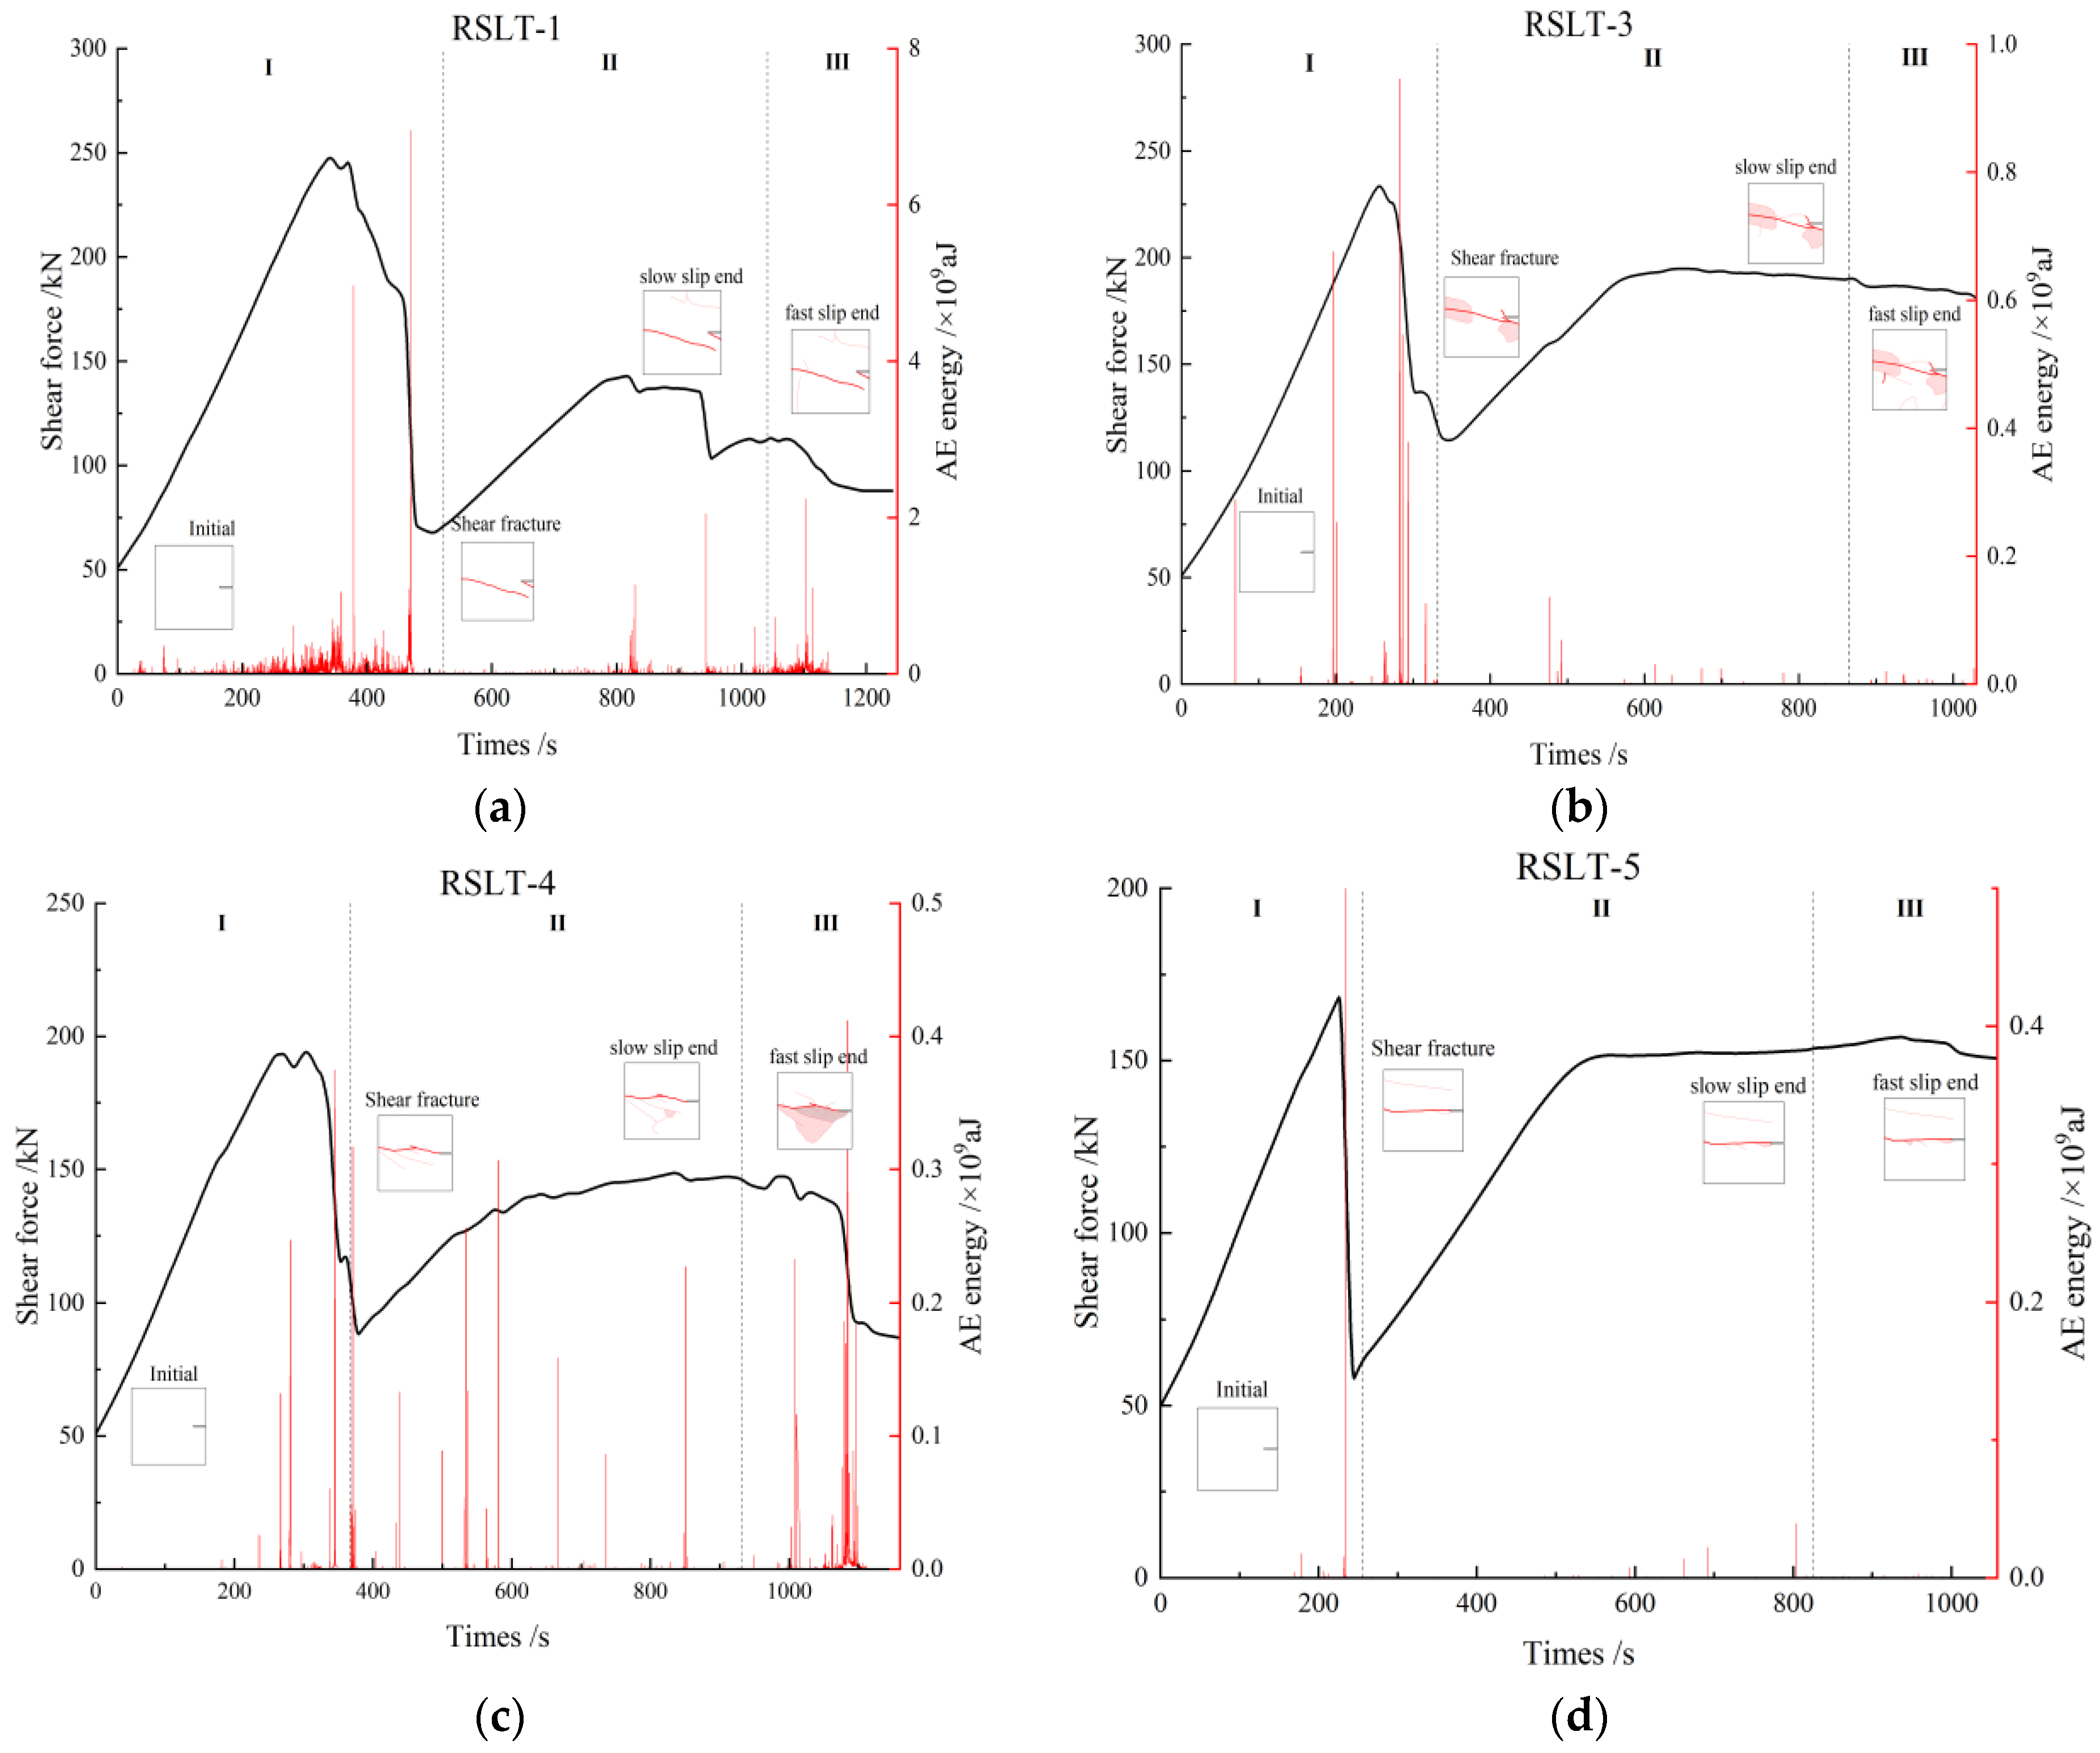
- Granite RSLT-1 specimen (Figure 7a): In the shear failure phase, the AE activity level is high, and the number of AE events gradually increases. Cumulative AE energy increases slowly in the early and middle phases, and then rapidly in the later phase, reaching 13,000 AE events and 1.75 × 10¹² aJ of cumulative AE energy. In the slow slip phase, AE events and cumulative AE energy remain at low levels, increasing in a stepwise manner in the later phase. In the rapid slip phase, AE activity increases significantly. As the system approaches final instability, AE activity peaks, with AE events reaching up to 18,000 and cumulative AE energy up to 2.5 × 10¹² aJ.
- White sandstone RSLT-3 specimen (Figure 7b): In the shear failure phase, cumulative AE energy increases in steps during the early and middle phases, while AE events fluctuate at a low level. In the later phase, AE events reach close to 9000, cumulative AE energy increases to 4.5 × 10⁹ aJ. In the slow slip phase, AE events remain at a low level, and accumulated AE energy increases slowly in a step-like manner. In the rapid slip phase, AE events fluctuate at a low level, and the increase in accumulated AE energy slows down further. As the system approaches final instability, cumulative AE energy reaches 5 × 10⁹ aJ.
- Red sandstone RSLT-4 specimen (Figure 7c): AE events remain high, and cumulative AE energy increases significantly. AE activity starts at a low level in the early stages of the shear failure phase. Then, AE events increase sharply to 12,000 in the middle and late phases, while cumulative AE energy increases up to 3.5 × 10⁹ aJ in a stepwise manner. During the slow slip phase, AE events decrease slightly, and the step-by-step growth of cumulative AE energy slows down. In the rapid slip phase, AE activity intensifies. As the system approaches final instability, AE events decrease from 12,000 to 4000, and cumulative AE energy reaches up to 1.08 × 10¹⁰ aJ.
- Yellow sandstone RSLT-5 specimen (Figure 7d): In the shear failure phase, AE activity varies greatly. AE events and cumulative AE energy are at a low level in the early and late phases. In the medium term, AE events increase by nearly 11,000, and cumulative AE energy reaches 2.0 × 10⁹ aJ. In the slow slip phase, AE events remain unchanged, while cumulative AE energy increases slowly. In the rapid slip phase, AE activity remains at a similar level as in the previous phase. AE events drop to 500, and cumulative AE energy increases to 2.6 × 10⁹ aJ in the final instability.
3. The Features of Acoustic Emission (AE) and Energy Dissipation
3.1. The Difference of AE Characteristics in Different Loading Phases
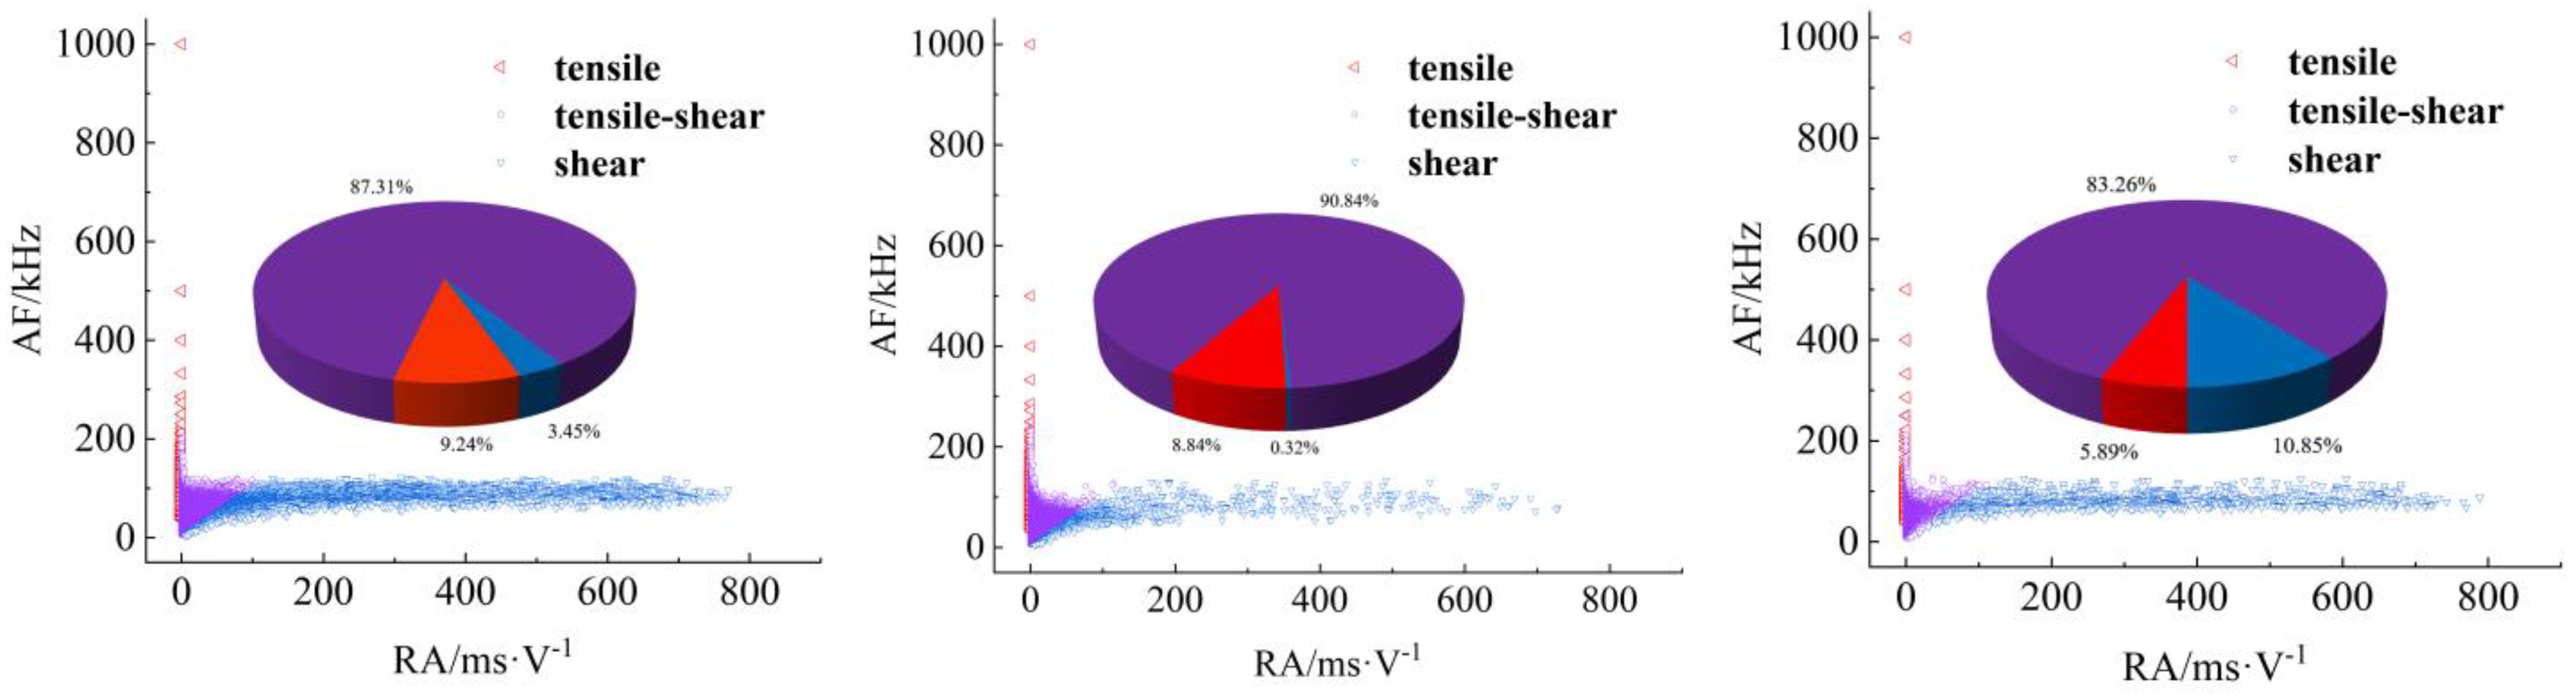
- Granite RSLT-1 specimen (Figure 8): The mainly tensile and shear composite types, accounting for more than 80% of the whole test. Tensile type shows a decreasing trend, and the variation range is “9.24% > 8.84% > 5.89%”. The variation of the three types is “3.45% > 0.32% > 10.85%”, and the shear type in the rapid slip phase increased significantly.
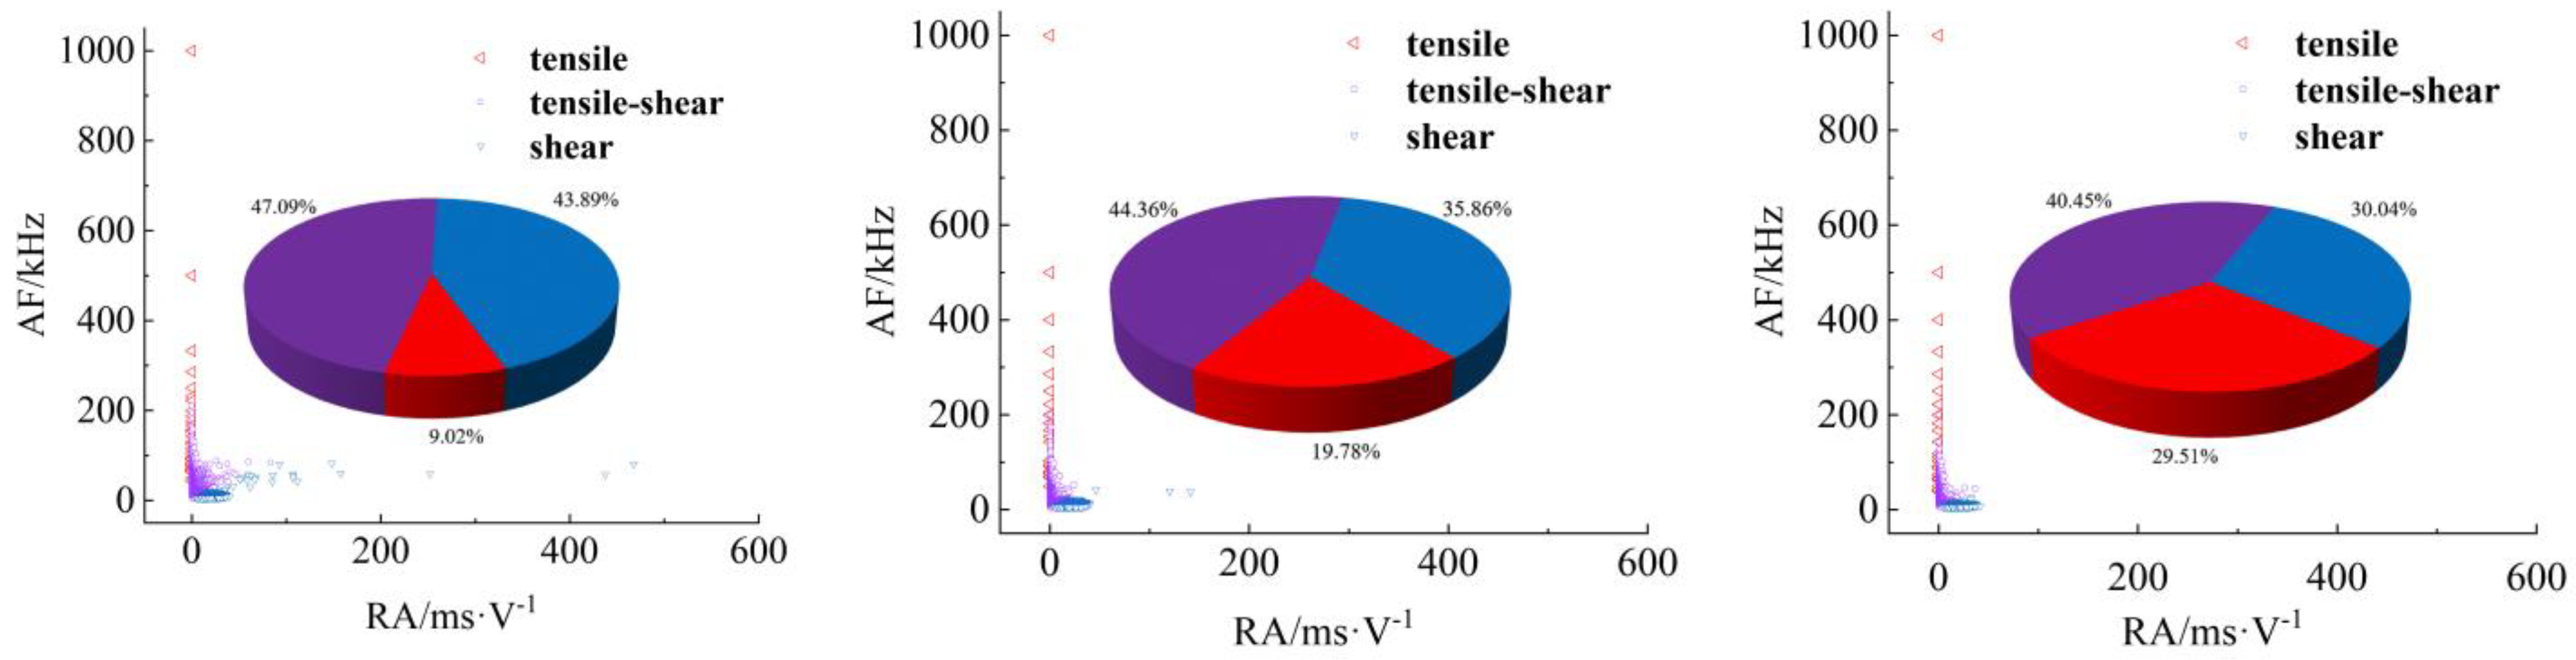
- White sandstone RSLT-3 specimens (Figure 9): The proportion of tension-shear composite type is “47.09% > 44.36% > 40.45%”, showing a slight decreasing trend. Tensile type accounts for “9.02% > 19.78% > 29.51%”, increasing by 10%. Shear type decreases from “43.89% > 35.86% > 30.04%”, which showed a decreasing trend.
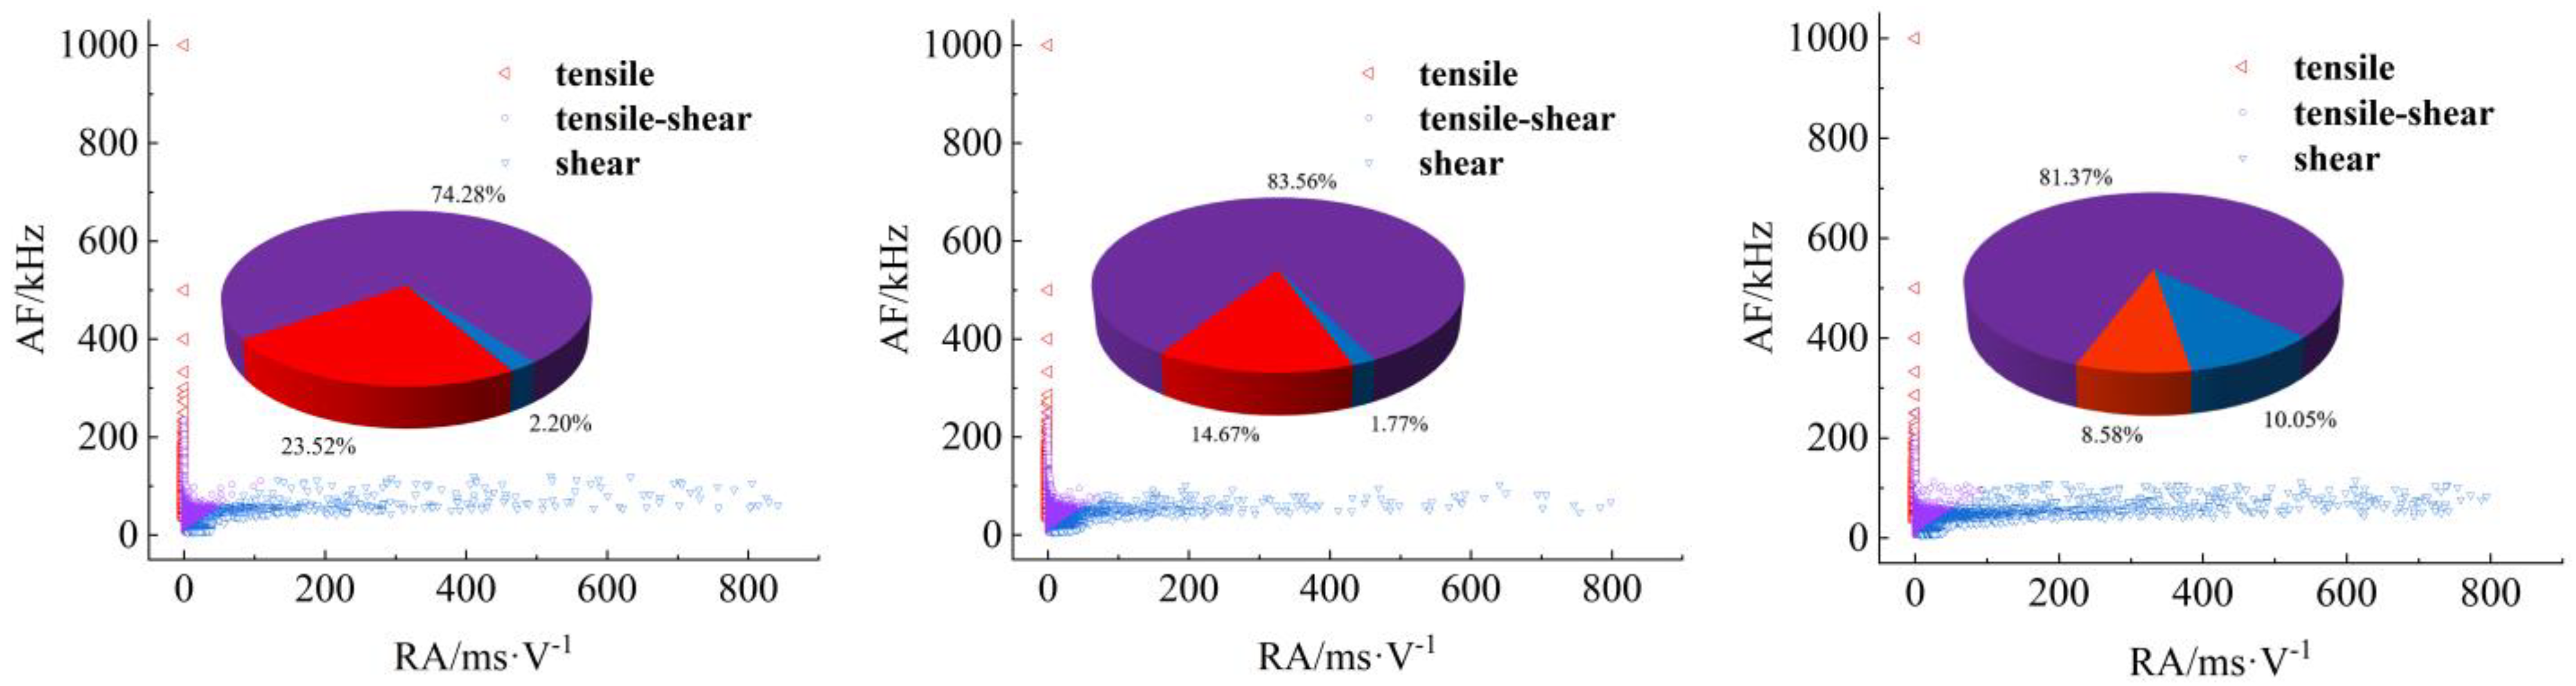
- Red sandstone RSLT-4 specimens (Figure 10): The mainly tensile and shear composite types, account for “74.28% > 83.56% > 81.37%”. Tensile type accounts for “23.53% > 14.67% > 8.58%”, showing a decreasing trend. The proportion of shear fractures is “2.20% > 1.77% > 10.05%”, and the slow slip phase increased significantly.
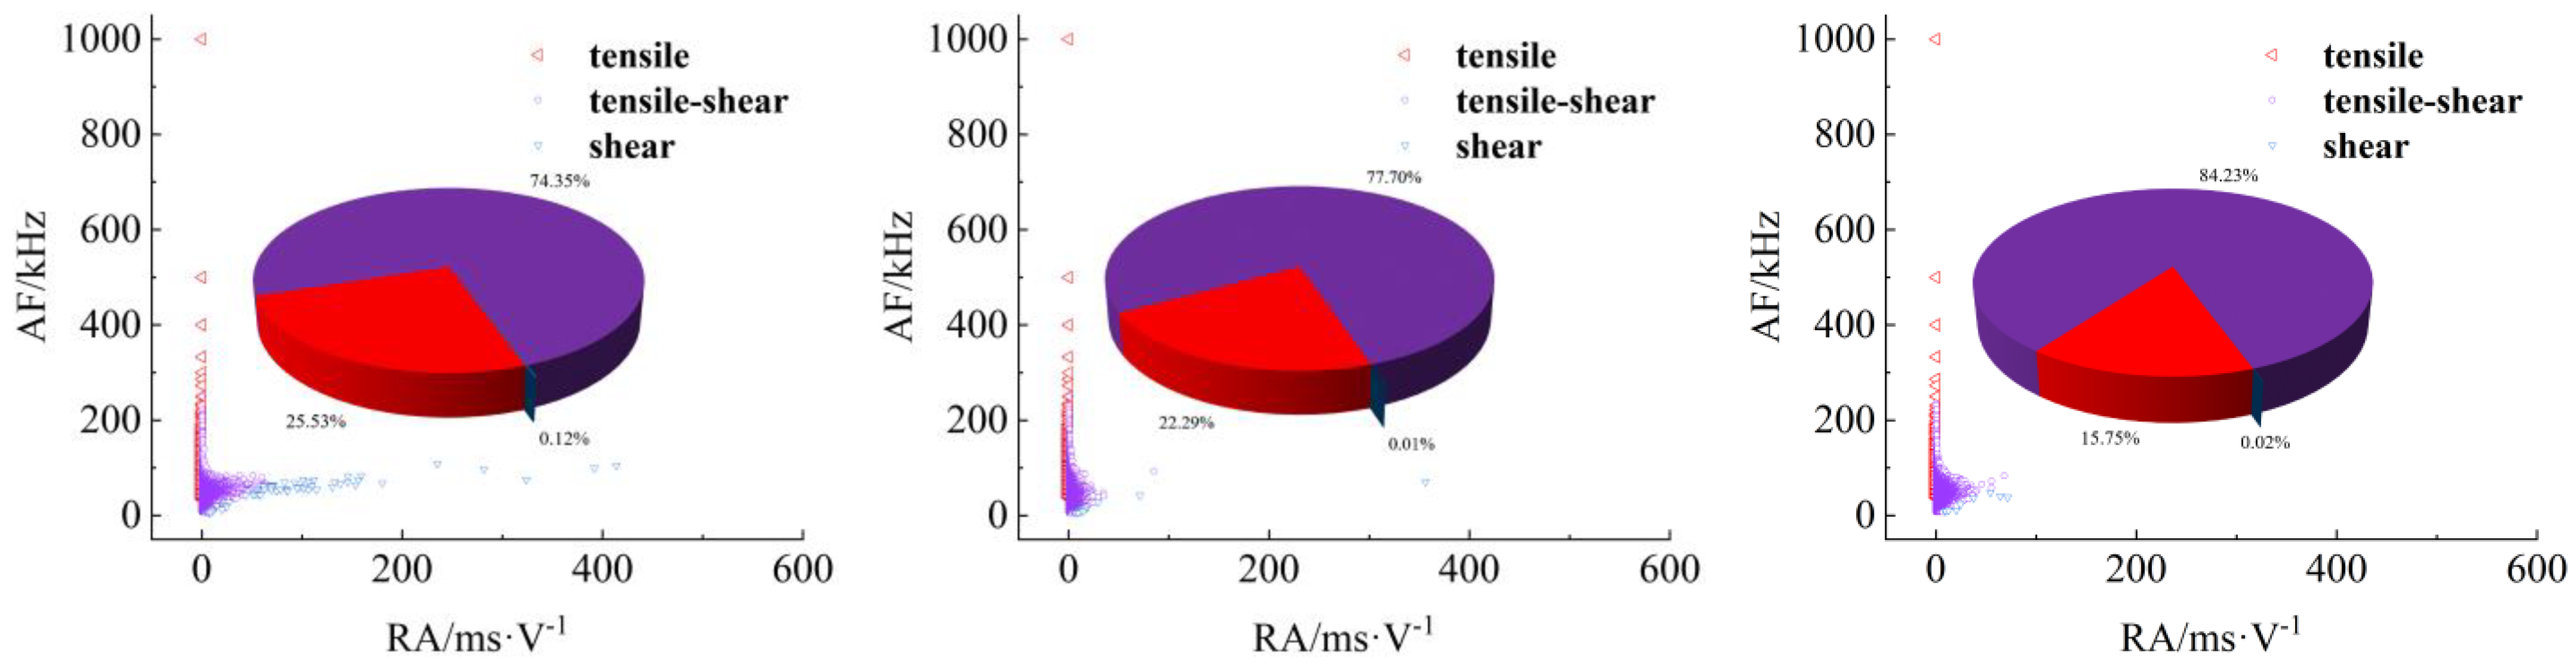
- Yellow sandstone RSLT-5 specimen (Figure 11): the main failure mode is tension-shear composite, and its proportion increases slightly with the loading process, 74.36% > 77.70% > 84.23%. Tensile type decreases slightly in the first two phases, but decreases significantly in the rapid slip phases, accounting for “25.53% > 22.29% > 15.75%”. The proportion of shear type is very small, accounting for “0.12% > 0.01% > 0.01%”.
3.2. Correlation between Fracture Type and Acoustic Emission Energy
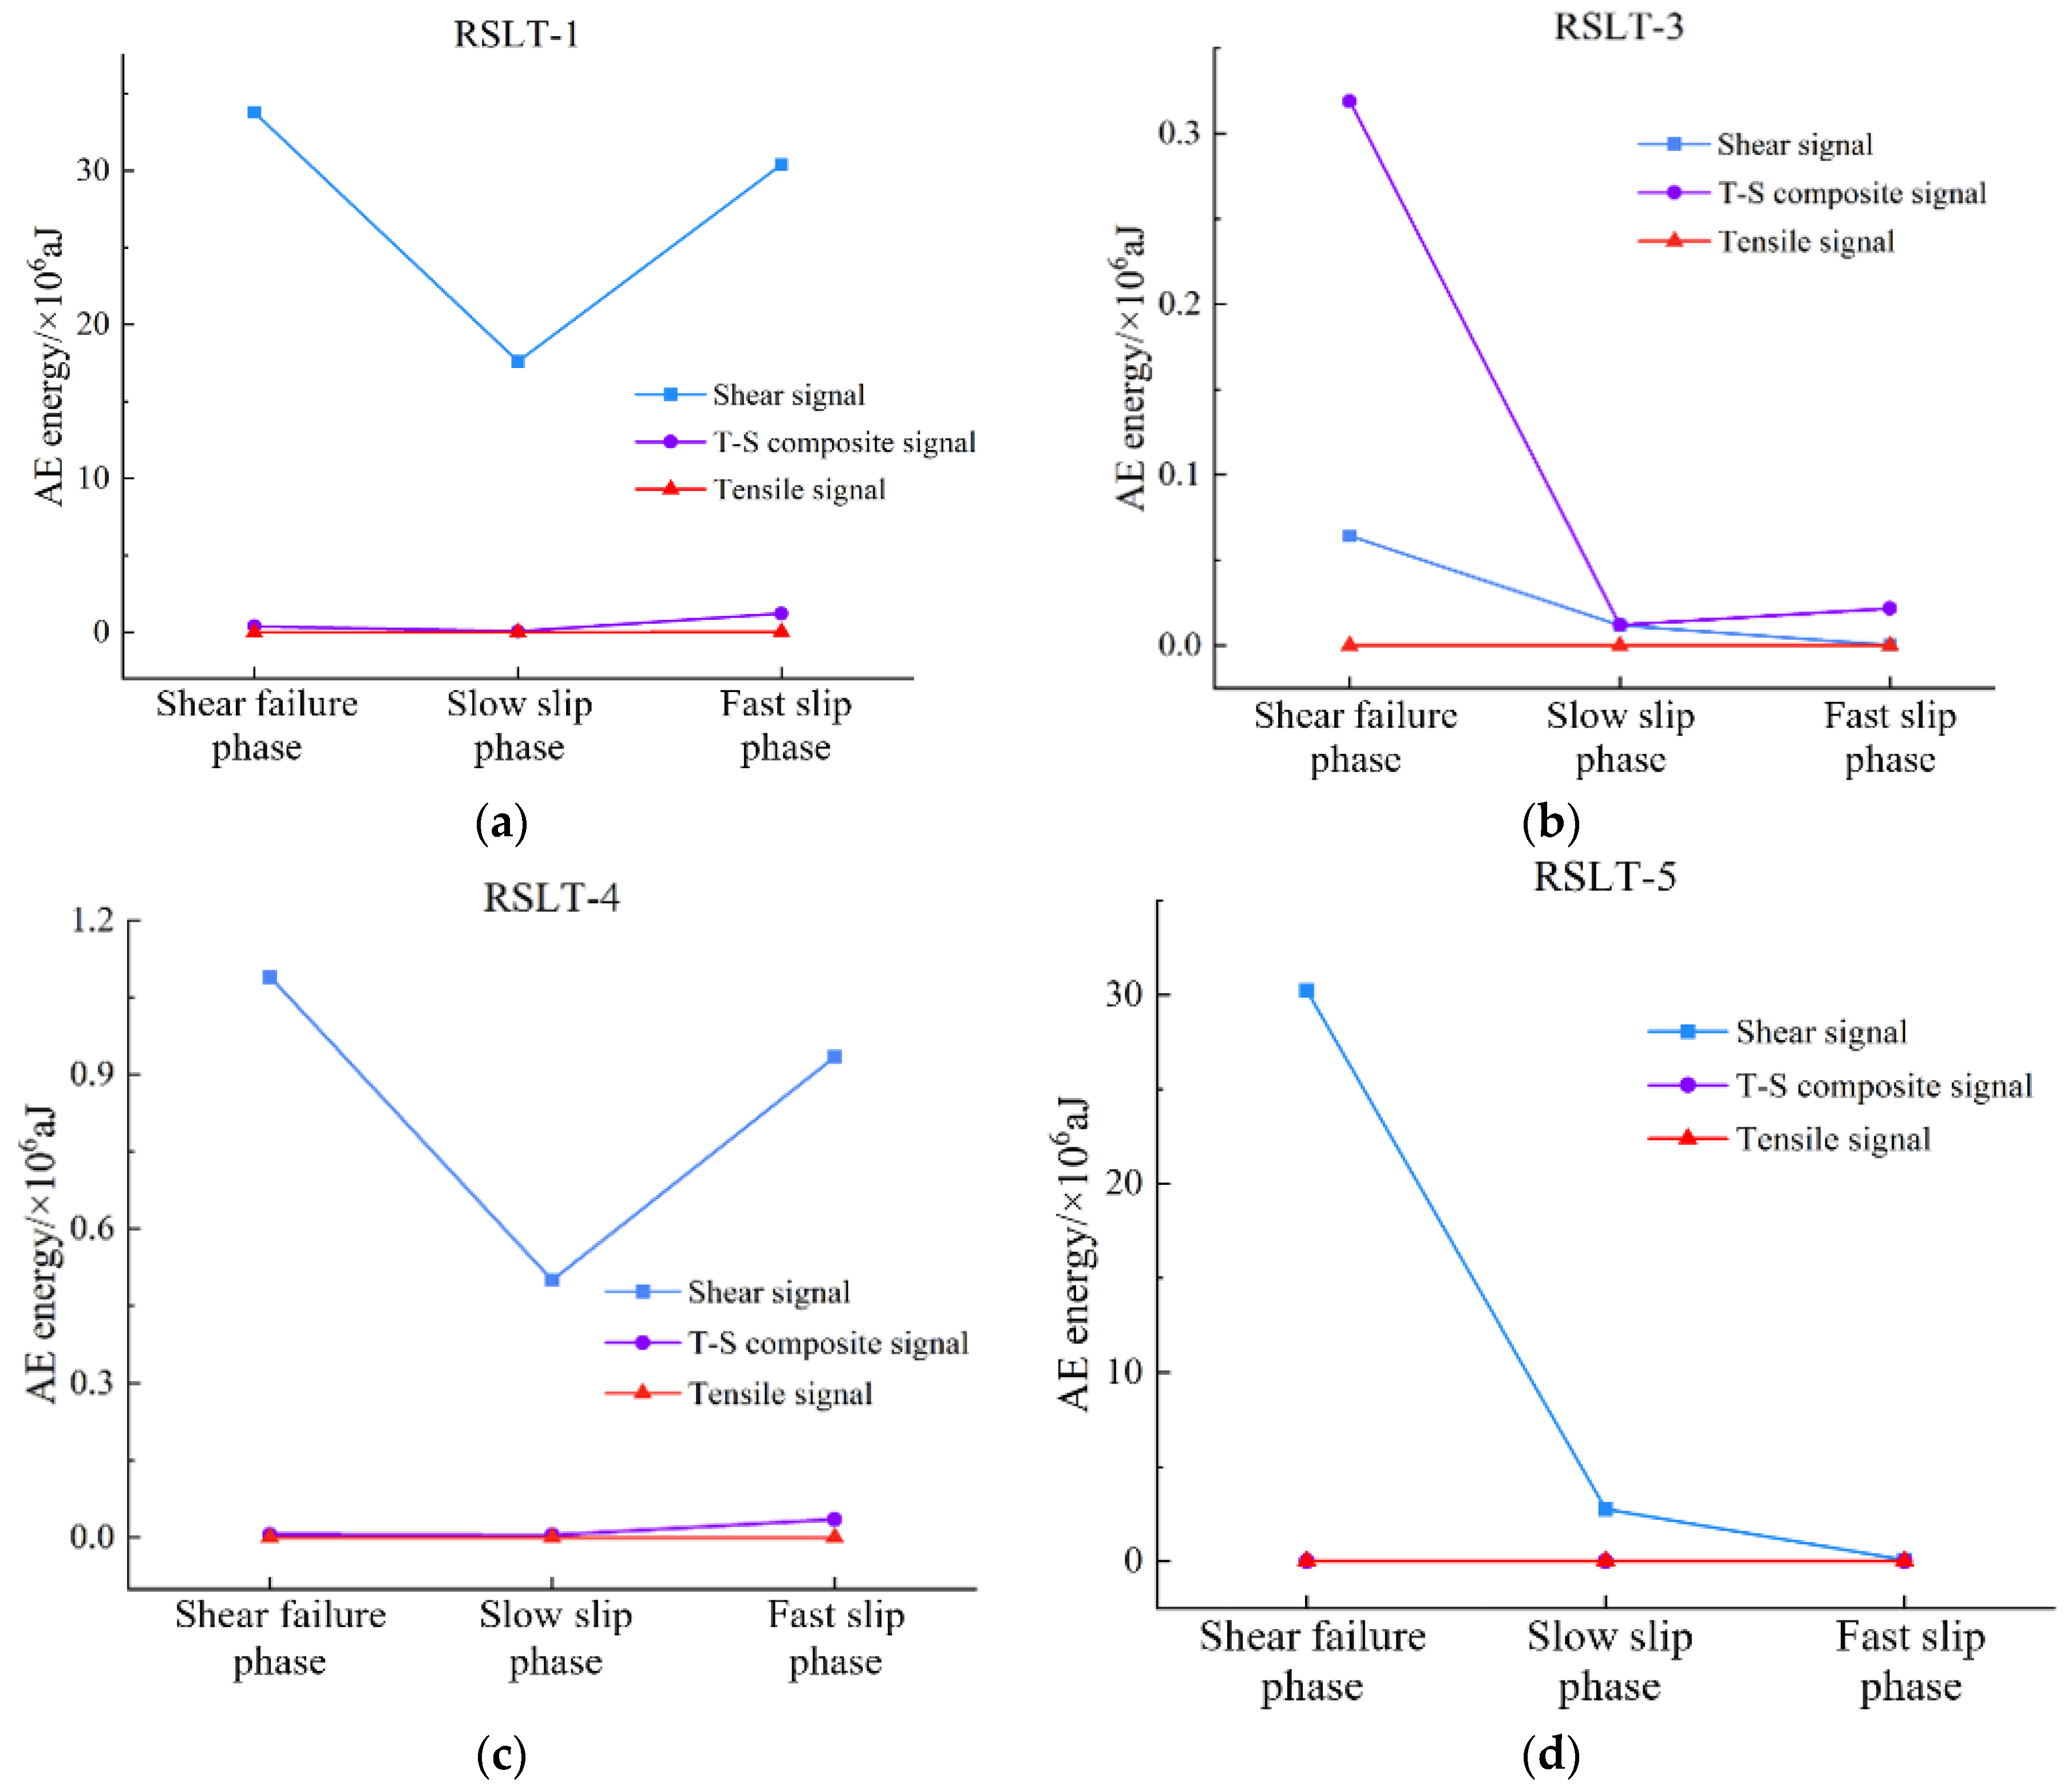
- AE energy of shear type: From shear failure to slow slip phases, RSLT-1 decreases from 3.38 × 10⁷ aJ to 1.76 × 10⁷ aJ, and RSLT-4 is from 1.09 × 10⁶ aJ to 5.0 × 10⁵ aJ. In the fast slip phase, RSLT-1 rises to 3.04 × 10⁷ aJ, and RLST-4 increases to 9.34 × 10⁵ aJ, which is significantly higher than the others. RSLT-3 and RSLT-5 decrease, RSLT-3 decreases from 6.34 × 10⁴ aJ to 1.17 × 10⁴ aJ, then to 3.5 × 10² aJ. RSLT-5 decreases from 3.02 × 10⁷ aJ to 2.76 × 10⁶ aJ, then falls to 7.14 × 10⁴ aJ.
- AE energy of tensile type: Tensile signal energy of different rock specimens varies significantly. RLST-1 measures at 103 aJ in shear failure and slow slip phases and increases to 104 aJ in the fast slip phase. RSLT-3 measures less than 10 aJ in all three phases. RSLT-4 is approximately 102 aJ in the shear failure phase and ranges from 102 aJ to 3 × 10² aJ in slow slip and fast slip phases. RSLT-5 shows minimal change, with the entire shear-slip process totaling about 150 aJ.
- AE energy of tensile-shear (TS) composite type: The AE energy levels of tensile-shear composite type for RSLT-1 and RSLT-4 are 4.0 × 10⁴ aJ and 6.18 × 10³ aJ in the shear failure phase. These values increase significantly to 1.22 × 10⁶ aJ and 3.57 × 10⁴ aJ in the fast slip phase. RSLT-3 and RSLT-5 maintained levels of 105 aJ and 103 aJ, respectively, with no significant changes.
4. Discussion
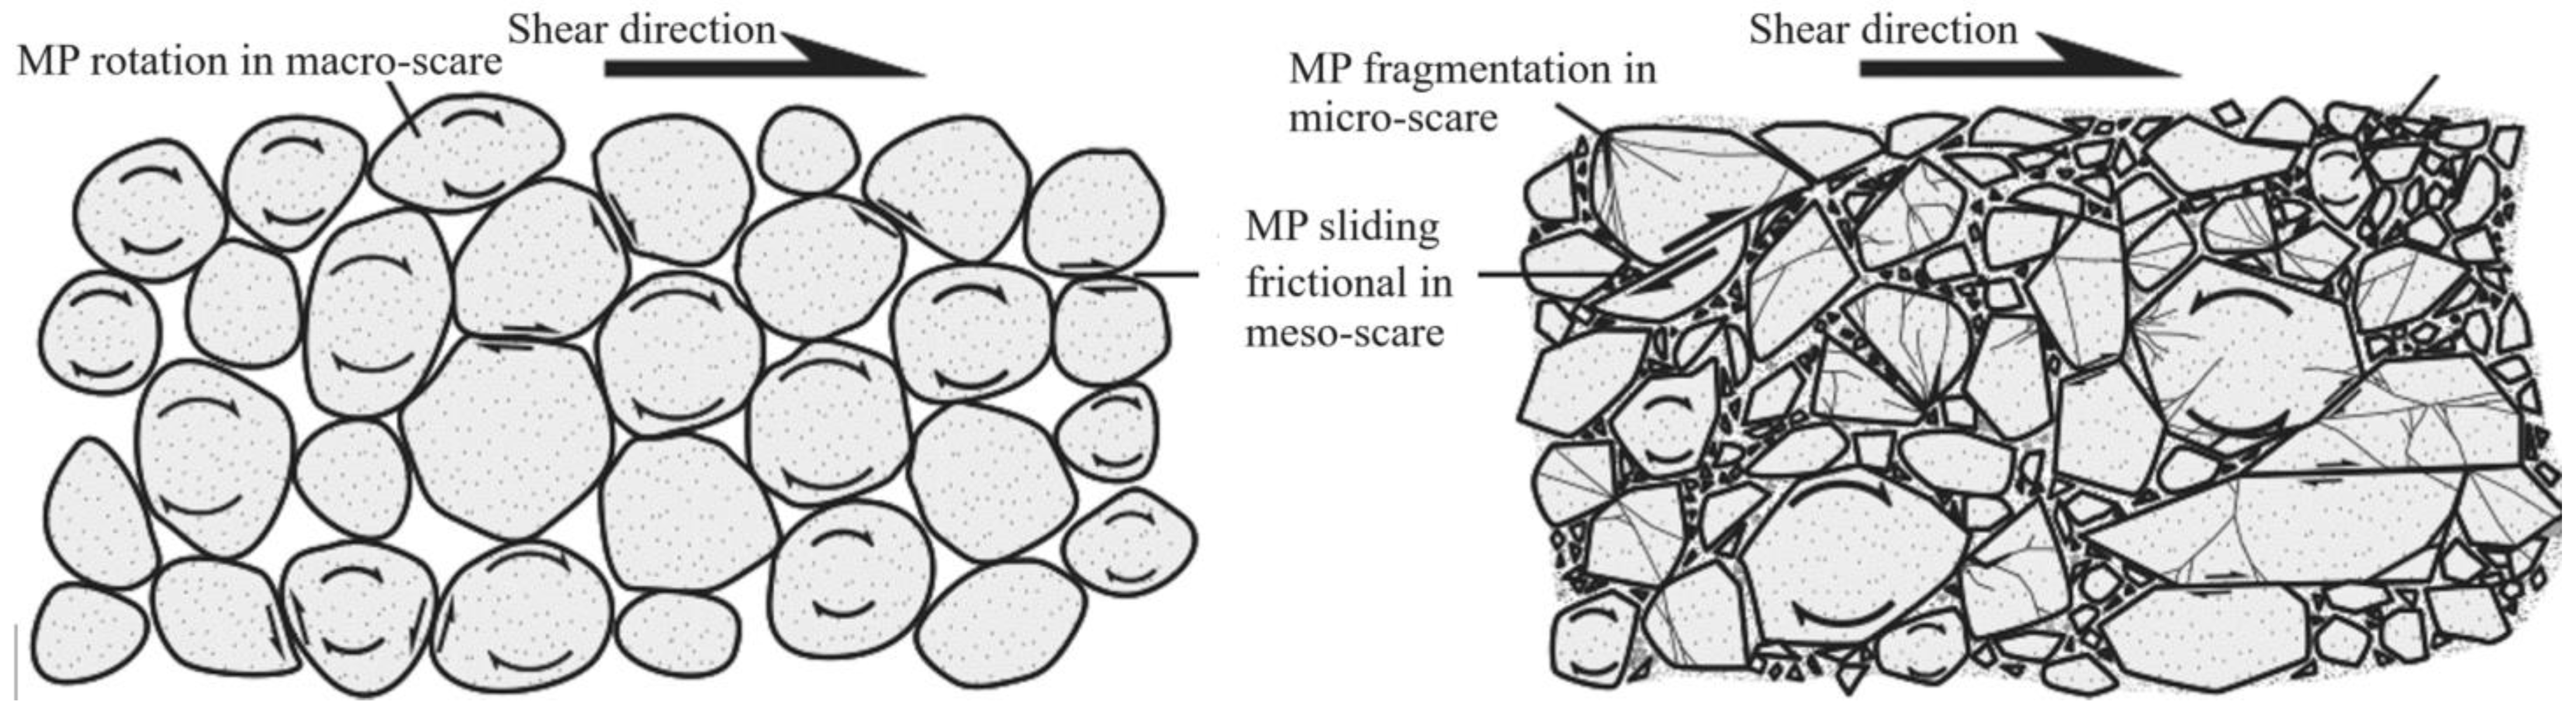
- Granite specimens: The minerals include anorthosite, potash feldspar, quartz, amphibole, and mica. The particle size of anorthosite and potassium feldspar varied the most (Table 1). Shear and tensile AE signals are not effectively distinguished, and the tension-shear (TS) composite AE signal accounted for the largest proportion (Figure 11). Fracturing events at macro-meso-micro scales occurred simultaneously (Figure 14).
- White sandstone specimens: The minerals include quartz, kaolin, gothite, mica, and feldspar (Table 1). Quartz has the largest particle size and the highest proportion. Goethite has the smallest particle size and the highest hardness. TS composite, shear, and tensile types AE signals are relatively developed in the shear failure phase. The sliding friction between minerals increases as the slip rate increases (Figure 14). The proportion of shear-type AE signals gradually increases (Figure 9).
- Red sandstone specimens: The mineral composition includes quartz, feldspar, kaliglimmer, montmorillonite, and hematite (Table 1). The size of each mineral particle ranges from 0.005 mm to 0.5 mm. The shear AE signal increases due to the micro-scale sliding friction of strong and tough minerals (Figure 14). The fragmentation of micro-scale mineral particles leads to an increase in the proportion of tensile-type AE signals (Figure 10).
- Yellow sandstone specimens: The minerals include quartz, mica, kalijarosite, illite, and feldspar (Table 1). The size of mineral particles is distributed between 0.0002 mm and 0.2 mm. The rotation of macro-scale mineral particles and the sliding friction between meso-scale mineral particles account for the highest proportion (Figure 14). The proportion of tension-shear composite AE signals is the highest (Figure 11).
5. Conclusions
- There is a strong correlation between fracture type, energy dissipation, and AE features. The more complex the fracture type, the stronger the energy dissipation, and the more intense the AE activity. The largest proportion of energy dissipation in granite specimens is the TS composite type. In other rock specimens, the fracture type is shear in shear failure, TS composite in the slow slip phase, and tensile in the fast slip phase.
- In the whole process of rock shear-slip, the ratio of energy index of TS composite, shear, and tensile types is 10:100:1. Different rock specimens have varying features of hardness and brittleness, which also results in different AE activity during fracturing.
- The energy dissipation of rock fracturing is discussed in terms of mineral composition, particle size, and diagenetic mode. The high energy dissipation of granite specimens is primarily dominated by the shear type, while the significant energy dissipation of the other three specimens is dominated by the TS composite type.
Author Contributions
Funding
Data Availability Statement
Acknowledgments
Conflicts of Interest
References
- Zhang, C.X.; Li, D.Y.; Yang, B. Advances in theory and experimental testing techniques of mode II fracture for rock materials. Eng. Mech. 2023, 40, 1–19. [Google Scholar] [CrossRef]
- Lu, T.; Huang, M.; Hong, C.; Du, S.; Liu, Y. Experimental study on visualization test method of whole process shearing of model rock joints. Yanshilixue Yu Gongcheng Xuebao/Chin. J. Rock Mech. Eng. 2022, 41, 3369–3379. [Google Scholar] [CrossRef]
- Liu, X.; Wu, L.; Zhang, Y.; Wang, S.; Yao, X.; Wu, X. The characteristics of crack existence and development during rock shear fracturing evolution. Bull. Eng. Geol. Environ. 2021, 80, 1671–1682. [Google Scholar] [CrossRef]
- Li, X.-Z.; Shao, Z.-S.; Qi, C.-Z. Study on rock crack damage and confining pressure effects on shear fracture band. Yantu Lixue/Rock Soil Mech. 2019, 40, 4249–4258. [Google Scholar] [CrossRef]
- Liu, C.; Jiang, Q.; Xin, J.; Wu, S.; Liu, J.; Gong, F. Shearing Damage Evolution of Natural Rock Joints with Different Wall Strengths. Rock Mech. Rock Eng. 2022, 55, 1599–1617. [Google Scholar] [CrossRef]
- Wang, F.; Zheng, H.; Wang, S. Shear Behaviors and Slip Characteristics of Rock fractures under Different Shear Histories. Met. Mine 2024, 2024, 1–12. Available online: https://link.cnki.net/urlid/34.1055.TD.20240408.0959.002 (accessed on 26 December 2023).
- Guo, W.; Zhang, C.; Wang, C.; Wang, M. Macroscopic and microscopic analysis of particle flow in direct shear mechanical characteristics of rock structural surface. Chin. J. Comput. Mech. 2023, 40, 237–248. [Google Scholar] [CrossRef]
- Zhai, M.; Xue, L.; Chen, H.; Xu, C.; Cui, Y. Effects of shear rates on the damaging behaviors of layered rocks subjected to direct shear: Insights from acoustic emission characteristics. Eng. Fract. Mech. 2021, 258, 108046. [Google Scholar] [CrossRef]
- Zhao, C.; Liu, J.; Lyu, C.; Xu, H.; Lin, H. Study on the shear-slip process and characteristics of fracture in shale. Eng. Geol. 2023, 319, 107097. [Google Scholar] [CrossRef]
- Xin, J.; Jiang, Q.; Li, S.; Chen, P.; Zhao, H. Fracturing and Energy Evolution of Rock Around Prefabricated Rectangular and Circular Tunnels Under Shearing Load: A Comparative Analysis. Rock Mech. Rock Eng. 2023, 56, 9057–9084. [Google Scholar] [CrossRef]
- Lockner, D. The role of acoustic emission in the study of rock fracture. Int. J. Rock Mech. Min. Sci. Geomech. Abstr. 1993, 30, 883–899. [Google Scholar] [CrossRef]
- Hardy, H.R. Applications of acoustic emission techniques to rock and rock structures: A state-of-the-art review. In Acoustic Emissions in Geotechnical Engineering Practice; ASTM International: West Conshohocken, PA, USA, 1981. [Google Scholar]
- Du, K.; Li, X.; Tao, M.; Wang, S. Experimental study on acoustic emission (AE) characteristics and crack classification during rock fracture in several basic lab tests. Int. J. Rock Mech. Min. Sci. 2020, 133, 104411. [Google Scholar] [CrossRef]
- Wang, G.; Song, L.-B.; Liu, X.-Q.; Bao, C.-Y.; Lin, M.-Q.; Liu, G.-J. Shear fracture mechanical properties and acoustic emission characteristics of discontinuous jointed granite. Yantu Lixue/Rock Soil Mech. 2022, 43, 1533–1545. [Google Scholar] [CrossRef]
- Wang, J.; Liang, P.; Zhang, Y.; Yao, X.; Yu, G.; Guo, B. Research on classification of rock tensile-shear fracture based on acoustic emission RA-AF values and kneedle algorithm. Yanshilixue Yu Gongcheng Xuebao/Chin. J. Rock Mech. Eng. 2024, 43, 3267–3279. [Google Scholar] [CrossRef]
- Zhang, Z.-H.; Deng, J.-H. A new method for determining the crack classification criterion in acoustic emission parameter analysis. Int. J. Rock Mech. Min. Sci. 2020, 130, 104323. [Google Scholar] [CrossRef]
- Gong, C.; Bao, H.; Wang, W.; Zhong, W.; Xu, Y.; Zhao, K.; Zeng, P. Evolution law and dominant frequency characteristics of acoustic emission sources during red sandstone failure process. Meitan Xuebao/J. China Coal Soc. 2022, 47, 2326–2339. [Google Scholar] [CrossRef]
- Liu, D.; Sun, J.; Zhang, L.; Yang, Y.; Zhang, L.; Zhang, Z. Division method of tensile and shear crack and its application in sandstone rockburst precursor. Zhongnan Daxue Xuebao (Ziran Kexue Ban)/J. Cent. South Univ. (Sci. Technol.) 2023, 54, 1153–1167. [Google Scholar] [CrossRef]
- Chajed, S.; Singh, A. Microcrack classification of rock salt under quasi-static compression using acoustic emission. Geotech. Geol. Eng. 2024, 42, 3691–3709. [Google Scholar] [CrossRef]
- Tiwari, G.; Latha, G.M. Shear velocity-based uncertainty quantification for rock joint shear strength. Bull. Eng. Geol. Environ. 2019, 78, 5937–5949. [Google Scholar] [CrossRef]
- Aggelis, D.G.; Mpalaskas, A.C.; Matikas, T.E. Investigation of different fracture modes in cement-based materials by acoustic emission. Cem. Concr. Res. 2013, 48, 1–8. [Google Scholar] [CrossRef]
- Niu, Y.; Zhou, X.-P.; Berto, F. Evaluation of fracture mode classification in flawed red sandstone under uniaxial compression. Theor. Appl. Fract. Mech. 2020, 107, 102528. [Google Scholar] [CrossRef]
- He, L.; Lu, X.; Copeland, T.; Chen, J.; Yan, J.; Zhao, W. The Impact of Shear Rate on the Mechanical Behavior of Rock Joints Under Multiple-Influencing Factors. Rock Mech. Rock Eng. 2023, 56, 7397–7414. [Google Scholar] [CrossRef]
- Guo, J.; Feng, Z.; Li, X. Evolution of microcracks and energy of granite during shear test with PFC3D. Meitan Kexue Jishu/Coal Sci. Technol. (Peking) 2024, 52, 60–70. [Google Scholar] [CrossRef]
- Zhang, X.; Jiang, Q.; Chen, N.; Wei, W.; Feng, X. Laboratory Investigation on Shear Behavior of Rock Joints and a New Peak Shear Strength Criterion. Rock Mech. Rock Eng. 2016, 49, 3495–3512. [Google Scholar] [CrossRef]
- Shi, H.; Liu, J.; Liu, S.; Chang, J.; Li, F. Evolutionary patterns of shear behavior and crack distribution during fault slip. Int. J. Rock Mech. Min. Sci. 2024, 177, 105747. [Google Scholar] [CrossRef]
- Jiang, Y.; Zhang, S.; Luan, H.; Shan, Q.; Li, B.; Wang, D.; Jia, C. Study on the Effect of Rock Strength on the Macro-Meso Shear Behaviors of Artificial Rock Joints. Geofluids 2022, 2022, 1–15. [Google Scholar] [CrossRef]
- Zhang, Y.; Li, Z.; Song, S.; Zhao, Y.; Li, H. Mechanical properties and acoustic emission characteristics of sandstone under natural and saturated conditions. Coal Geol. Explor. 2022, 50, 13. [Google Scholar]
- Wang, L.; Ni, B.; Xie, W.; Wang, S.-Z.; Kou, K.; Zhao, K. Microscopic-macroscopic crack evolution mechanism of yellow sandstone with different particle sizes. Rock Soil Mech. 2022, 43, 373–381. [Google Scholar] [CrossRef]
- Zhang, C.; Zhang, L.; Tao, Z.; Fang, Z.; Xie, Q.; Cui, G. Study on Rock Type Effect of Fault Sliding Stability. Rock Mech. Rock Eng. 2024, 57, 1915–1938. [Google Scholar] [CrossRef]


| Number of Rock Specimens | Mineral Type | Proportion/% | Particle Size/mm |
|---|---|---|---|
| RSLT-1 (granite) | Anorthose | 38 | 0.5~3 |
| Potash feldspar | 30 | 0.5~5 | |
| Quartz | 25 | 1.5 | |
| Amphibole | 4 | 0.6 | |
| Mica | 3 | 1 | |
| RSLT-3 (white sandstone) | Quartz | 50 | 2~4 |
| Kaolin | 20 | 0.12 | |
| Gothite | 18 | 0.09 | |
| Mica | 8 | 0.5 | |
| Feldspar | 4 | 0.3 | |
| RSLT-4, (red sandstone) | Quartz | 50 | 0.1~0.5 |
| Feldspar | 25 | 0.05~0.5 | |
| Kaliglimmer | 10 | 0.05~0.5 | |
| Montmorillonite | 10 | 0.1 | |
| Hematite | 5 | 0.06 | |
| RSLT-5 (yellow sandstone) | Quartz | 55 | 0.1~0.15 |
| Mica | 25 | 0.02~0.08 | |
| Kalijarosite | 10 | 0.002 | |
| Illite | 5 | 0.0002 | |
| Feldspar | 5 | 0.2 |
| No. | Initial Phase | Shear Failure Phase | Slow Slip Phase | Fast Slip Phase |
|---|---|---|---|---|
| RSLT-1 |  |  |  |  |
| RSLT-3 | 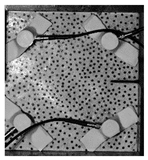 | 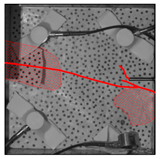 | 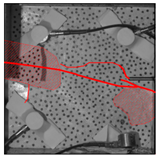 |  |
| RSLT-4 | 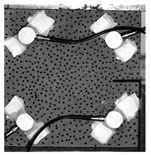 | 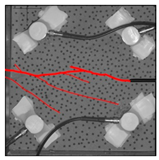 |  |  |
| RSLT-5 | 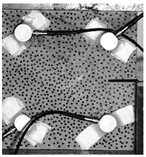 | 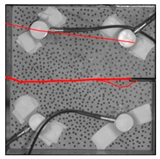 | 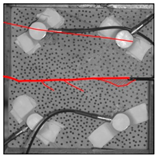 |  |
Disclaimer/Publisher’s Note: The statements, opinions and data contained in all publications are solely those of the individual author(s) and contributor(s) and not of MDPI and/or the editor(s). MDPI and/or the editor(s) disclaim responsibility for any injury to people or property resulting from any ideas, methods, instructions or products referred to in the content. |
© 2024 by the authors. Licensee MDPI, Basel, Switzerland. This article is an open access article distributed under the terms and conditions of the Creative Commons Attribution (CC BY) license (https://creativecommons.org/licenses/by/4.0/).
Share and Cite
Zhang, Z.; Liu, X.; Zhao, K.; Liang, Z.; Gong, B.; You, X. Experimental Study on Acoustic Emission Features and Energy Dissipation Properties during Rock Shear-Slip Process. Materials 2024, 17, 4684. https://doi.org/10.3390/ma17194684
Zhang Z, Liu X, Zhao K, Liang Z, Gong B, You X. Experimental Study on Acoustic Emission Features and Energy Dissipation Properties during Rock Shear-Slip Process. Materials. 2024; 17(19):4684. https://doi.org/10.3390/ma17194684
Chicago/Turabian StyleZhang, Zhengnan, Xiangxin Liu, Kui Zhao, Zhengzhao Liang, Bin Gong, and Xun You. 2024. "Experimental Study on Acoustic Emission Features and Energy Dissipation Properties during Rock Shear-Slip Process" Materials 17, no. 19: 4684. https://doi.org/10.3390/ma17194684