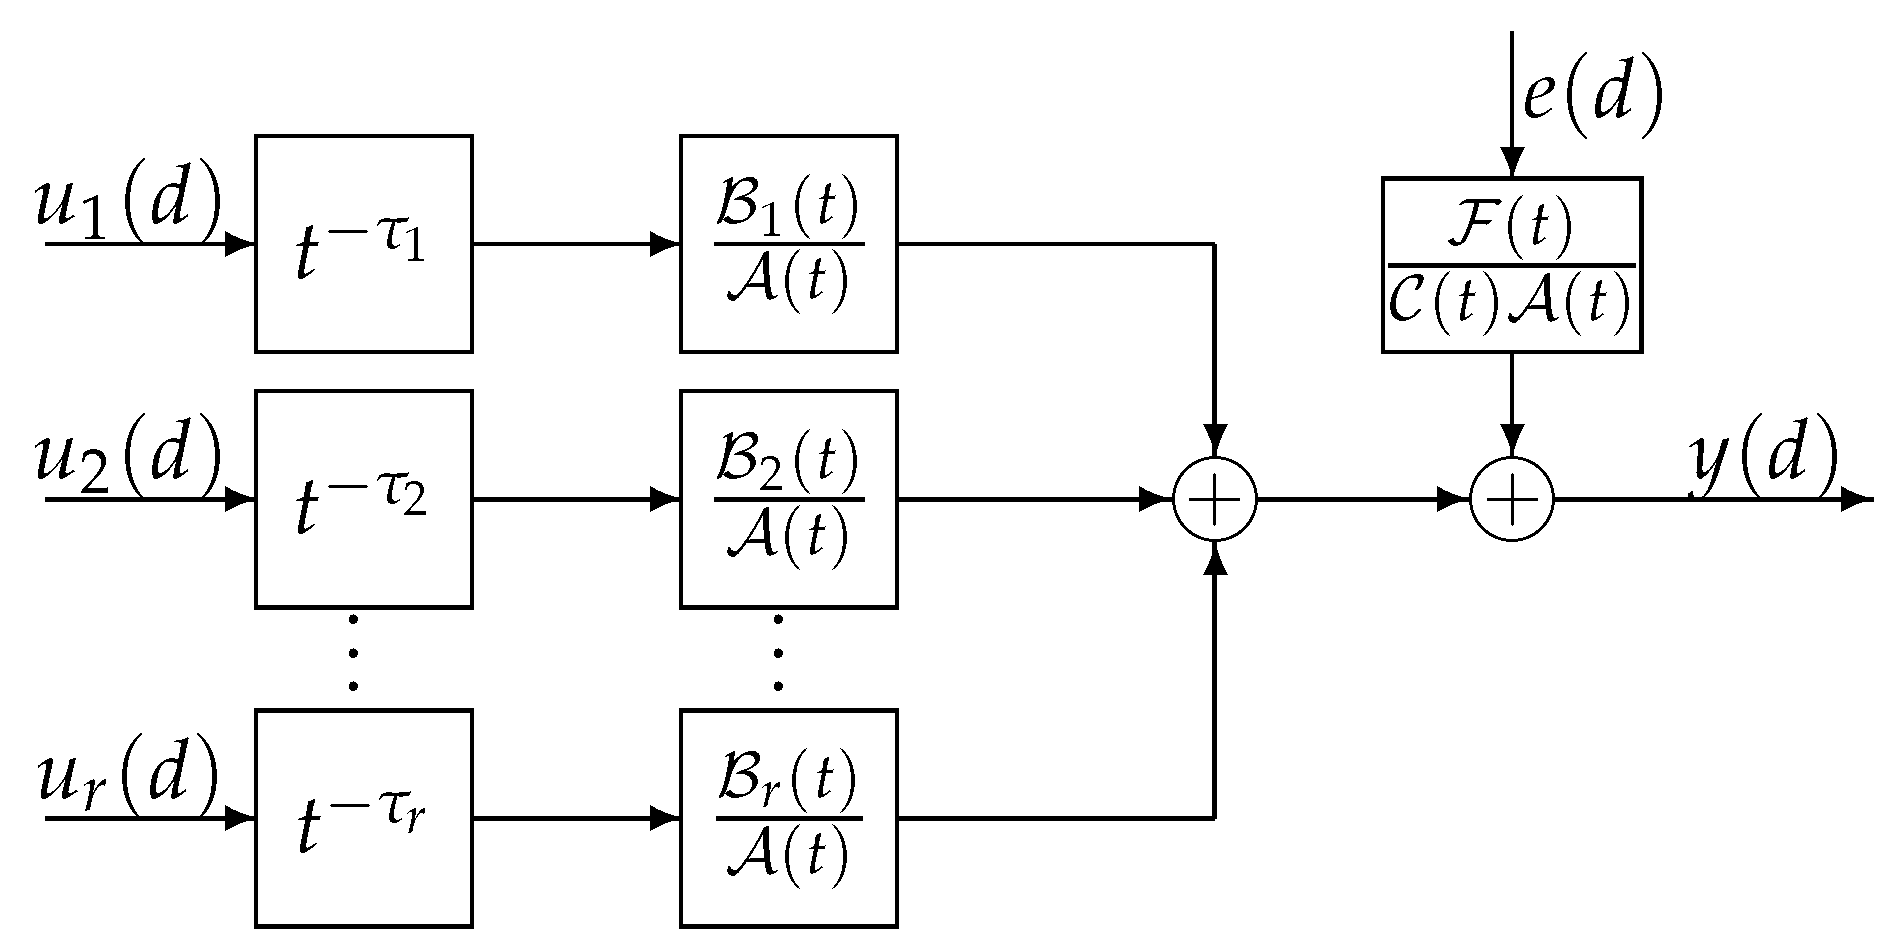
Figure 1.
The multi-input systems with input time delays and colored noise.
Figure 1.
The multi-input systems with input time delays and colored noise.
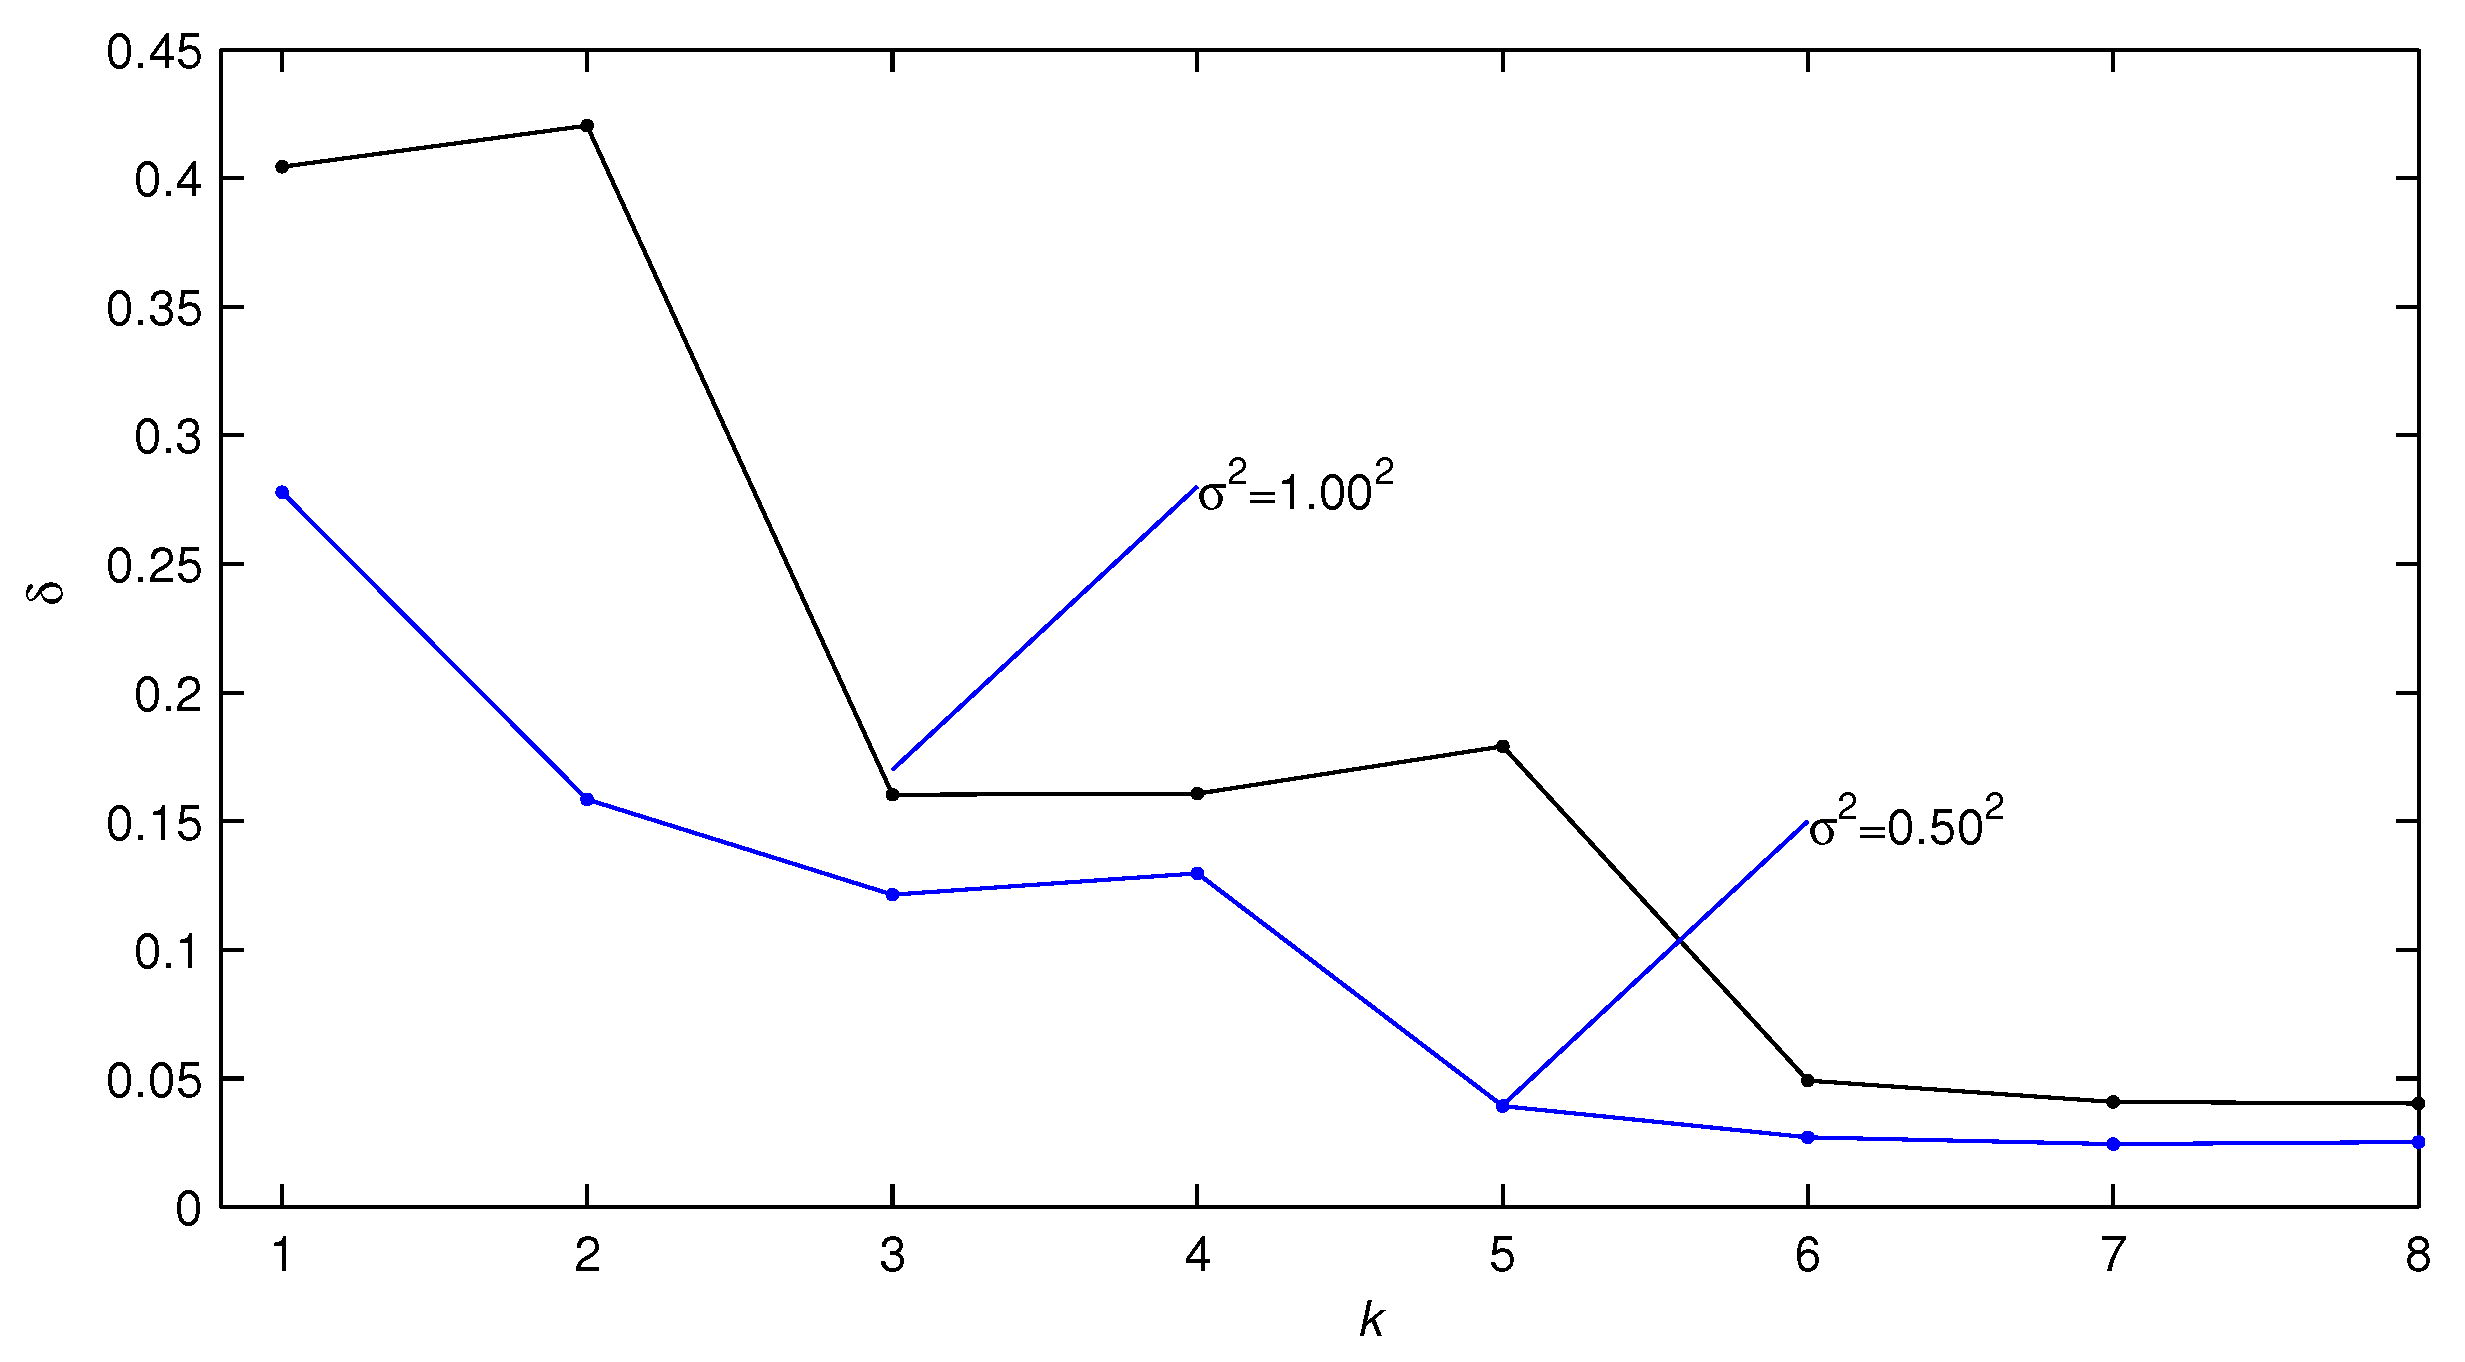
Figure 2.
The estimation errors versus k of Experiment 1 with (, ).
Figure 2.
The estimation errors versus k of Experiment 1 with (, ).
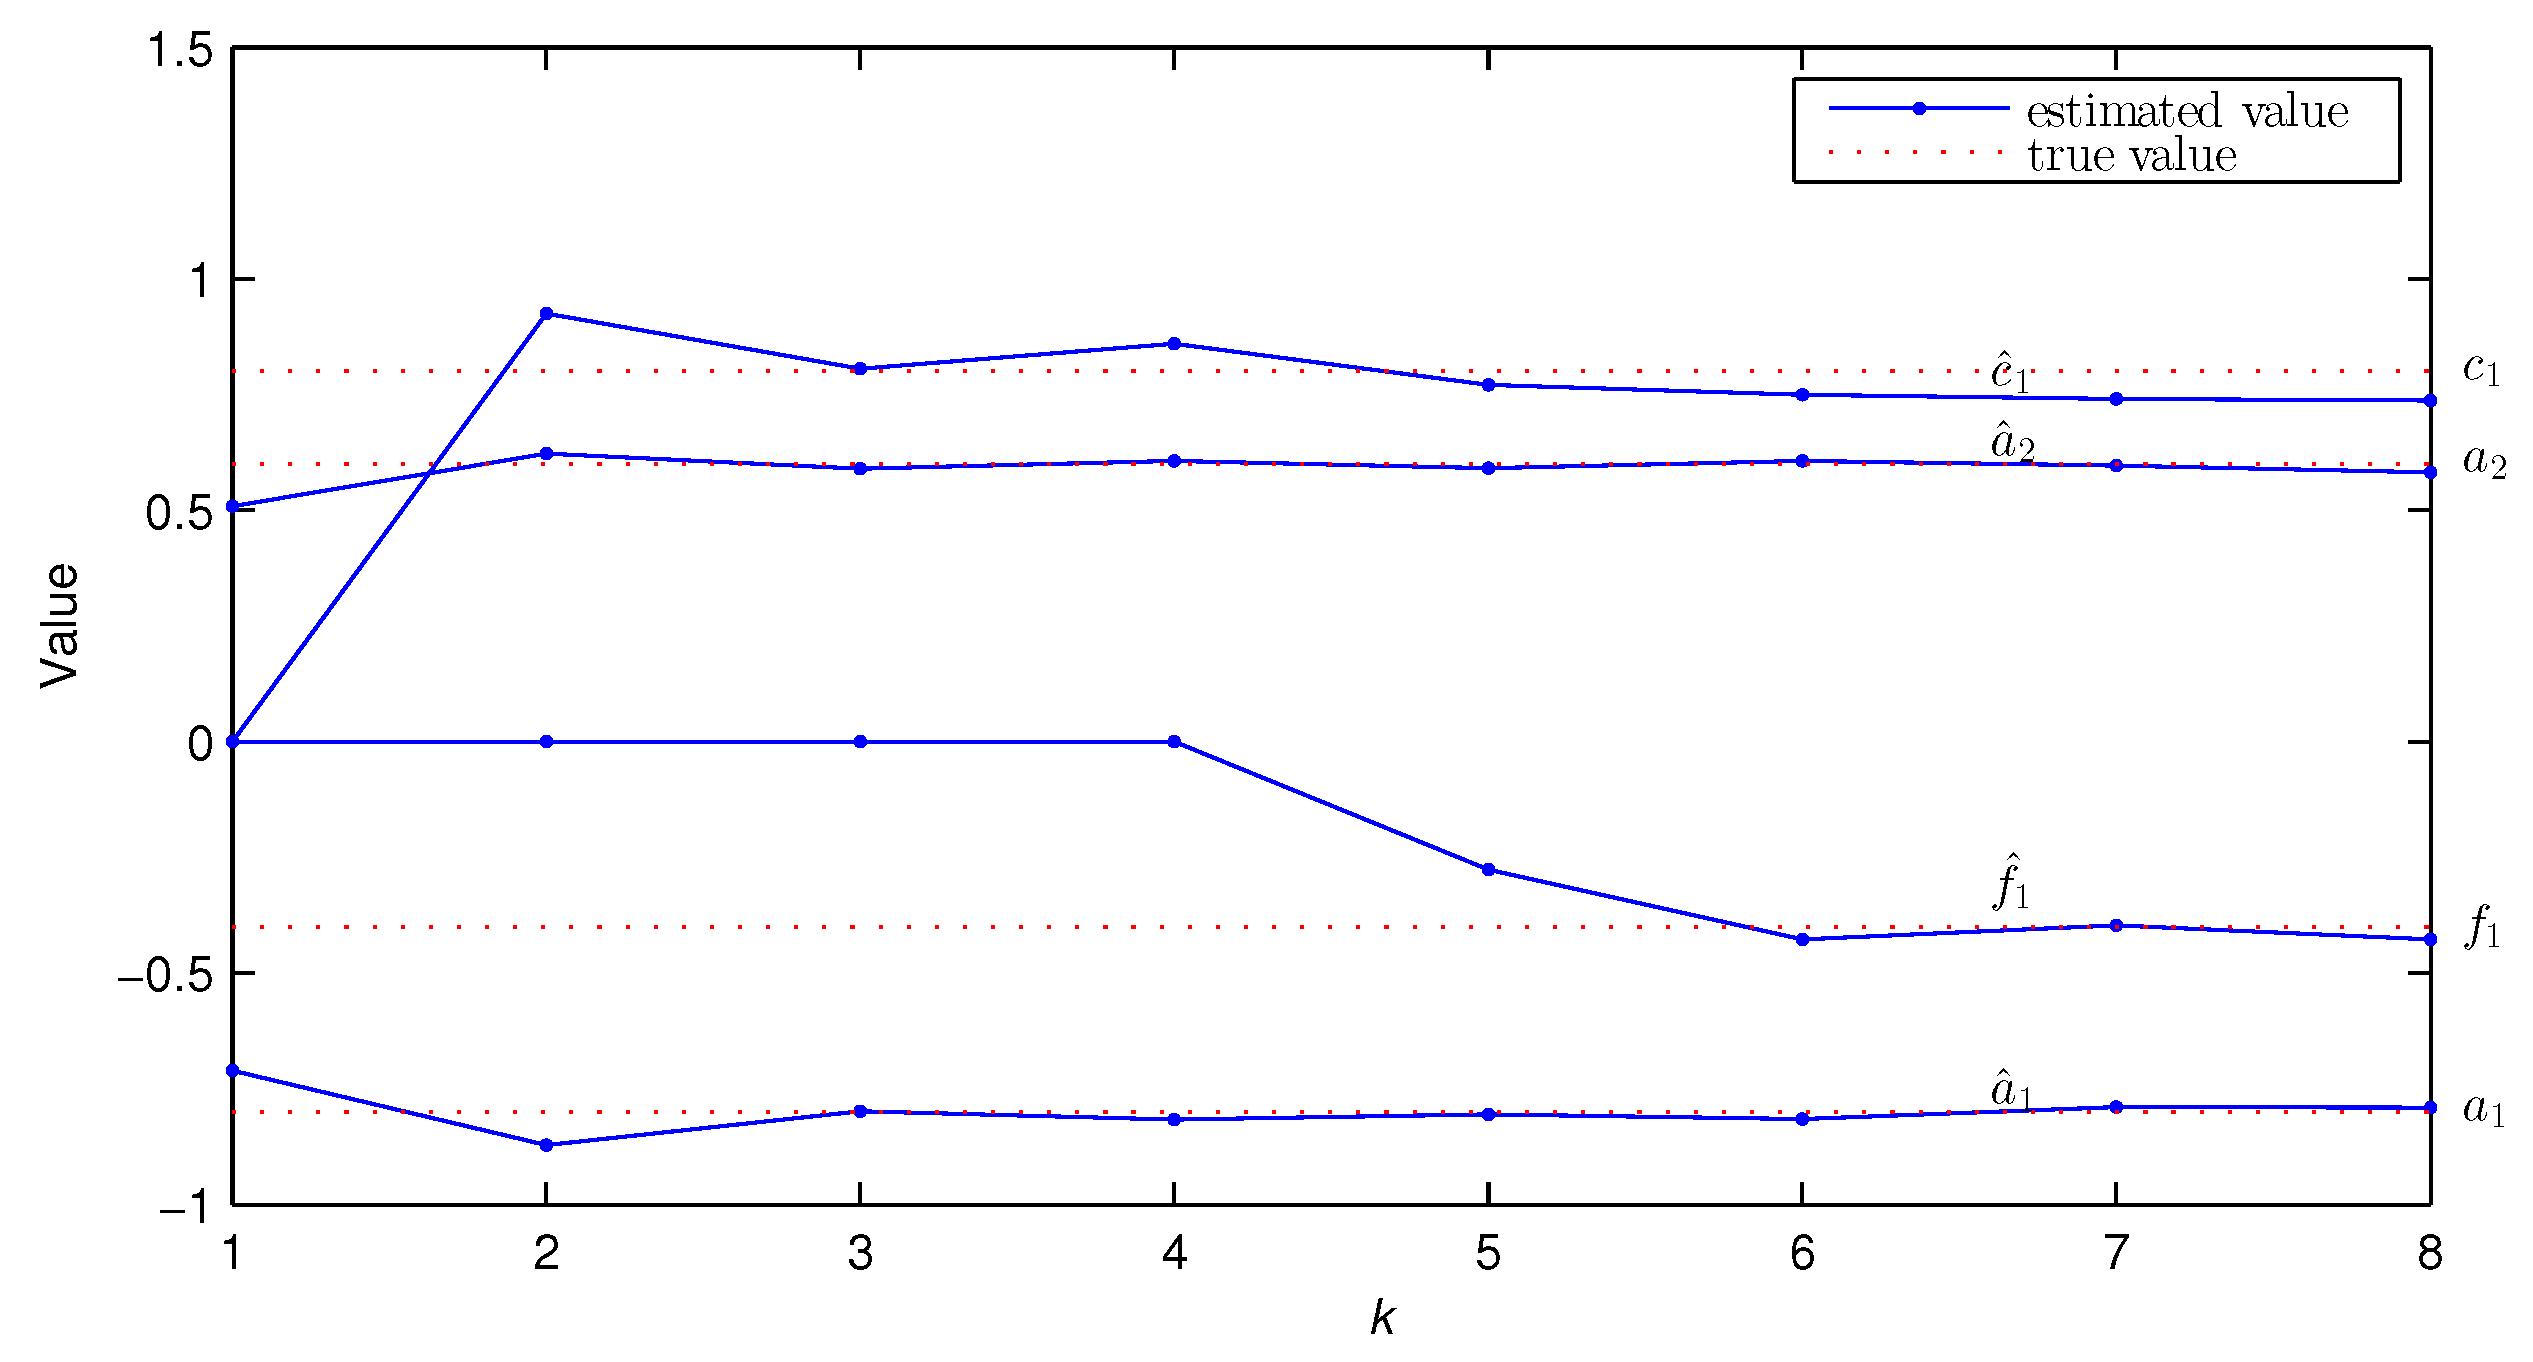
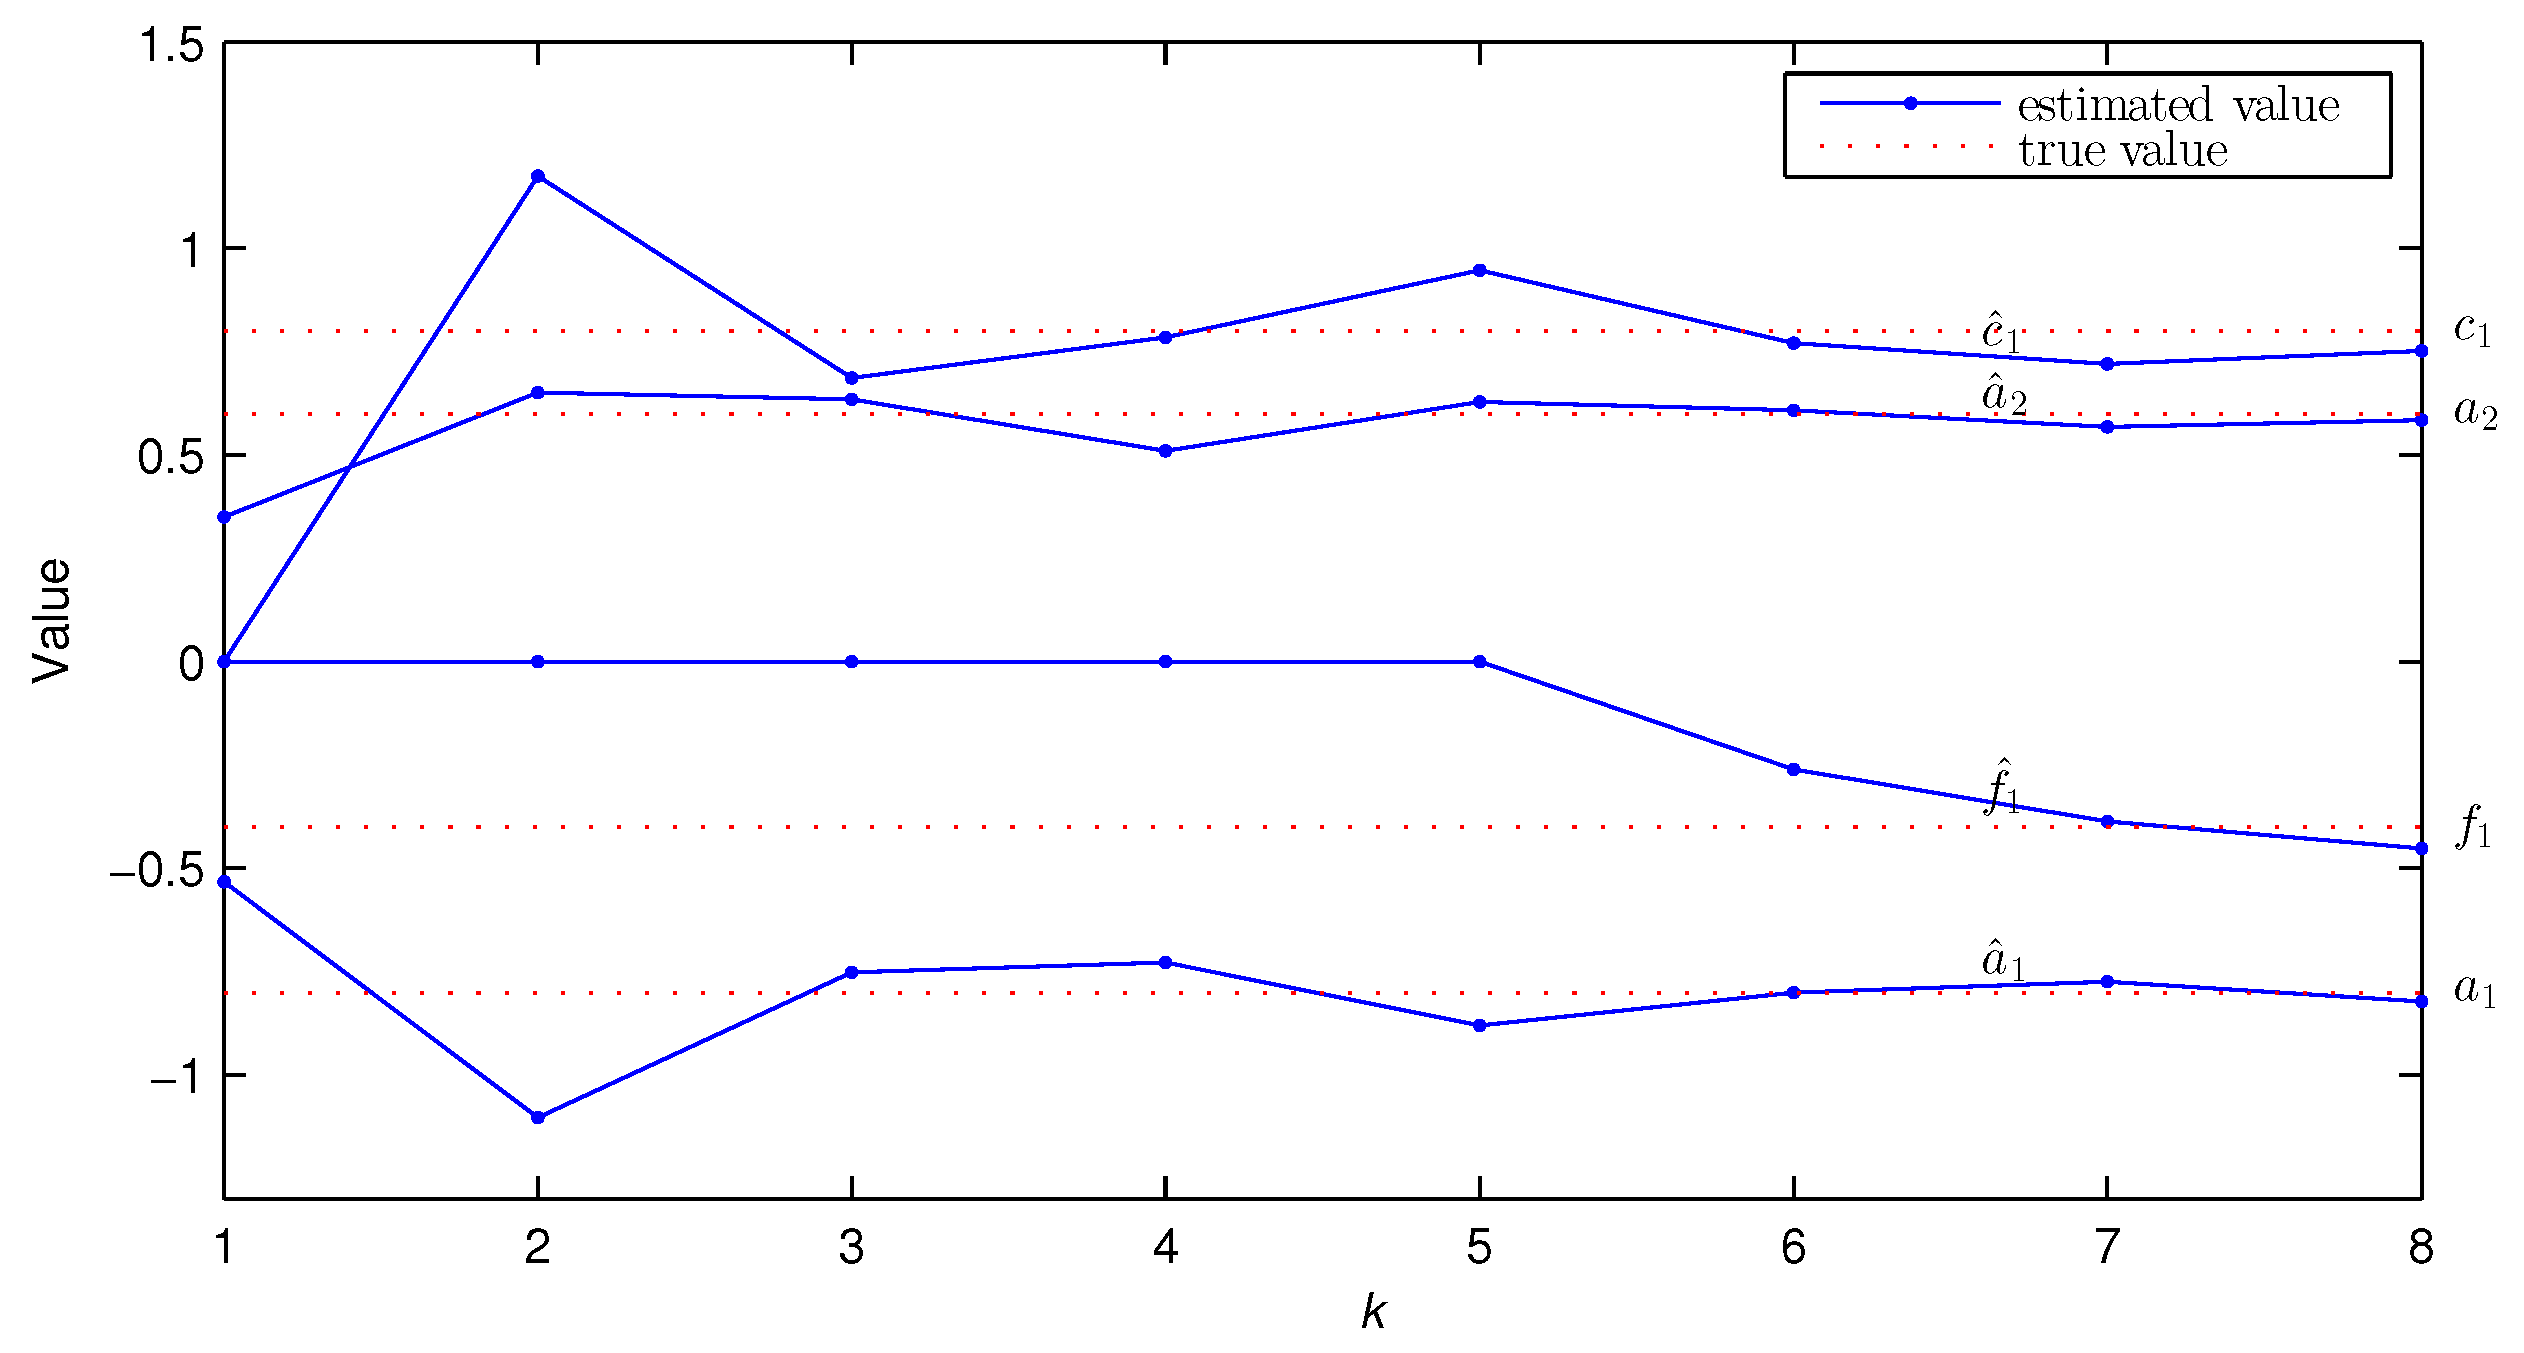
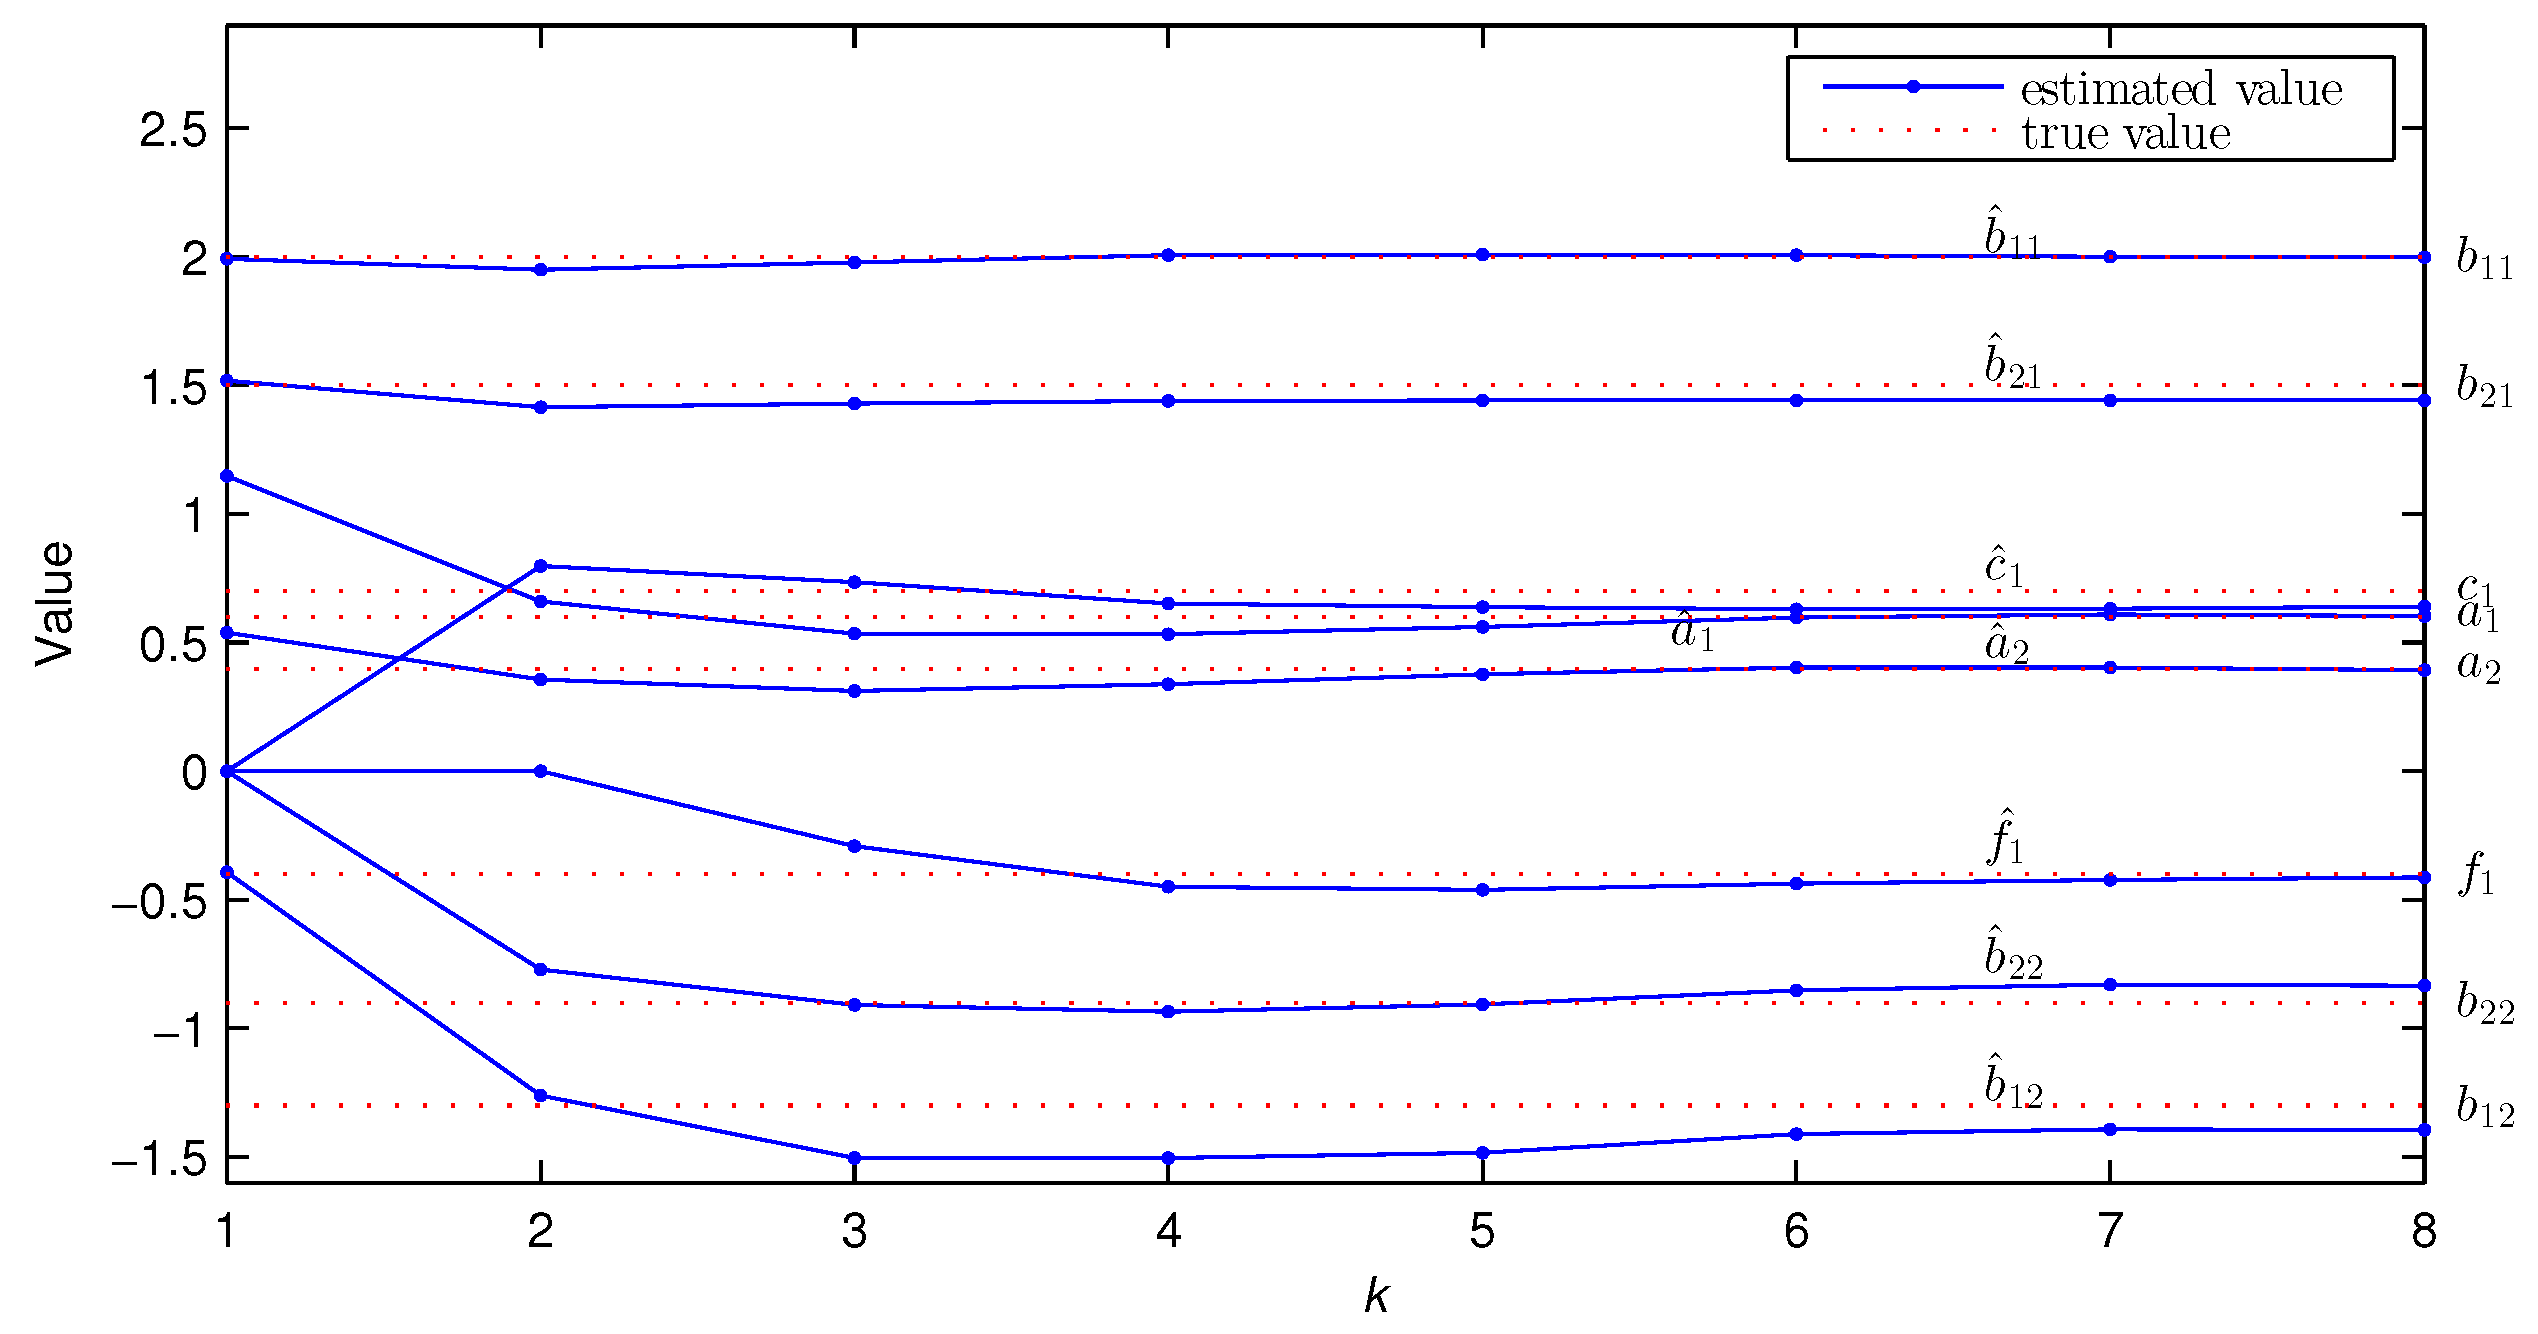
Figure 3.
The estimated parameter values versus k of Experiment 1 with and .
Figure 3.
The estimated parameter values versus k of Experiment 1 with and .
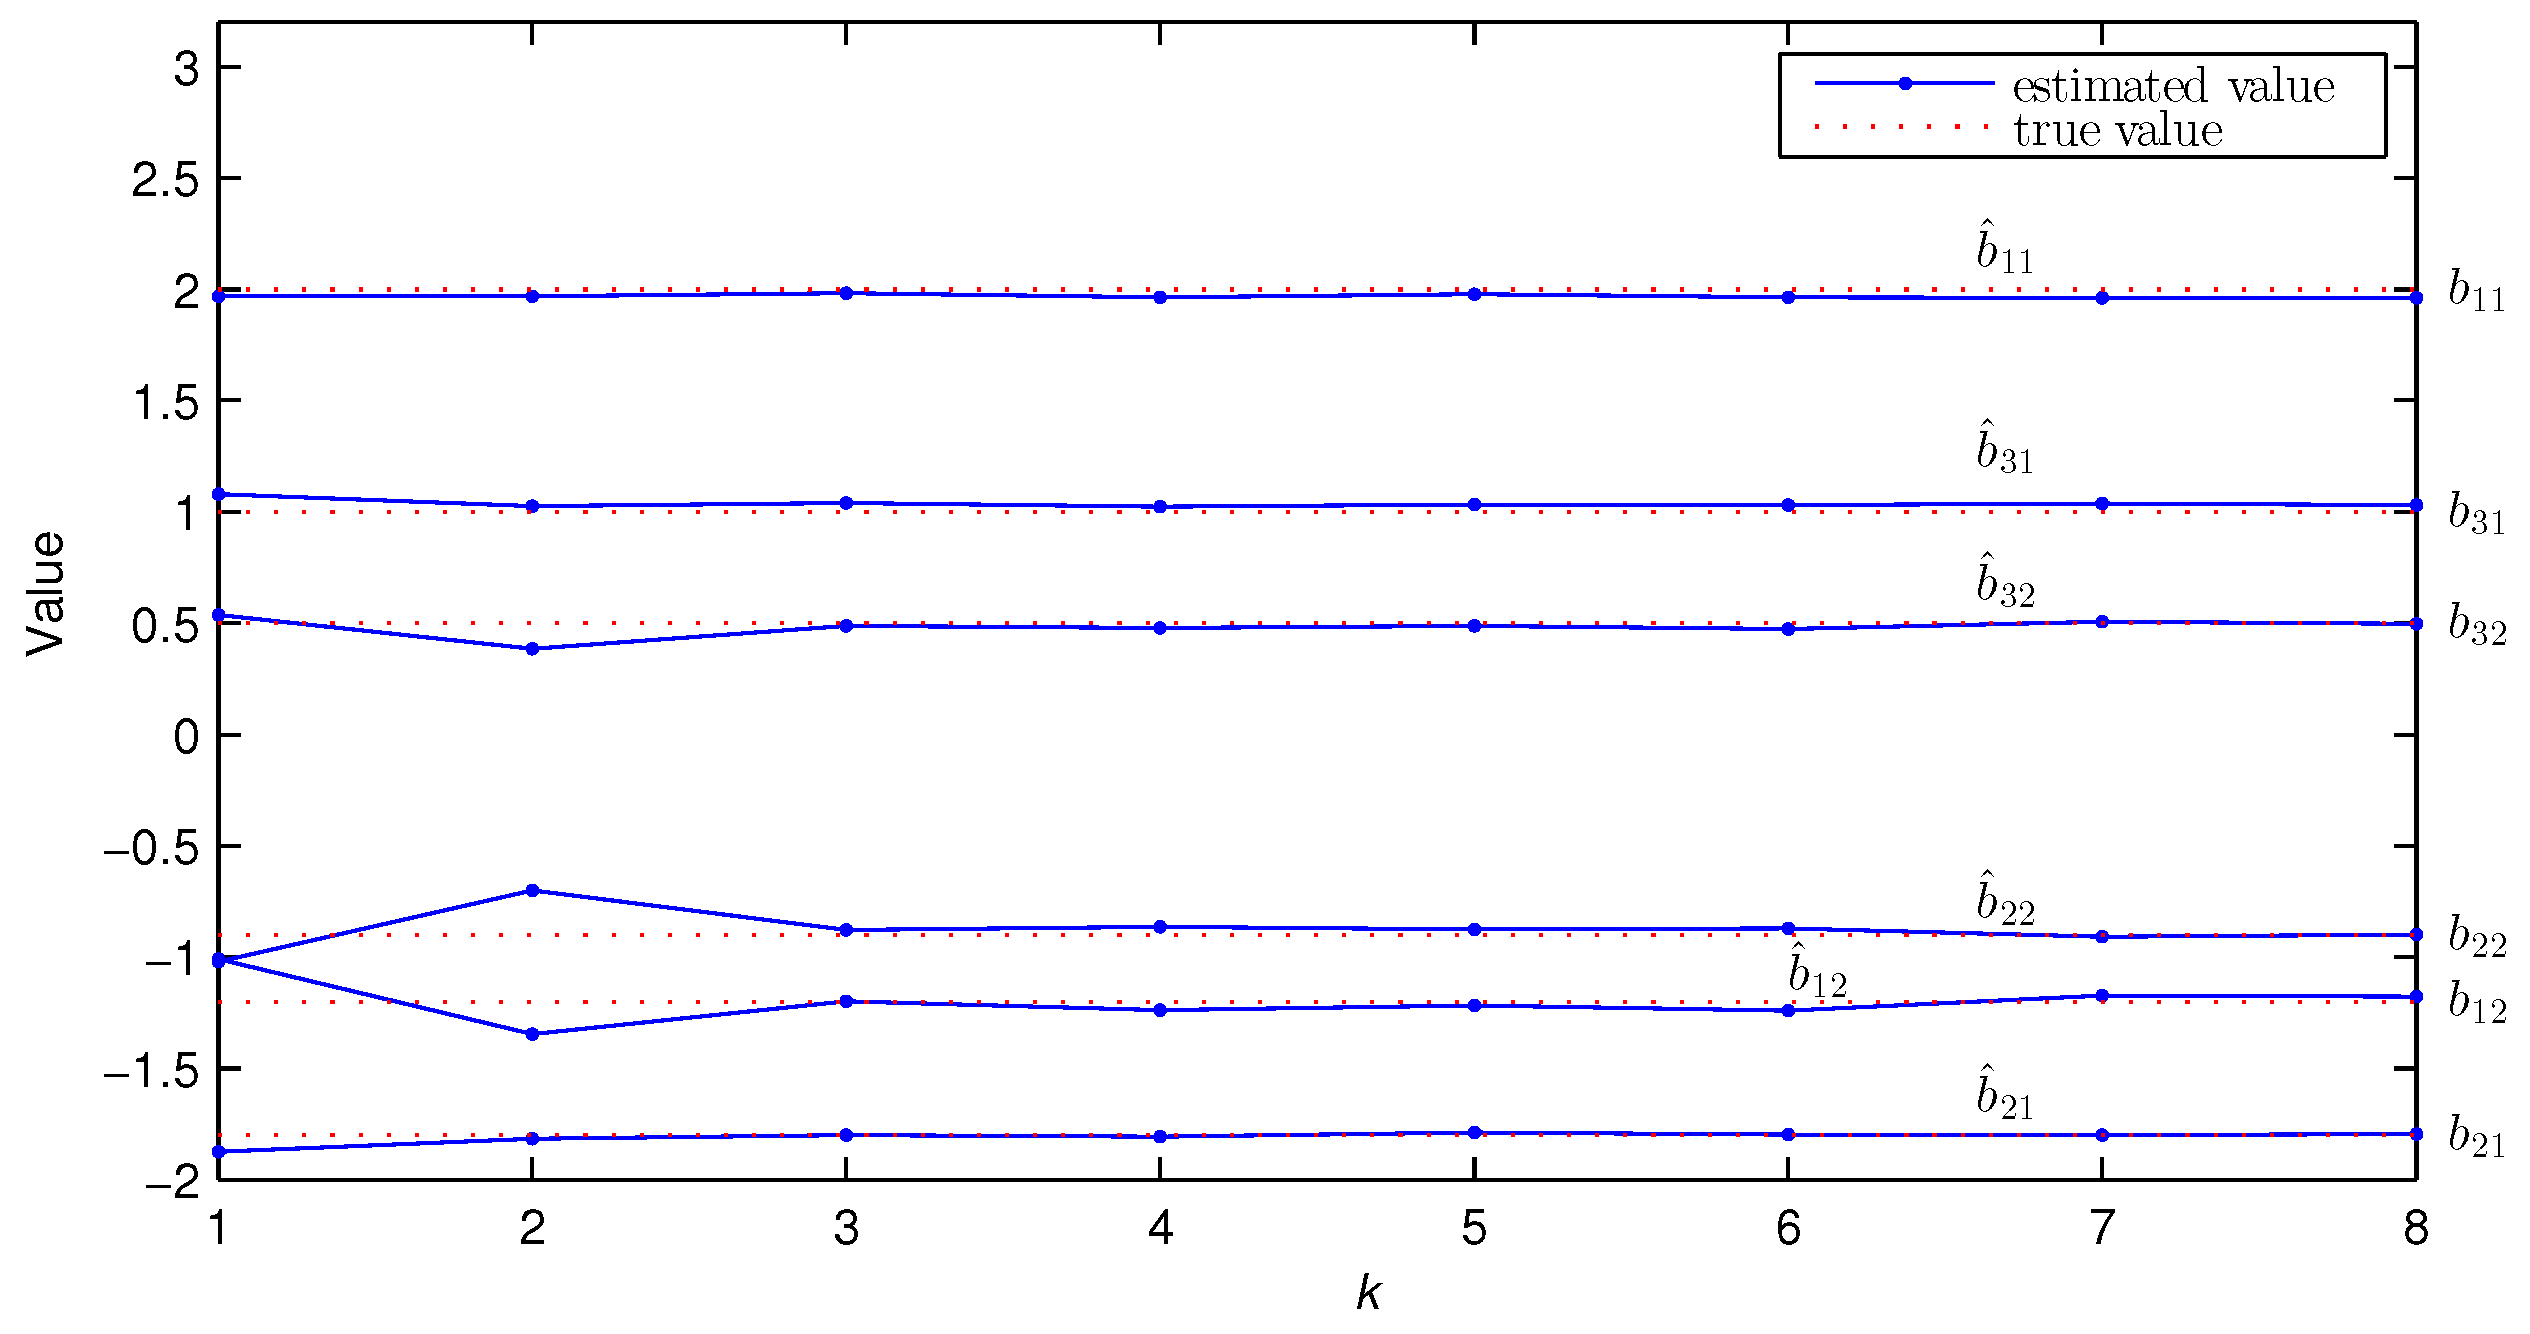
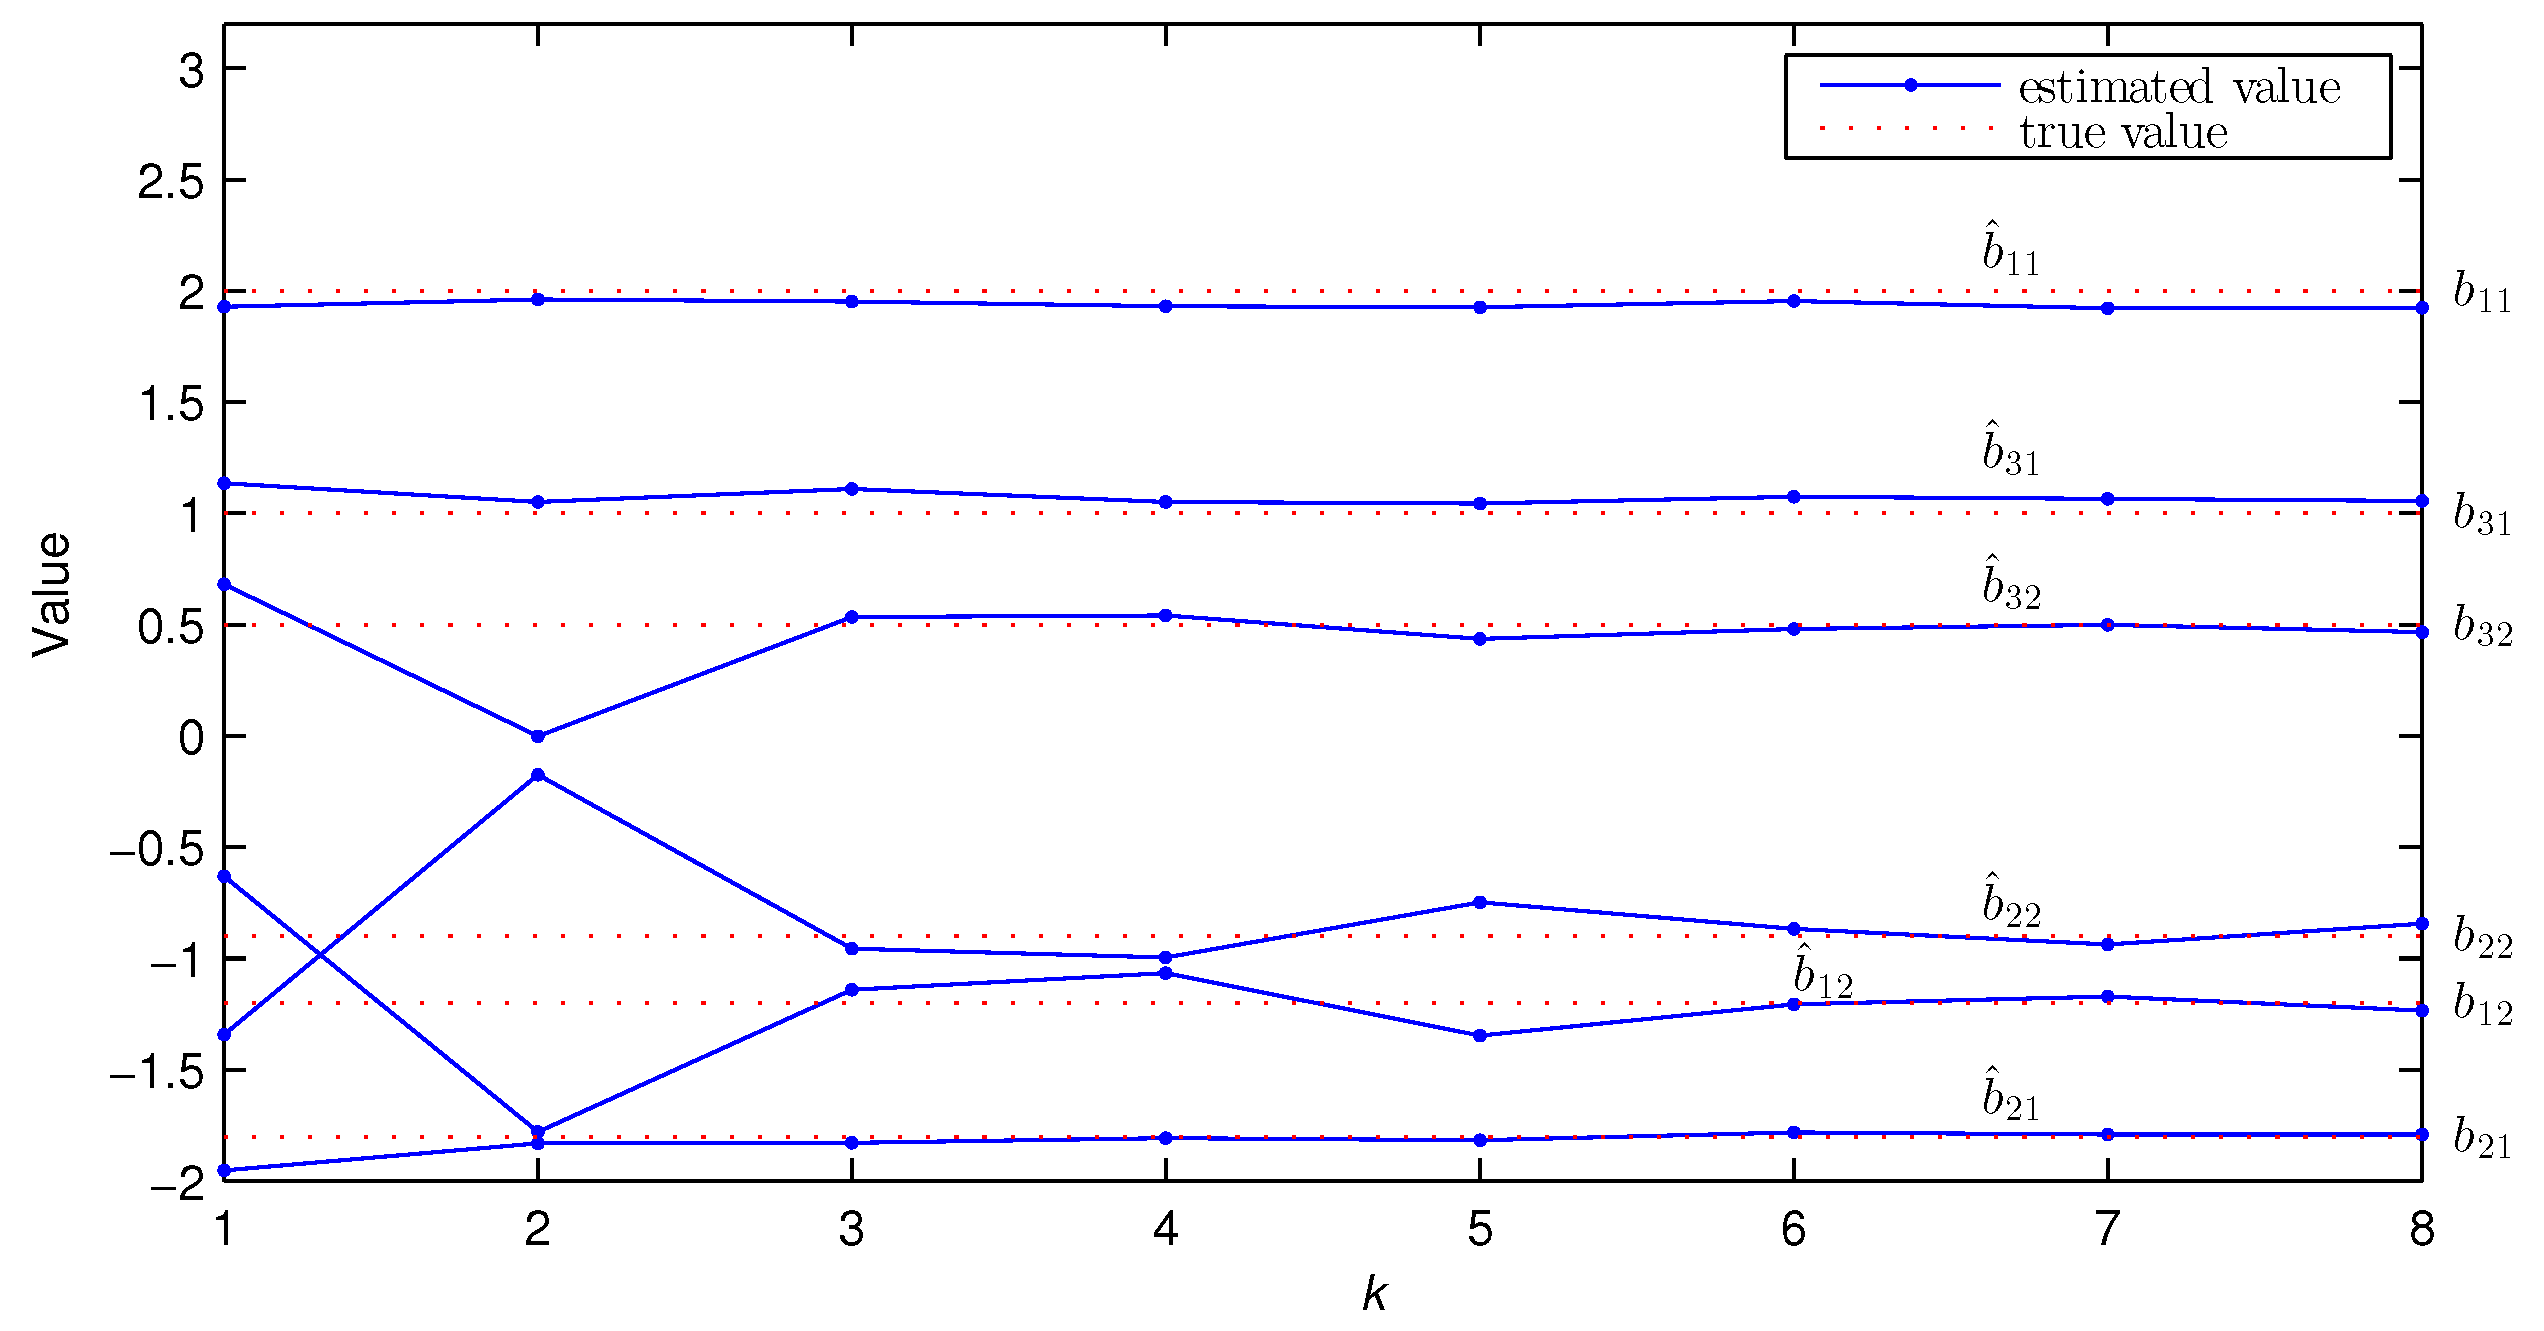
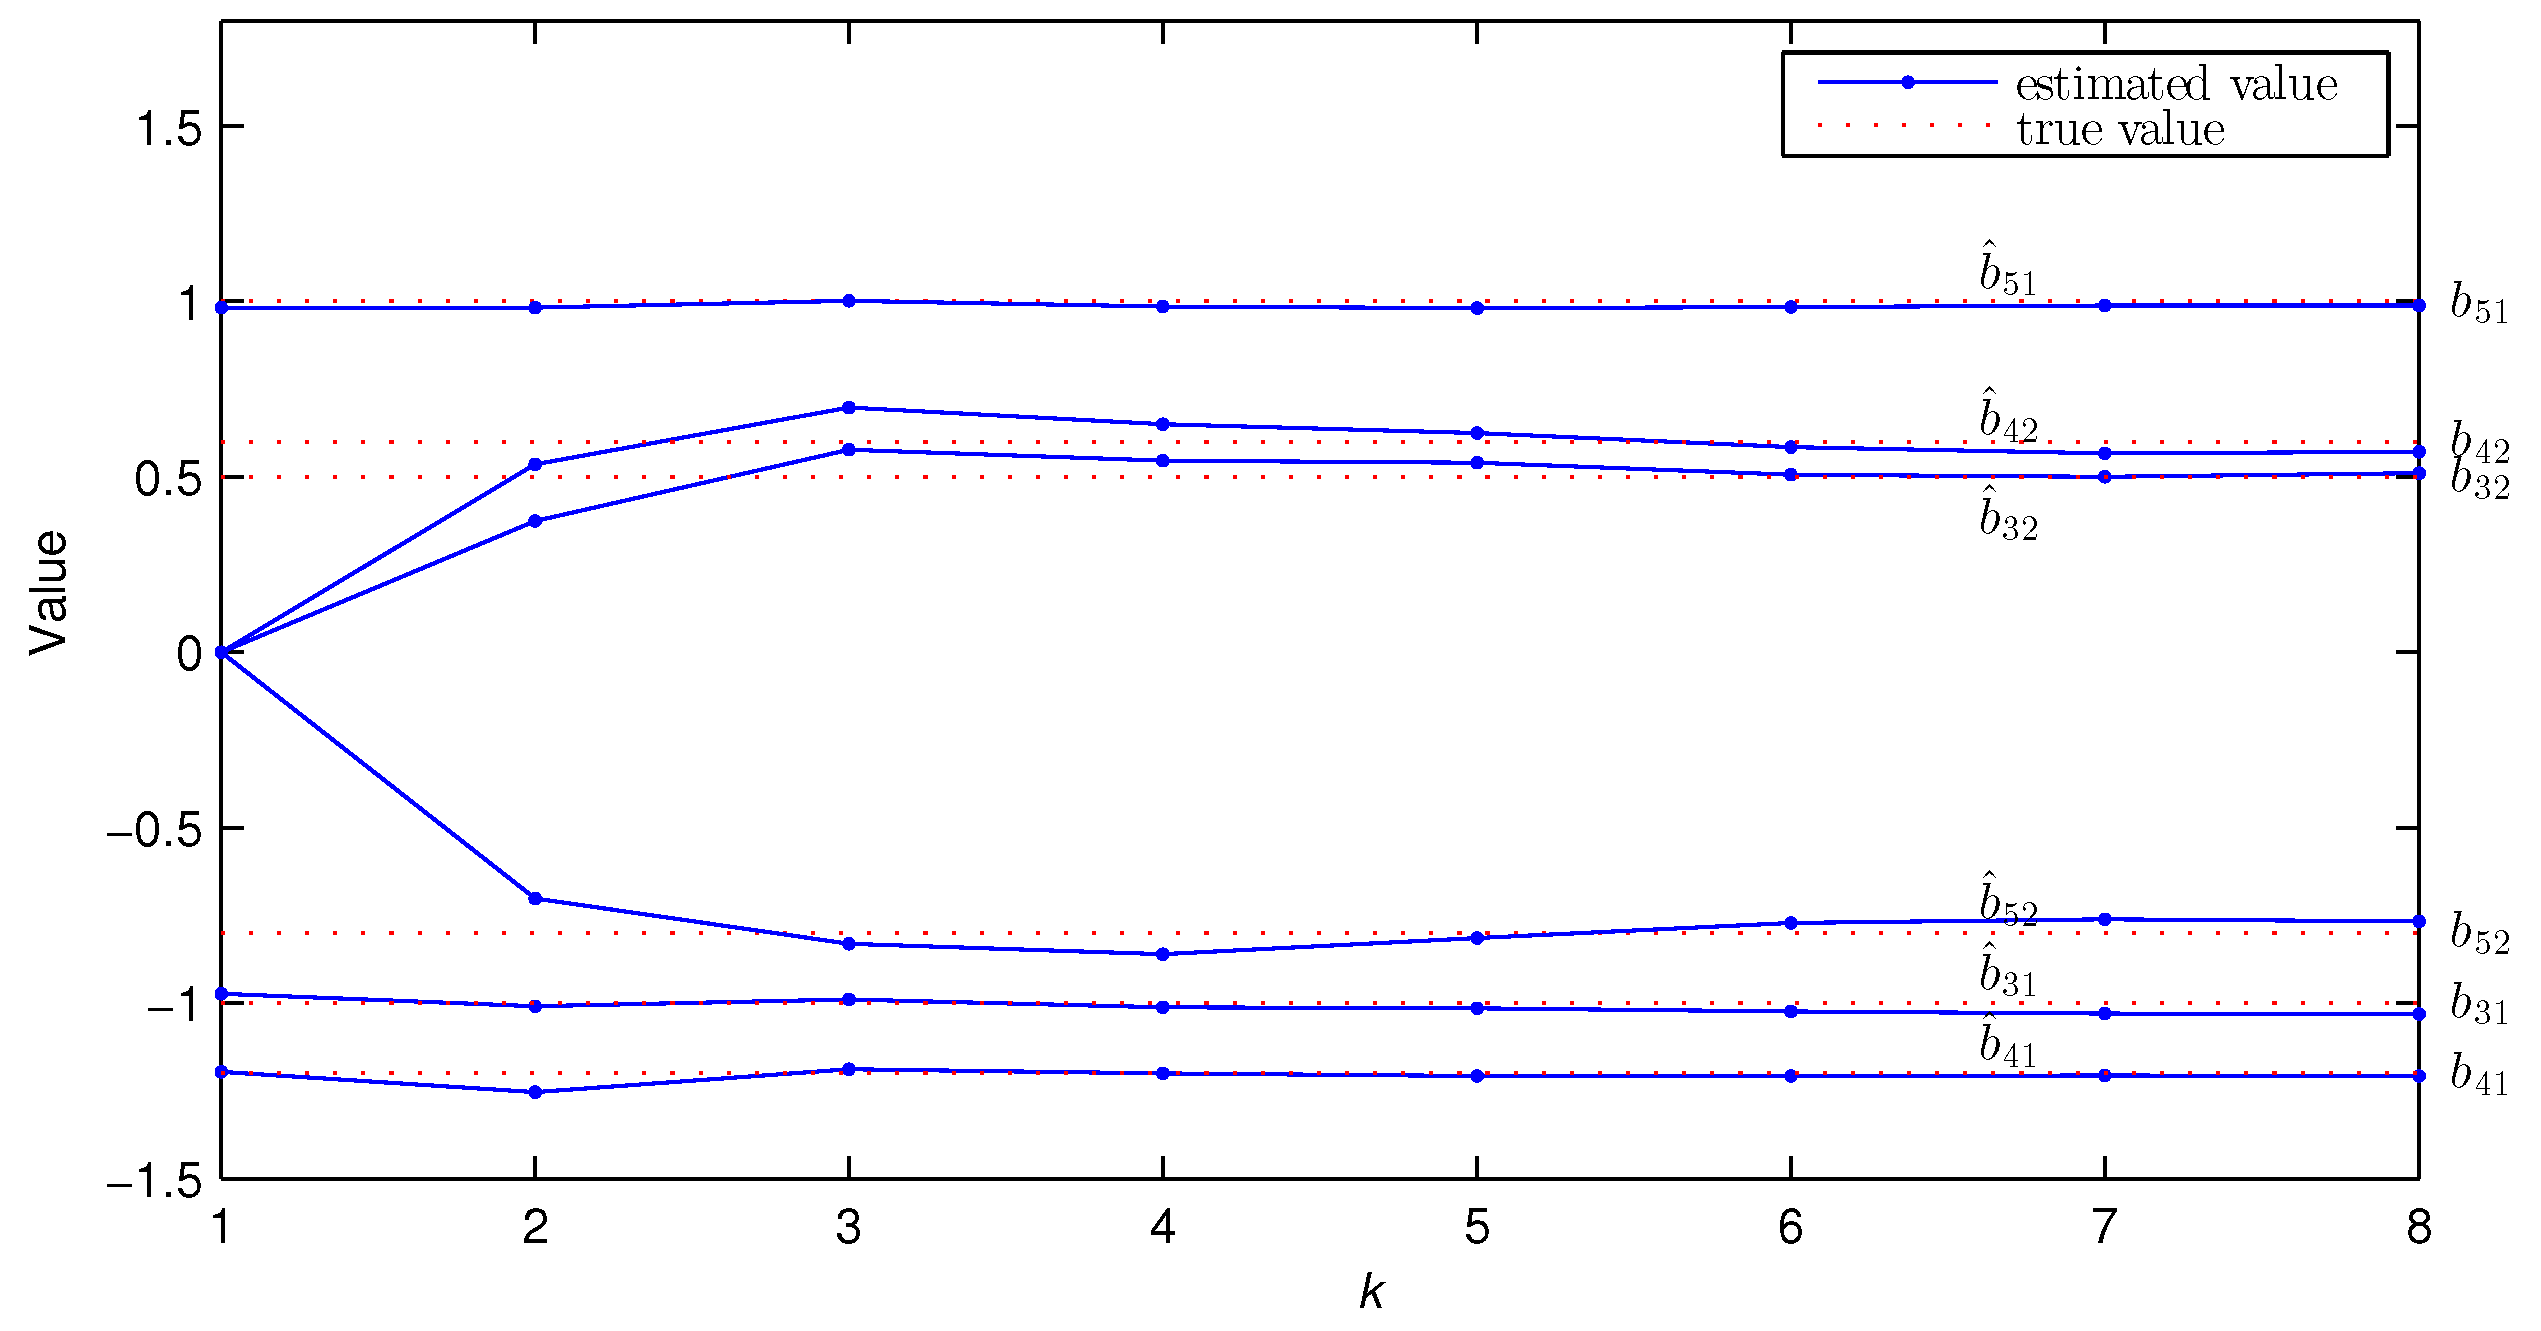
Figure 4.
The estimated parameter values versus k of Experiment 1 with and .
Figure 4.
The estimated parameter values versus k of Experiment 1 with and .
Figure 5.
The estimated parameter values versus k of Experiment 1 with and .
Figure 5.
The estimated parameter values versus k of Experiment 1 with and .
Figure 6.
The estimated parameter values versus k of Experiment 1 with and .
Figure 6.
The estimated parameter values versus k of Experiment 1 with and .
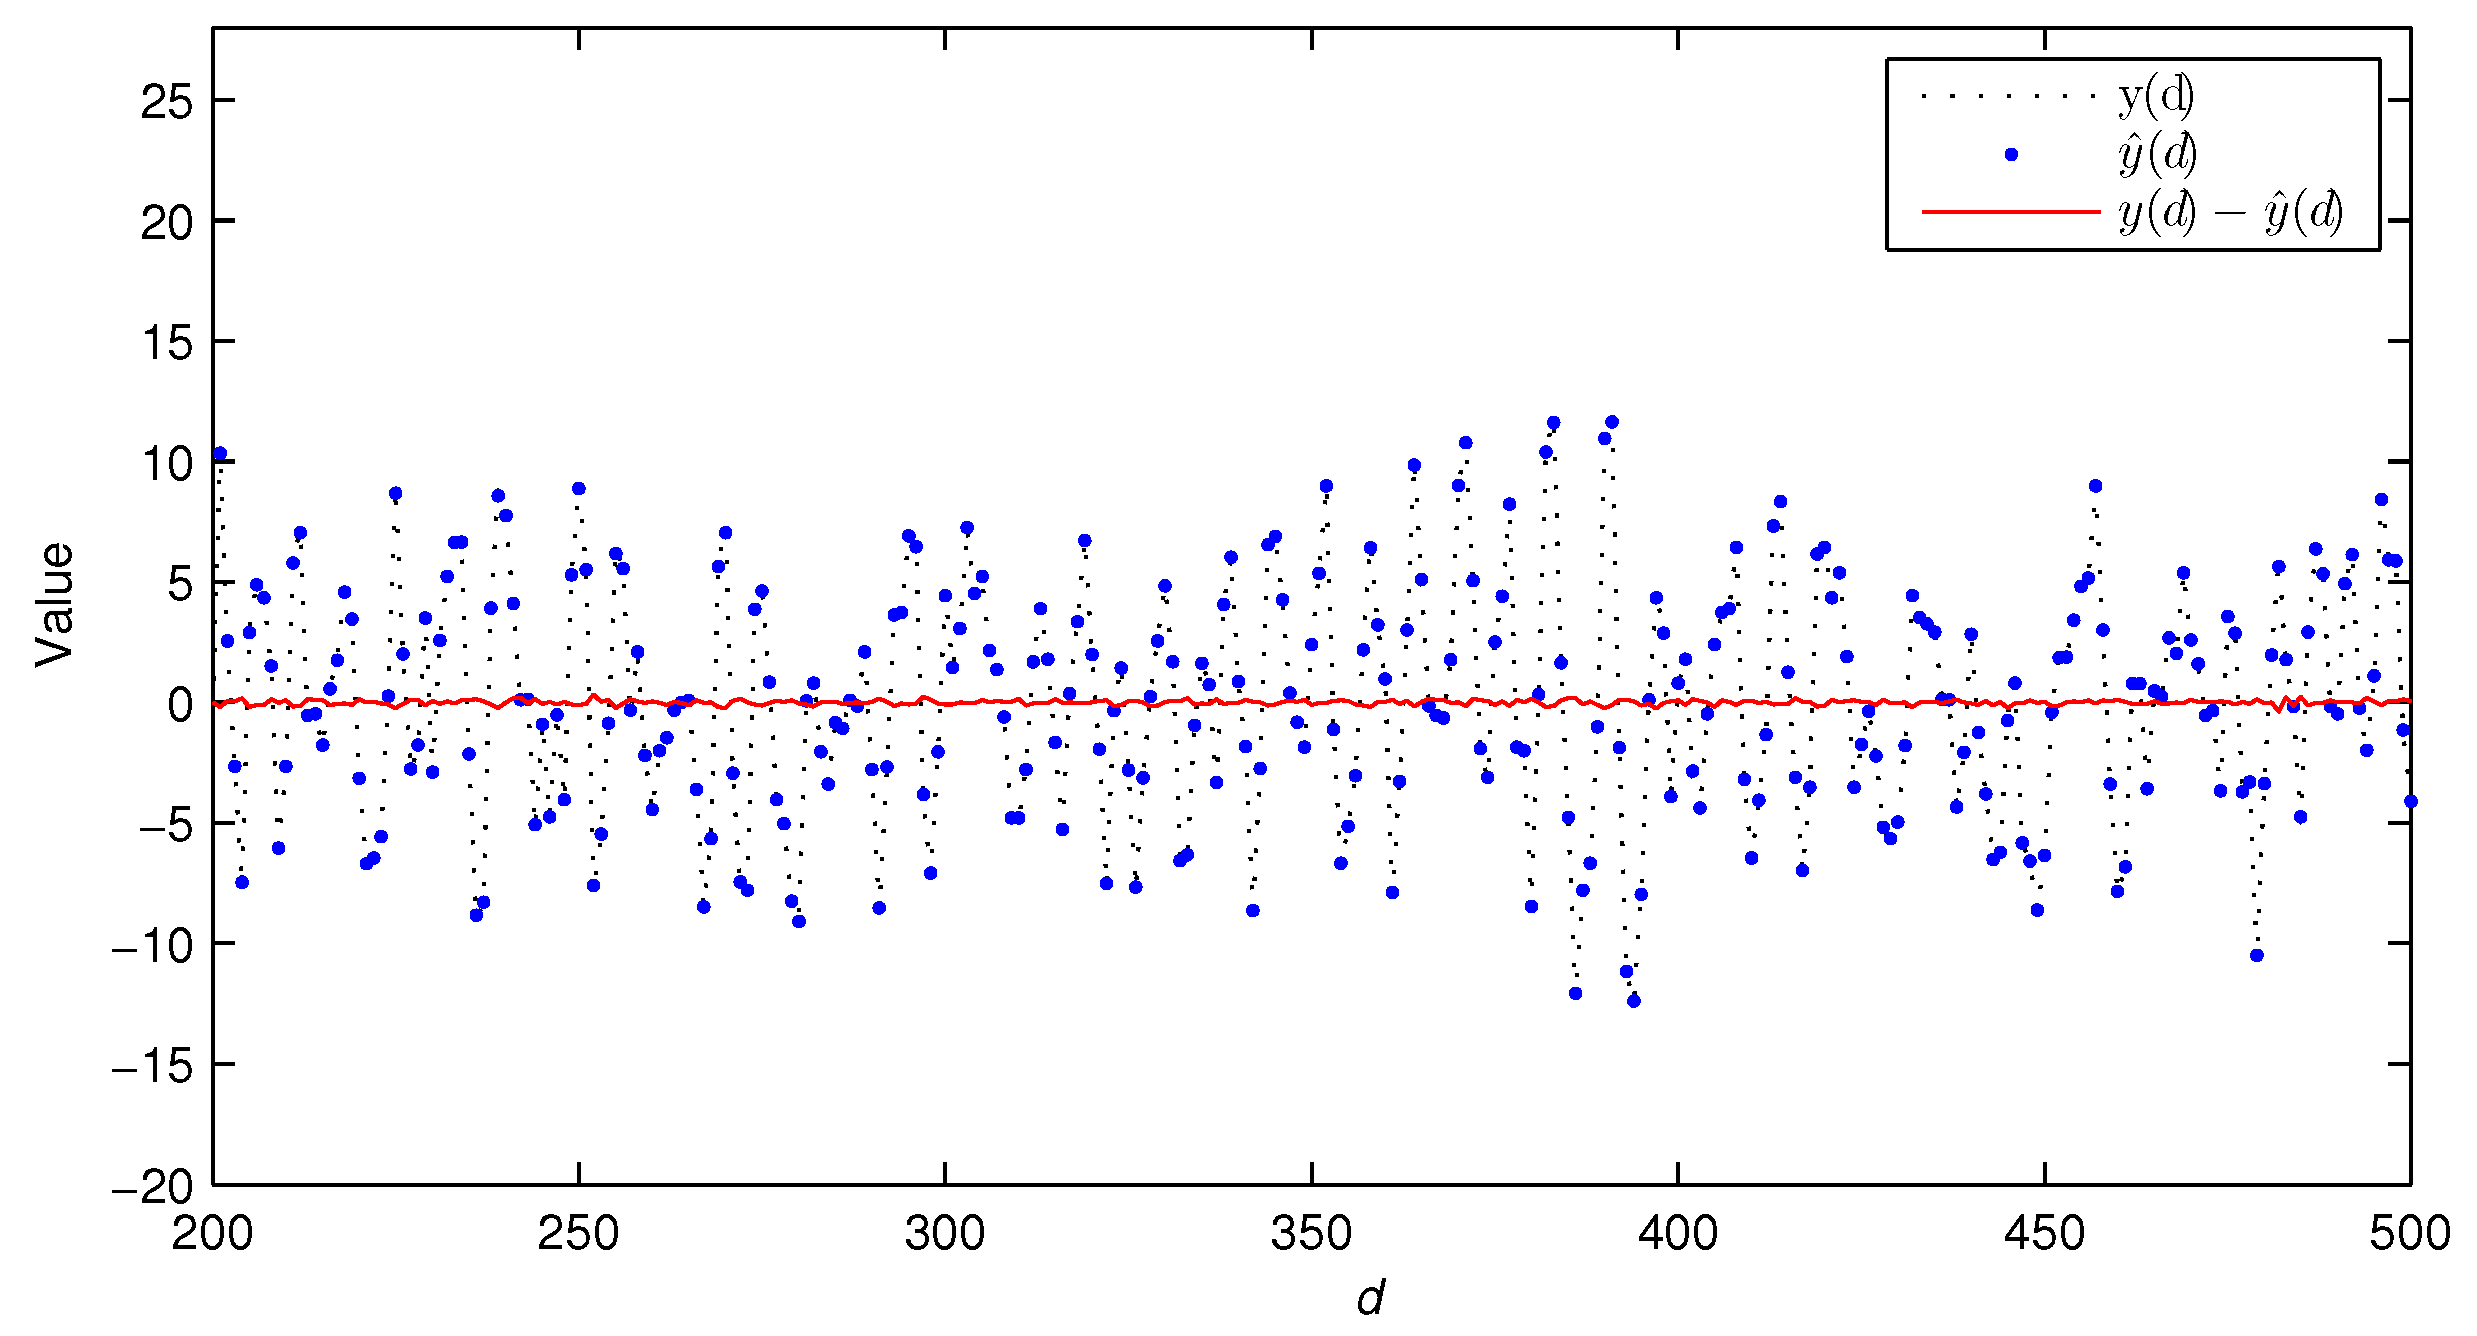
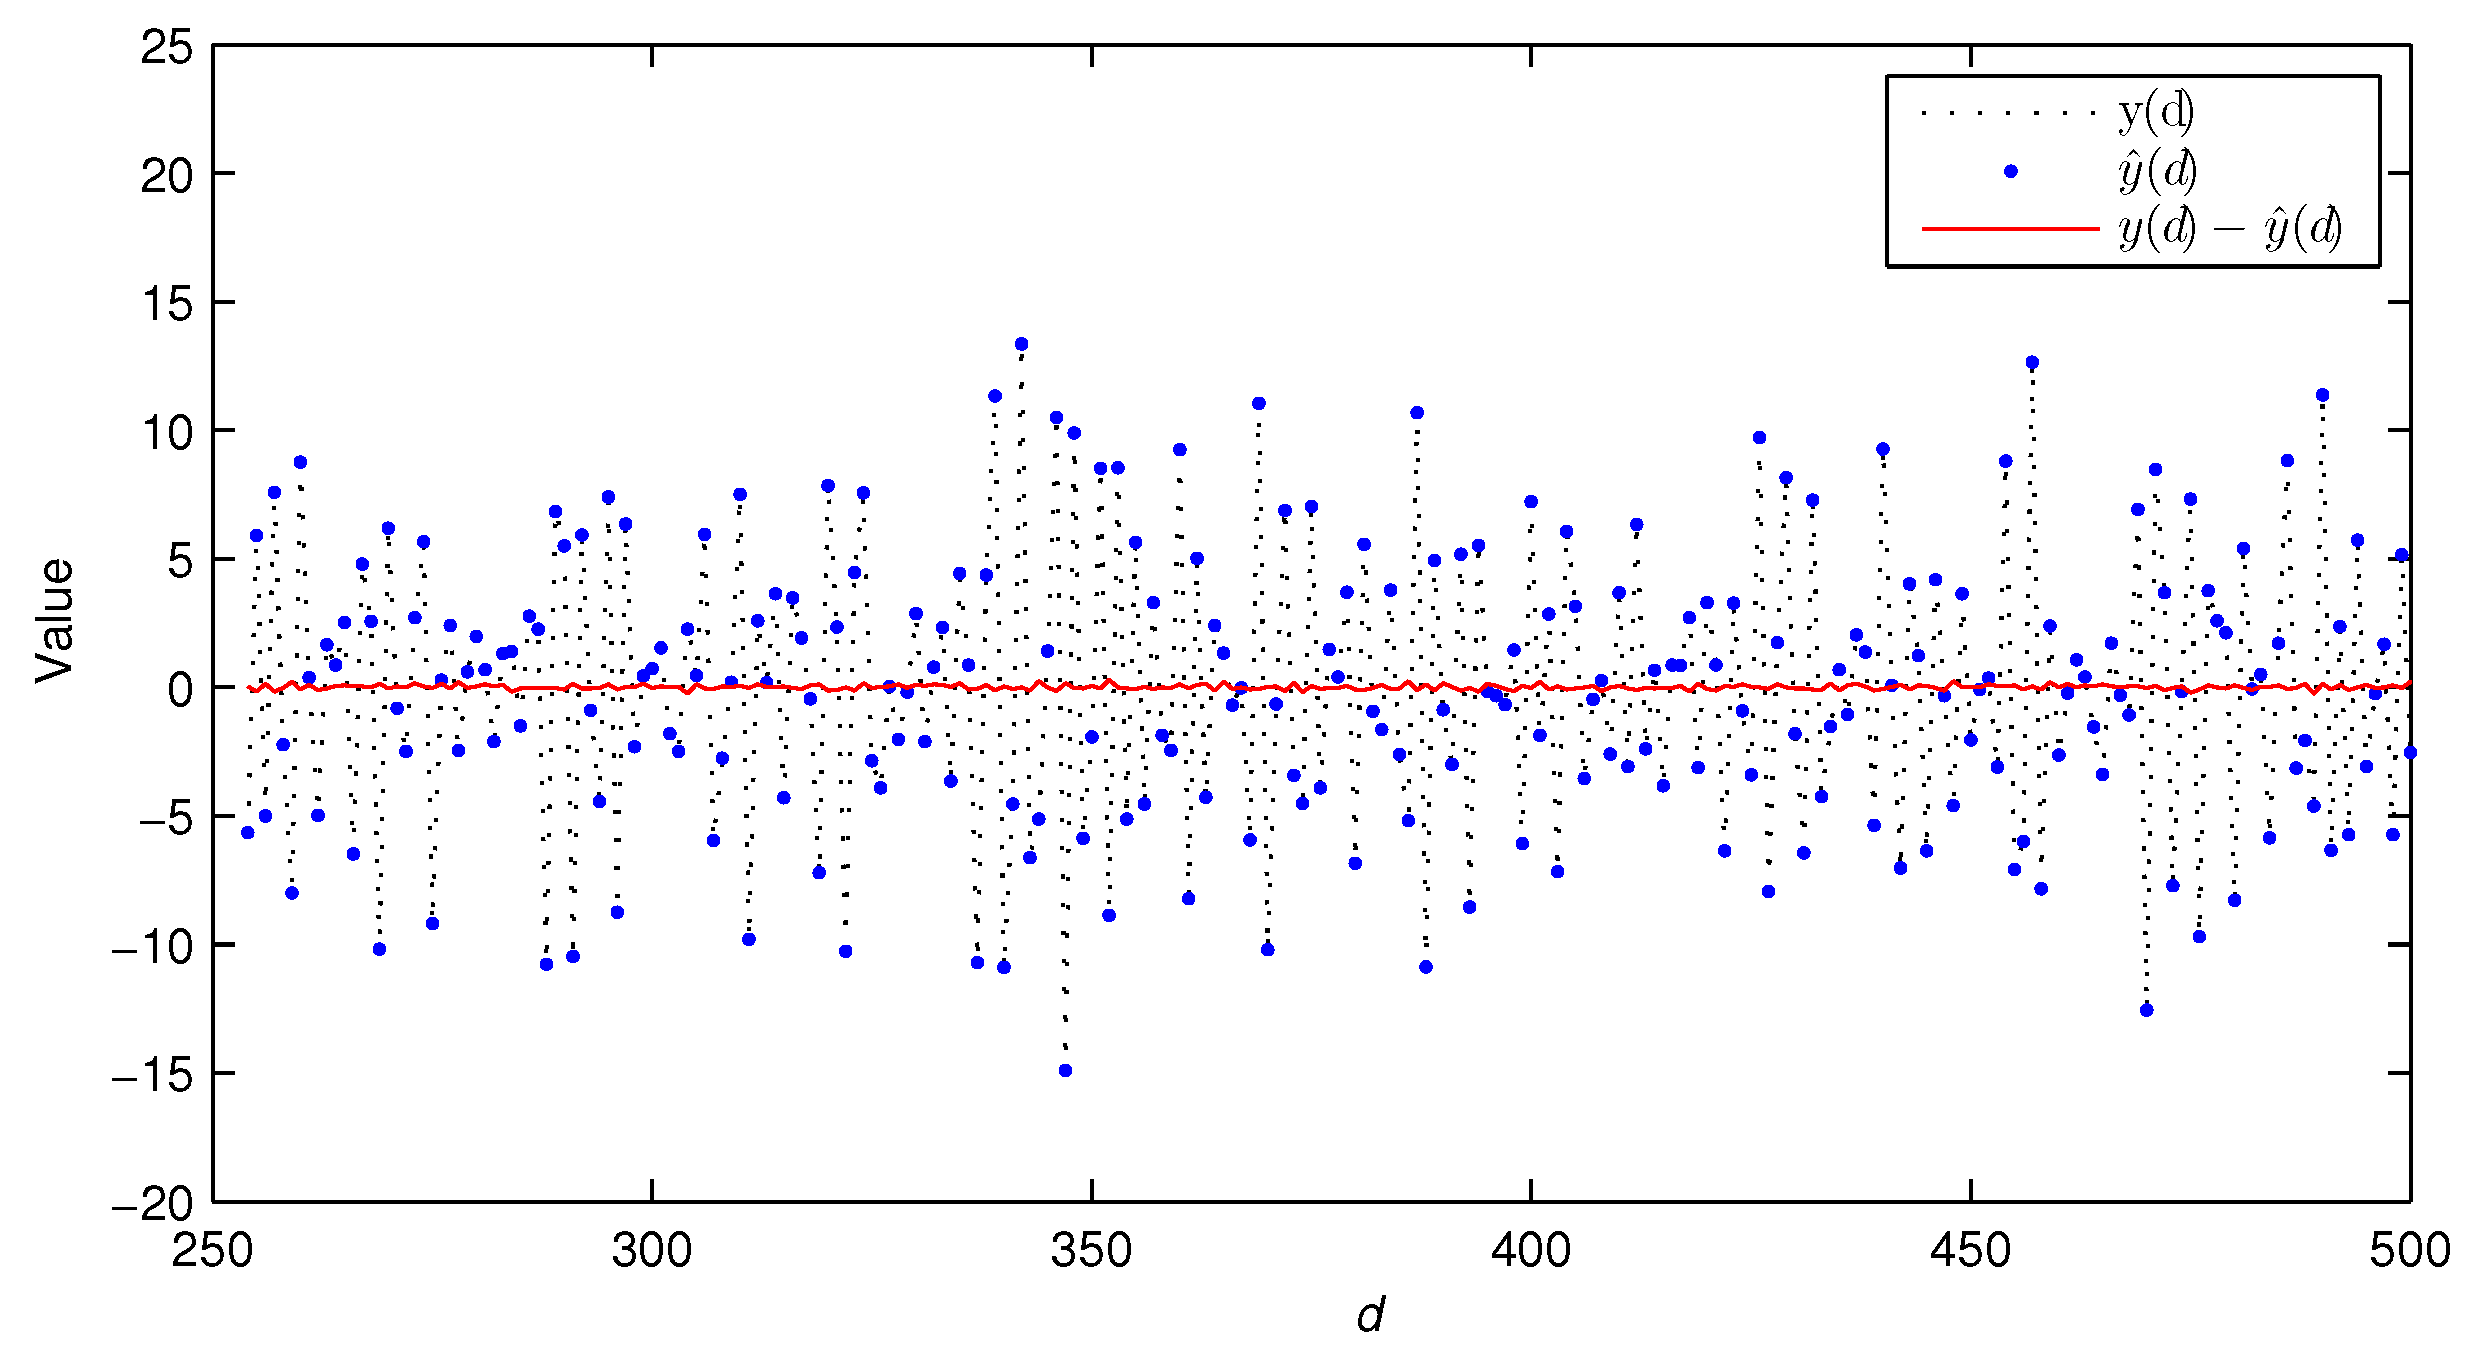
Figure 7.
The true outputs, estimated outputs, and their bias of Experiment 1 with .
Figure 7.
The true outputs, estimated outputs, and their bias of Experiment 1 with .
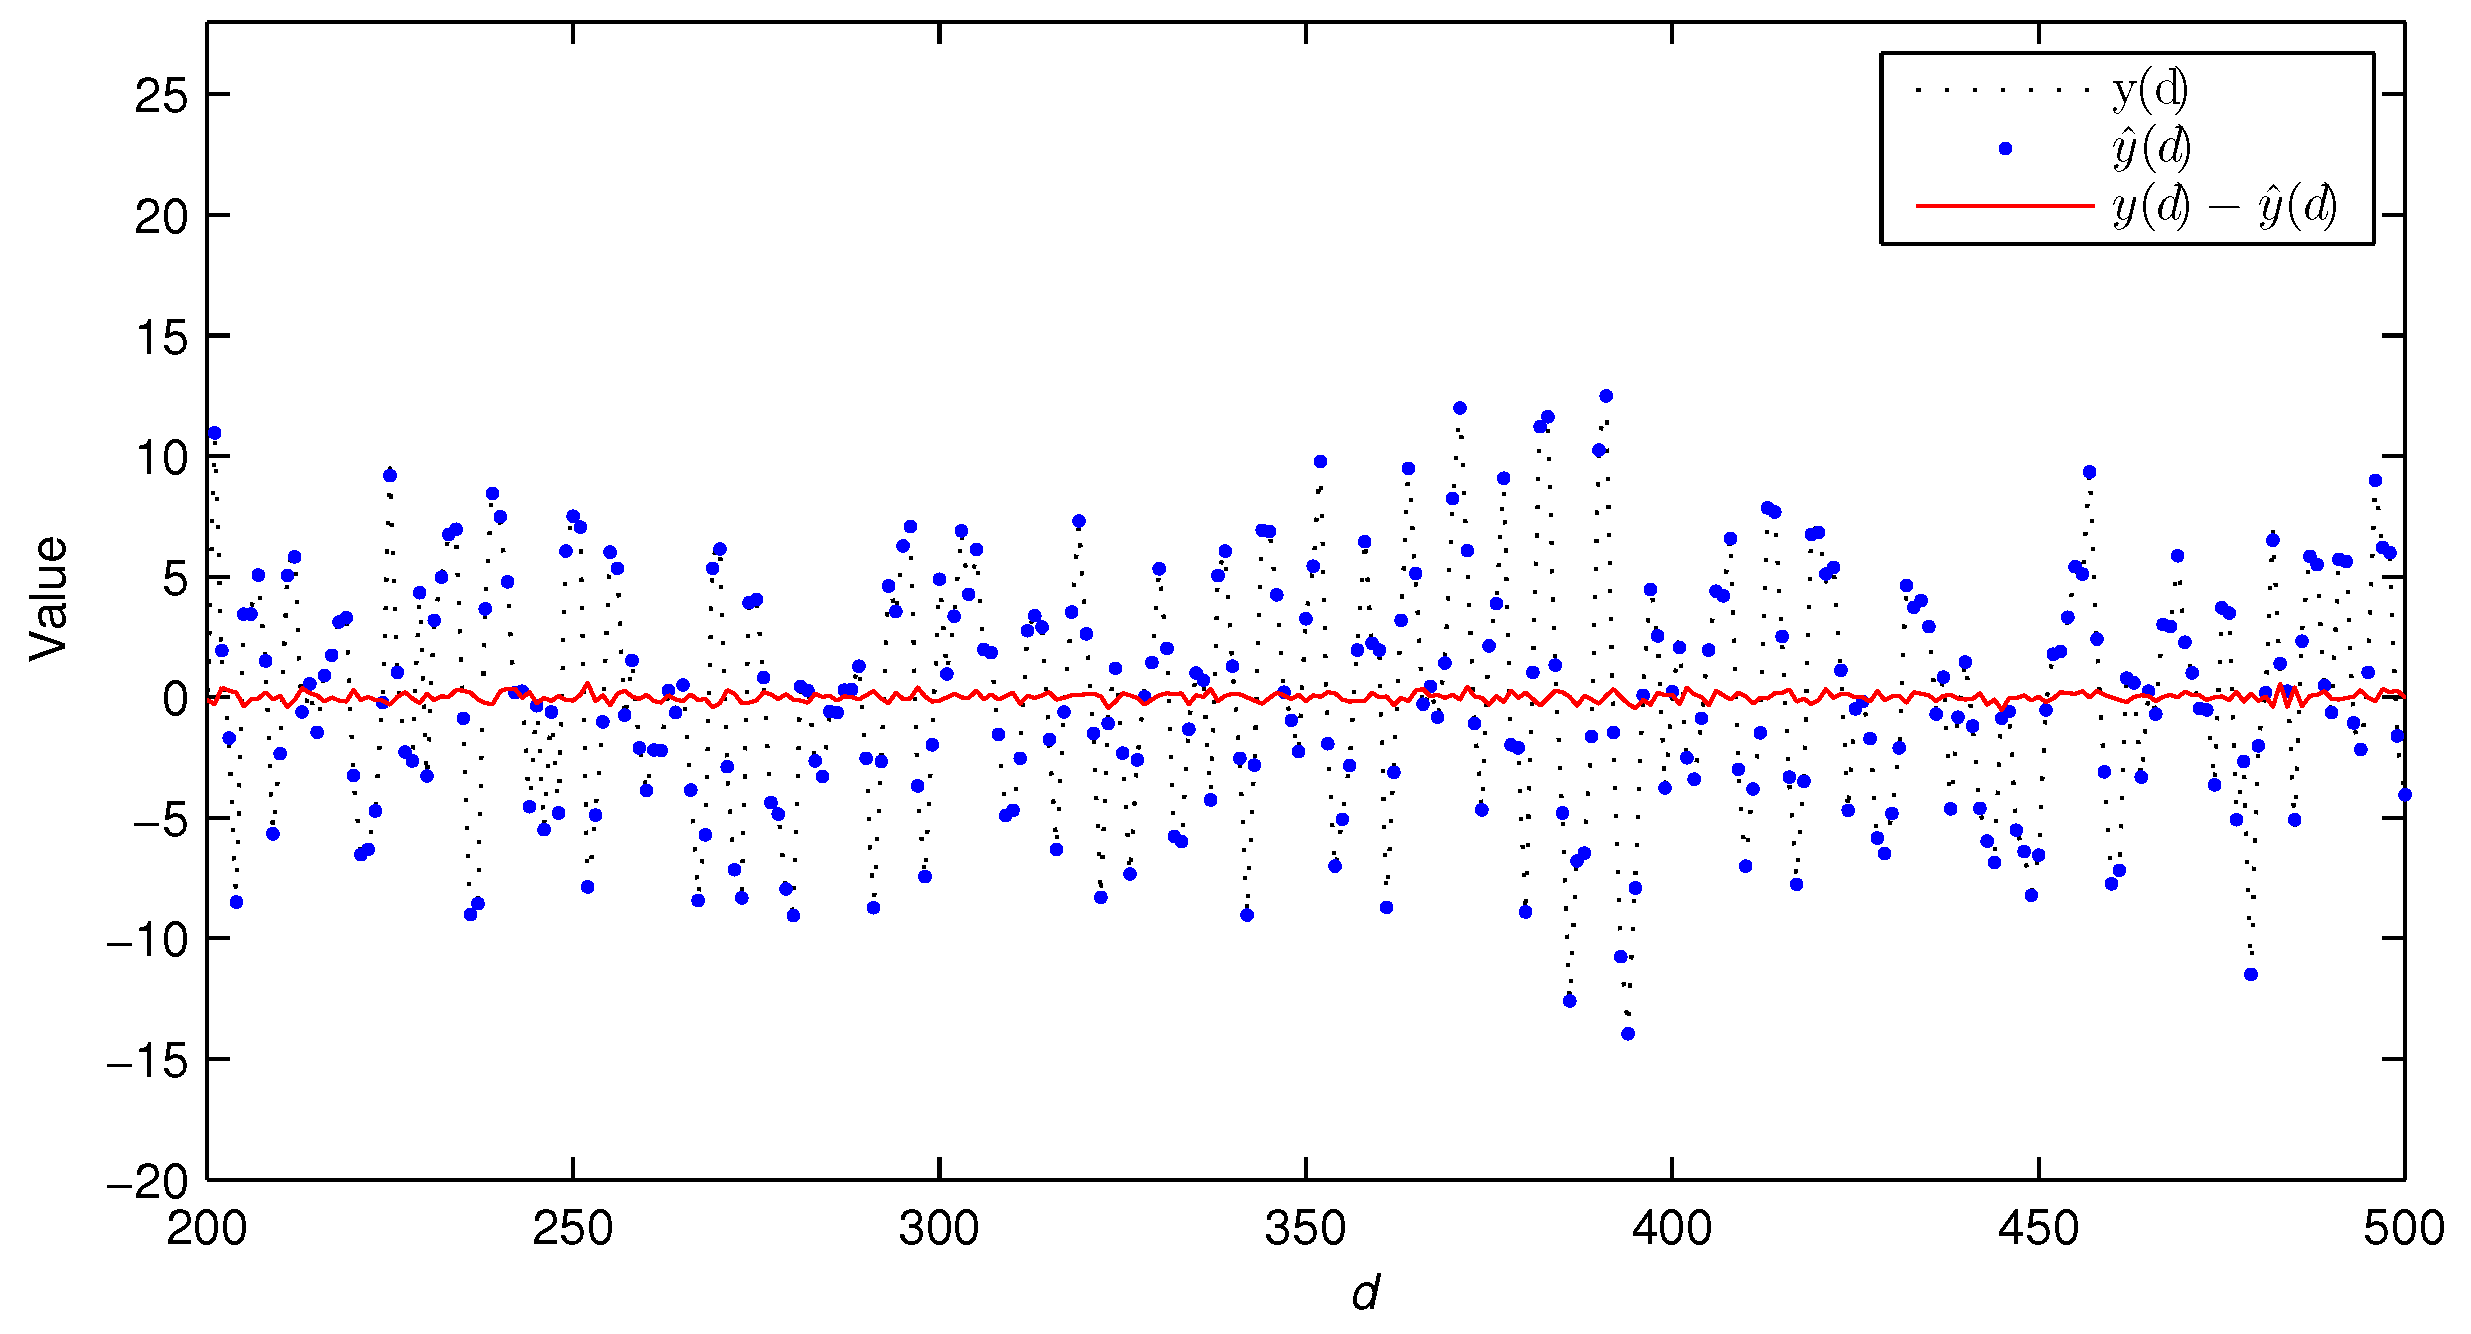
Figure 8.
The true outputs, estimated outputs, and their bias of Experiment 1 with .
Figure 8.
The true outputs, estimated outputs, and their bias of Experiment 1 with .
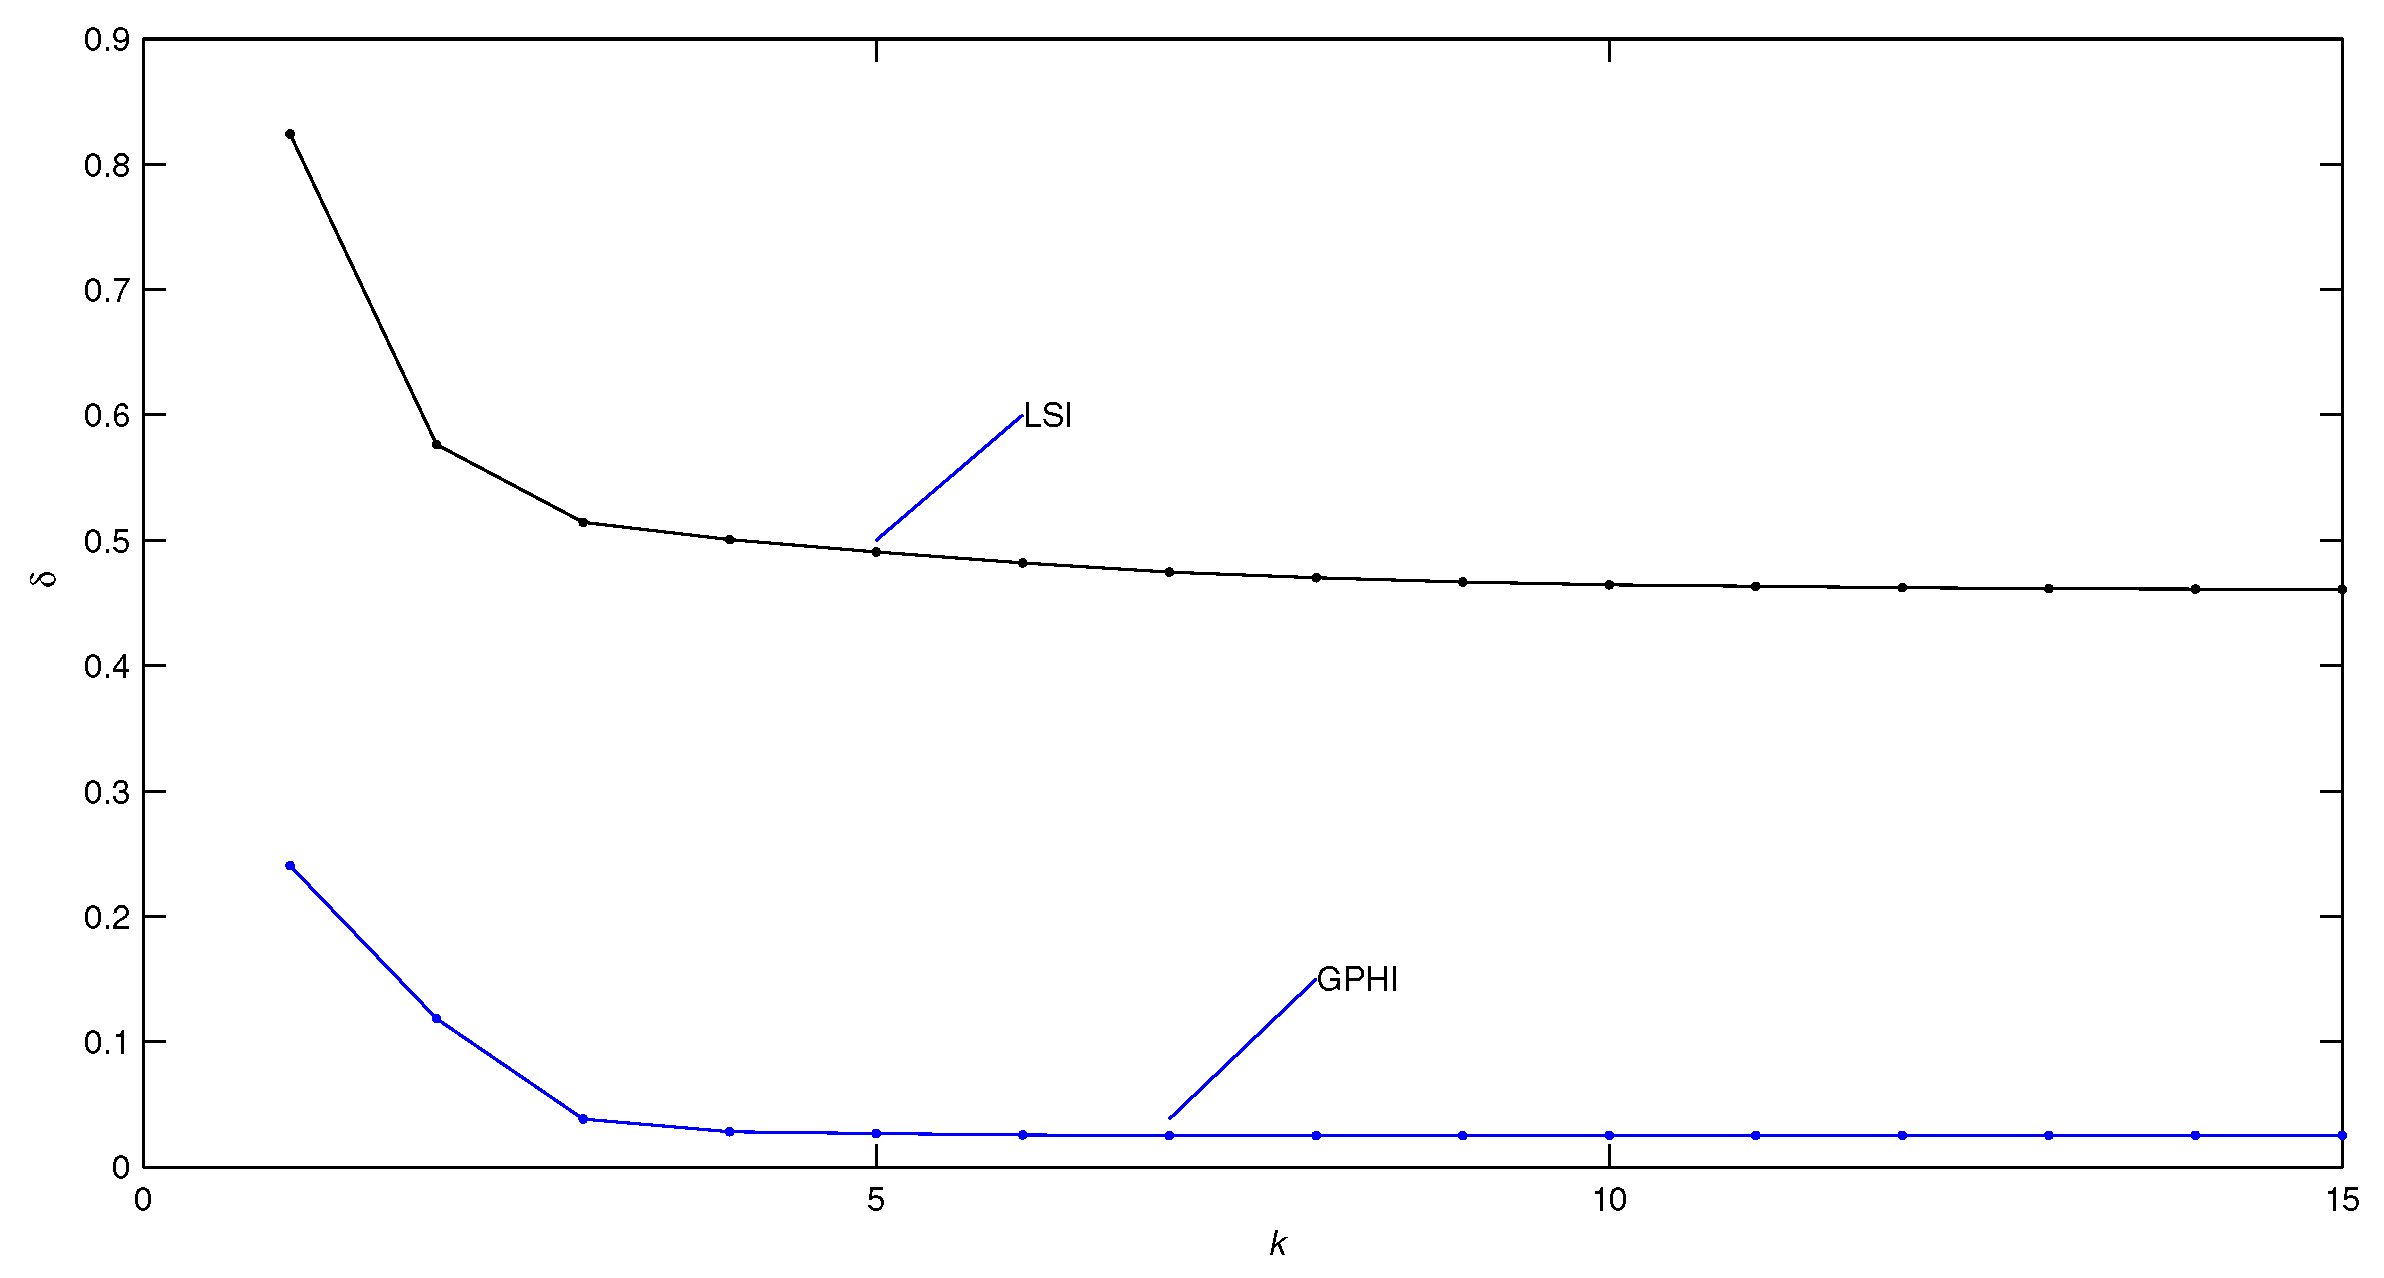
Figure 9.
The estimation errors of the LSI and GPHI algorithms versus k of Experiment 2 ().
Figure 9.
The estimation errors of the LSI and GPHI algorithms versus k of Experiment 2 ().
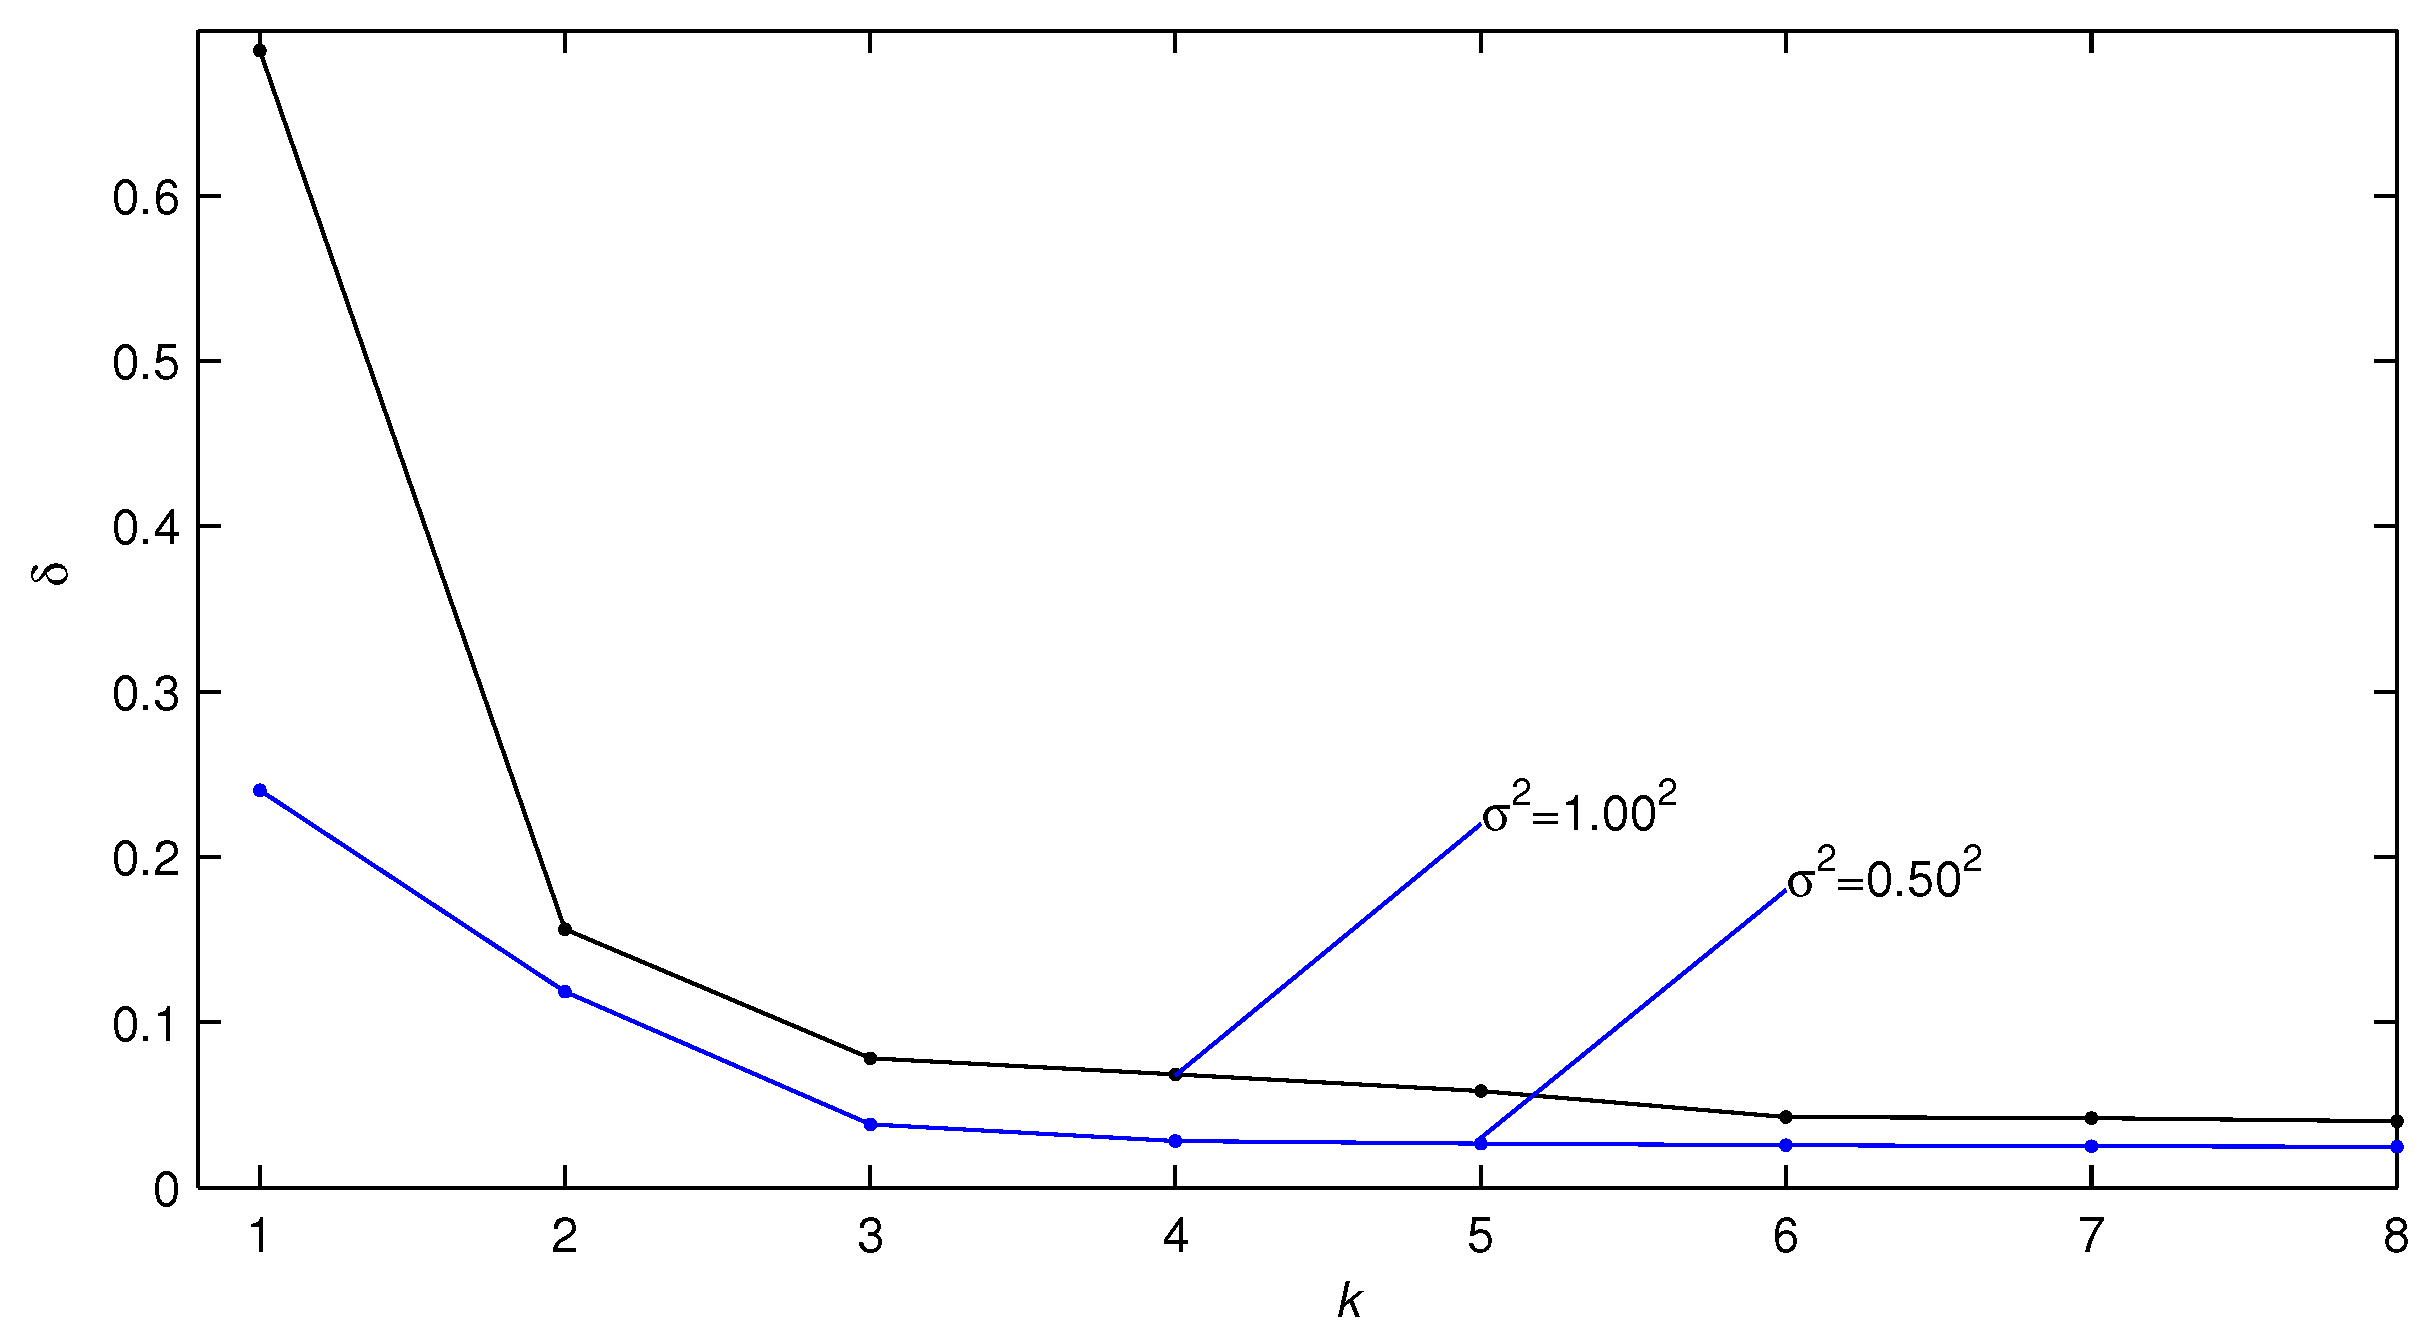
Figure 10.
The estimation errors versus k of Experiment 2 with and (, ).
Figure 10.
The estimation errors versus k of Experiment 2 with and (, ).
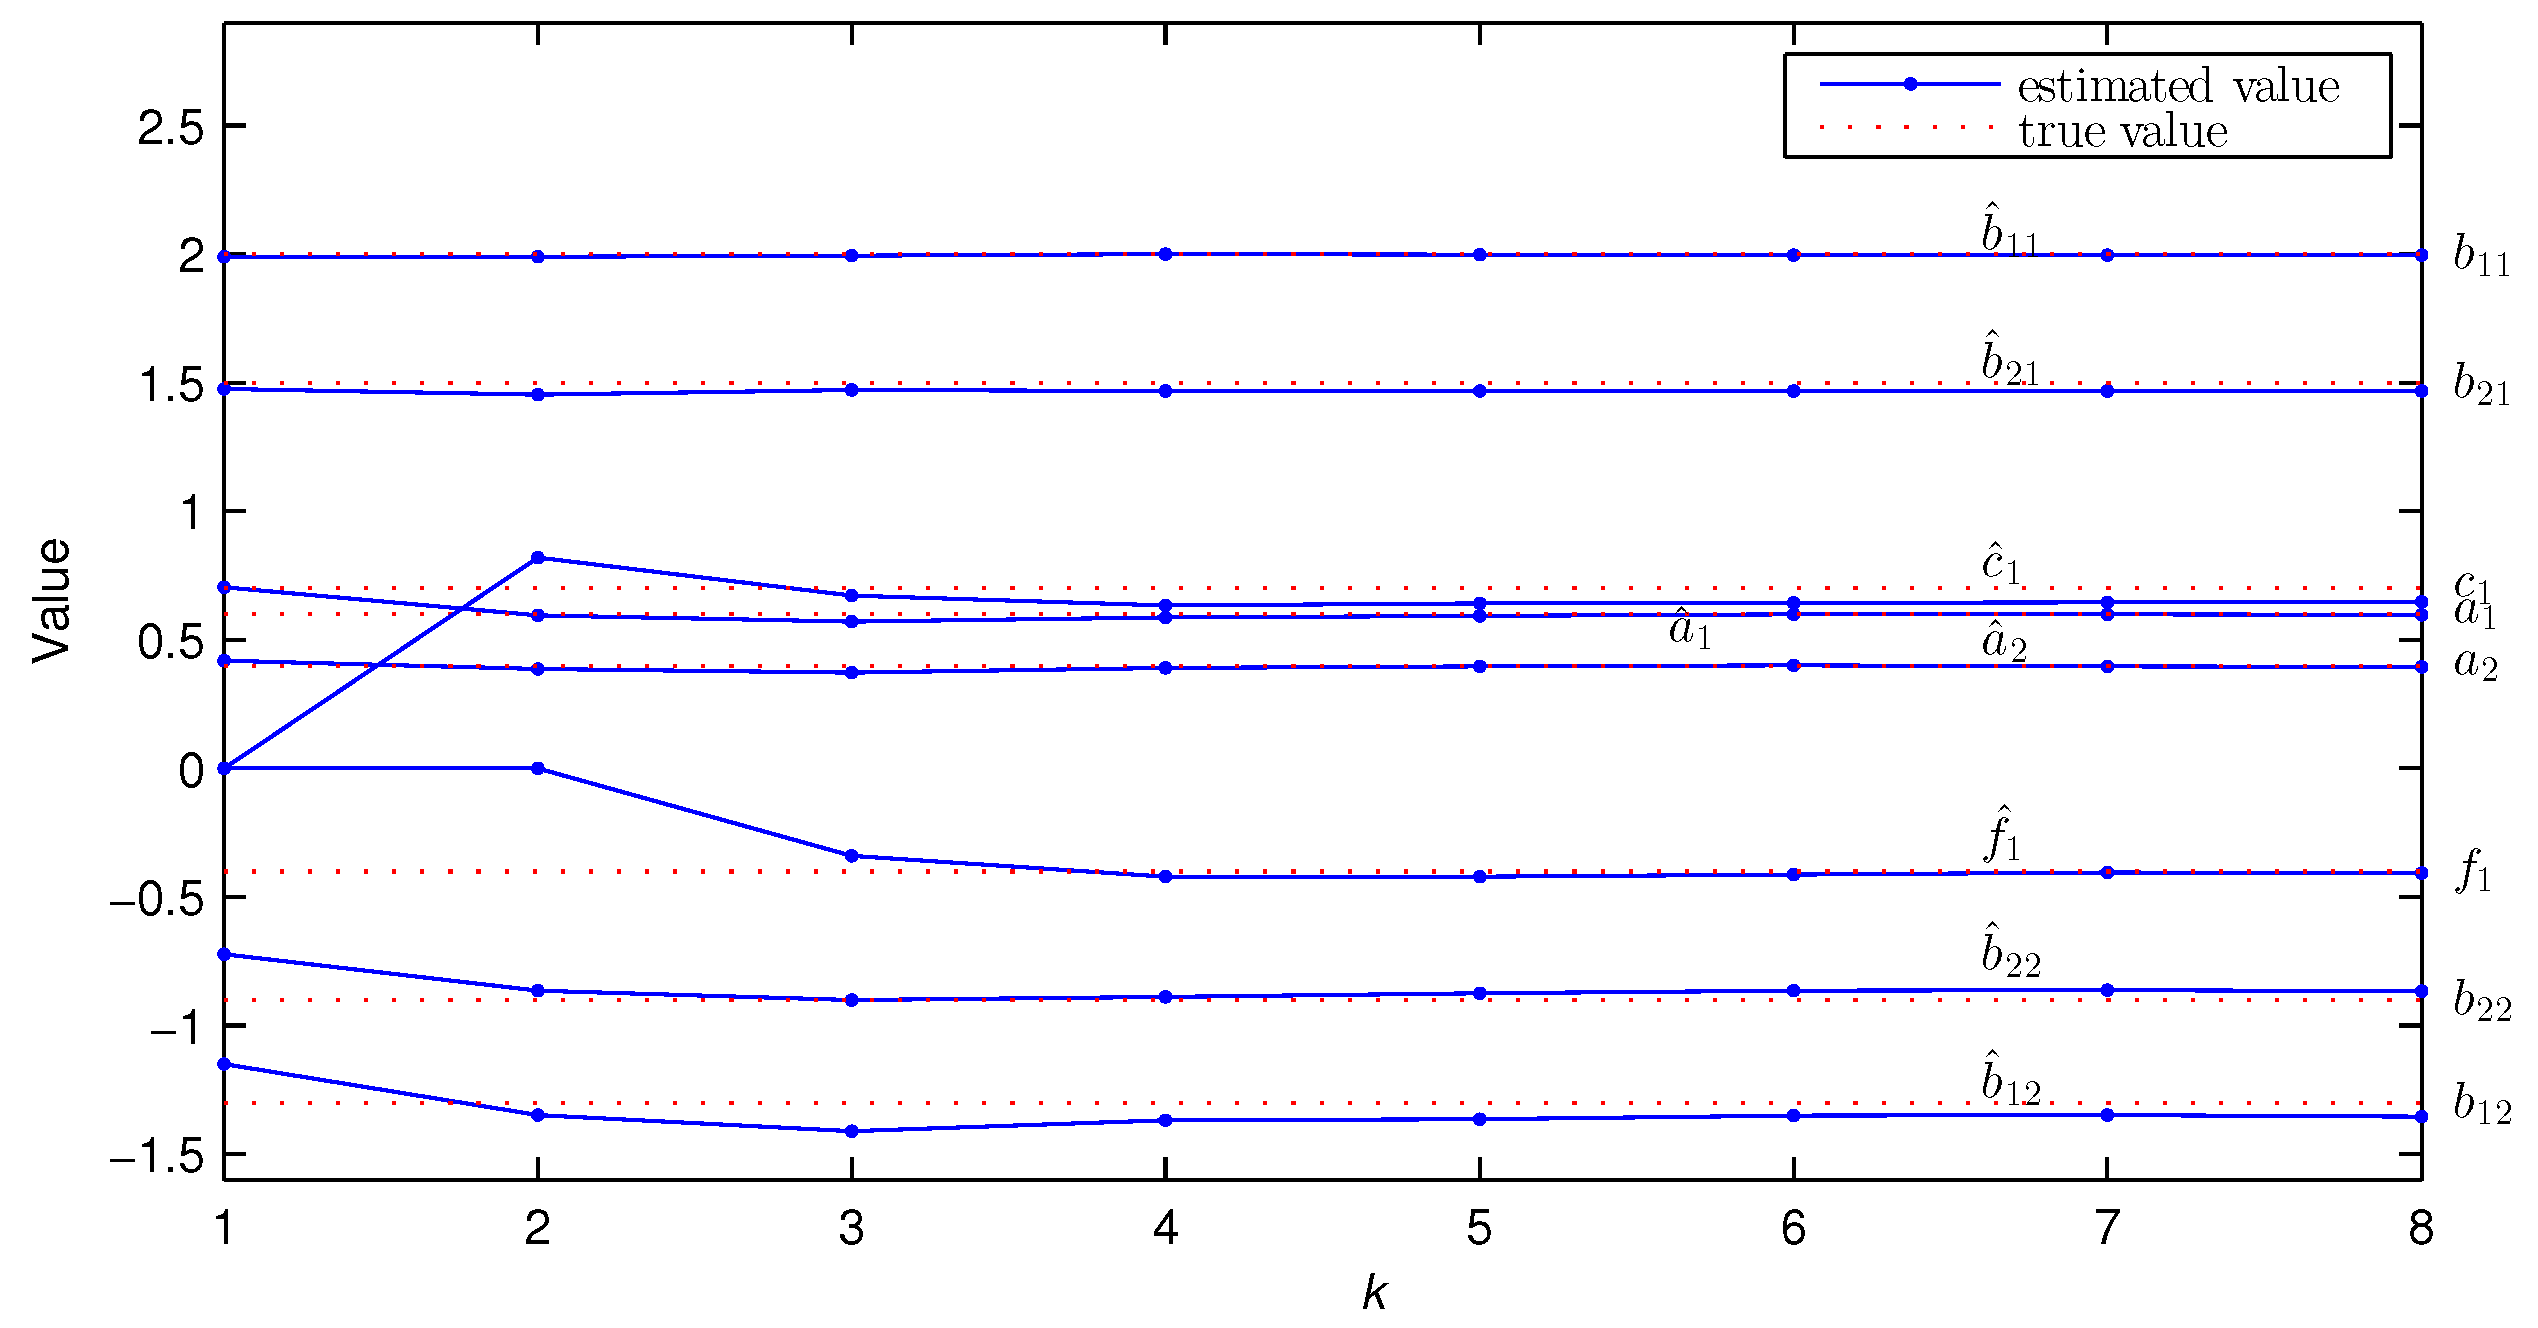
Figure 11.
The estimated parameter values versus k of Experiment 2 with and .
Figure 11.
The estimated parameter values versus k of Experiment 2 with and .
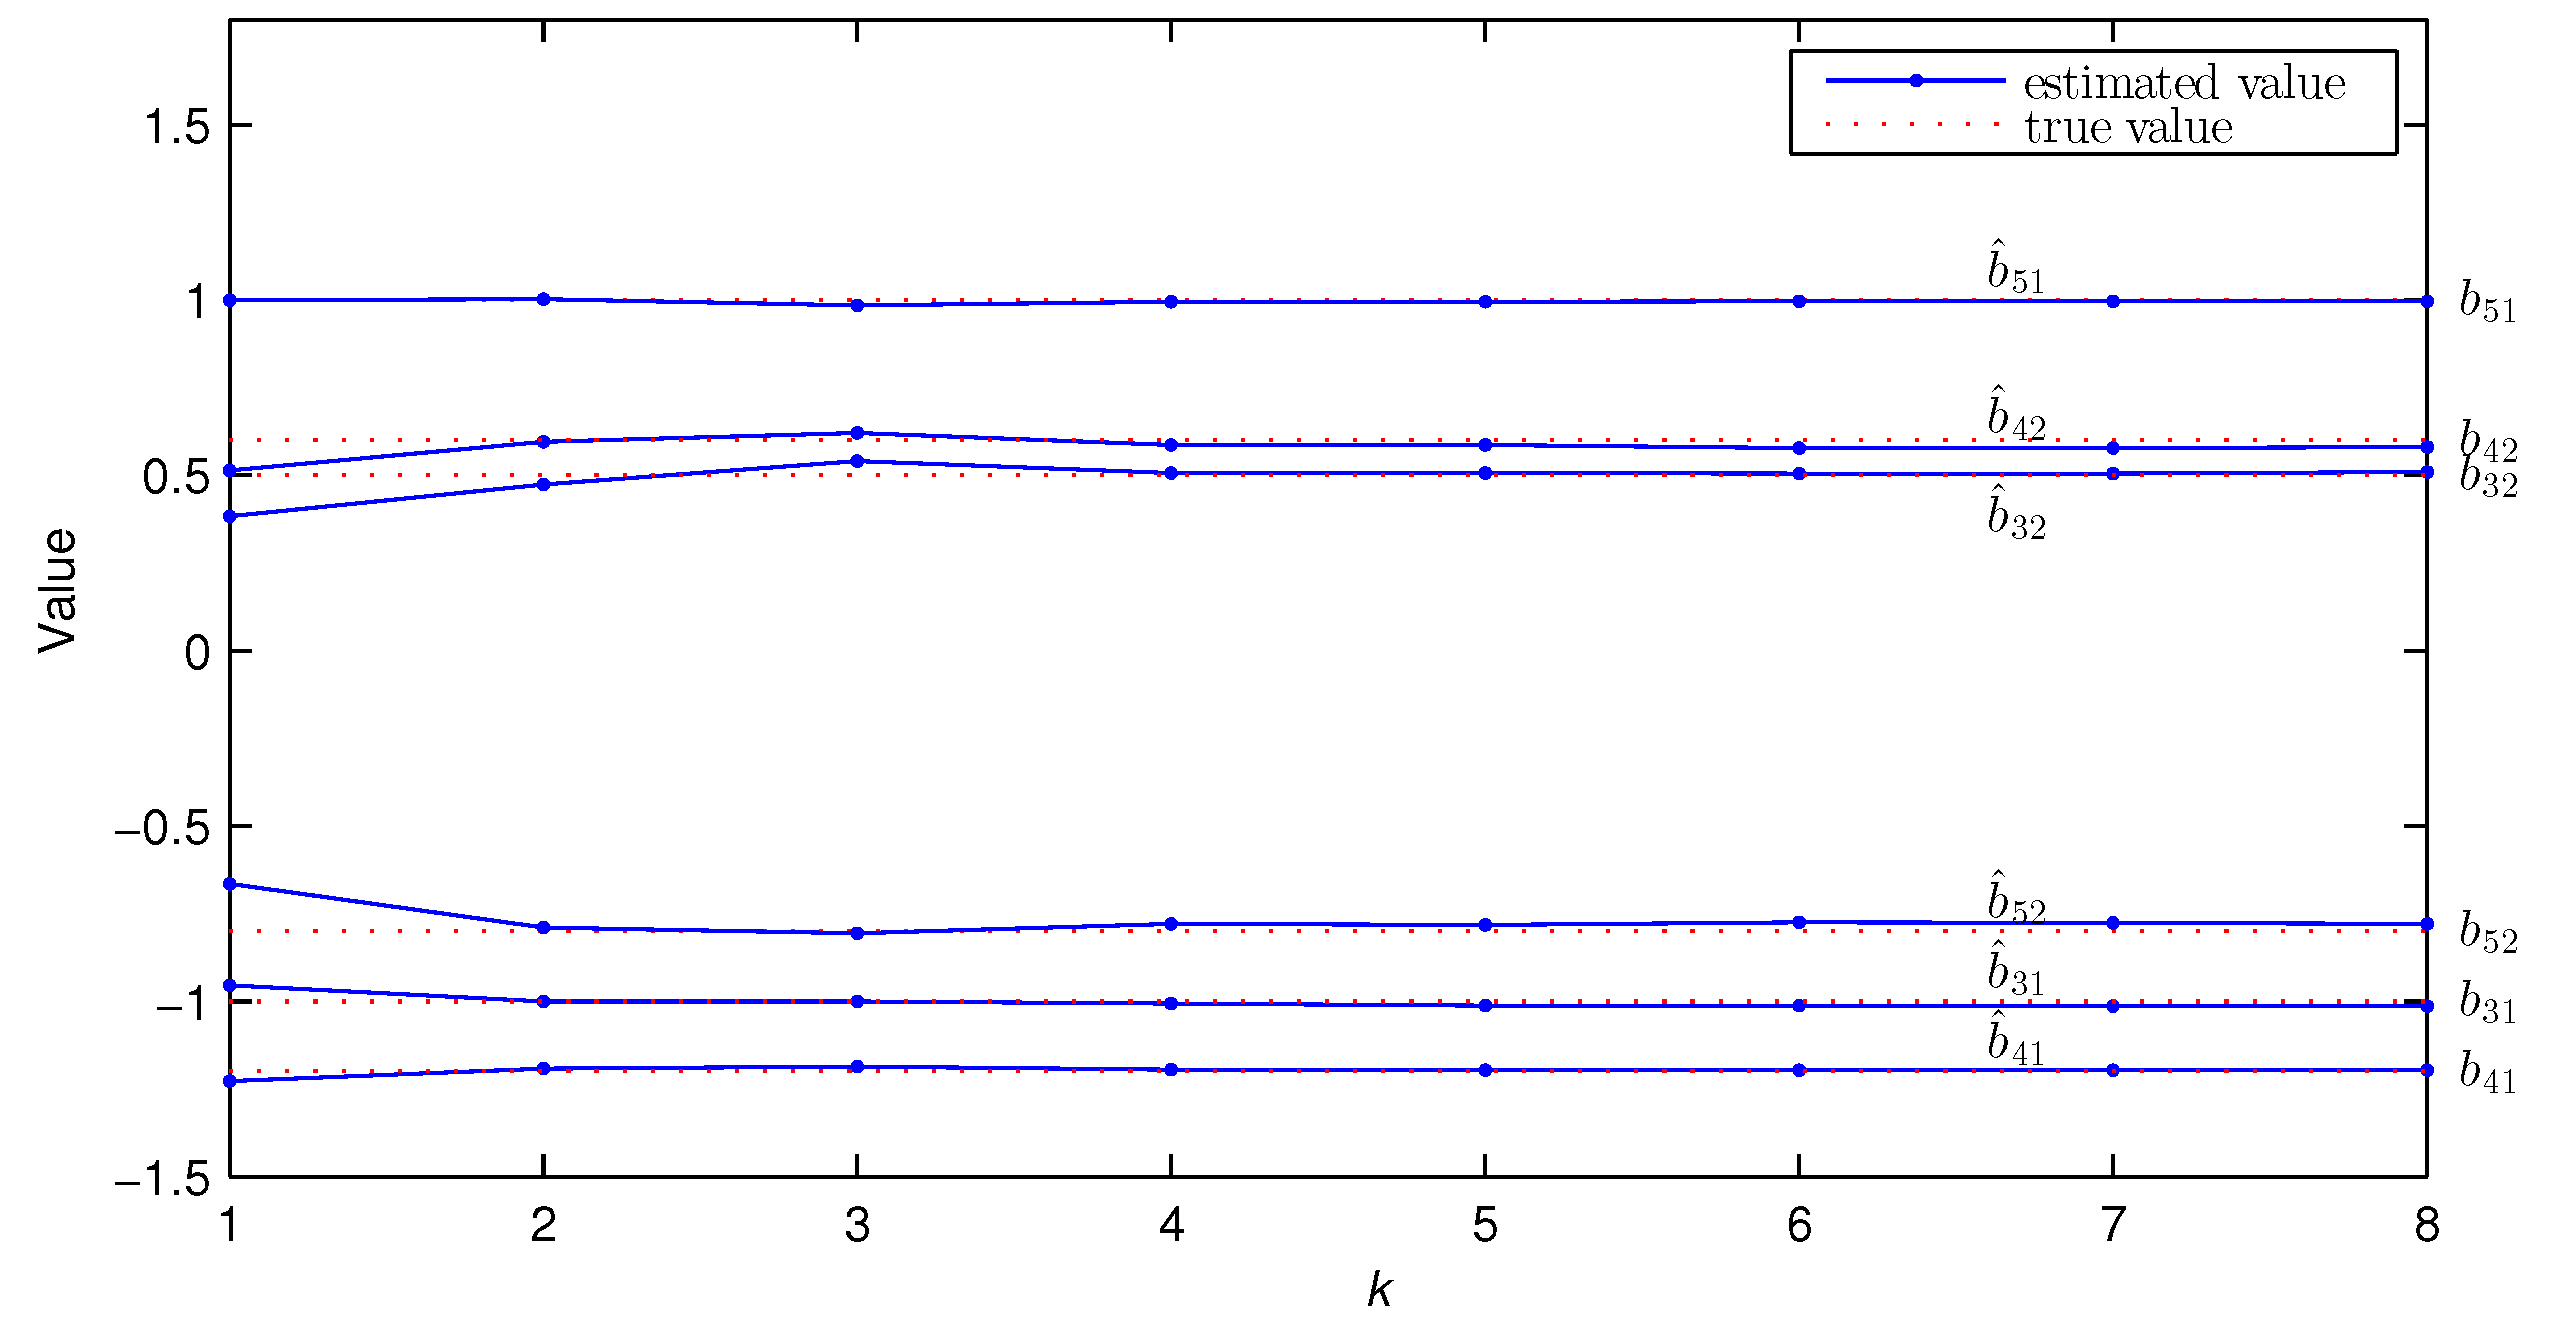
Figure 12.
The estimated parameter values versus k of Experiment 2 with and .
Figure 12.
The estimated parameter values versus k of Experiment 2 with and .
Figure 13.
The estimated parameter values versus k of Experiment 2 with and .
Figure 13.
The estimated parameter values versus k of Experiment 2 with and .
Figure 14.
The estimated parameter values versus k of Experiment 2 with and .
Figure 14.
The estimated parameter values versus k of Experiment 2 with and .
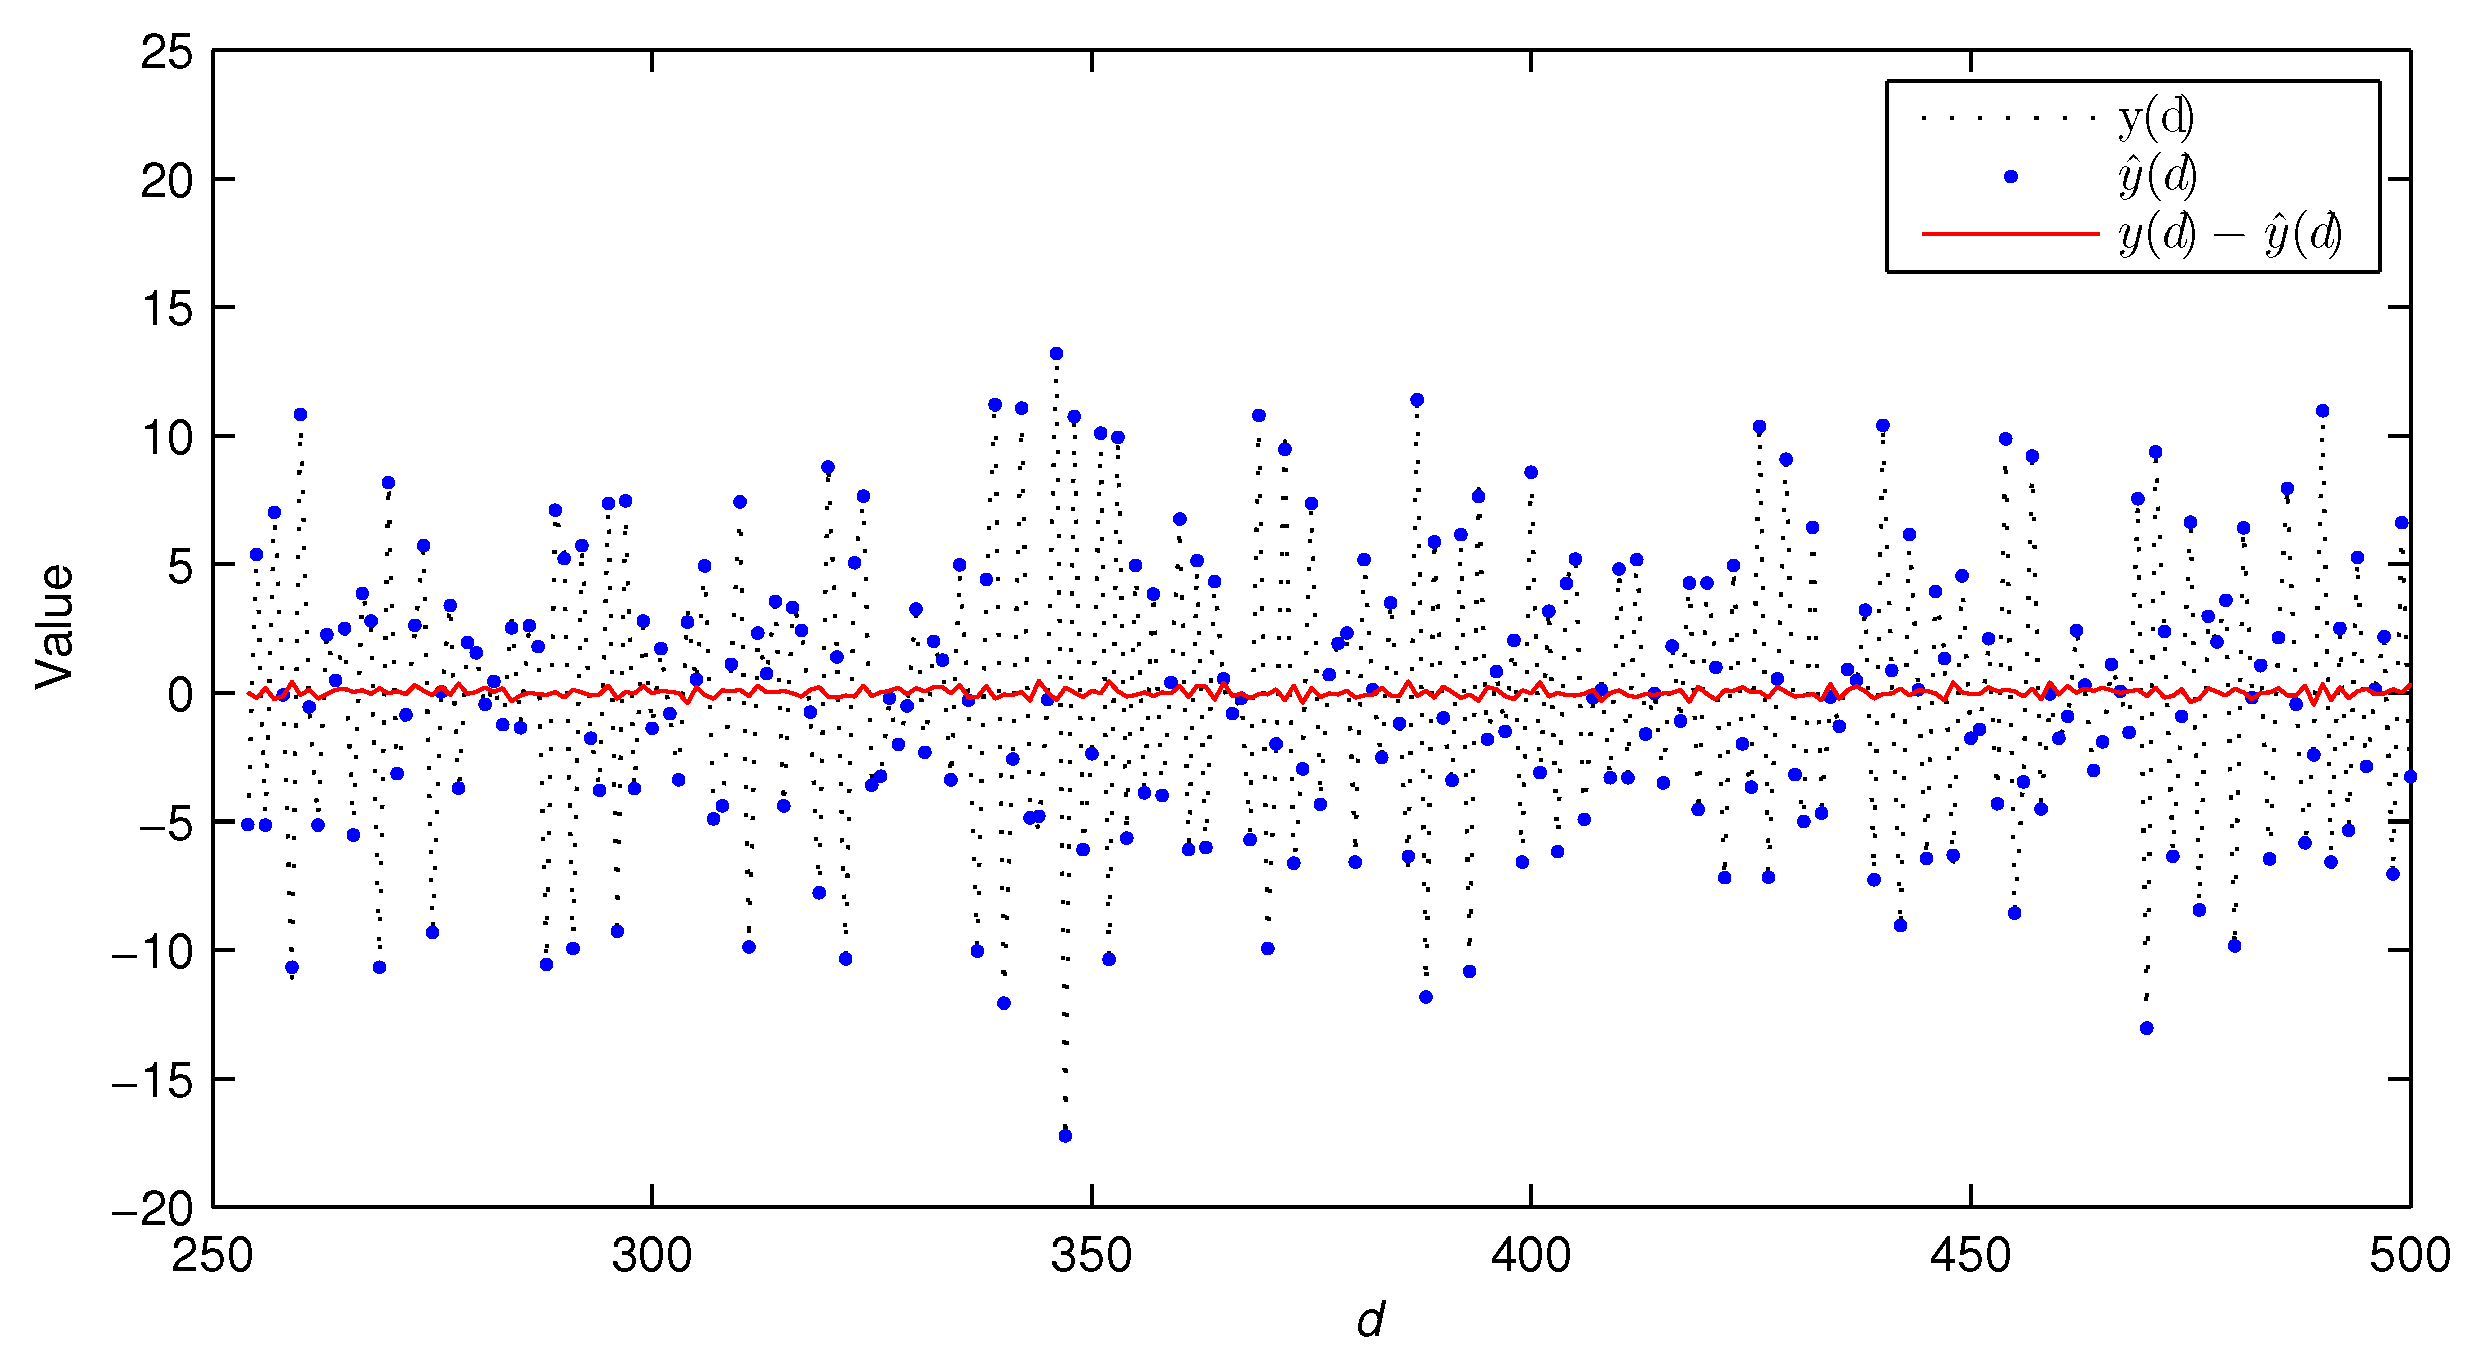
Figure 15.
The true outputs, estimated outputs, and their bias of Experiment 2 with .
Figure 15.
The true outputs, estimated outputs, and their bias of Experiment 2 with .
Figure 16.
The true outputs, estimated outputs, and their bias of Experiment 2 with .
Figure 16.
The true outputs, estimated outputs, and their bias of Experiment 2 with .
Table 1.
The estimated parameter values and estimation errors of Experiment 1 with (, ).
Table 1.
The estimated parameter values and estimation errors of Experiment 1 with (, ).
| k | | | | | | | | | | | % |
|---|
| 1 | −0.7107 | 0.5090 | 1.9694 | −1.0090 | −1.8753 | −1.0219 | 1.0790 | 0.5366 | 0.0000 | 0.0000 | 27.7831 |
| 2 | −0.8717 | 0.6218 | 1.9681 | −1.3473 | −1.8160 | −0.7010 | 1.0268 | 0.3843 | 0.9248 | 0.0000 | 15.8395 |
| 3 | −0.7982 | 0.5895 | 1.9816 | −1.1991 | −1.7996 | −0.8780 | 1.0396 | 0.4889 | 0.8053 | 0.0000 | 12.1355 |
| 5 | −0.8052 | 0.5905 | 1.9772 | −1.2174 | −1.7890 | −0.8756 | 1.0339 | 0.4876 | 0.7704 | −0.2763 | 3.9074 |
| 8 | −0.7905 | 0.5818 | 1.9615 | −1.1770 | −1.7950 | −0.9001 | 1.0299 | 0.4972 | 0.7374 | −0.4265 | 2.5213 |
| 1 | −0.5319 | 0.3512 | 1.9279 | −0.6311 | −1.9520 | −1.3414 | 1.1347 | 0.6812 | 0.0000 | 0.0000 | 40.4417 |
| 2 | −1.1028 | 0.6513 | 1.9611 | −1.7779 | −1.8306 | −0.1742 | 1.0516 | 0.0000 | 1.1758 | 0.0000 | 42.0247 |
| 3 | −0.7517 | 0.6354 | 1.9523 | −1.1405 | −1.8269 | −0.9556 | 1.1100 | 0.5334 | 0.6873 | 0.0000 | 16.0285 |
| 5 | −0.8796 | 0.6296 | 1.9260 | −1.3454 | −1.8156 | −0.7463 | 1.0452 | 0.4368 | 0.9477 | 0.0000 | 17.9049 |
| 8 | −0.8218 | 0.5847 | 1.9238 | −1.2333 | −1.7917 | −0.8439 | 1.0565 | 0.4663 | 0.7521 | −0.4519 | 4.0108 |
| True values | −0.8000 | 0.6000 | 2.0000 | −1.2000 | −1.8000 | −0.9000 | 1.0000 | 0.5000 | 0.8000 | −0.4000 | |
Table 2.
The estimation errors with different L and .
Table 2.
The estimation errors with different L and .
| Sampled Data Length L | 400 | 500 | 600 | 700 | 800 | 1000 |
|---|
| Estimation error | 2.3931 | 2.591 | 2.0535 | 1.6165 | 1.9868 | 2.2789 |
| Estimation error | 6.1781 | 5.9393 | 4.1059 | 4.3916 | 3.6913 | 4.5132 |
Table 3.
The locations of the estimated key non-zero parameters of Experiment 1 with and .
Table 3.
The locations of the estimated key non-zero parameters of Experiment 1 with and .
| Parameter | | | | | | | | | | |
|---|
| Location | 1 | 2 | 9 | 10 | 48 | 49 | 83 | 84 | 93 | 94 |
Table 4.
The estimated parameter values of parameter and errors of Experiment 2 with (, ).
Table 4.
The estimated parameter values of parameter and errors of Experiment 2 with (, ).
| k | | | | | | | | | | | | | | | % |
|---|
| 1 | 0.7043 | 0.4193 | 1.9900 | −1.1505 | 1.4756 | −0.7222 | −0.9542 | 0.3833 | −1.2275 | 0.5137 | 0.9985 | −0.6643 | 0.0000 | 0.0000 | 24.0379 |
| 2 | 0.5958 | 0.3868 | 1.9909 | −1.3471 | 1.4534 | −0.8632 | −0.9999 | 0.4732 | −1.1926 | 0.5949 | 1.0018 | −0.7892 | 0.8209 | 0.0000 | 11.8417 |
| 3 | 0.5702 | 0.3731 | 1.9940 | −1.4102 | 1.4709 | −0.9009 | −1.0007 | 0.5398 | −1.1864 | 0.6208 | 0.9846 | −0.8065 | 0.6720 | −0.3408 | 3.8284 |
| 5 | 0.5937 | 0.3974 | 1.9985 | −1.3644 | 1.4680 | −0.8740 | −1.0119 | 0.5066 | −1.1964 | 0.5860 | 0.9948 | −0.7824 | 0.6427 | −0.4213 | 2.6627 |
| 8 | 0.5971 | 0.3944 | 1.9958 | −1.3538 | 1.4675 | −0.8662 | −1.0131 | 0.5092 | −1.1959 | 0.5802 | 0.9964 | −0.7793 | 0.6478 | −0.4059 | 2.4836 |
| 1 | 1.1487 | 0.5378 | 1.9923 | −0.3923 | 1.5176 | 0.0000 | −0.9743 | 0.0000 | −1.1962 | 0.0000 | 0.9823 | 0.0000 | 0.0000 | 0.0000 | 68.7931 |
| 2 | 0.6610 | 0.3569 | 1.9489 | −1.2599 | 1.4150 | −0.7717 | −1.0095 | 0.3747 | −1.2543 | 0.5356 | 0.9832 | −0.7020 | 0.7977 | 0.0000 | 15.6424 |
| 3 | 0.5342 | 0.3111 | 1.9775 | −1.5040 | 1.4303 | −0.9078 | −0.9906 | 0.5777 | −1.1896 | 0.6985 | 1.0027 | −0.8310 | 0.7349 | −0.2909 | 7.8178 |
| 5 | 0.5616 | 0.3767 | 2.0078 | −1.4832 | 1.4422 | −0.9073 | −1.0159 | 0.5403 | −1.2081 | 0.6244 | 0.9810 | −0.8144 | 0.6377 | −0.4610 | 5.8361 |
| 8 | 0.6041 | 0.3931 | 1.9989 | −1.3938 | 1.4410 | −0.8344 | −1.0317 | 0.5114 | −1.2076 | 0.5711 | 0.9894 | −0.7675 | 0.6391 | −0.4123 | 4.0277 |
| True values | 0.6000 | 0.4000 | 2.0000 | −1.3000 | 1.5000 | −0.9000 | −1.0000 | 0.5000 | −1.2000 | 0.6000 | 1.0000 | −0.8000 | 0.7000 | −0.4000 | |
Table 5.
The parameter estimation errors with different L and .
Table 5.
The parameter estimation errors with different L and .
| Sampled Data Length L | 300 | 400 | 500 | 600 | 700 | 800 | 1000 |
|---|
| Estimation error | 2.3844 | 1.7831 | 1.9832 | 2.5122 | 2.4627 | 2.388 | 1.8807 |
| Estimation error | 3.641 | 3.2164 | 4.055 | 4.7375 | 4.5741 | 4.1934 | 3.2887 |
Table 6.
The locations of the estimated key non-zero parameters of Experiment 2 with and .
Table 6.
The locations of the estimated key non-zero parameters of Experiment 2 with and .
| Parameter | | | | | | | | | | | | | | |
|---|
| Location | 1 | 2 | 12 | 13 | 76 | 77 | 118 | 119 | 183 | 184 | 220 | 221 | 253 | 254 |


