1. Introduction
Total plant volumetric sap flow (
Q) is the movement of fluid within xylem and is functionally correlated with transpiration, stem refilling and transport of solutes. In contrast, reference evapotranspiration (
ETo) is the transfer of water vapor from a land surface covered by a hypothetical grass with a uniform height of 0.12 m [
1,
2]. Despite the fundamental difference in definition between
Q and
ETo, there is a significant positive correlation between the variables (e.g., [
3,
4,
5,
6]).
Under certain assumptions, it has been hypothesised that
Q is not only positively correlated with
ETo, but it is equivalent. Pereira et al. [
7] proposed a model, hereafter called the
E2.88 model, where
Q, normalized per unit leaf area, is equivalent to
ETo, normalized per unit leaf area of a reference grass crop. The
E2.88 model has the form of
Q/
AL =
ETo/2.88 where
AL is total plant leaf area (m
2). The 2.88 constant is derived from leaf area index (LAI) of the hypothetical reference grass crop of height 0.12 m [
1,
7]. The assumptions of the
E2.88 model include non-limiting soil moisture and transpiration is conditioned by leaf area [
7]. The
E2.88 model has been explicitly tested in a limited number of studies with promising results [
7,
8,
9,
10]. Yet, if the generality of the
E2.88 model is demonstrated then it will prove valuable for plant–water relations, physiological comparisons, irrigation and water resource management because sap flow may be estimated, under non-limiting soil moisture, without the need for site specific calibrations.
Aside from the
E2.88 model,
Q is a commonly incorporated parameter in numerous models across many fields of application such as physiology, irrigation, hydrology, climatology, and others [
11,
12,
13]. As
Q occurs within xylem it is difficult to measure directly, and it is generally estimated indirectly via thermometric techniques. This approach involves the application of continuous heat or short duration heat pulses on, or within, the xylem and the conversion of temperature changes via empirical or theoretical equations [
14]. Extensive research has been undertaken over many decades to improve the accuracy of thermometric methods so that the sap flow results produced by one method are significantly correlated with another method [
15]. Consistency in results produced by different sap flow methods is critically important for the correct interpretation of results across studies, experiments and models, as well as the validity of large scale, global data sets [
16]. Therefore, the inclusion of different sap flow methods in a model, such as the
E2.88 model, should yield a consistent interpretation of results.
The heat pulse family of methods are a popular thermometric approach to estimate
Q [
15]. Heat pulse methods are based on the physical theory of heat conduction and convection in porous media [
17]. Examples of heat pulse methods include the heat ratio method (HRM), Tmax method, and dual method approach [
17,
18,
19,
20]. Following the application of a short duration (i.e., <3 s) heat pulse, the HRM measures the ratio of the temperature change downstream versus upstream of the heat source [
17,
19], whereas the Tmax method measures the time to the maximum temperature increase downstream of the heat source [
18]. Forster [
21] experimentally demonstrated that the HRM and Tmax are limited to slow and fast heat velocities, respectively. The dual method approach (DMA) theoretically combines slow and fast heat pulse methods to describe the entire observable measurement range of heat velocity in xylem [
20]. As the HRM and Tmax methods are biased towards under- and overestimating sap flow, respectively, their inclusion in a model, without consideration of the alternative sap flow methods, may lead to varying interpretations of the results. Therefore, given the importance of consistency produced by various sap flow methods, this study explored the null hypothesis that there would be no difference in results generated via different sap flow methods in the
E2.88 model.
The primary aim of this study was to test the hypothesis that Q is equivalent to ETo when both parameters are normalized by leaf area (i.e., the E2.88 model). This study also explored the hypothesis that the interpretation of results was consistent across three heat pulse sap flow methods. To broaden the scope of the study, a compilation of data from the broader literature was included that incorporated a larger sample size of measured plant species and sap flow methods.
2. Material and Methods
2.1. Study Species and Site Descriptions
Three species were measured in this study:
Pyrus communis L. (var. Beurre Bosc Pear),
Syzygium floribundum F.Muell. (Weeping Lilly Pilly), and
Syzygium paniculatum Gaertn. (Lilly Pilly).
Table 1 summarises tree characteristics including average height, leaf area, diameter, and sapwood radius.
P. communis were mature ~5 m tall trees, 15 years of age, growing in an established orchard in the Gruyere, Yarra Valley, Victoria, Australia (37.73° S, 145.45° E). The site elevation was ~90 m a.s.l., consisting of low rises and swales, with mean maximum/minimum annual temperature of 20.5/7.4 °C and mean annual rainfall 732 mm. The soils comprised of a silty clay or clay loam to a depth of approximately 300 to 500 mm below which there was a gradation to a semi-impermeable sub-soil layer. Soil moisture was maintained at a high level (>−100 kPa) with frequent irrigation and was monitored with TEROS 21 soil water potential sensors (METER Group, Pullman, WA, USA), installed at 0.2 m and 0.4 m depth. Across the growing season and measurement campaign, irrigation occurred every two to three days via a drip irrigation system, dripper spacing of 2.5 m, delivery rate of 8 L h−1 over a 6-h period. Two sites were randomly chosen across the orchard and three and two trees, within a radius of 10 m, were randomly selected at site 1 and site 2, respectively, for sap flow instrumentation. Sap flow sensors (see details below) were installed in early November, 2019 and removed in mid-June, 2020. For this study, a 35-day period between mid-December 2019 and mid-January 2020 was selected for analysis because tree growth and canopy development had reached a seasonal maximum and there was no change in leaf area.
The S. floribundum and S. paniculatum were potted saplings, purchased locally from a commercial supplier, grown in an open common garden in Melbourne, Victoria (37.99° S, 145.03° E). The site elevation was approximately 10 m a.s.l., with mean air temperature, during the measurement campaign, of 18.4 °C and a maximum/minimum of 43.5/7.6 °C. The soil volume of the pots was 15 L and the soil was a standard potting mixture of 2:1:1 pine bark, peat, and sand. Soil moisture was maintained at a high level through the application of 5 L of irrigation, per pot, every two days. Sap flow sensors were installed on S. paniculatum in mid-January, 2020, for a 28-day measurement period, and S. floribundum in mid-March, 2020, for a 34-day measurement period. The length of the measurement period was chosen because there was minimal trunk and canopy development and no change in leaf area.
2.2. Reference Grass Crop Evapotranspiration Measurements
An assessment of the accuracy and performance of
ETo methods was beyond the scope of this study and it has been conducted in numerous reviews (e.g., [
2,
22,
23]). Instead, the FAO-56 Penman–Monteith method was used because it is considered a standard method to estimate
ETo [
1,
2,
23] and was the most widely used model from the data compilation. The following Penman–Monteith model was applied in this study [
1,
7]:
where Δ is the slope of the saturation vapour pressure curve at ambient air temperature (kPa °C
−1),
Rn is daily net radiation (MJ m
−2 day
−1), γ is the psychometric constant (kPa °C
−1),
Da (kPa) is daily average vapour pressure deficit at 2 m height,
U2 (m s
−1) is daily average wind speed at 2 m height, and
Tmean (°C) is daily average air temperature at 2 m height. Equation (1) is the reference grass crop evapotranspiration equation because of the 0.34
U2 component. This component was derived by dividing the reference grass crop boundary layer conductance (
U2/208 m s
−1) by stomatal conductance (1/70 m s
−1) which equals 0.34
U2.
For the P. communis field site, daily (midnight to midnight) estimates of ETo were collated from an Australian Government Bureau of Meteorology (BOM) official weather station approximately 3 km distance from the field site (Site number: 086383, Coldstream, Victoria, Australia). For the S. floribundum and S. paniculatum measurement campaigns, ETo was calculated from a local weather station installed proximate to the instrumented trees. The weather station model was ATMOS 41 (METER Group, Pullman, WA, USA) that measured solar radiation (±5%), air temperature (±0.2 °C), relative humidity (±1.5%), and wind speed (±0.3 m s−1 or ±3% of measurement). The weather station was installed at 2 m height and data were logged at 10-min intervals and hourly or daily averages used for data analysis.
2.3. Sap Flow Measurements
Sap flow sensors were heat pulse variety (Implexx Sap Flow Sensor, Implexx Sense, Melbourne, Australia) that consisted of three stainless steel needles of 0.03 m length, 0.0013 m diameter, and spaced at 0.006 m equidistance in the axial direction. There were two negative temperature coefficient (NTC) thermistors, with an accuracy of ±0.015 °C, located in the downstream and upstream needles, respectively, spaced at 0.01 m and 0.02 m distance from the needle tip. The central needle was a heater element of nichrome wire with a typical resistance of 38 Ω and total energy applied per heat pulse of ~400 J m−1. Thermistors and heater element were controlled by a serial to digital interface (SDI-12, Implexx Sense, Melbourne, Australia) that measured temperature at a resolution of 0.2 s and precisely controlled a 3 s heat pulse. Data were logged at 10 min intervals, and then averaged hourly, by a commercially available data logging system (ES-SYS, Edaphic Scientific, Melbourne, Australia).
Heat velocity was measured via three heat pulse methods: heat ratio method (HRM), Tmax method, and dual method approach (DMA) following the methods outlined by Forster [
20,
21]. Heat velocity estimates were corrected for wounding and probe misalignment following the methods of Forster [
20]. Corrected heat velocity was converted to sap flux density (
J, m
3 m
−2 s
−1) via the following equation [
24]:
where
Vc is corrected heat velocity (m s
−1), ρ
d is sapwood density (kg kg
−1),
cd is dry wood specific heat capacity (1200 J kg
−1 K
−1; [
25]),
mc is sapwood gravimetric moisture content (kg kg
−1),
cw is sap solution specific heat capacity (4182 J kg
−1 K
−1; [
25]), and ρ
w is the density of sap (1000 kg m
−3; [
25]). Destructive samples of sapwood were taken from the trees, at the end of the measurement campaign, and proximate to the sap flow sensor installation site, for the measurement of ρ
d and
mc following methods outlined by Forster [
21]. Finally, total tree sap flow (
Q, kg or L) was calculated as
J multiplied by sapwood area (
AS, m
2; [
26]). Sapwood area was calculated based on a visual assessment as there was a clear colour demarcation between sapwood and heartwood within the xylem.
2.4. Total Leaf Area Measurements
Total leaf area for
P. communis was measured at start, mid-point and end of the 35-day measurement campaign by multiplying LAI by canopy projection area. LAI was estimated via two, independent light interception techniques: ceptometer (AccuPAR, model LP-80, METER Group, Pullman, WA, USA) where an average of 20 below canopy measurements were taken at random positions beneath each tree approximately 0.5 m distance from the trunk; and digital imagery where images at four locations (north, south, east, west) beneath the canopy approximately 0.5 m distance from the trunk were converted to LAI via a MATLAB based software algorithm developed by Fuentes et al. [
27]. The two techniques yielded similar values and averages were taken as tree LAI. Canopy projection area was assumed to be circular following averaging of eight radii measurements, between the trunk and outer canopy, around the circumference of the tree.
Total leaf area for
S. floribundum and
S. paniculatum was measured at the start and end of the measurement campaign by multiplying average leaf area by total number of fully expanded leaves on each tree (approximately 700 to 1000 leaves per individual). Average leaf area was measured by harvesting 100 random leaves at the end of the campaign and measuring via a flatbed scanner and Easy Leaf Area v2 software [
28].
2.5. Data Compilation
A comprehensive search of the literature was undertaken to collate data to test the hypothesis that the slope of the linear relationship between transpiration (i.e., T = Q/AL) and ETo was 0.347 (i.e., the reciprocal of a LAI of 2.88). Collated data conformed with the following criteria: experimental or measured trees were well-watered (this criteria regularly excluded forest or natural experiments and limited studies to intensively managed orchards), Q was estimated on a per stem (or individual) basis, Q was estimated with a thermometric sap flow method (other estimates of transpiration, such as lysimeters, porometers, chambers, Eddy covariance, or other instrumentation, were excluded), Q was divided by AL, ETo was calculated via the Penman–Monteith method, all other methods of ETo calculation were excluded, and crop evapotranspiration (ETc) data were excluded. Literature was searched on the Web of Science and Google Scholar databases up until April, 2020, with the following search terms: sap flow (or sapflow), leaf area, transpiration, evapotranspiration, ETo, Penman–Monteith. References and citations were also searched for additional data. Only peer-reviewed, published data were included in the data compilation.
2.6. Data Analysis
Linear regression analysis was used to test the hypothesis that T (Q/AL) can be estimated from ETo/2.88. All data were untransformed because the analysis tested whether T was linearly related to ETo/2.88 and a log or other transformation would bias this assumption. Slopes of the linear regression curve were fitted through the origin because it was assumed the relationship was equal. A slope and r2 of 1 indicate a perfect relationship. A slope less than 1 indicates ETo/2.88 underestimates T and a slope greater than 1 indicates ETo/2.88 overestimates T. The accuracy of the DMA, HRM and Tmax sap flow methods were further assessed via a root mean square error (RMSE) test where smaller values indicate a better model.
3. Results
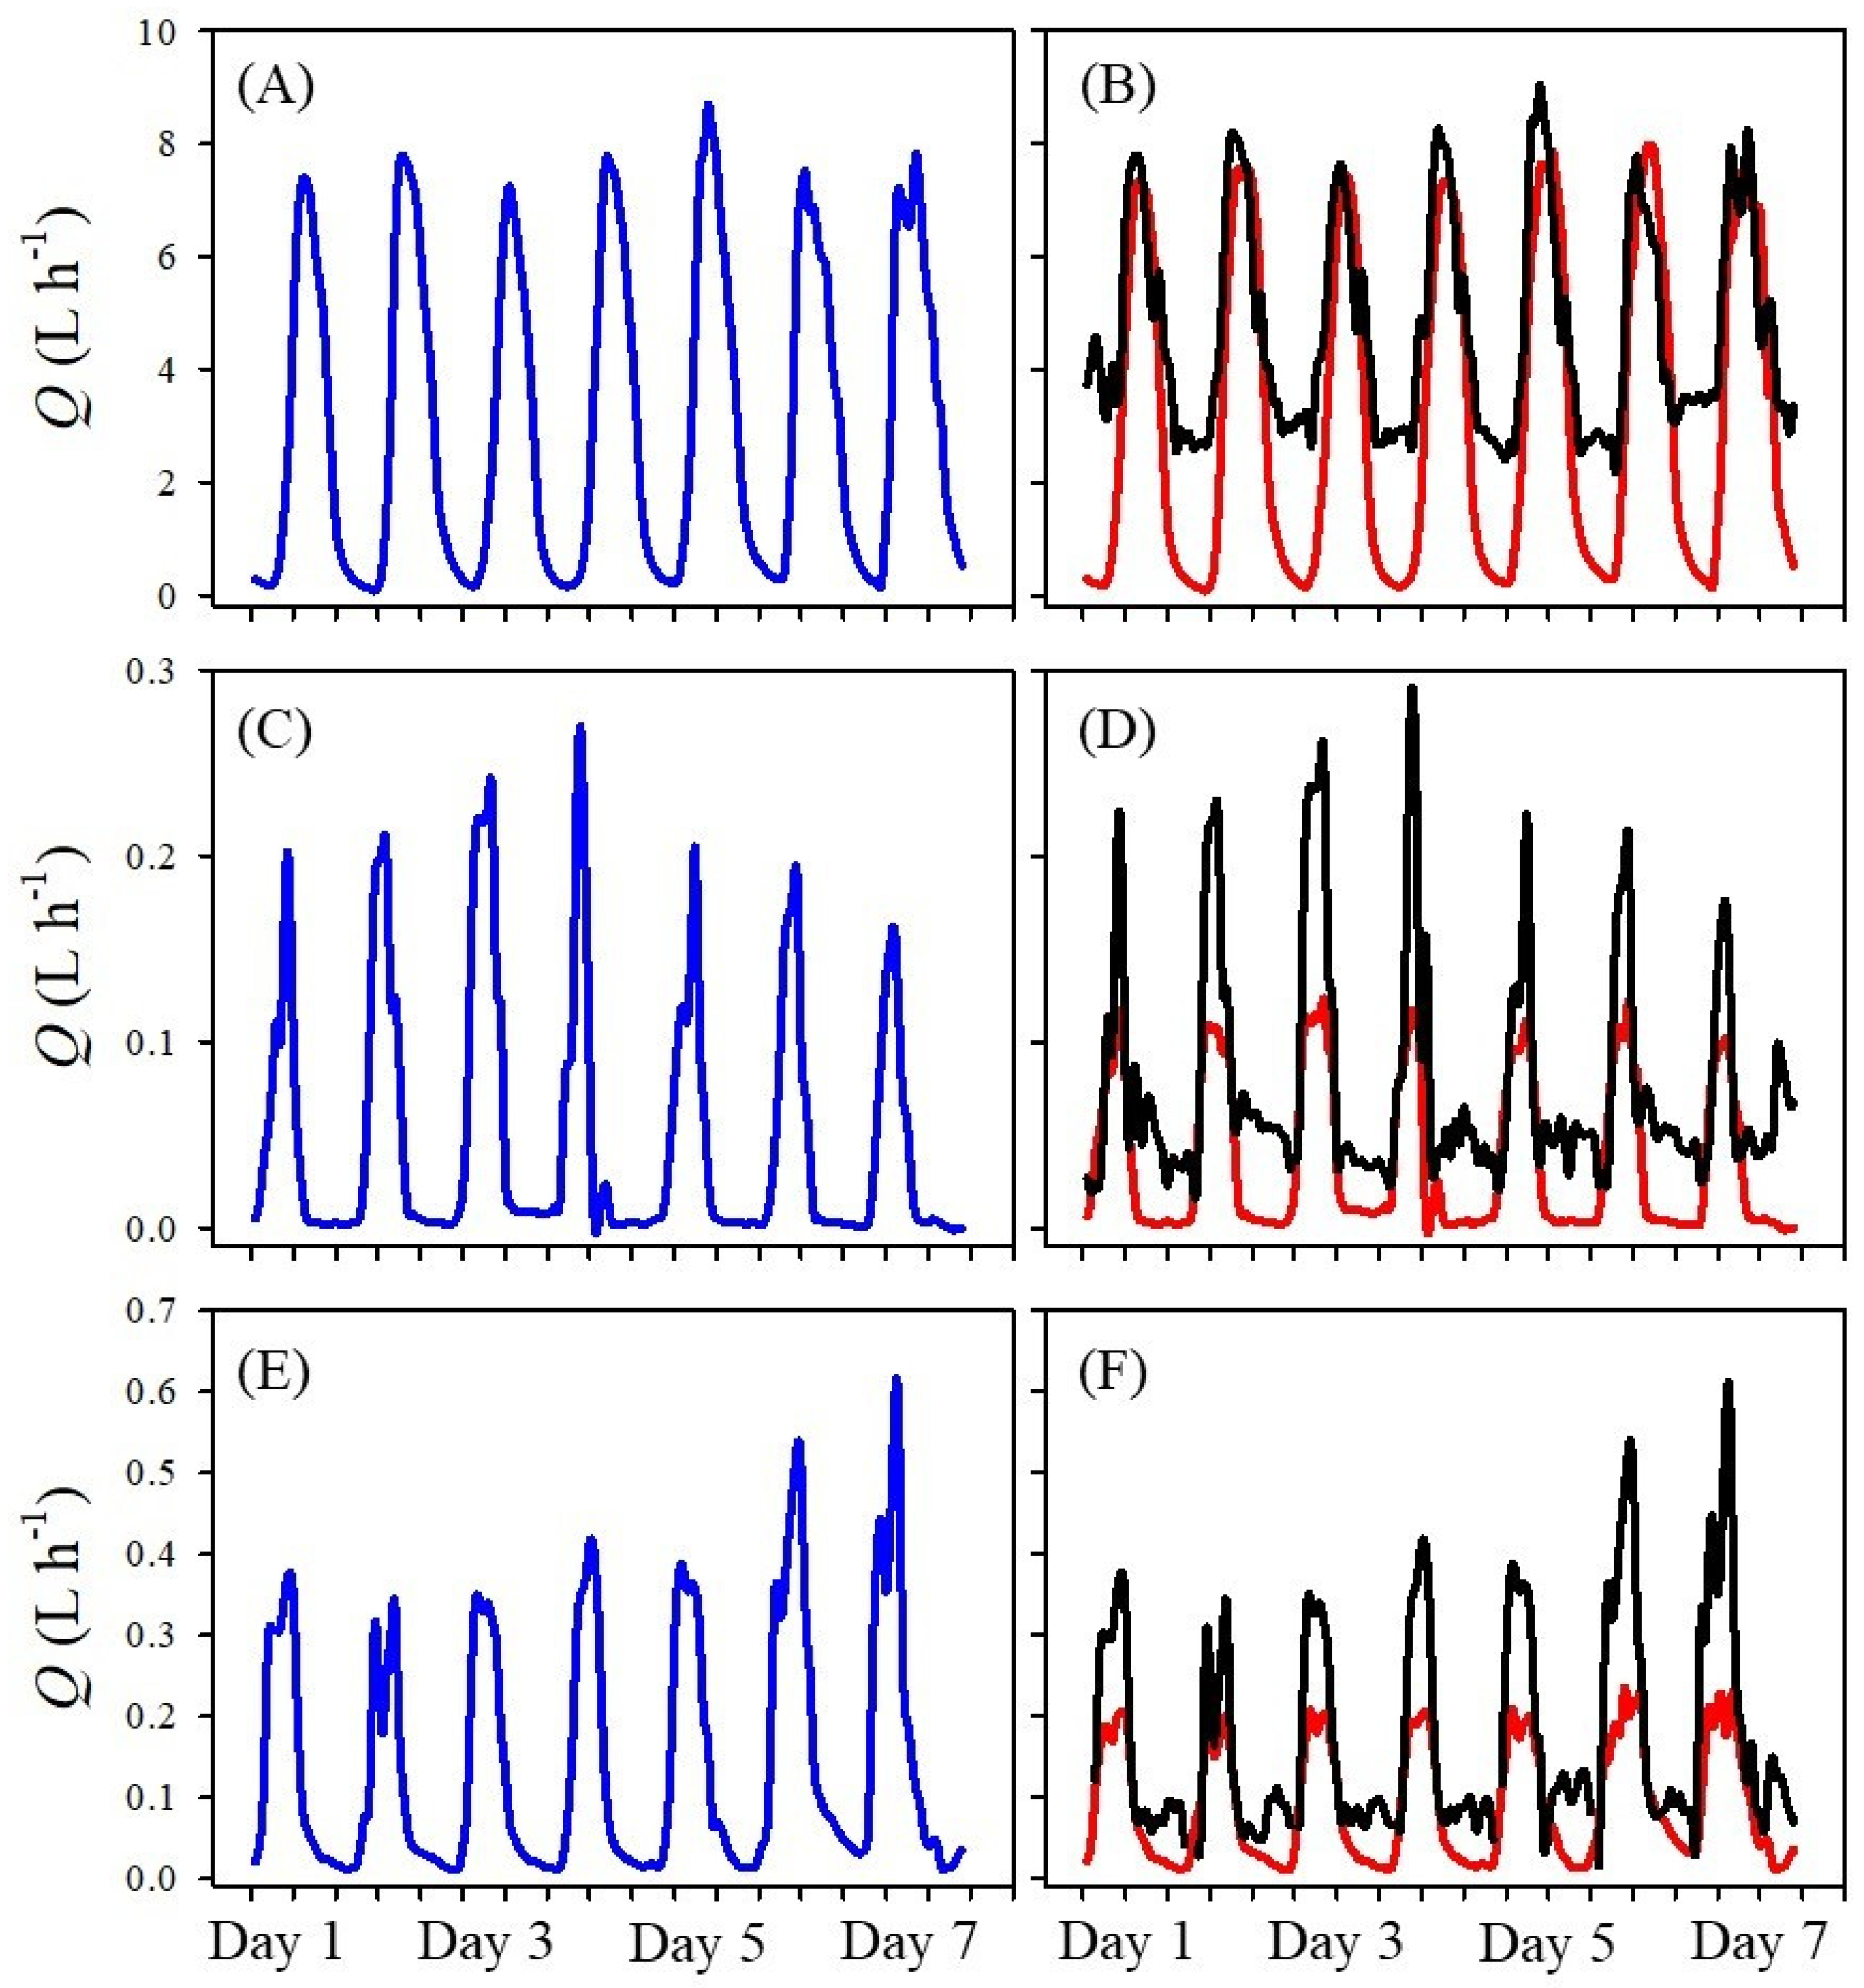
The three sap flow methods used in this study showed differences in the diel pattern of sap flow.
Figure 1 displays an example 7-day period of sap flow data around the period of maximum sap flow during the respective species measurement campaigns. The Tmax had high night-time flows whereas the HRM had low peak daytime flows. This observation was evident for the three species measured in this study. The DMA successfully merged the optimal sap flow data from the HRM and Tmax.
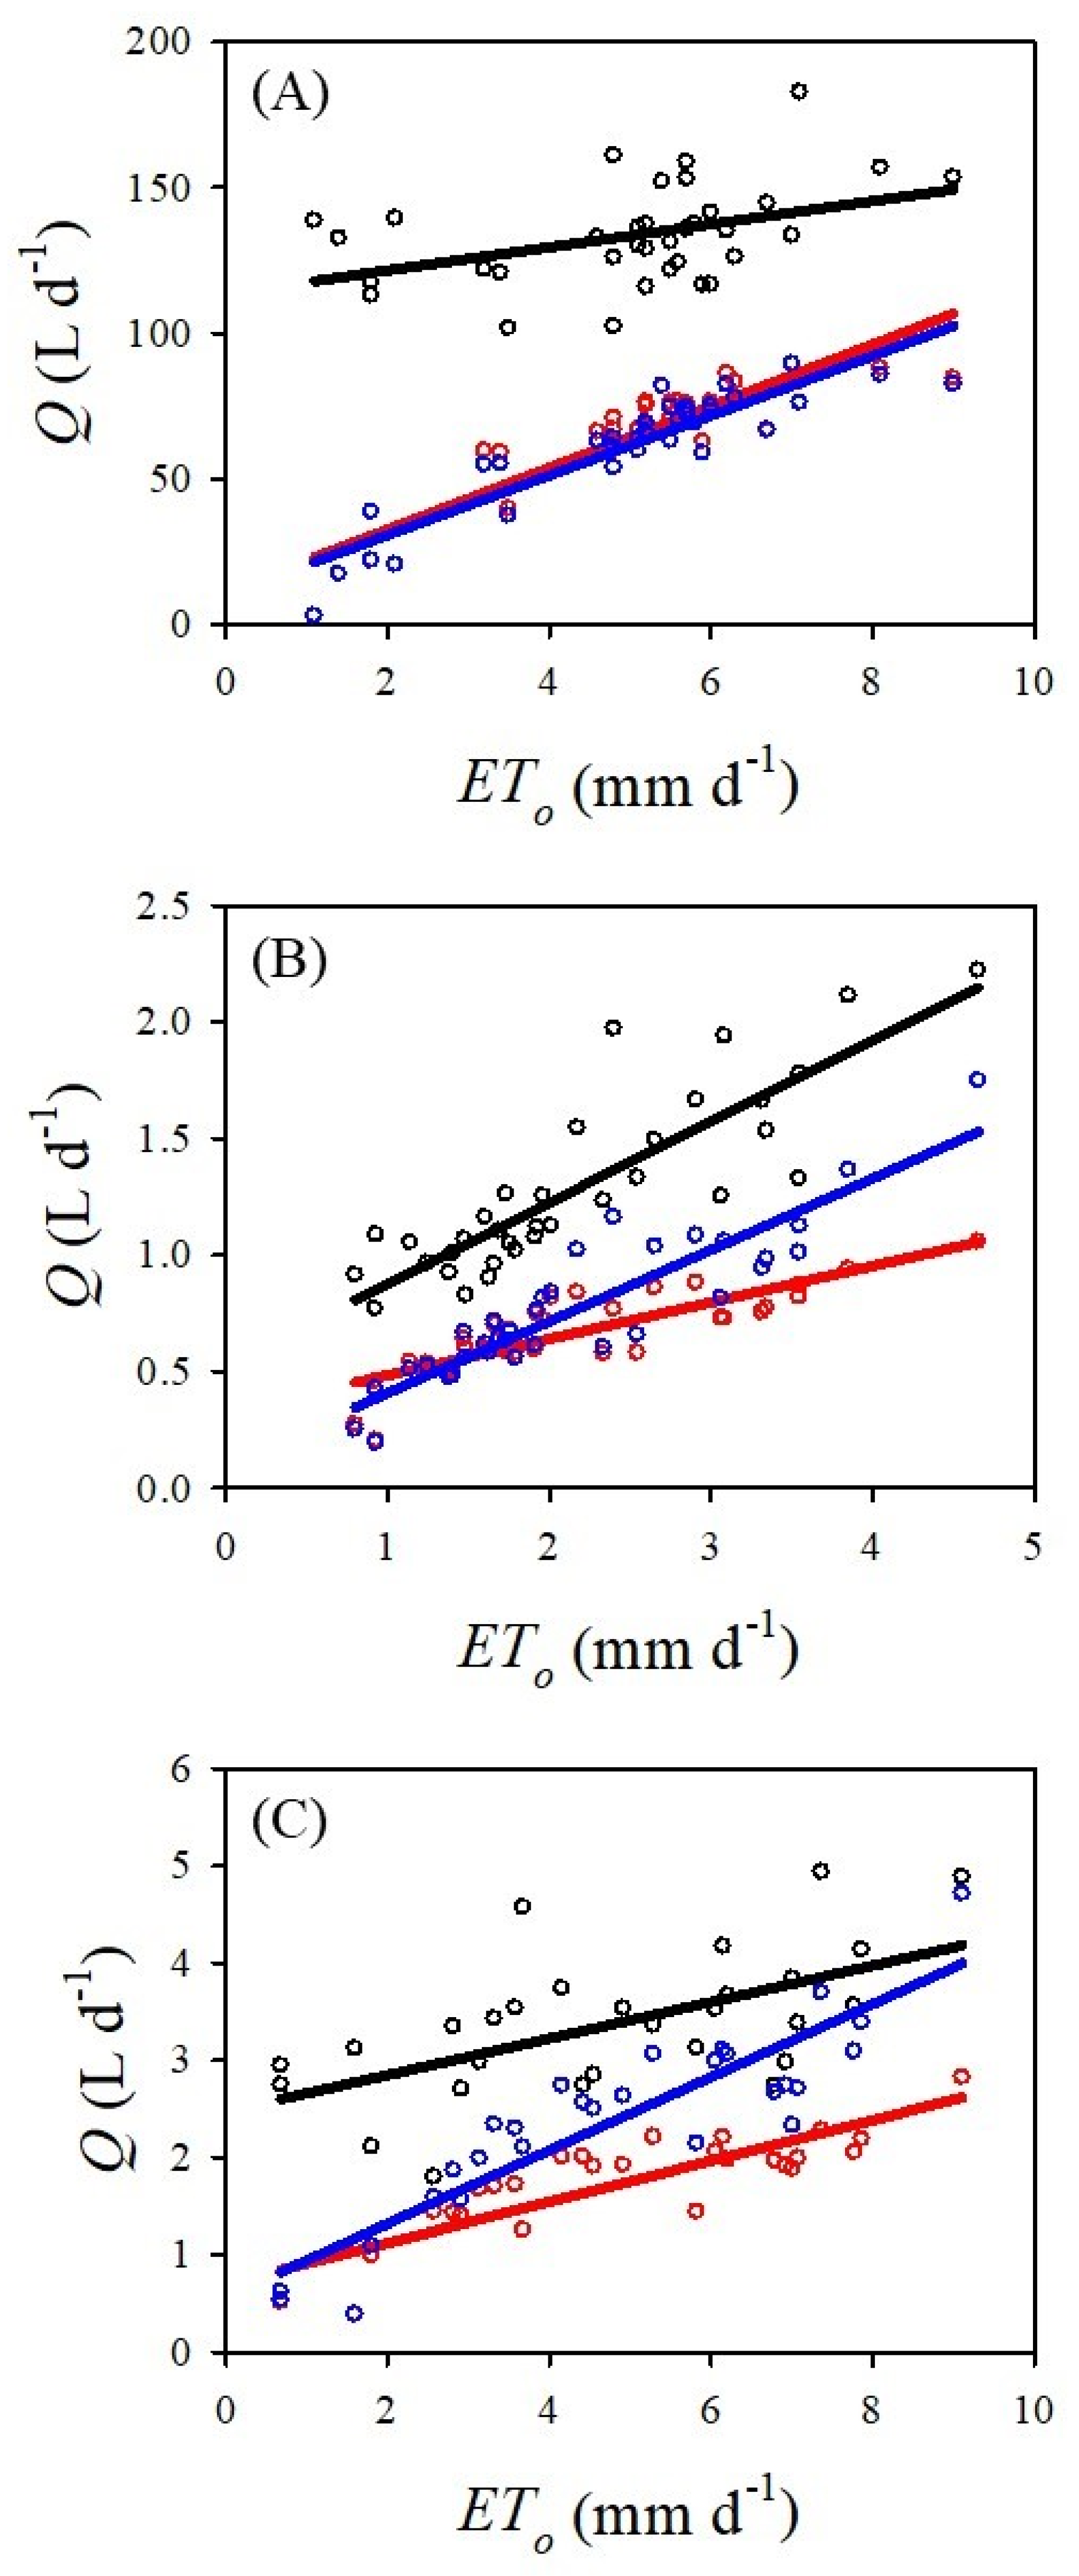
There was a significant linear correlation between
ETo and the sap flow methods for all three species (
Figure 2). For
P. communis, there was a significant positive linear correlation between daily
ETo (mm d
−1) and
Q (L d
−1) when sap flow was estimated via the DMA (
r2 = 0.824,
p < 0.001,
n = 35), HRM (
r2 = 0.811,
p < 0.001,
n = 35) and Tmax (
r2 = 0.177,
p = 0.012,
n = 35). For
S. floridbundum, there as a significant positive linear relationship between
ETo (mm d
−1) and
Q (L d
−1) when sap flow was estimated via the DMA (
r2 = 0.816,
p < 0.001,
n = 34), HRM (
r2 = 0.691,
p < 0.001,
n = 34) and Tmax (
r2 = 0.733,
p < 0.001,
n = 34). There was also a significant positive linear relationship between
ETo (mm d
−1) and
Q (L d
−1) for
S. paniculatum via the DMA (
r2 = 0.806,
p < 0.001,
n = 28), HRM (
r2 = 0.742,
p < 0.001,
n = 28) and Tmax (
r2 = 0.344,
p = 0.001,
n = 28).
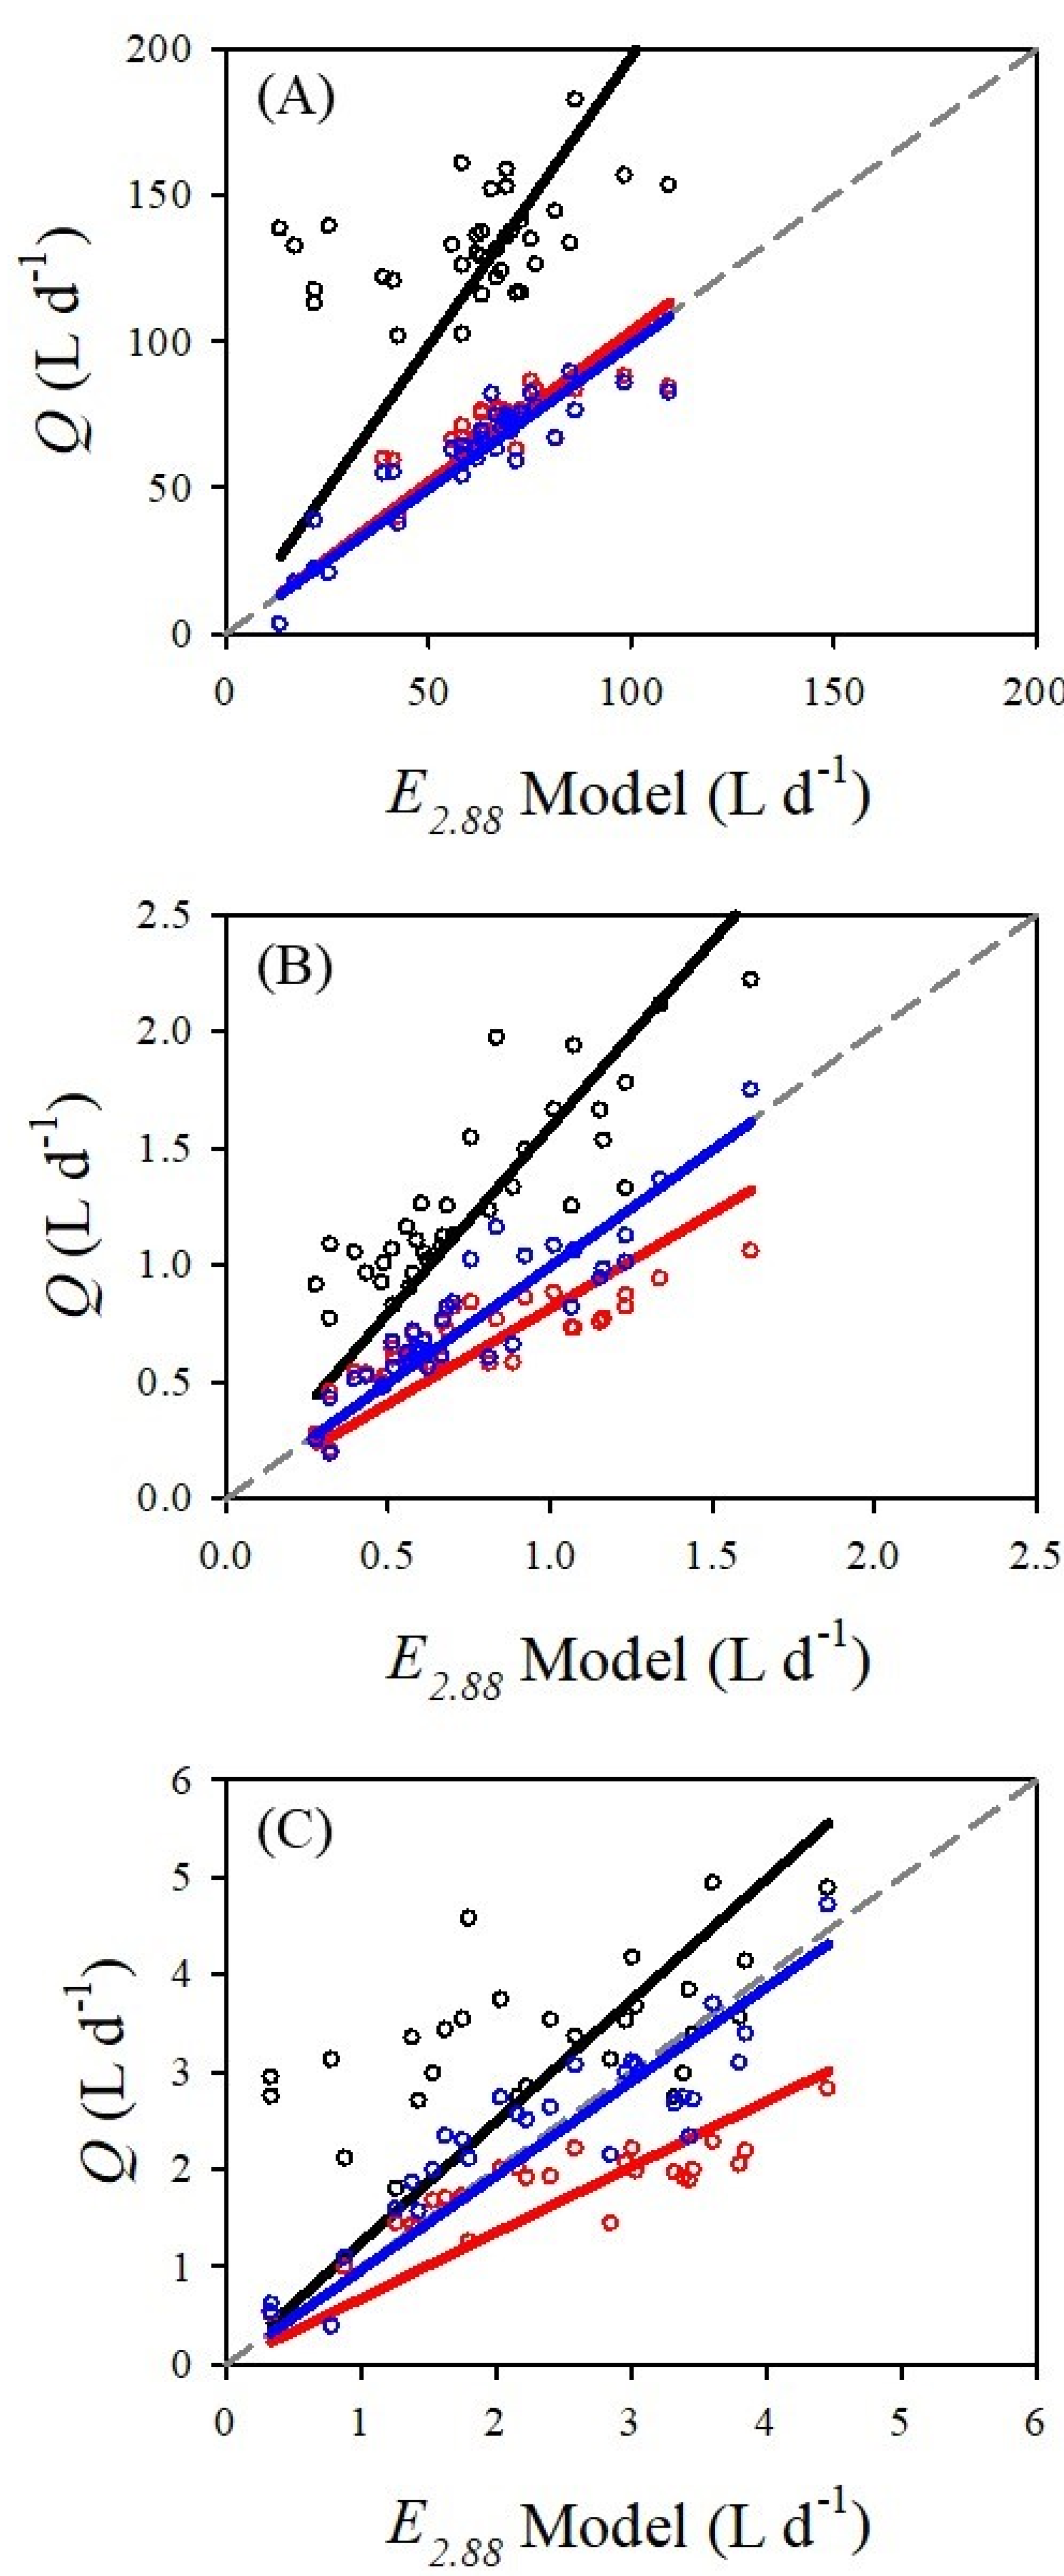
The
E2.88 model was mostly confirmed for the three species measured in this study. However, there were differences in the precision and accuracy of the three sap flow methods.
Figure 3 displays the linear relationship between
ALETo/2.88 (L d
−1) and
Q (L d
−1) for the three species and sap flow methods.
Table 2 presents the results from the linear regression analyses and the performance of each model via RMSE. For all three species, the DMA was the most accurate sap flow method followed by the HRM and Tmax. The DMA had an error range between 0.5 to 3.3%, an average precision of 0.972 and the smallest RMSE values for all three species. For the HRM, there was a bias towards an underestimation (slope less than 1) in two of the species, whereas the Tmax showed a bias towards an overestimation (slope greater than 1) for all three species.
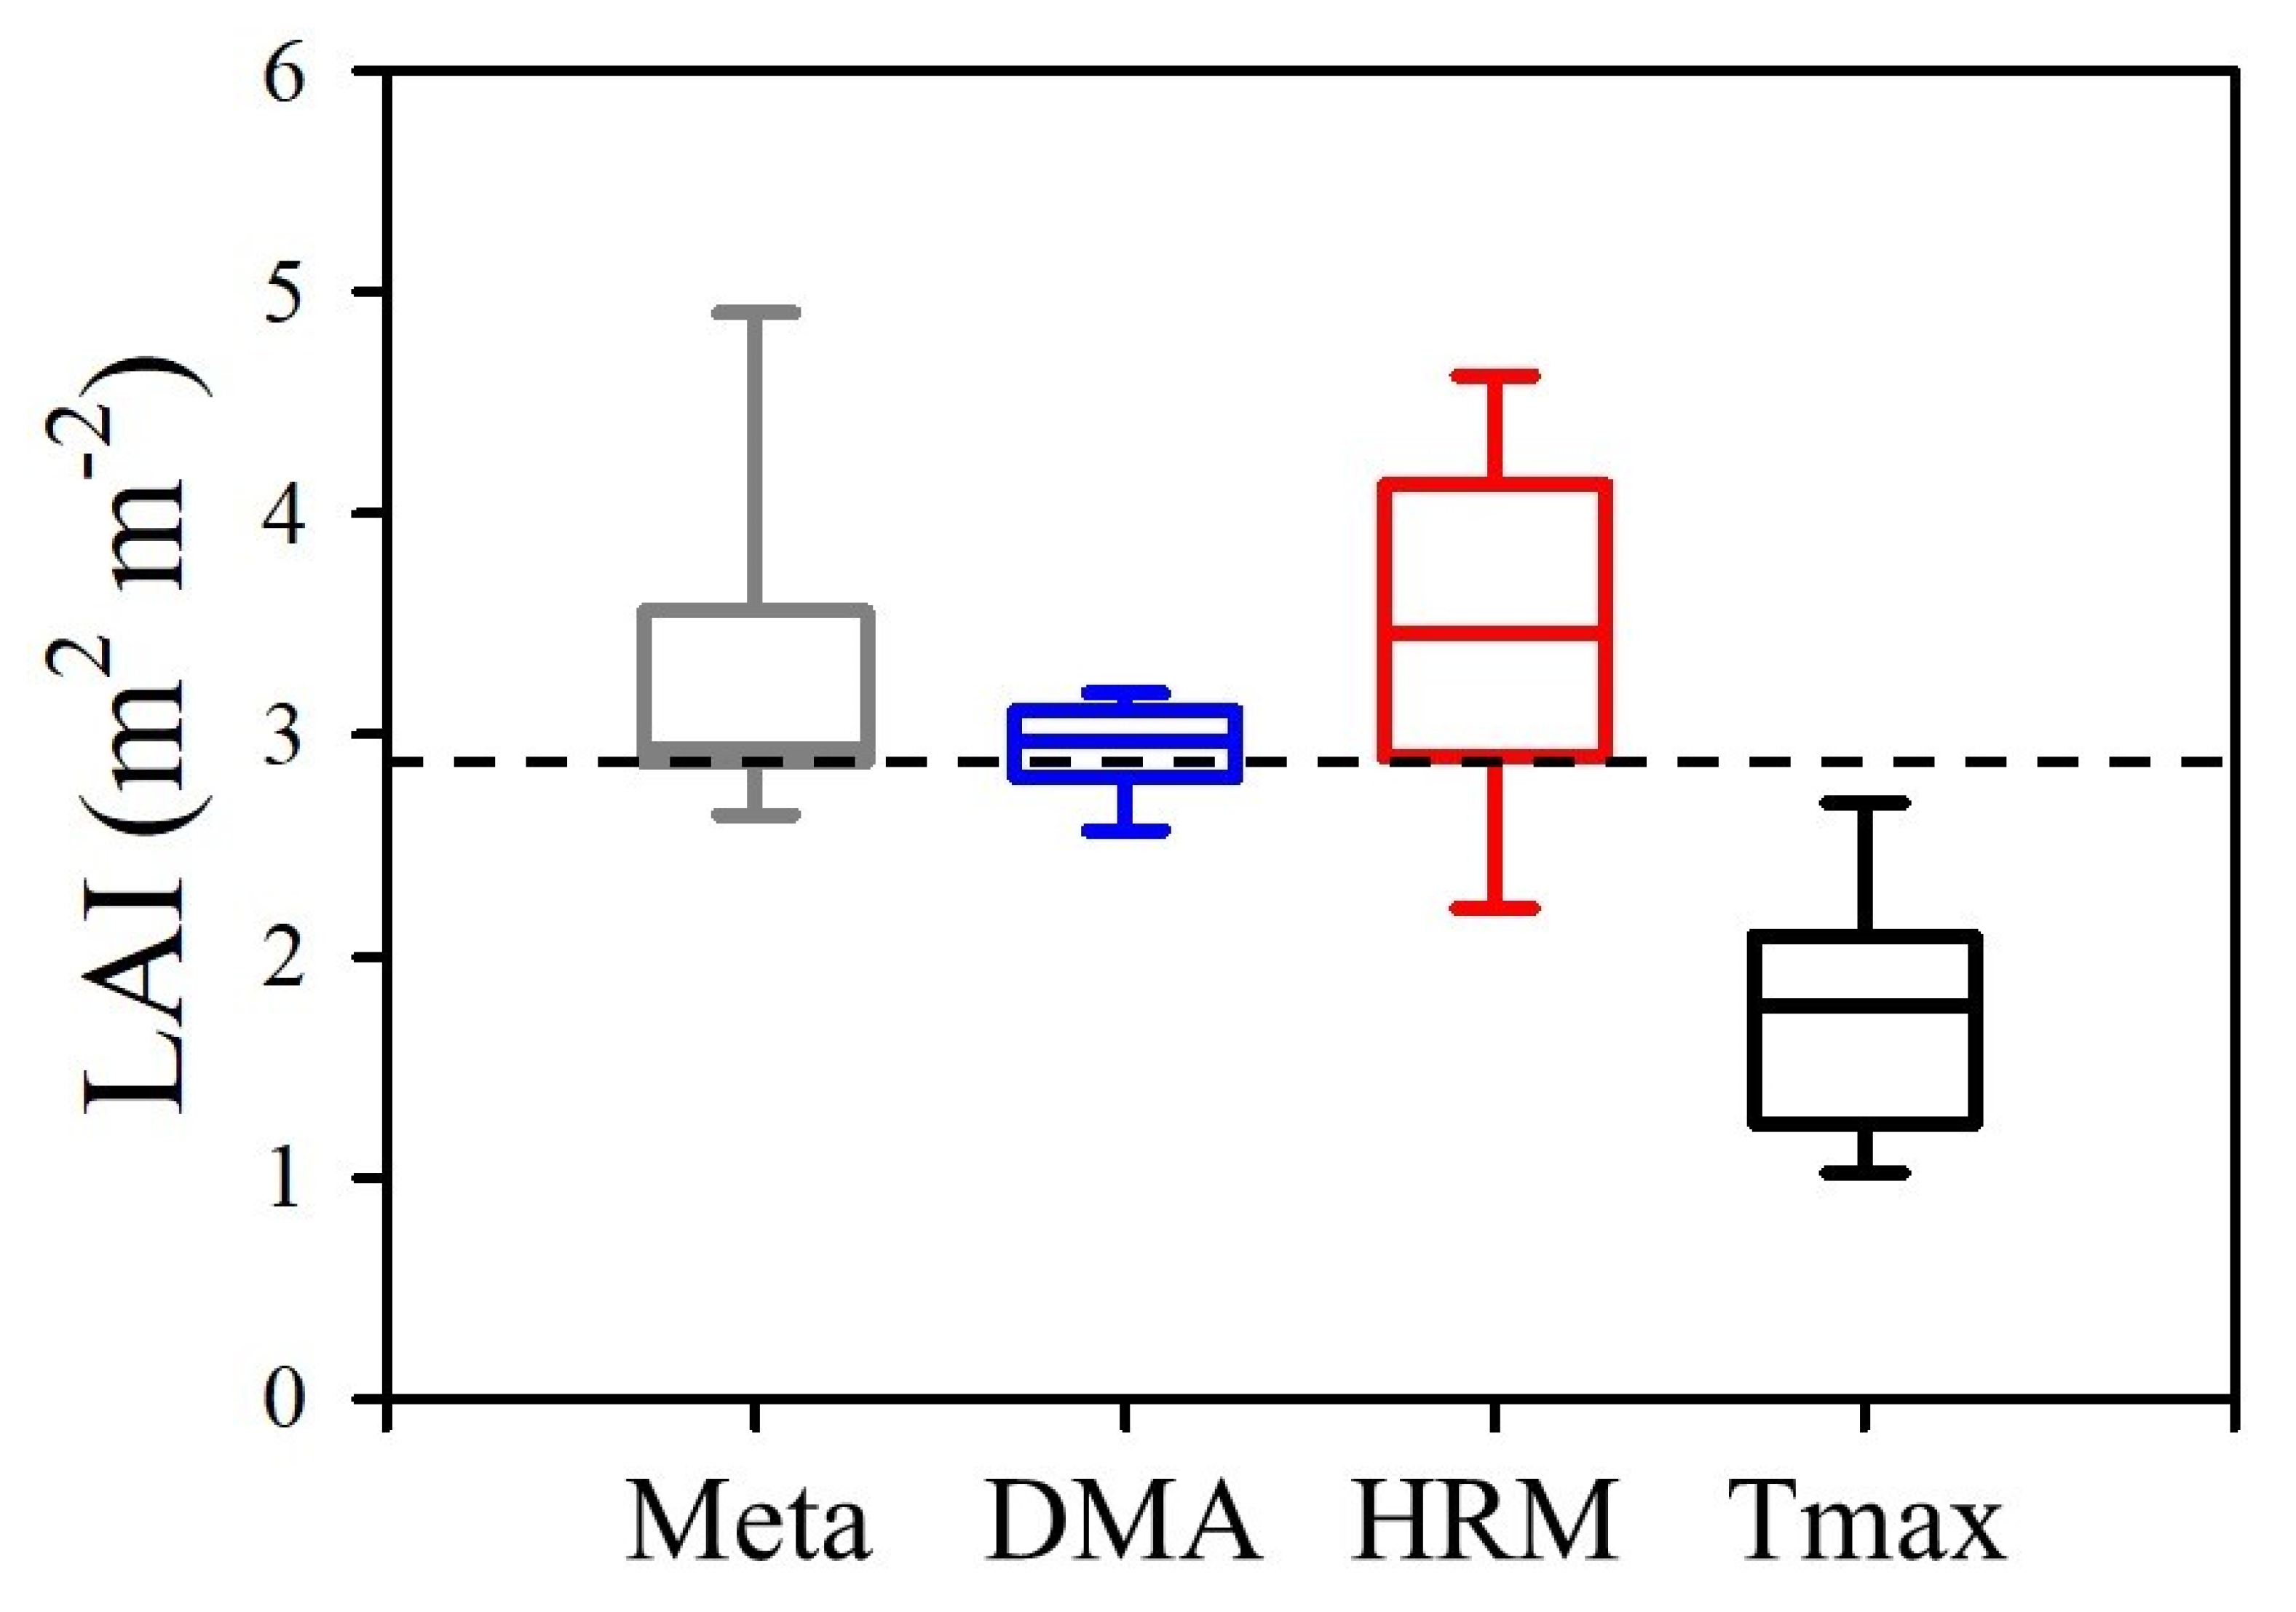
The data compilation was conducted on 15 samples across 9 species and 14 varieties with the complete results presented in
Supplementary Table S1. Box plots of the reciprocal of the slope of the linear regression between
ETo and
T (
Q/
AL) for the samples from the data compilation, are presented in
Figure 4. The mean slope of the data compilation was 3.16 which was not significantly different from the hypothesised value of 2.88 from the
E2.88 model (Student’s
t = 2.107, two-tailed
p = 0.054,
n = 15). The mean slope of transpiration measured via the DMA in this study was 2.94 which was not statistically different from 2.88 (Student’s
t = 1.058, two-tailed
p = 0.315,
n = 11). The mean slope for the HRM was 3.45 and Tmax was 1.72 which was significantly greater (Student’s
t = 2.417, two-tailed
p = 0.036,
n = 11) and lesser (Student’s
t = −7.060, two-tailed
p < 0.001,
n = 11) than 2.88, respectively.
4. Discussion
The
E2.88 model was generally supported by the sap flow measurements of the three woody species in this study. The results of this study were further supported by a data compilation of an additional 15 samples across 9 species and 14 varieties from previous studies [
7,
8,
9,
10]. The
E2.88 model was only validated under non-limiting soil moisture. Therefore, the results of this study suggest a positive correlation between
Q,
AL, and
ETo when soil moisture, and most likely other stress factors, are non-limiting.
A general confirmation of the accuracy of the
E2.88 model will improve the reliability of plant water use measurements. Many models have been proposed to correlate
Q with
ETo that have also shown good accuracy and predictive power (e.g., [
9,
29]). However, incorporating plant factors directly into evapotranspiration models is complex, site specific, requires extensive measurement and instrumentation, such as satellites or eddy covariance towers, to determine parameters such as stomatal and canopy conductance, and qualitative decisions such as partitioning the canopy into sun and shade leaves (e.g., [
30,
31]). The
E2.88 model may remove the requirement to estimate a crop coefficient to convert
ETo to
ETc [
7]. The crop coefficient (
Kc), or basal crop coefficient (
Kcb) in the dual crop coefficient approach, converts
ETo to
ETc which is evapotranspiration for a specific leaf surface [
2]. The
E2.88 model is analogous to
Kc or
Kcb because it also estimates a plant specific evapotranspiration based on its leaf surface, in this case total leaf canopy area (
AL). Yet, the
E2.88 model has an advantage over other approaches to estimate
Kc or
Kcb because it is comparatively simple to implement [
7,
9,
10]. However, extensive research, explicitly comparing the
E2.88 model against traditional
Kc,
Kcb and
ETc models, which was beyond the scope of this study, is required.
The
E2.88 model estimates maximum potential plant water use that is driven by atmospheric evaporative demand based on the assumption that all other conditions are non-limiting [
7,
10]. The non-limiting assumption may prove useful because it provides a null model against which measured
Q can be compared. For example, if
Q is not equal to the
E2.88 model then, by inference,
Q is not equal to atmospheric evaporative demand and some other biophysical or physiological component is the limiting factor. Experimental designs or comparative studies can explore potentially limiting factors to
Q. For instance, Pereira and Villa Nova [
10] used the
E2.88 model to experimentally test phenological and biophysical effects of water use in Tahiti acid lime; and Fernández et al. [
9] used the
E2.88 model in a study on regulated deficit irrigation.
In this study, only the DMA sap flow method was consistent with the
E2.88 model whereas the HRM and Tmax under- and over-estimated transpiration. This outcome supports previous research demonstrating that the DMA sap flow method can accurately estimate a wide range of tree sap flow and that the HRM and Tmax methods are limited at fast and slow flows, respectively [
20,
21]. The HRM underestimates sap flow because it estimates sap flow when conduction is the dominant thermal process in sapwood [
20]. In this study, the Tmax method overestimated sap flow in all three species which contrasts with previous studies that found Tmax generally underestimates sap flow [
15]. The overestimation from the Tmax method observed in this study was due to the high nocturnal sap flow which consequently contributed to a higher cumulative daily total. This study highlights that the measurement range limitation of certain sap flow methods may lead to varying interpretations of the
E2.88 model. A method that is known to measure the entire observable range of sap flow in plants, such as the DMA, should be prioritized in assessing evapotranspiration-based models.
The accurate measurement, or estimation, of
AL is also critical for the
E2.88 model. In this study,
AL was measured by multiplying leaf area index (LAI) by canopy projection area. Consequently,
AL is dependent on the accurate measurement of LAI and canopy projection area. Testing the accuracy of LAI and canopy area methods was beyond the scope of this study. Many studies have estimated LAI, via light interception, digital imaging, ceptometers, remote sensing, drones, or satellite, with varying degrees of accuracy (e.g., [
27,
32,
33]). Similarly, various methods are available to measure canopy projection area which can be difficult given geometrical irregularity and dealing with clumping or sparseness (e.g., [
34,
35]). Inevitably, LAI, canopy area and
AL will rarely be measured precisely, and these parameters will need to be treated with caution when used with the
E2.88 model.


