Article

Effects of Poplar Shelterbelt Plantations on Soil Aggregate Distribution and Organic Carbon in Northeastern China

1
College of Biological Sciences, Guizhou Education University, Guiyang 550018, China
2
College of Forestry, Jiangxi Agricultural University, Nanchang 330045, China
3
Key Laboratory of Forest Plant Ecology (MOE), College of Chemistry, Chemical Engineering and Resource Utilization, Northeast Forestry University, Harbin 150040, China
4
College of Resources and Environment, Jiujiang University, Jiujiang 332005, China
5
Heilongjiang Academy of Agricultural Sciences, Harbin 150040, China
*
Authors to whom correspondence should be addressed.
Forests 2022, 13(10), 1546; https://doi.org/10.3390/f13101546
Submission received: 9 August 2022 / Revised: 6 September 2022 / Accepted: 14 September 2022 / Published: 21 September 2022
(This article belongs to the Special Issue Forest Biodiversity and Ecosystem Stability)

Abstract

:
This study aimed to determine the distribution, stability, and soil organic carbon (SOC) of aggregates, and the contribution of soil aggregate proportion, stability index, and aggregate-associated SOC to the total SOC. Three hundred and sixty soil samples were gathered from shelterbelts and neighboring farmlands in five layers of 1 m profiles in Songnen Plain, northeastern China. The shelterbelt plantations were found to increase by 69.5% and 103.8% in >2 mm and 0.25–2 mm soil aggregates, respectively, and their R0.25, mean weight diameter (MWD), and geometric mean diameter (GMD) were enhanced by 96.3%, 33.2%, and 40.0%, respectively, compared to those of farmlands in soil layers at 0–20 cm depth (p < 0.05). The total SOC content increased by 13.3% at 0–20 cm soil depth, and the SOC content and stock in >2 mm aggregates increased by 21.5% and 18.7% in the 20–40 cm layer (p < 0.05), respectively. The SOC content and stock in total soil had a significantly positive relationship with the proportion of >2 mm soil aggregates and a negative relationship with the value of fractal dimension (D). The enhancement in the SOC of the total soil was dependent on the increase in aggregate-associated SOC, with larger-particle aggregates having a greater contribution. Based on the study results, afforestation improved soil stability and the structure of soil aggregates, and SOC accumulation in the total soil was not only governed by SOC concentration and stock within the aggregate size class, but also the proportion of >2 mm soil aggregates and the value of the fractal dimension.

1. Introduction

The global soil carbon (C) pool has been calculated to be over three-fold higher than the atmospheric pool and approximately four-fold higher than the biotical pool [1]. Changes in the soil C pool may markedly affect the atmospheric CO2 concentration [2]. Forest ecosystems contain 60% as much C as land ecosystems, 70% of which is reserved in the soil [3]. C is also an important element that maintains the balance in terrestrial ecosystems [4]. Afforestation in abandoned farmlands has become an important measure to protect soil from degradation and recover degraded ecosystems [5,6]. The “Three-North Shelterbelts” program, called “Green Great Wall”, was launched in Northwest, North, and Northeast China in 1978 to protect farmlands from serious erosion and windstorms. The program covers a total area of 4.07 Mkm2, accounting for 42.4% of the country’s land area [7]. To date, inconsistent results have been reported regarding the influence of afforestation in agricultural land on soil organic carbon (SOC). Some studies suggested that SOC accumulation occurred following afforestation [8,9], while other studies revealed that SOC depletion occurred after afforestation [10,11]. Some studies also reported an initial loss followed by an increase in SOC concentration [12,13]. These contradictions warrant further studies to evaluate the significance of SOC accumulation from afforestation in farmlands and determine the dominant factors affecting SOC sequestration. The existing literature is limited in the distribution of SOC in different-size aggregates and the contribution of SOC in aggregates to total SOC after afforestation. Further investigation in these areas would help explain the mechanism of SOC change following afforestation on abandoned farmlands.
As primary components in the composition of soil, soil aggregates play a critical role in the movement of air through soil, the water-holding capacity of soil, and the protection of soil organic matter [14], which are regarded as the cores of all mechanisms of SOC sequestration [15,16]. As important indexes, the distribution and stability of soil aggregates may be used to assess changes in soil structure owing to quick responses to conversions in soil use types [17]. At present, the main parameters used to evaluate the stability of soil aggregates are soil’s large-aggregate content (R0.25), mean weight diameter (MWD), geometric mean diameter (GMD), and fractal dimension (D) [18]. The larger the R0.25, MWD, and GMD, and the smaller the D, the better the soil structure stability and the stronger the soil erosion resistance [19,20]. Soil-aggregate-associated organic carbon is usually used as a parameter to measure the stability of organic carbon in total soils following conversions in land use to protect SOC from microbial decomposition and oxidation [21]. Most SOC was found to be occluded with macroaggregates (>0.25 mm) in forest soils [22], and the macroaggregates in forest soils generally afford higher SOC content and stocks than microaggregates (0.053–0.25 mm) in most temperate soils [23]. Deforestation can reduce the distribution of macroaggregates and result in the loss of SOC in aggregate and total soil [24,25]. However, other research revealed that SOC accumulation depends on microaggregates (0.053–0.25 mm) [16] and slit and clay fractions (<0.053 mm) [26,27] following afforestation. These inconsistent results suggest the need for in-depth studies on the influences of afforestation on SOC accumulation in different soil aggregates with different particle sizes [28].
Only a few studies have reported the effects of afforestation in farmland on the distribution and stability of soil aggregates and the accumulation of SOC in aggregates in northeastern China. However, such information is crucial for understanding how SOC responds to the change in farmland owing to afforestation and assessing the function of the sequestered SOC following afforestation. We hypothesized that: (1) afforestation on farmland will increase the proportion of >0.25 mm soil aggregates and the stability of soil structure; (2) total SOC and aggregate-associated SOC in >2 mm aggregates will increase in the 0–20 cm and 20–40 cm layers following afforestation; and (3) the total SOC is dominated by aggregate-associated SOC, with larger-particle aggregates contributing more to the total SOC.
To test our hypothesis, the distribution of soil aggregates, the stability of soil aggregates, and the SOC concentration and stock in total soil and aggregates of different particle sizes were measured in paired plots of poplar shelterbelts and adjacent farmland. The aims of this study were to determine the effects of afforestation on aggregate size distribution, aggregate stability, SOC content and stock in different size aggregates, and the contribution to SOC in total soils.

2. Materials and Methods

2.1. Study Area

The three study sites (Dumeng, Zhaodong, and Lanling) are located in central Songnen Plain, China (Figure 1). The study region has a typical continental monsoon climate, with an annual average temperature of 3–4 °C. The annual average precipitation ranges from 350 to 500 mm, and the average frost-free period is 145 days. The soils in this region are typical black soils and degraded soils, including Chernozem (Lanling), Cambosols (Dumeng), and Solonetz (Zhaodong), according to the Chinese Soil Classification System [29]. The soil properties of the sampling sites are shown in Table 1.
The Songnen Plain is an area included in the “Three-North Shelterbelts” project of 1978, which comprises plantation forests surrounding farmlands in northeastern, northwestern, and northern China [30]. Forest and farmland are the main land use types in the study area. The major forest type is poplar (Populus alba × Populus berolinensis), and the dominant crop is maize (Zea mays L.). Four to six rows of poplar forest belts (in width) are usually cultivated to protect a farmland with an area of 500 m × 500 m. This area is approximately 10 m from the shelterbelt to the neighborhood farmland. The same conditions were secured between the control plots and the experimental plots. Related information regarding this study area has been presented previously [31,32].

2.2. Experiment Design, Soil Sample Collection, and Measurements for the Parameters of Aggregates

Twelve paired plots of poplar plantation and neighboring farmland were selected for soil sampling at each study site. We measured the tree height, diameter at breast height, and tree density in the research plot. In each paired plot, two soil profiles (1 m × 1 m × 1 m) were excavated to collect undisturbed soil samples at depths of 1 m (0–20 cm, 20–40 cm, 40–60 cm, 60–80 cm, and 80–100 cm) in poplar and neighborhood farmland after the removal of the herbaceous and litter layer. Soil samples were collected using four 100 cm3 cutting rings at each layer, and four samples obtained from the same soil layers were mixed. Thus, a total of 360 samples were used (3 sites × 12 pairs × 2 profiles × 5 layers). The collected samples were air-dried in the laboratory.
The dried soil samples were mixed according to the same plots, the same land type, the same soil depth, and the same DBH range (5–20 cm, 20–35 cm, and 35–50 cm). Thus, 90 mixed samples were used for further experiments on soil aggregates. Each mixed sample was divided into two parts: one part was passed through a 0.25 mm mesh to measure the SOC concentration. The oil bath-K2Cr2O7 titration method was used to determine the SOC concentration, and the cutting ring (100 cm3 volume) method was used to determine soil bulk density [33]. The remaining part was used to analyze the proportion of soil aggregates with different particles via the wet-sieving method. The soils were transferred to a nest of sieves, including 2 mm, 0.25 mm, and 0.053 mm sieves, to separate the >2, 0.25–2, 0.053–0.25, and <0.053 mm soil aggregates, and 360 samples (3 sites × 3 DBH ranges × 2 profiles × 5 layers × 4 aggregate sizes) were obtained through this method. The aggregates of all sizes obtained were dried at 60 °C for 24 h in an oven and then weighed. Details of the procedure have been described by Cambardella and Elliott [34].

2.3. Data Analysis

R0.25 (the proportion of >0.25 mm soil aggregate), MWD, GMD, D, and SOC stock in total and different soil aggregates were calculated using the following formulas:
R 0.25 = 1 M X < 0.25 M T
where MX < 0.25 represents the weight of <0.25 mm aggregates, and MT represents the total weight of the soil aggregate.
M W D = i = 1 n x i × w i G M D = exp [ i = 1 n w i × ln x i i = 1 n w i ]
where n represents the number of separated aggregate, wi represents the proportion (%) of aggregates of the ith size in the total sample, and xi represents the mean diameter of each aggregate fraction (mm) [35].
D = 3 lg ( W ( δ < d i ¯ ) / W 0 ) lg ( d i ¯ / d ¯ max )
where D represents the fractal dimension, δ represents yard measure, d i ¯ is the average value of soil particle diameter between di and di+1 (i = 1, 2,…), W ( δ < d i ¯ ) represents the cumulative mass of aggregate particles with sizes δ < d i ¯ , and W0 is the total mass of different sizes of soil aggregate particles [20].
SOC stock = 0.2 × α × BD × (1 − Vgravel)
where 0.2 represents the thickness of the soil layer (0.2 m), α represents the SOC concentration (g/kg) in total soil or soil aggregates with different particle sizes, BD represents the soil bulk density (Mg/m3) of the farmland or poplar plantation in different soil layers, and Vgravel represents the proportion of gravel.
In this study, the relative change in all variables was calculated using farmland as the control. A paired-samples T test was used to determine the significance of the differences in soil-aggregate-associated indexes between poplar shelterbelt and adjoining farmland in five layers. Pearson correlation analysis was conducted to confirm the effect of the distribution and stability of aggregate on SOC content and stock of total soils. The relationship between total SOC content (stock) and aggregate-associated SOC content (stock) was also examined using this method. The level of significant differences was p < 0.05. SPSS 22.0 was used for the statistical analysis of the data.

3. Results

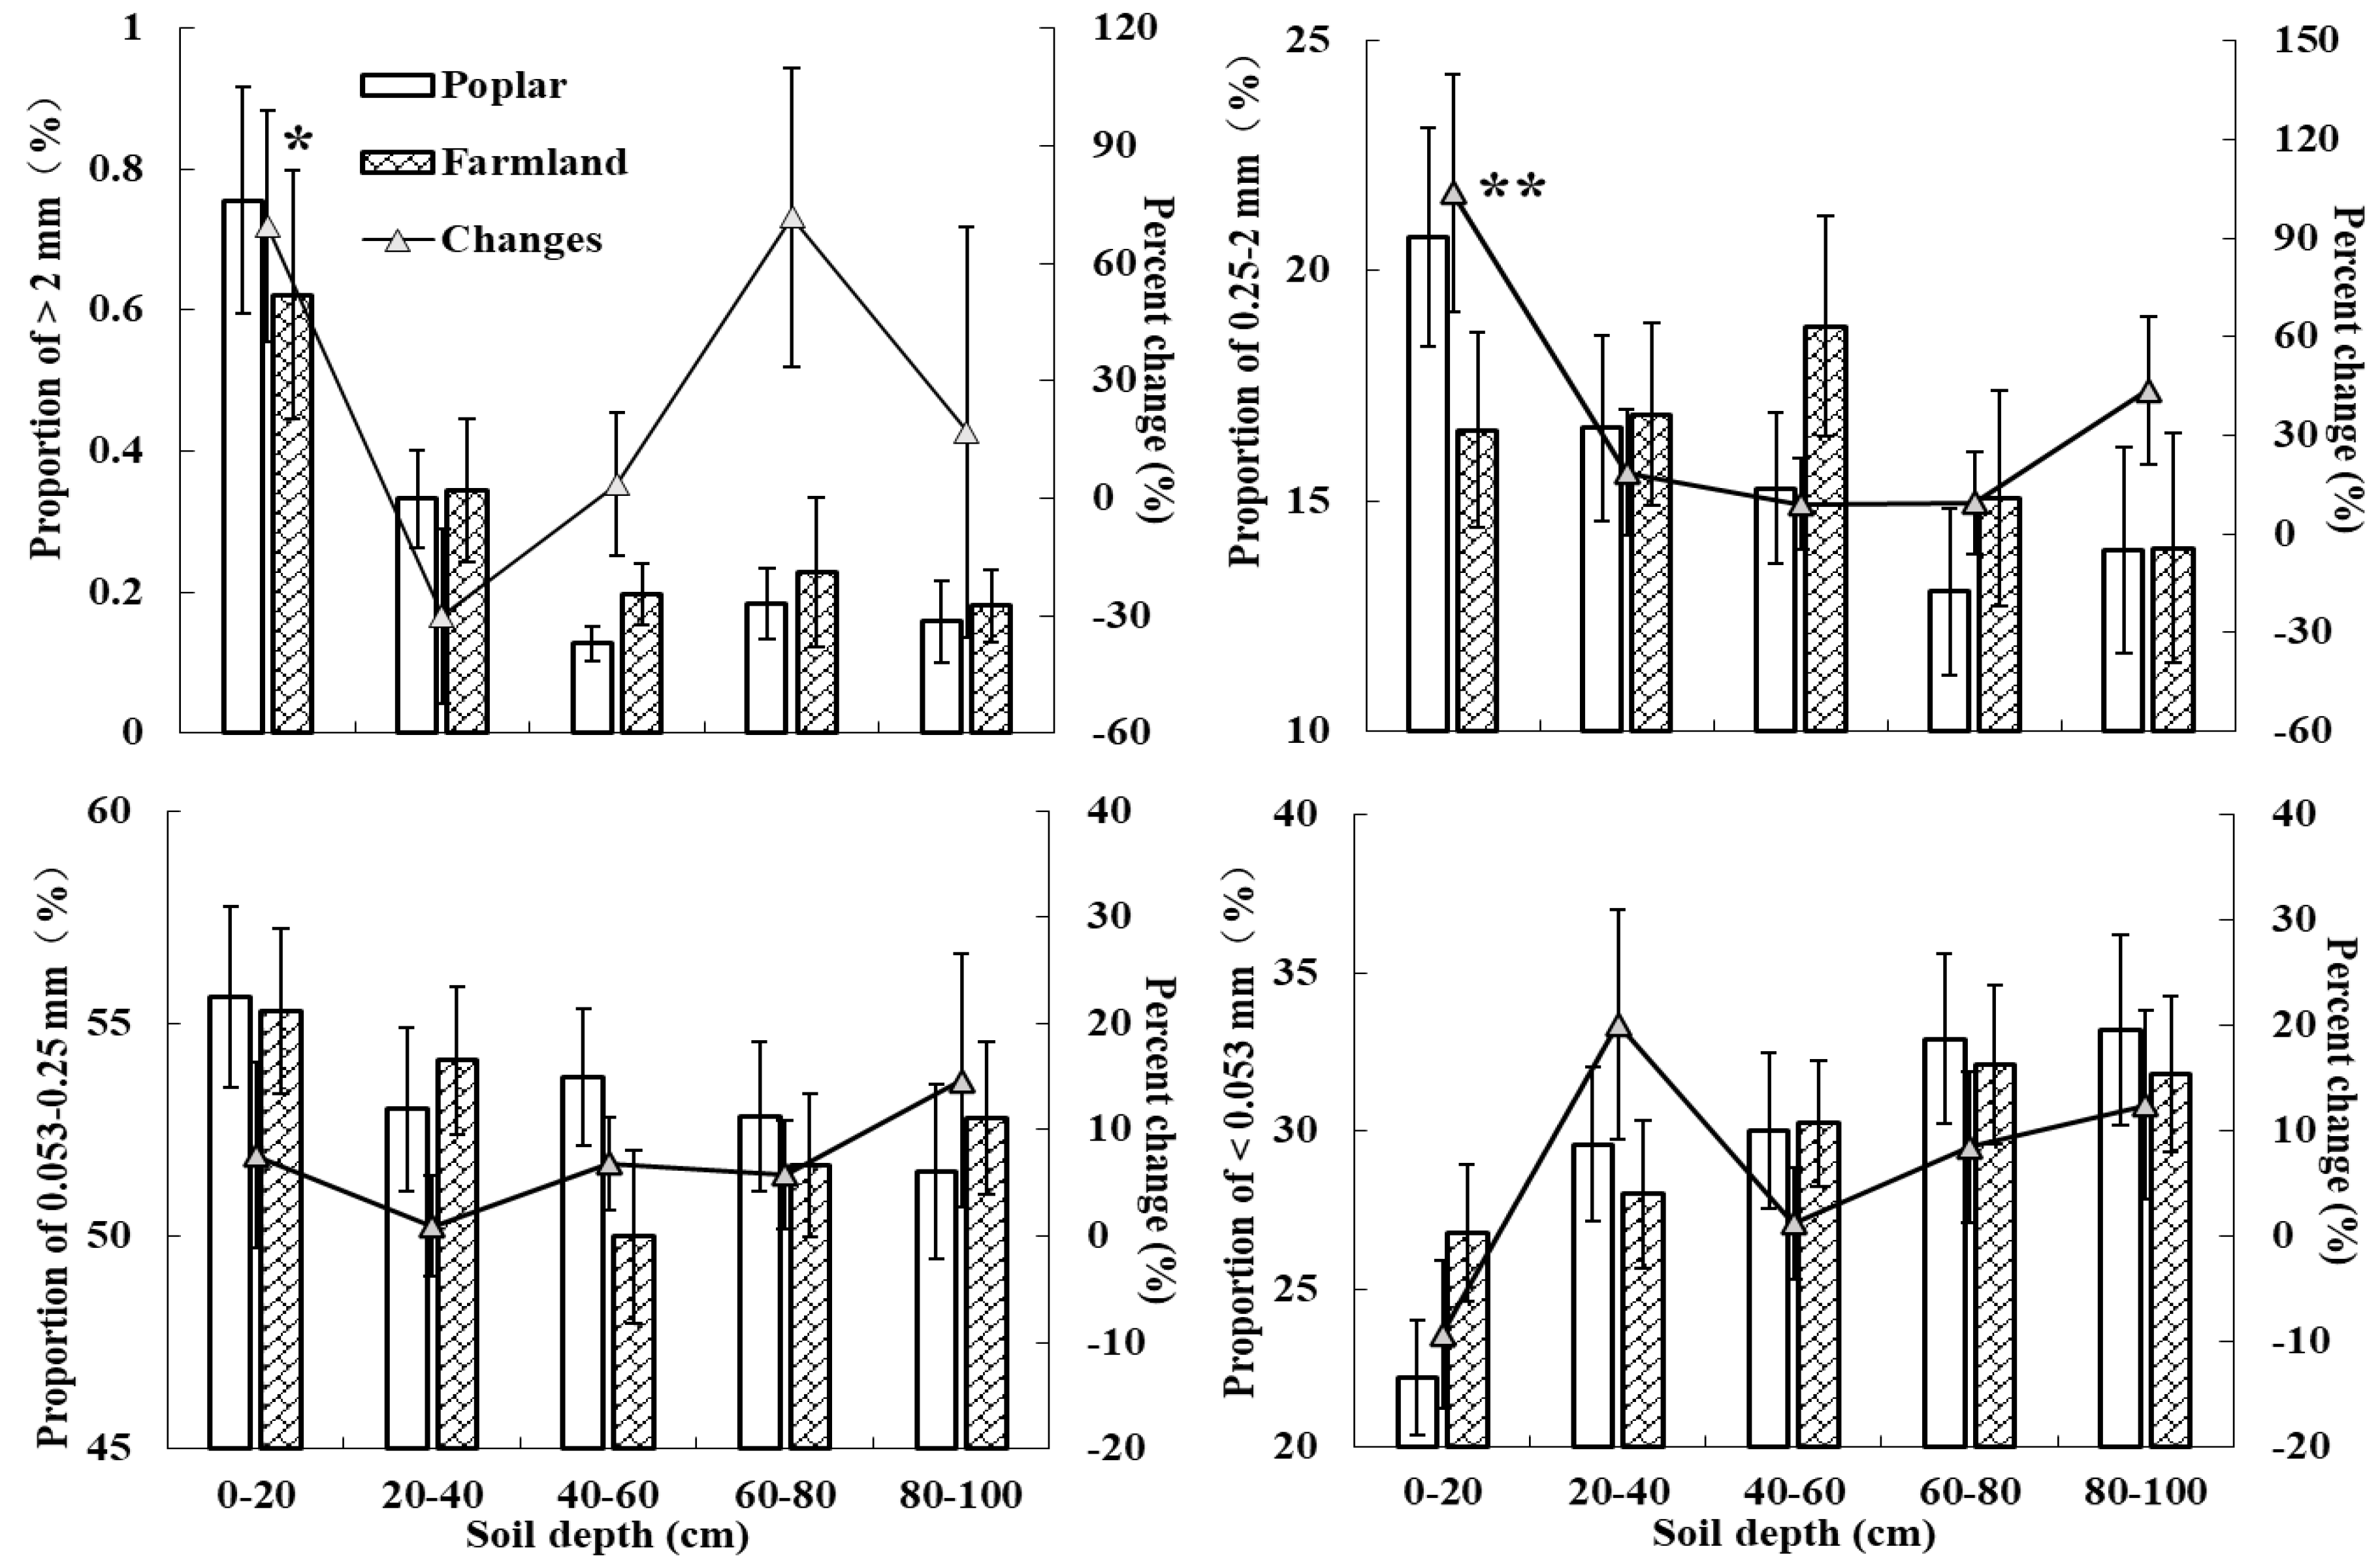
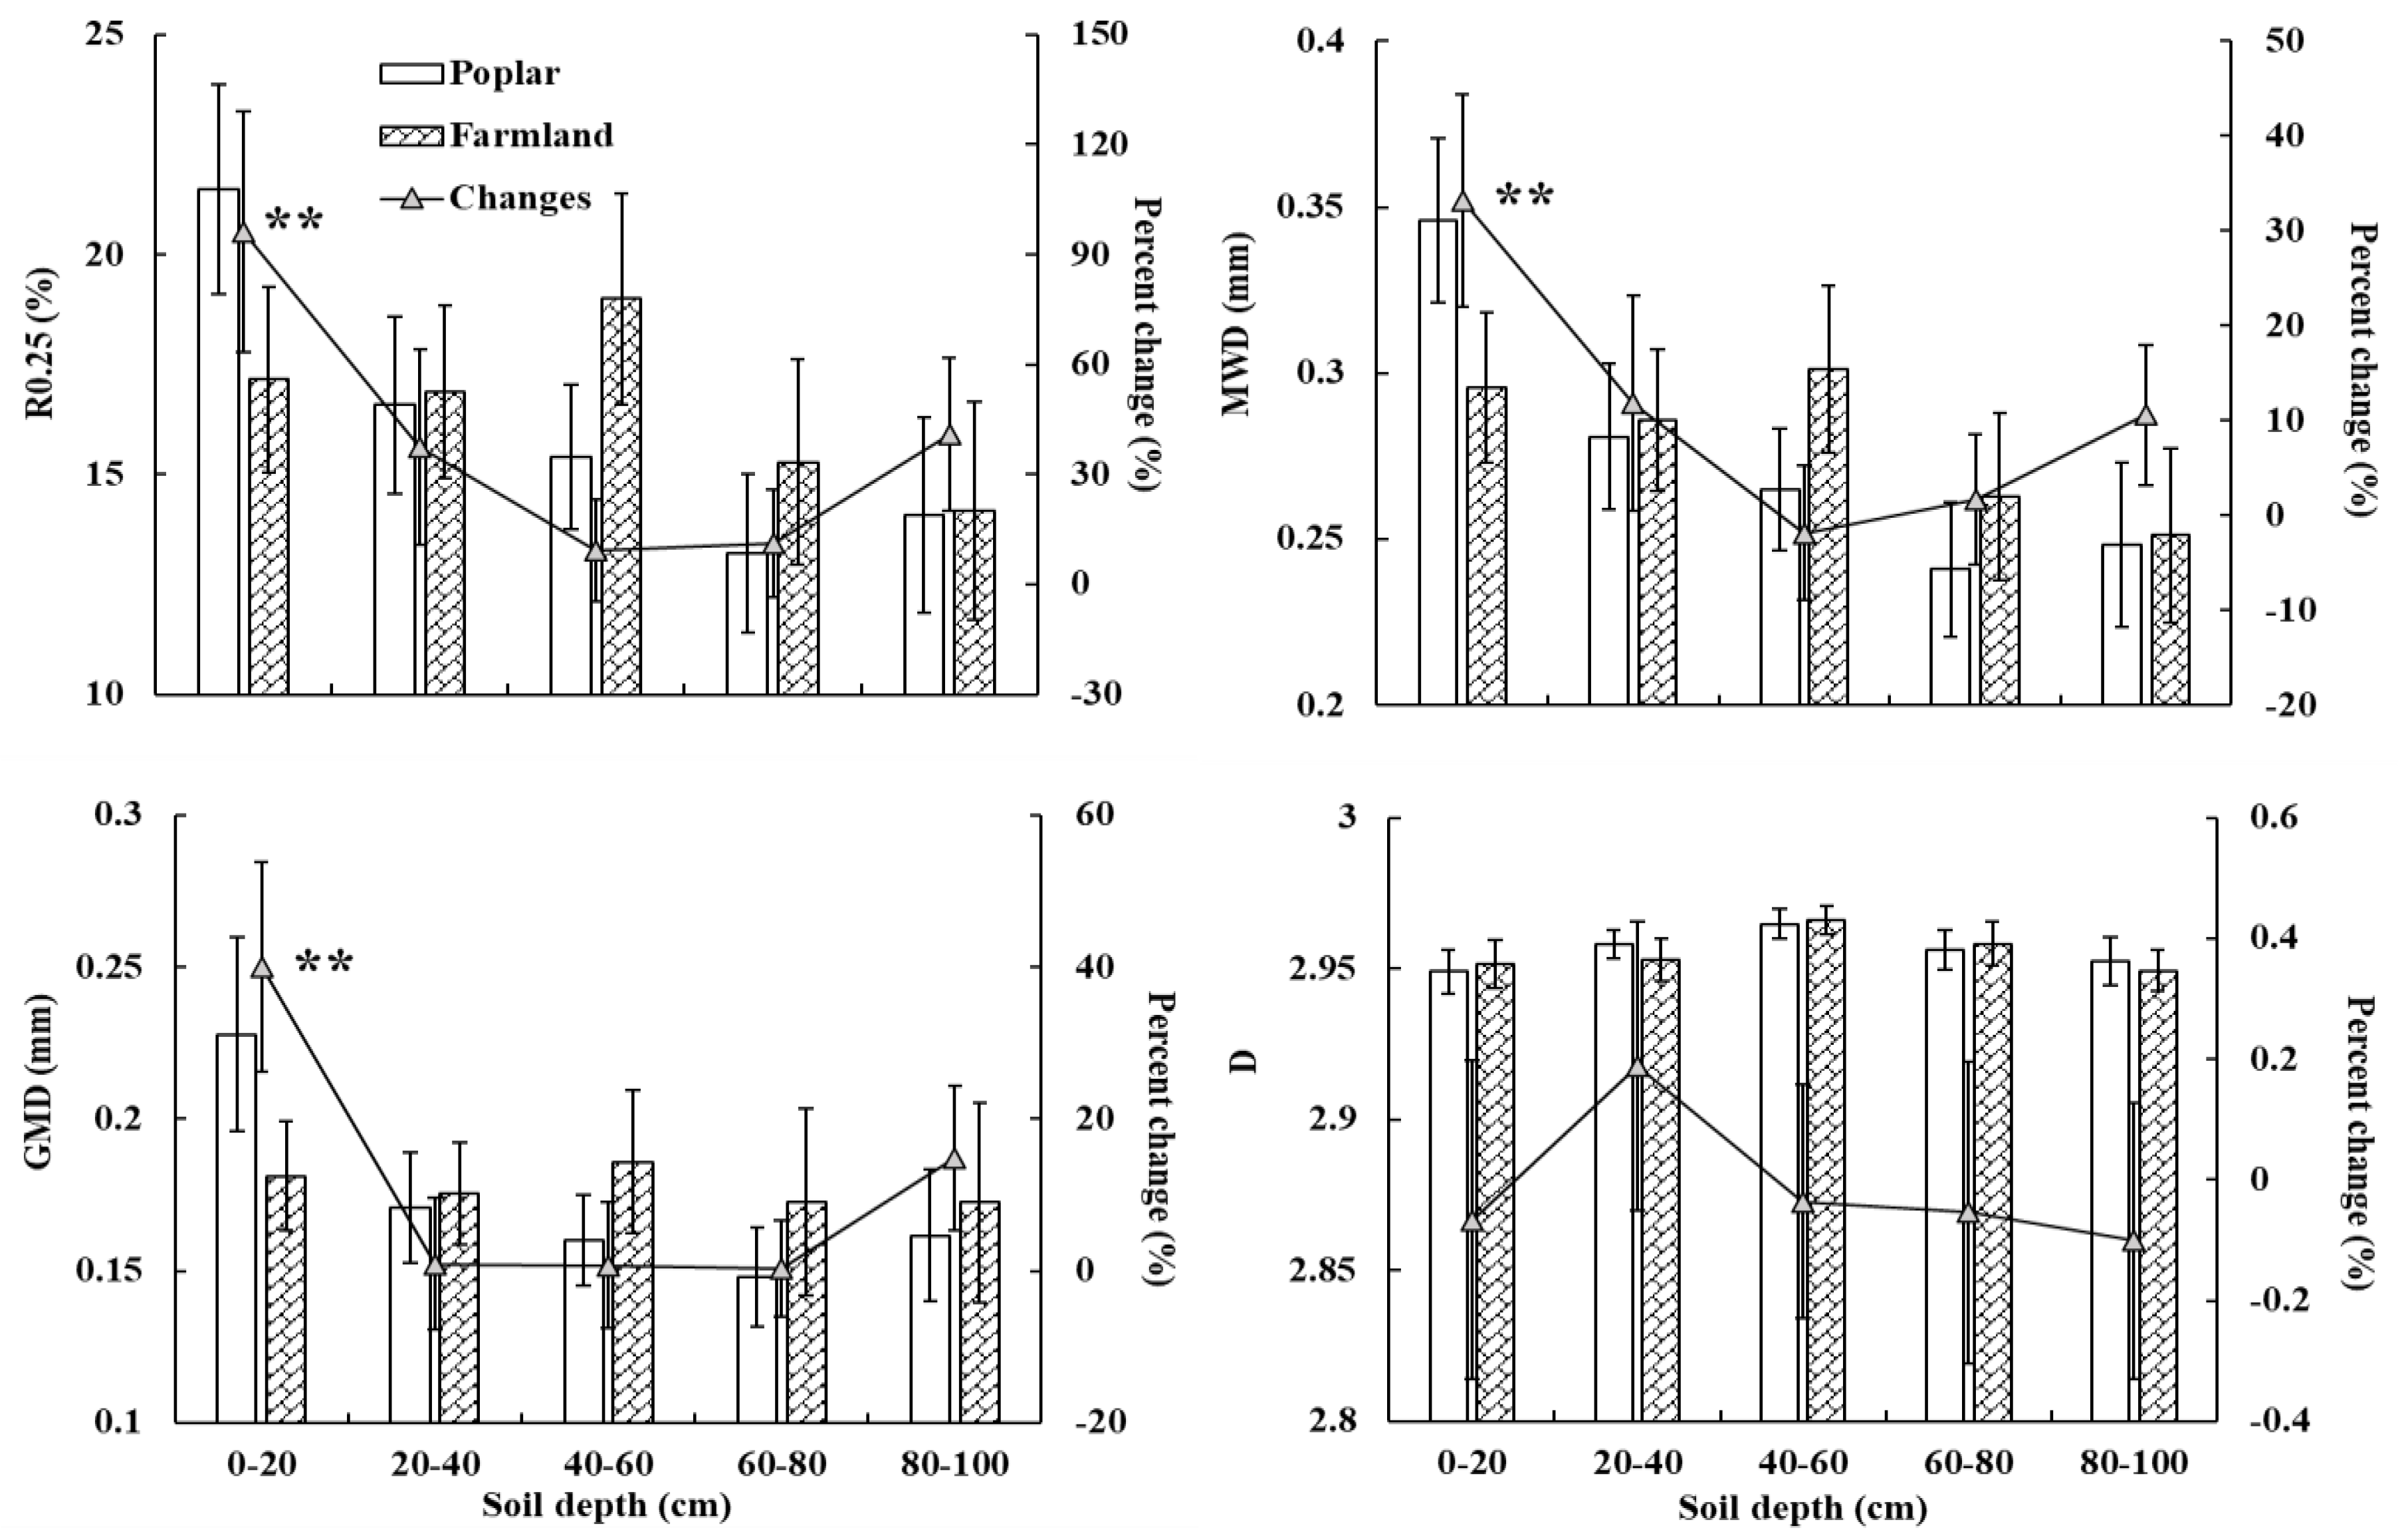
3.1. Proportion and Stability of the Soil Aggregates

Shelterbelt construction increased the proportion of aggregates at the five depths, except for the >2 mm size class at 20–40 cm and <0.053 mm class at 0–20 cm. The changes in the proportion of >2 mm aggregates increased by 3.67%–71.69% at 0–20 cm, 46–60 cm, 60–80 cm, and 80–100 cm, with a significant difference only found at 0–20 cm (p < 0.05). The changes in the proportion of >0.25–2 mm and 0.053–0.25 mm aggregates increased by 8.99%–103.81% and 0.96%–14.60% at the five depths, respectively, with a significant difference only found in the >0.25–2 mm size class at 0–20 cm (p < 0.001). The proportion of <0.053 mm aggregates increased by 1.25%–20.14% at the 20–40 cm, 46–60 cm 60–80 cm, and 80–100 cm depths and decreased by 9.27% at 0–20 cm (Figure 2).
The shelterbelt-induced changes in R0.25, MWD, and GMD significantly increased by 96.3%, 33.2%, and 40.0%, respectively, in the 0–20 cm soil depth following afforestation (p < 0.001) (Figure 3); however, the differences were not significant in the other four soil layers between the poplar shelterbelts and farmland. The change in the value of D was weak, and no significant differences were found in the five depths following poplar shelterbelt establishment (Figure 3).

3.2. SOC in Total Soil

The SOC concentration and stock of total soil increased by 7.12%–19.86% and 1.11%–14.48% at five depths, respectively, with a significant difference only observed in shelterbelt-induced SOC concentration at the 0–20 cm depth (p < 0.05) (Figure 4).

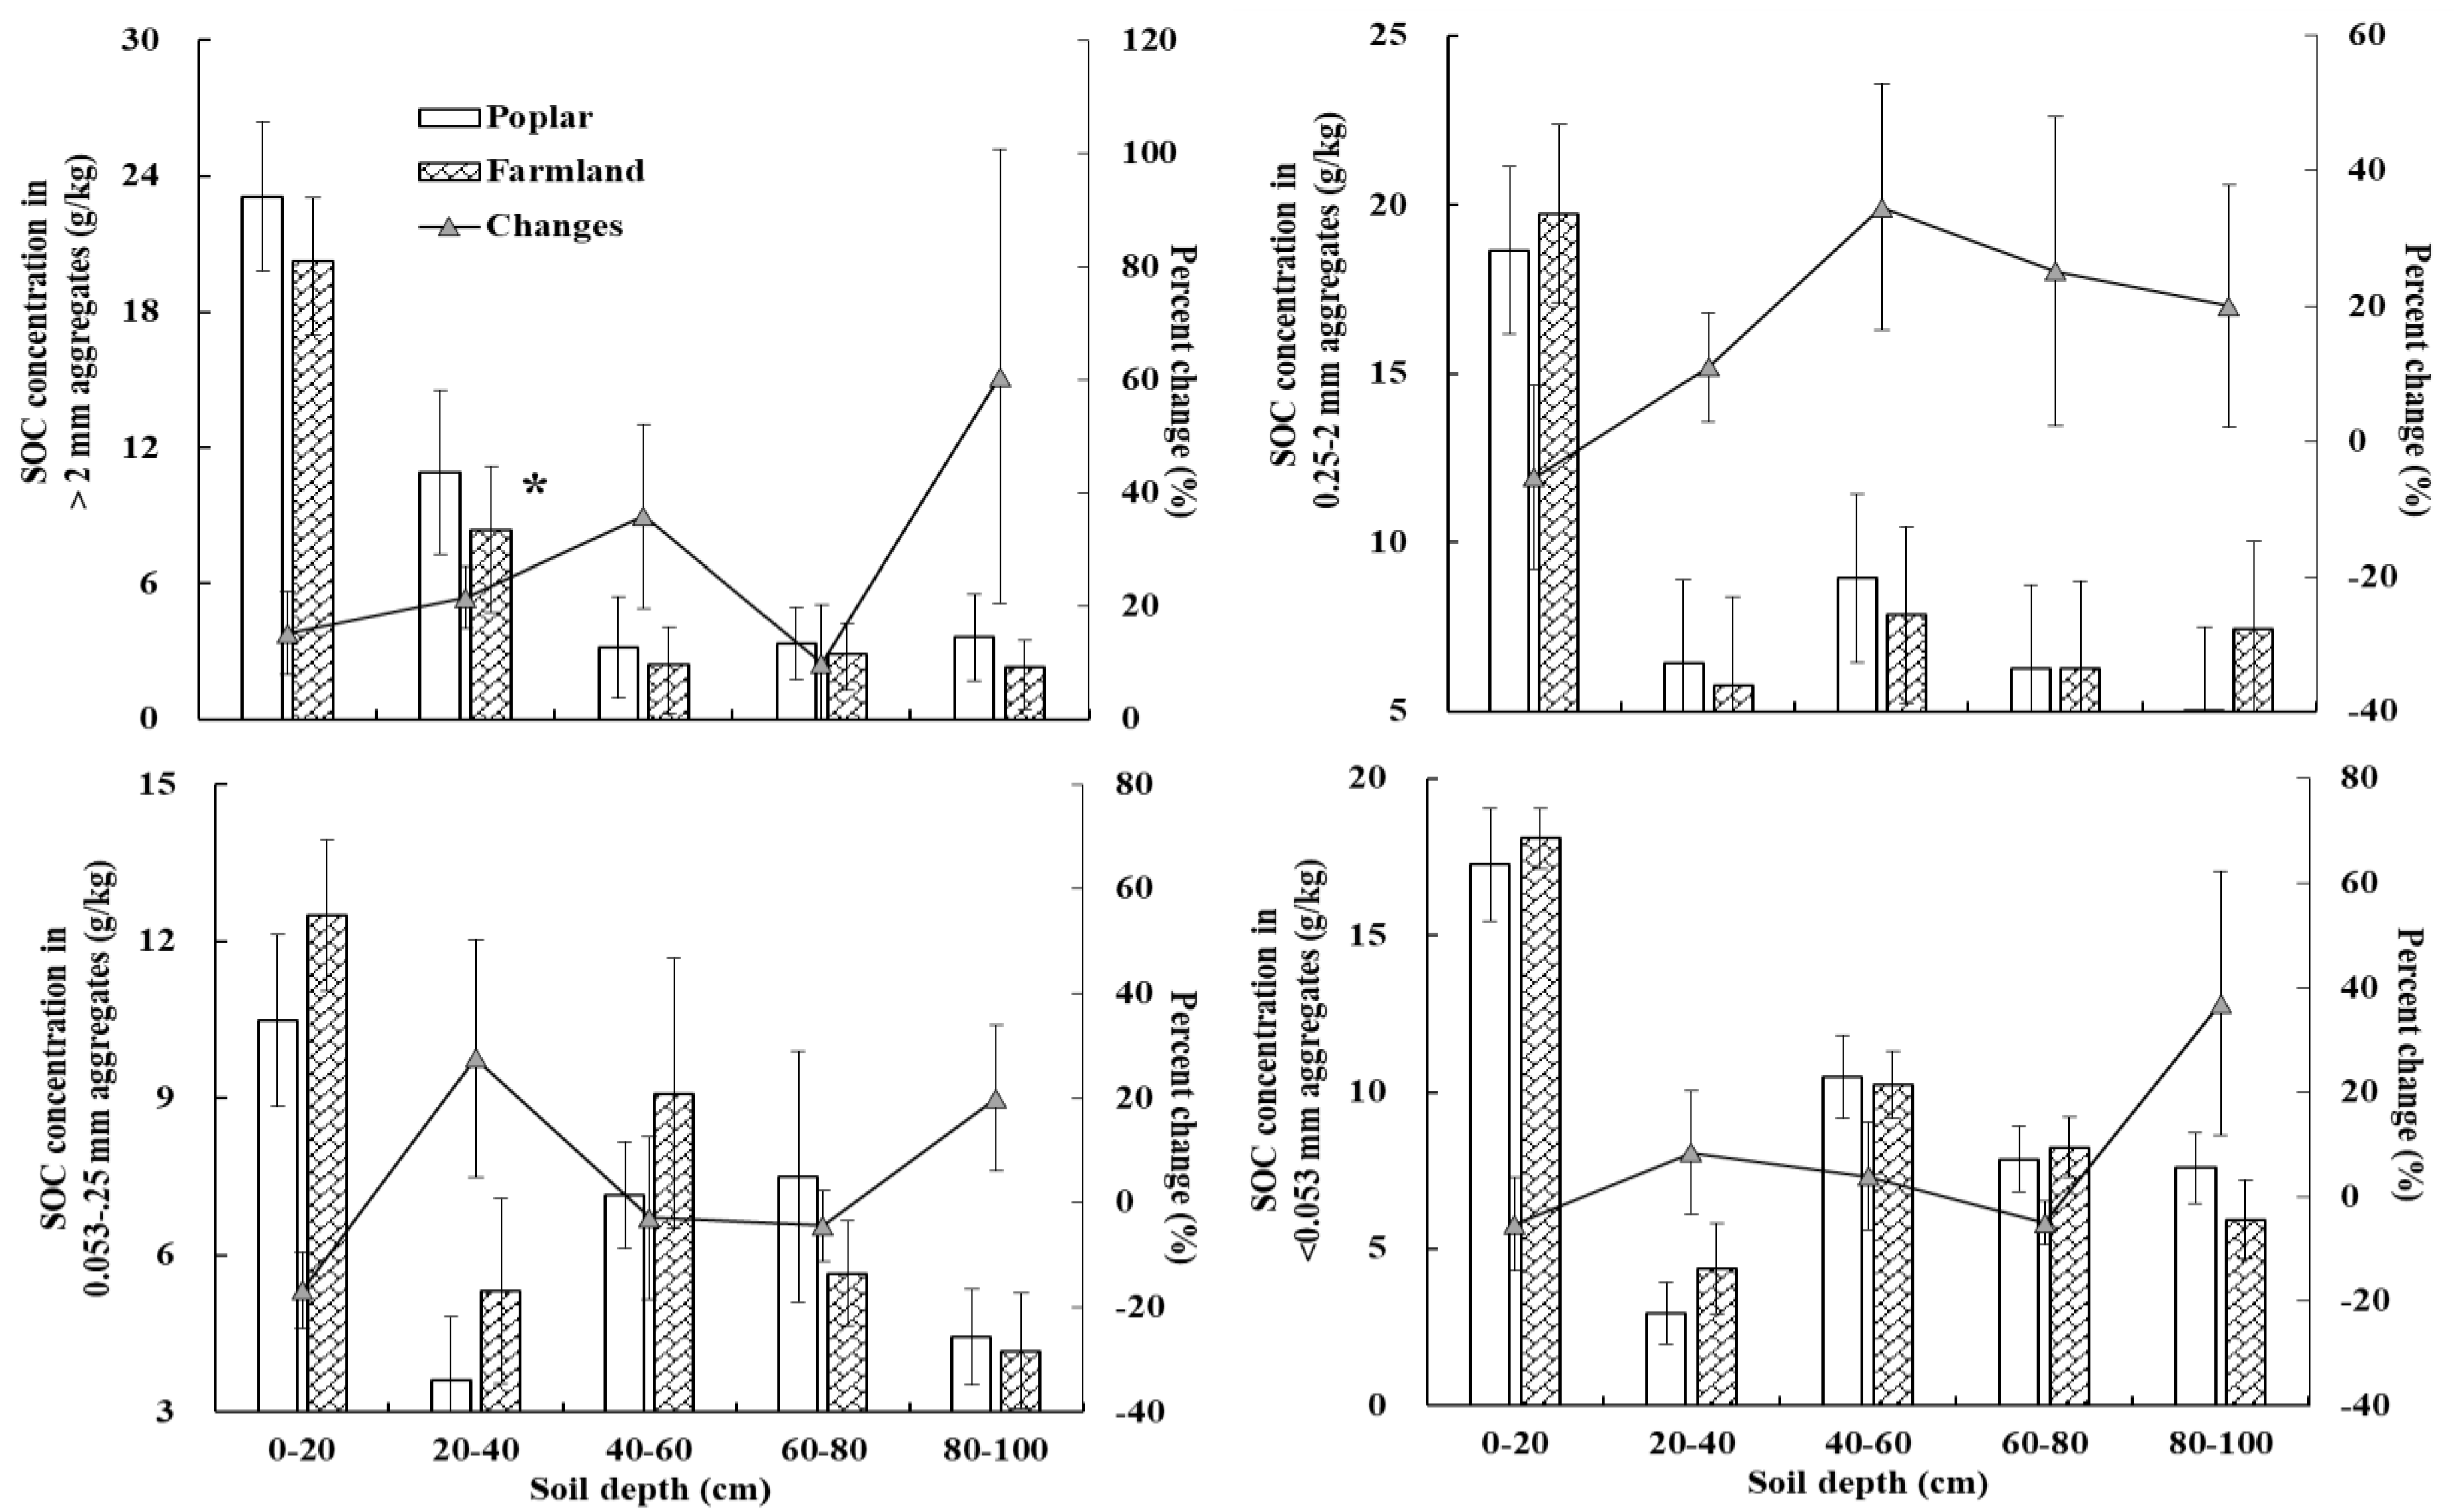
3.3. SOC in Aggregates

The SOC concentration in >2 mm aggregates increased by 9.80%–60.56% at five depths, and a significant increase was found in the poplar shelterbelt compared to the farmland at the 20–40 cm depth (p < 0.05) (Figure 5). The SOC concentration in the >0.25–2 mm aggregates increased by 10.98%–34.64% at 20–80 cm depths and decreased by 5.31% at 0–20 cm. The changes in the SOC concentration in >0.053–0.25 mm and <0.53 mm aggregates varied at different depths. For example, the SOC concentration in >0.053–0.25 mm aggregates increased by 27.55% and 19.97% at 20–40 cm and 80–100 cm and decreased by 2.85%–16.78% at 0–20 cm, 40–60 cm, and 60–80 cm, respectively. The SOC concentration in <0.053 mm aggregates increased by 3.91–36.96% at 20–40 cm, 40–60 cm, and 80–100 cm and decreased by 5.01% and 5.33% at 0–20 cm and 60–80 cm, respectively (Figure 5).
Compared to farmland, the shelterbelt-induced SOC stock in the >2 mm, 0.25–0.053 mm, and <0.053 mm aggregates increased by 1.14%–59.80%, 0.81%–23.23%, and 0.06%–31.93% at the 0–100 cm depths, respectively; however, a significant increase was only observed in the >2 mm aggregates at 20–40 cm (p < 0.05) (Figure 6). The SOC stock in >0.25–2 mm aggregates increased by 0.94%–29.33% at 0–80 cm and decreased by 28.95% at 80–100 cm; no significant differences were found at all depths.

3.4. Relationships between SOC in Total Soils and Aggregates

A significantly positive correlation was found between the SOC content and stock in total soils and the proportion of >2 mm soil aggregates (p < 0.001), while a significantly negative correlation was found between the SOC concentration and stock in total soils and the D value (p < 0.01) (Table 2). No significant correlations were found between the SOC content (stock) in total soils and the proportion of 0.25–2 mm, 0.053–0.25 mm, <0.053 mm soil aggregates, and R0.25, MWD, and GMD (Table 2).
The SOC content in total soils was positively correlated with the aggregate-associated SOC content in the different size classes (Figure 7). The SOC content in the total soil was more dependent on the SOC contents in the >2 mm and 0.25–2 mm size classes than that in 0.25–0.053 mm and <0.053 mm soil aggregates. For example, the R2 values of the linear equations between total SOC content and SOC content in >2 mm or 0.25–2 mm aggregates were 0.89 and 0.81, while those between the total SOC content and SOC content in the 0.25–0.053 mm and <0.053 mm soil aggregates were 0.71 and 0.79 (Figure 7). Similarly, a significantly positive correlation was found between the SOC stock in total soils and the SOC stocks in aggregates (Figure 7). The SOC stock in total soils was more dependent on the SOC stocks in the >2 mm and 0.25–2 mm (R2 = 0.87, R2 = 0.81) aggregates than on those in the 0.25–0.053 mm and <0.053 mm (R2 = 0.77, R2 = 0.68) aggregates (Figure 7).

4. Discussion

4.1. Improvement of Soil Structure and Stability following Afforestation

In the present study, significant increases in the proportions of >2 mm and 0.25–2 mm soil aggregates and the values of R0.25, MWD, and MGD were observed at a soil depth of 0–20 cm following afforestation on abandoned farmland (Figure 2 and Figure 3), ultimately supporting the hypothesis (1) that afforestation on farmland will increase the proportion of >0.25 mm soil aggregates and the stability of soil structure. Various studies revealed that soil structural stability improved upon the enhancement of the proportion of soil aggregates > 0.25 mm in diameter [36]. Further, the higher numbers of MWD and GMD represented less fragmentation and increased stability of the soil aggregates [37,38]. This improvement might be attributed to the increase in root biomass and litter inputs, which contribute to the aggregation of soil particles, as these soils are not tilled compared to those of farmland [39,40]. Vegetation cover plays a key role in the formation of soil organic matter and enhances soil stability [41]. The increased biomass from plants increases the input of soil organic matter following afforestation [42]. In this study, a poplar shelterbelt increased the SOC concentration in 0–20 cm (Figure 4), and there were remarkable correlations between SOC and >2 mm soil aggregates, as outlined in Table 2. Similar relationships were found in other studies [43,44]. In contrast, the breaking up of the bigger aggregates and decreases in the stability of soil aggregates have been widely reported due to deforestation [45,46].
Five soil depths were considered in the 1 m profile for this study. However, significant increases in >0.25 mm aggregate distribution and stability indexes, for example, R0.25, MWD, and MGW, were increased by 96.3%, 33.2%, and 40.0% at the 0–20 cm depth (Figure 2 and Figure 3). A heterogeneous improvement in the soil aggregate index was discovered in different layers following afforestation, and more notable differences in soil aggregate particle distribution, MWD, and GMD were found in the topsoil than the deeper layers [9]. Our results showed that the soil aggregate structure and the stability of topsoil (0–20 cm) were sensitive following the conversion of farmland into shelterbelts; this is because afforestation mainly affects the processes of soil aggregation in the topsoil [38,47], and the input of organic matter from litter and the products of microbial decomposition are directly received at the uppermost layer [48,49]. Some organic by-products play a critical role in the formation of soil aggregates and the improvement of soil structure stability [38,50].

4.2. Accumulation of SOC in Total Soil and Aggregates

The importance of SOC has been recognized by many scientists [2,4], and afforestation can accumulate SOC in the total and aggregates soil, as shown in this study. The SOC concentration in total soil significantly increased by 13.3% at the 0–20 cm depth following shelterbelt establishment (p < 0.05) (Figure 4). SOC in the topsoil is considered to be more vulnerable to land use type than deep soil [24,51]. Wang et al. [8] observed that larch plantations can accumulate SOC in the top 20 cm soil layer at a rate ranging from 57.9 to 139.4 gm−2yr−1; however, deep layers are very little affected by larch trees in northeastern China.
The physical preservation of SOC via soil aggregates is a key mechanism in SOC sequestration [23]. According to our results, shelterbelts enhanced SOC concentration and stock by 21.5% and 18.7%, respectively, in >2 mm and 0.25–2 mm soil aggregates in the 20–40 cm depth (p < 0.05) (Figure 5 and Figure 6). The accumulation of SOC in >0.25 mm aggregates by afforestation was observed in other studies [19,52]. The accumulation was mainly due to the input of new OC from litterfalls, root biomass, and dead microorganisms [53], which reduced the loss of SOC in aggregates owing to mineralization [46]. Among them, the relatively shallow root system of poplars is an important factor that should be considered [8]. According to our survey (data not shown), a 28 mg cm−3 poplar root system was located at a 1 m depth, and 95% of the root was distributed in the 0–60 cm soil layer, especially the 20–40 cm layer (57%). Based on the aggregate hierarchy theory [54], the adsorption of small particles into the organic skeleton contributes to the formation of large aggregates [55,56], which can physically protect SOC from mineralization and microbial decomposition [57].

4.3. Relationship of SOC in Total Soil and Aggregate-Associated SOC

The enhancement in SOC in total soils was dependent on the increase in aggregate-associated SOC (Figure 7). The contributions of aggregate-associated SOC to the SOC accumulation in total soil following afforestation on farmland have been reported by many scientists [19,52]. Some studies revealed that SOC accumulation depended on the >2 mm soil aggregates [58] and 0.25–2 mm soil aggregates [15,59], while according to other studies, SOC accumulation was mainly determined by the 0.053–0.25 mm soil aggregates [16]. Based on our findings, the SOC stock in total soils was more dependent on the SOC stock in the larger-size aggregates (>0.25 mm) than those in the smaller-size aggregates (<0.25 mm) (Figure 6). These observations are supported the hypothesis that the total SOC is dominated by aggregate-associated SOC, with larger aggregates having a greater contribution. Some similar conclusions were supported by the findings that total SOC was controlled by the SOC in bigger aggregates in the forest [21,60], and the decrease in SOC in total soils was mainly due to the decrease in SOC in macroaggregate following the change from natural forest to farmland [52]. These contributions of the larger soil aggregates to SOC accumulation are related to the influences of plant roots and fungal hyphae-rendered cementing [61], which stimulate the root exudation rate [62].
An increase in total SOC content and stock exhibited a notable positive correlation with the proportion of >2 mm aggregates and a notable negative correlation with the D value. By integrating the contribution of SOC in the aggregate and proportions of the aggregate to the enhancement of total SOC, SOC accumulation in total soils was found to be controlled by not only the proportion of aggregates in each size class and the D value, but also the SOC content and stock in the soil aggregates [63,64]. In brief, our results emphasize the important role of increased >2 mm aggregate proportion and the larger aggregate-associated SOC content in total SOC accumulation.

5. Conclusions

Our results revealed that poplar shelterbelts significantly enhanced the distribution of >2 mm and 0.25–2 mm soil aggregates, R0.25, MWD, and GMD in the 0–20 cm depth; shelterbelt establishment on farmland improved soil stability and structure, especially those of the topsoil. The total SOC concentration in the 0–20 cm layers and the aggregate-associated SOC concentration and stock in >2 mm aggregates at 20–40 cm significantly increased following afforestation. In the 1 m soil layer, the increase in total SOC was mainly dependent on the aggregate-associated SOC and the proportion of >2 mm aggregates.

Author Contributions

Q.W. and H.W. designed the research, supervised the data analysis, revised the manuscript, provided the research fund, and finalized the manuscript. W.W. designed the research and provided the analysis method. Z.Z. and G.D. collected the field data, performed the data analysis, and provided research method guidance. Y.W. performed the data fusion analysis, wrote the manuscript, and prepared the figures. All authors have read and agreed to the published version of the manuscript.

Funding

This work was supported by the National Natural Science Foundation of China (WHM: Grant No. 41877324; WWJ: Grant No. 41730641).

Data Availability Statement

Not Applicable.

Conflicts of Interest

The authors declare no conflict of interest.

References

  1. Lal, R. Soil carbon sequestration to mitigate climate change. Geoderma 2004, 123, 1–22. [Google Scholar] [CrossRef]
  2. Zhang, X.; Chen, S.; Yang, Y.; Wang, Q.; Wu, Y.; Zhou, Z.; Wang, H.; Wang, W. Shelterbelt farmland-afforestation induced SOC accrual with higher temperature stability: Cross-sites 1 m soil profiles analysis in NE China. Sci. Total Environ. 2022, 814, 151942. [Google Scholar] [CrossRef] [PubMed]
  3. IPCC. Climate Change 2007: The Physical Science Basis; Cambridge University Press: Cambridge, UK, 2007. [Google Scholar]
  4. Briedis, C.; Baldock, J.; de Moraes Sá, J.C.; dos Santos, J.B.; McGowan, J.; Milori, D.M. Organic carbon pools and organic matter chemical composition in response to different land uses in southern Brazil. Eur. J. Soil Sci. 2021, 72, 1083–1100. [Google Scholar] [CrossRef]
  5. Deng, L.; Liu, G.B.; Shangguan, Z.P. Land-use conversion and changing soil carbon stocks in China’s ‘Grain-for-Green’Program: A synthesis. Glob. Chang. Biol. 2014, 20, 3544–3556. [Google Scholar] [CrossRef]
  6. Basak, N.; Mandal, B.; Datta, A.; Kundu, M.C.; Rai, A.K.; Basak, P.; Mitran, T. Stock and stability of organic carbon in soils under major agro-ecological zones and cropping systems of sub-tropical India. Agric. Ecosyst. Environ. 2021, 312, 107317. [Google Scholar] [CrossRef]
  7. Zhu, J.J. A review of the present situation and future prospect of science of protective forest. Chin. J. Plant Ecol. 2013, 37, 872–888. [Google Scholar] [CrossRef]
  8. Wang, W.J.; Qiu, L.; Zu, Y.G.; Su, D.X.; An, J.; Wang, H.Y.; Zheng, G.Y.; Wei, S.; Chen, X.Q. Changes in soil organic carbon, nitrogen, pH and bulk density with the development of larch (Larix gmelinii) plantations in China. Glob. Chang. Biol. 2011, 17, 2657–2676. [Google Scholar]
  9. Wang, X.; Zhong, Z.; Li, W.; Liu, W.; Han, X. Effects of Robinia pseudoacacia afforestation on aggregate size distribution and organic C dynamics in the central Loess Plateau of China: A chronosequence approach. J. Environ. Manag. 2020, 268, 110558. [Google Scholar] [CrossRef]
  10. Mao, R.; Zeng, D.H.; Hu, Y.L.; Yang, L.D. Soil organic carbon and nitrogen stocks in an age-sequence of poplar stands planted on marginal agricultural land in Northeast China. Plant Soil 2010, 332, 277–287. [Google Scholar] [CrossRef]
  11. Hou, G.; Delang, C.O.; Lu, X.; Gao, L. A meta-analysis of changes in soil organic carbon stocks after afforestation with deciduous broadleaved, sempervirent broadleaved, andconifer tree species. Ann. For. Sci. 2020, 77, 92. [Google Scholar] [CrossRef]
  12. Davis, M.; Nordmeyer, A.; Henley, D.; Watt, M. Ecosystem carbon accretion 10 years after afforestation of depleted subhumid grassland planted with three densities of Pinus nigra. Glob. Chang. Biol. 2007, 13, 1414–1422. [Google Scholar] [CrossRef]
  13. Ritter, E. Carbon, nitrogen and phosphorus in volcanic soils following afforestation with native birch (Betula pubescens) and introduced larch (Larix sibirica) in Iceland. Plant Soil 2007, 295, 239–251. [Google Scholar] [CrossRef]
  14. Chen, L.; Xiang, W.; Wu, H.; Ouyang, S.; Lei, P.; Hu, Y.; Ge, T.; Ye, J.; Kuzyakov, Y. Contrasting patterns and drivers of soil fungal communities in subtropical deciduous and evergreen broadleaved forests. Appl. Microbiol. Biotechnol. 2019, 103, 5421–5433. [Google Scholar] [CrossRef] [PubMed]
  15. Deng, L.; Kim, D.G.; Peng, C.H.; Shangguan, Z.P. Controls of soil and aggregate-associated organic carbon variations following natural vegetation restoration on the Loess Plateau in China. Land Degrad. Dev. 2018, 29, 3974–3984. [Google Scholar] [CrossRef]
  16. Pan, J.; Wang, J.; Zhang, R.; Tian, D.; Cheng, X.; Wang, S.; Chen, C.; Yang, L.; Niu, S. Microaggregates regulated by edaphic properties determine the soil carbon stock in Tibetan alpine grasslands. Catena 2021, 206, 105570. [Google Scholar] [CrossRef]
  17. Wei, X.; Shao, M.; Gale, W.J.; Zhang, X.; Li, L. Dynamics of aggregate-associated organic carbon following conversion of forest to cropland. Soil Biol. Biochem. 2013, 57, 876–883. [Google Scholar] [CrossRef]
  18. Xia, W.Y.; Shan, R.L.; Fang, F.N.; Hua, S.Z. Aggregate stability and associated organic carbon and nitrogen as affected by soil erosion and vegetation rehabilitation on the Loess Plateau. Catena 2018, 167, 257–265. [Google Scholar]
  19. Wei, X.R.; Li, X.Z.; Jia, X.X.; Shao, M.G. Accumulation of soil organic carbon in aggregates after afforestation on abandoned farmland. Biol. Fertil. Soils 2013, 49, 637–646. [Google Scholar] [CrossRef]
  20. Chen, G.P.; Gao, Z.Y.; Zu, L.H.; Tang, L.L.; Shi, F.C. Soil aggregate characteristics and stability of soil carbon stocks in a Pinus tabulaeformis plantation. New For. 2017, 48, 837–853. [Google Scholar] [CrossRef]
  21. Lan, J.C.; Long, Q.X.; Huang, M.Z.; Jiang, Y.X.; Hu, N. Afforestation-induced large macroaggregate formation promotes soil organic carbon accumulation in degraded karst area. For. Ecol. Manag. 2022, 505, 119884. [Google Scholar] [CrossRef]
  22. Caravaca, F.; Lax, A.; Albaladejo, J. Aggregate stability and carbon characteristics of particle-size fractions in cultivated and forested soils of semiarid Spain. Soil Tillage Res. 2004, 78, 83–90. [Google Scholar] [CrossRef]
  23. Wei, C.; Wang, Q.; Ren, M.; Pei, Z.; Lu, J.; Wang, H.; Wang, W. Soil aggregation accounts for the mineral soil organic carbon and nitrogen accrual in broadleaved forests as compared to that of coniferous forests in Northeast China: Cross-sites and multiple species comparisons. Land Degrad. Dev. 2021, 32, 296–309. [Google Scholar] [CrossRef]
  24. Grandy, A.S.; Robertson, G.P. Land-Use Intensity Effects on Soil Organic Carbon Accumulation Rates and Mechanisms. Ecosystems 2007, 10, 58–73. [Google Scholar] [CrossRef]
  25. Wei, X.; Shao, M.; Gale, W.; Li, L. Global pattern of soil carbon losses due to the conversion of forests to agricultural land. Sci. Rep. 2014, 4, 4062. [Google Scholar] [CrossRef]
  26. Zhong, Z.; Chen, Z.; Xu, Y.; Ren, C.; Yang, G.; Han, X.; Ren, G.; Feng, Y. Relationship between soil organic carbon stocks and clay content under different climatic conditions in central China. Forest 2018, 9, 598. [Google Scholar] [CrossRef]
  27. Liu, S.; Zhang, Z.B.; Li, D.M.; Hallett, P.D.; Zhang, G.L.; Peng, X.H. Temporal dynamics and vertical distribution of newly-derived carbon from a C3/C4 conversion in an Ultisol after 30-yr fertilization. Geoderma 2019, 337, 1077–1085. [Google Scholar] [CrossRef]
  28. Li, T.; Zhang, Y.; Bei, S.; Li, X.; Reinsch, S.; Zhang, H.; Zhang, J. Contrasting impacts of manure and inorganic fertilizer applications for nine years on soil organic carbon and its labile fractions in bulk soil and aggregates. Catena 2020, 194, 104739. [Google Scholar] [CrossRef]
  29. Gong, Z.T.; Zhang, G.L.; Chen, Z.C. Pedogenesis and Soil Taxonomy; Science Press: Beijing, China, 2007. [Google Scholar]
  30. Zhu, J.J.; Song, L. A review of ecological mechanisms for management practices of protective forests. J. For. Res. 2021, 32, 435–448. [Google Scholar] [CrossRef]
  31. Wu, Y.; Wang, W.J.; Wang, Q.; Zhong, Z.L.; Yao, Y.L. Impact of poplar shelterbelt plantations on surface soil properties in northeast China. Can. J. For. Res. 2018, 48, 559–567. [Google Scholar] [CrossRef]
  32. Wu, Y.; Wang, Q.; Wang, H.M.; Wang, W.J.; Han, S.J. Shelterbelt Poplar Forests Induced Soil Changes in Deep Soil Profiles and Climates Contributed Their Inter-site Variations in Dryland Regions, Northeastern China. Front. Plant Sci. 2019, 10, 220. [Google Scholar] [CrossRef]
  33. Bao, S. The Method of the Soil and Agriculture Chemical Analysis; China Agriculture Press: Beijing, China, 2000. [Google Scholar]
  34. Cambardella, C.A.; Elliott, E.T. Carbon and Nitrogen Distribution in Aggregates from Cultivated and Native Grassland Soils. Soil Sci. Soc. Am. J. 1993, 57, 1071–1076. [Google Scholar] [CrossRef]
  35. Kemper, W.D.; Rosenau, R.C. Aggregate stability and size distribution. Methods Soil Anal. Part 1 Phys. Mineral. Methods 1986, 5, 425–442. [Google Scholar]
  36. Ding, W.F.; Ding, D.S. The fractal features of soil granule structure before and after vegetation destruction on Loess Plateau. Geogr. Res. 2002, 21, 700–706. [Google Scholar]
  37. Liu, Y.; Zha, T.G.; Wang, Y.K.; Wang, G.M. Soil aggregate stability and soil organic carbon characteristics in Quercus variabilis and Pinus tabulaeformis plantations in Beijing area. Chin. J. Appl. Ecol. 2013, 24, 607–613. [Google Scholar]
  38. Zhong, Z.; Wang, X.; Zhang, X.; Zhang, W.; Yang, G. Edaphic factors but not plant characteristics mainly alter soil microbial properties along a restoration chronosequence of Pinus tabulaeformis stands on Mt. Ziwuling, China. For. Ecol. Manag. 2019, 453, 117625–117634. [Google Scholar] [CrossRef]
  39. Bronick, C.J.; Lal, R. Soil structure and management: A review. Geoderma 2005, 124, 3–22. [Google Scholar] [CrossRef]
  40. Qiu, L.P.; Wei, X.R.; Zhang, X.C.; Cheng, J.M.; Long, T. Soil organic carbon losses due to land use change in a semiarid grassland. Plant Soil 2012, 355, 299–309. [Google Scholar] [CrossRef]
  41. Bargali, K.; Bargali, S. Effect of size and altitude on soil organic carbon stock in homegarden agroforestry system in Central Himalaya, India. Acta Ecol. Sin. 2020, 40, 483–491. [Google Scholar] [CrossRef]
  42. Mayer, M.; Prescott, C.E.; Abaker, W.E.; Augusto, L.; Cécillon, L.; Ferreira, G.W.; James, J.; Jandl, R.; Katzensteiner, K.; Laclau, J.P.; et al. Tamm Review: Influence of forest management activities on soil organic carbon stocks: A knowledge synthesis. For. Ecol. Manag. 2020, 466, 118127. [Google Scholar] [CrossRef]
  43. Bhattacharyya, R.; Tuti, M.D.; Kundu, S.; Bisht, J.K.; Bhatt, J.C. Conservation Tillage Impacts on Soil Aggregation and Carbon Pools in a Sandy Clay Loam Soil of the Indian Himalayas. Soil Sci. Soc. Am. J. 2012, 76, 617–627. [Google Scholar] [CrossRef]
  44. Wang, S.; Li, T.; Zheng, Z. Tea plantation age effects on soil aggregate-associated carbon and nitrogen in the hilly region of western Sichuan, China. Soil Tillage Res. 2018, 180, 91–98. [Google Scholar] [CrossRef]
  45. Zhu, G.Y.; Shangguan, Z.P.; Deng, L. Variations in soil aggregate stability due to land use changes from agricultural land on the Loess Plateau, China. Catena 2021, 200, 105181. [Google Scholar] [CrossRef]
  46. Barreto, R.C.; Madari, B.E.; Machado, P.; Maddock, J.; Costa, A.R. The impact of soil management on aggregation, carbon stabilization and carbon loss as CO2 in the surface layer of a Rhodic Ferralsol in Southern Brazil. Agric. Ecosyst. Environ. 2009, 132, 243–251. [Google Scholar] [CrossRef]
  47. Guidi, C.; Magid, J.; Rodeghiero, M.; Gianelle, D.; Vesterdal, L. Effects of forest expansion on mountain grassland: Changes within soil organic carbon fractions. Plant Soil 2014, 385, 373–387. [Google Scholar] [CrossRef]
  48. Plaza-Bonilla, D.; Cantero-Martínez, C.; Viñas, P.; Álvaro-Fuentes, J. Soil aggregation and organic carbon protection in a no-tillage chronosequence under Mediterranean conditions. Geoderma 2013, 193–194, 76–82. [Google Scholar] [CrossRef] [Green Version]
  49. Sun, J.; Zhao, F.Z.; Han, X.H.; Yang, G.H.; Bai, S.B.; Hao, W.F. Ecological stoichiometry of soil aggregates and relationship with soil nutrients of different-aged Robinia pseudoacacia forests. Acta Ecol. Sin. 2016, 36, 6879–6888. [Google Scholar]
  50. Hontoria, C.; Gomez-Paccard, C.; Mariscal-Sancho, I.; Benito, M.; Perez, J.; Espejo, R. Aggregate size distribution and associated organic C and N under different tillage systems and Ca-amendment in a degraded Ultisol. Soil Tillage Res. 2016, 160, 42–52. [Google Scholar] [CrossRef]
  51. Don, A.; Schumacher, J.; Freibauer, A. Impact of tropical land-use change on soil organic carbon stocks—A meta-analysis. Glob. Chang. Biol. 2015, 17, 1658–1670. [Google Scholar] [CrossRef]
  52. Qiu, L.P.; Wei, X.R.; Gao, J.L.; Zhang, X.C. Dynamics of soil aggregate-associated organic carbon along an afforestation chronosequence. Plant Soil 2015, 391, 237–251. [Google Scholar] [CrossRef]
  53. Wang, C.; Qu, L.R.; Yang, L.M.; Liu, D.W.; Bai, E. Large-scale importance of microbial carbon use efficiency and necromass to soil organic carbon. Glob. Chang. Biol. 2021, 27, 2039–2048. [Google Scholar] [CrossRef]
  54. Elliott, E.T. Aggregate Structure and Carbon, Nitrogen, and Phosphorus in Native and Cultivated Soils. Soil Sci. Soc. Am. J. 1986, 50, 627–633. [Google Scholar] [CrossRef]
  55. Six, J.; Bossuyt, H.; Degryze, S. A history of research on the link between (micro) aggregates, soil biota, and soil organic matter dynamics. Soil Tillage Res. 2004, 79, 7–31. [Google Scholar] [CrossRef]
  56. Blanco-Canqui, H.; Lal, R.; Lemus, R. Soil aggregate properties and organic carbon for switchgrass and traditional agricultural systems in the southeastern united states. Soil Sci. 2005, 170, 998–1012. [Google Scholar] [CrossRef]
  57. Razafimbelo, T.M.; Albrecht, A.; Oliver, R.; Chevallier, T.; Chapuis, L.L.C. Aggregate associated-C and physical protection in a tropical clayeysoil under Malagasy conventional and no-tillage systems. Soil Tillage Res. 2008, 98, 140–149. [Google Scholar] [CrossRef]
  58. Xiao, L.M.; Zhang, W.; Hu, P.L.; Xiao, D.; Yang, R. The formation of large macroaggregates induces soil organic carbon sequestration in short-term cropland restoration in a typical karst area. Sci. Total Environ. 2021, 801, 149588. [Google Scholar] [CrossRef] [PubMed]
  59. Zhong, Z.; Han, X.; Xu, Y.; Zhang, W.; Fu, S.; Liu, W.; Ren, C.; Yang, G.; Ren, G. Effects of land use change on organic carbon dynamics associated with soil aggregate fractions on the Loess Plateau, China. Land Degrad. Dev. 2019, 30, 1070–1082. [Google Scholar] [CrossRef]
  60. Gao, H.; Qiu, L.; Zhang, Y.; Wang, L.; Zhang, X.; Cheng, J. Distribution of organic carbon and nitrogen in soil aggregates of aspen (Populus simonii Carr.) woodlands in the semi-arid Loess Plateau of China. Soil Res. 2013, 51, 406. [Google Scholar] [CrossRef]
  61. Sodhi, G.; Beri, V.; Benbi, D.K. Soil aggregation and distribution of carbon and nitrogen in different fractions under long-term application of compost in rice–wheat system. Soil Tillage Res. 2009, 103, 412–418. [Google Scholar] [CrossRef]
  62. Six, J.; Paustian, K. Aggregate-associated soil organic matter as an ecosystem property and a measurement tool. Soil Biol. Biochem. 2014, 68, A4–A9. [Google Scholar] [CrossRef]
  63. Fang, X.M.; Chen, F.; Wan, S.; Yang, Q.; Shi, J. Topsoil and Deep Soil Organic Carbon Concentration and Stability Vary with Aggregate Size and Vegetation Type in Subtropical China. PLoS ONE 2015, 10, e0139380. [Google Scholar] [CrossRef]
  64. Zhu, G.Y.; Shangguan, Z.P.; Deng, L. Soil aggregate stability and aggregate-associated carbon and nitrogen in natural restoration grassland and Chinese red pine plantation on the Loess Plateau. Catena 2017, 149, 253–260. [Google Scholar] [CrossRef]
Figure 1. Distribution map of study sites in the Songnen Plain, northeastern China.
Forests 13 01546 g001
Figure 2. The effects of shelterbelt on soil aggregates distribution in 0–20 cm, 20–40 cm, 40–60 cm, 60–80 cm, and 80–100 cm. Broken lines are percent changes of shelterbelt−induced soil aggregate proportions, ** indicates significant differences at p < 0.001, and * indicates the significant differences at p < 0.05 between the changes in shelterbelt−induced and farmlands in same soil layer. Error bars are the standard errors.
Forests 13 01546 g002
Figure 3. The effects of shelterbelt on R0.25, MWD, GMD and D of soil aggregates in 0–20 cm, 20–40 cm, 40–60 cm, 60–80 cm and 80–100 cm. Broken lines are percent changes in shelterbelt−induced R0.25, MWD, GMD and D of soil aggregate, ** indicates significant differences at p < 0.001 between the changes in shelterbelt−induced and farmlands in same soil layer. Error bars are the standard errors.
Forests 13 01546 g003
Figure 4. The effects of shelterbelt on total SOC concentrations and stocks in 0–20 cm, 20–40 cm, 40–60 cm, 60–80 cm, and 80–100 cm. Broken lines are percent changes of total SOC concentrations and stocks, * indicates the significant differences at p < 0.05 between the changes in shelterbelt−induced and farmlands in same soil layer. Error bars are the standard errors.
Forests 13 01546 g004
Figure 5. The effects of shelterbelt on aggregate−associated SOC concentrations in 0–20 cm, 20–40 cm, 40–60 cm, 60–80 cm, and 80–100 cm. Broken lines are percent changes of aggregate-associated SOC concentrations, * indicates the significant differences at p < 0.05 between the changes in shelterbelt−induced and farmlands in same soil layer. Error bars are the standard errors.
Forests 13 01546 g005
Figure 6. The effects of shelterbelt on aggregate−associated SOC stocks in 0–20 cm, 20–40 cm, 40–60 cm, 60–80 cm, and 80–100 cm. Broken lines are percent changes of aggregate-associated SOC stocks, * indicates the significant differences at p < 0.05 between the changes in shelterbelt−induced and farmlands in same soil layer. Error bars are the standard errors.
Forests 13 01546 g006
Figure 7. Relationships between SOC concentrations in total soils and in aggregates (a) and between SOC stocks in total soils and in aggregates (b).
Forests 13 01546 g007
Table 1. Soil properties sampling sites.
SiteBulk Density
(g/cm3)
Porosity
(%)
Soil Moisture
(%)
pHEC
(μS/cm)
SOC Content
(g/kg)
Total N
(g/kg)
Alkaline Hydrolyzed N
(mg/kg)
Total K
(g/kg)
Available K
(mg/kg)
Total P
(g/kg)
Available P
(mg/kg)
Dumeng1.5635.635.378.4394.367.500.6646.3557.7660.920.345.21
Lanling1.4640.1710.827.57103.2210.661.0069.1051.7577.050.666.26
Zhaodong1.4042.3213.328.49135.9611.081.0558.2246.8453.140.313.56
Table 2. Relationships between total SOC content (stock) and the distribution and stability parameter of soil aggregates.
Proportion of AggregatesR0.25MWDGMDD
>2 mm0.25–2 mm0.053–0.25 mm<0.053 mm
SOC content
in total soils
R0.48−0.170.110.05−0.15−0.10−0.15−0.32
Pp < 0.0010.120.300.640.170.350.16p < 0.01
SOC stock
in total soils
R0.46−0.120.120.01−0.10−0.06−0.11−0.29
Pp < 0.0010.250.250.910.330.570.32p < 0.01
Publisher’s Note: MDPI stays neutral with regard to jurisdictional claims in published maps and institutional affiliations.

