
Outbreaks of Douglas-Fir Beetle Follow Western Spruce Budworm Defoliation in the Southern Rocky Mountains, USA

 , ,
, ,
Abstract
:1. Introduction
2. Materials and Methods
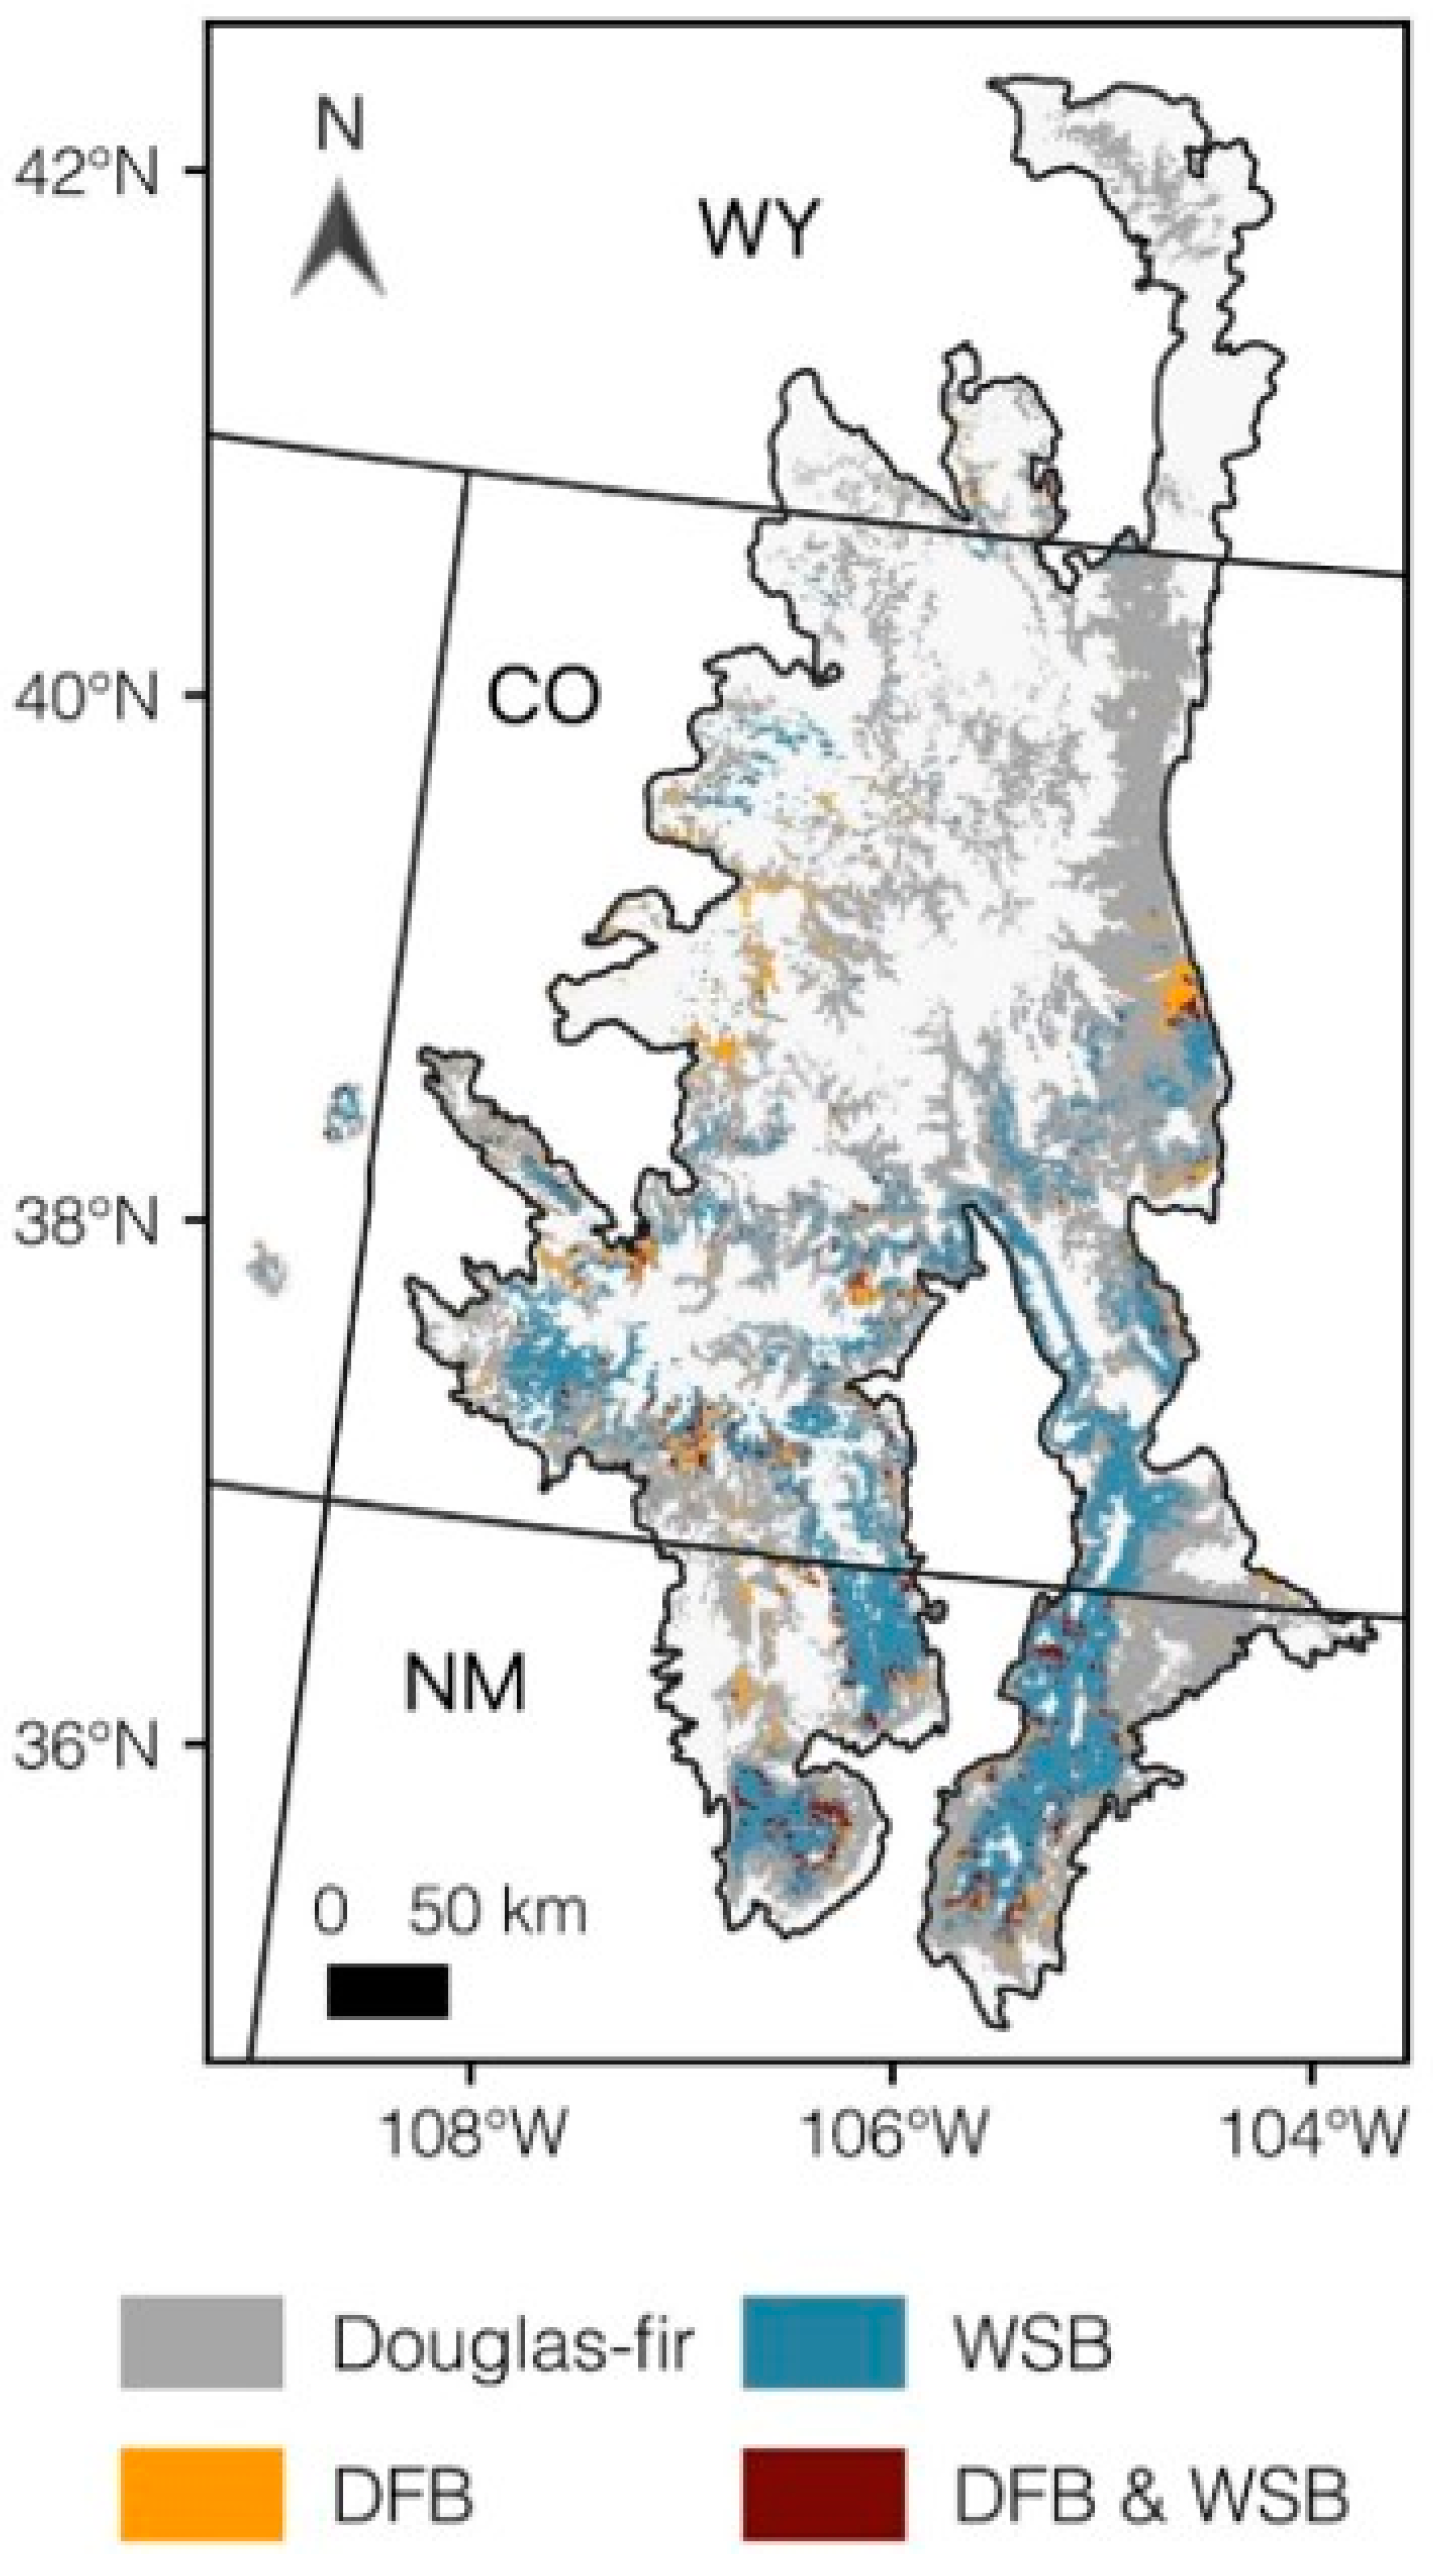
2.1. Study Area
2.2. Data
2.3. Data Processing
2.4. Analyses
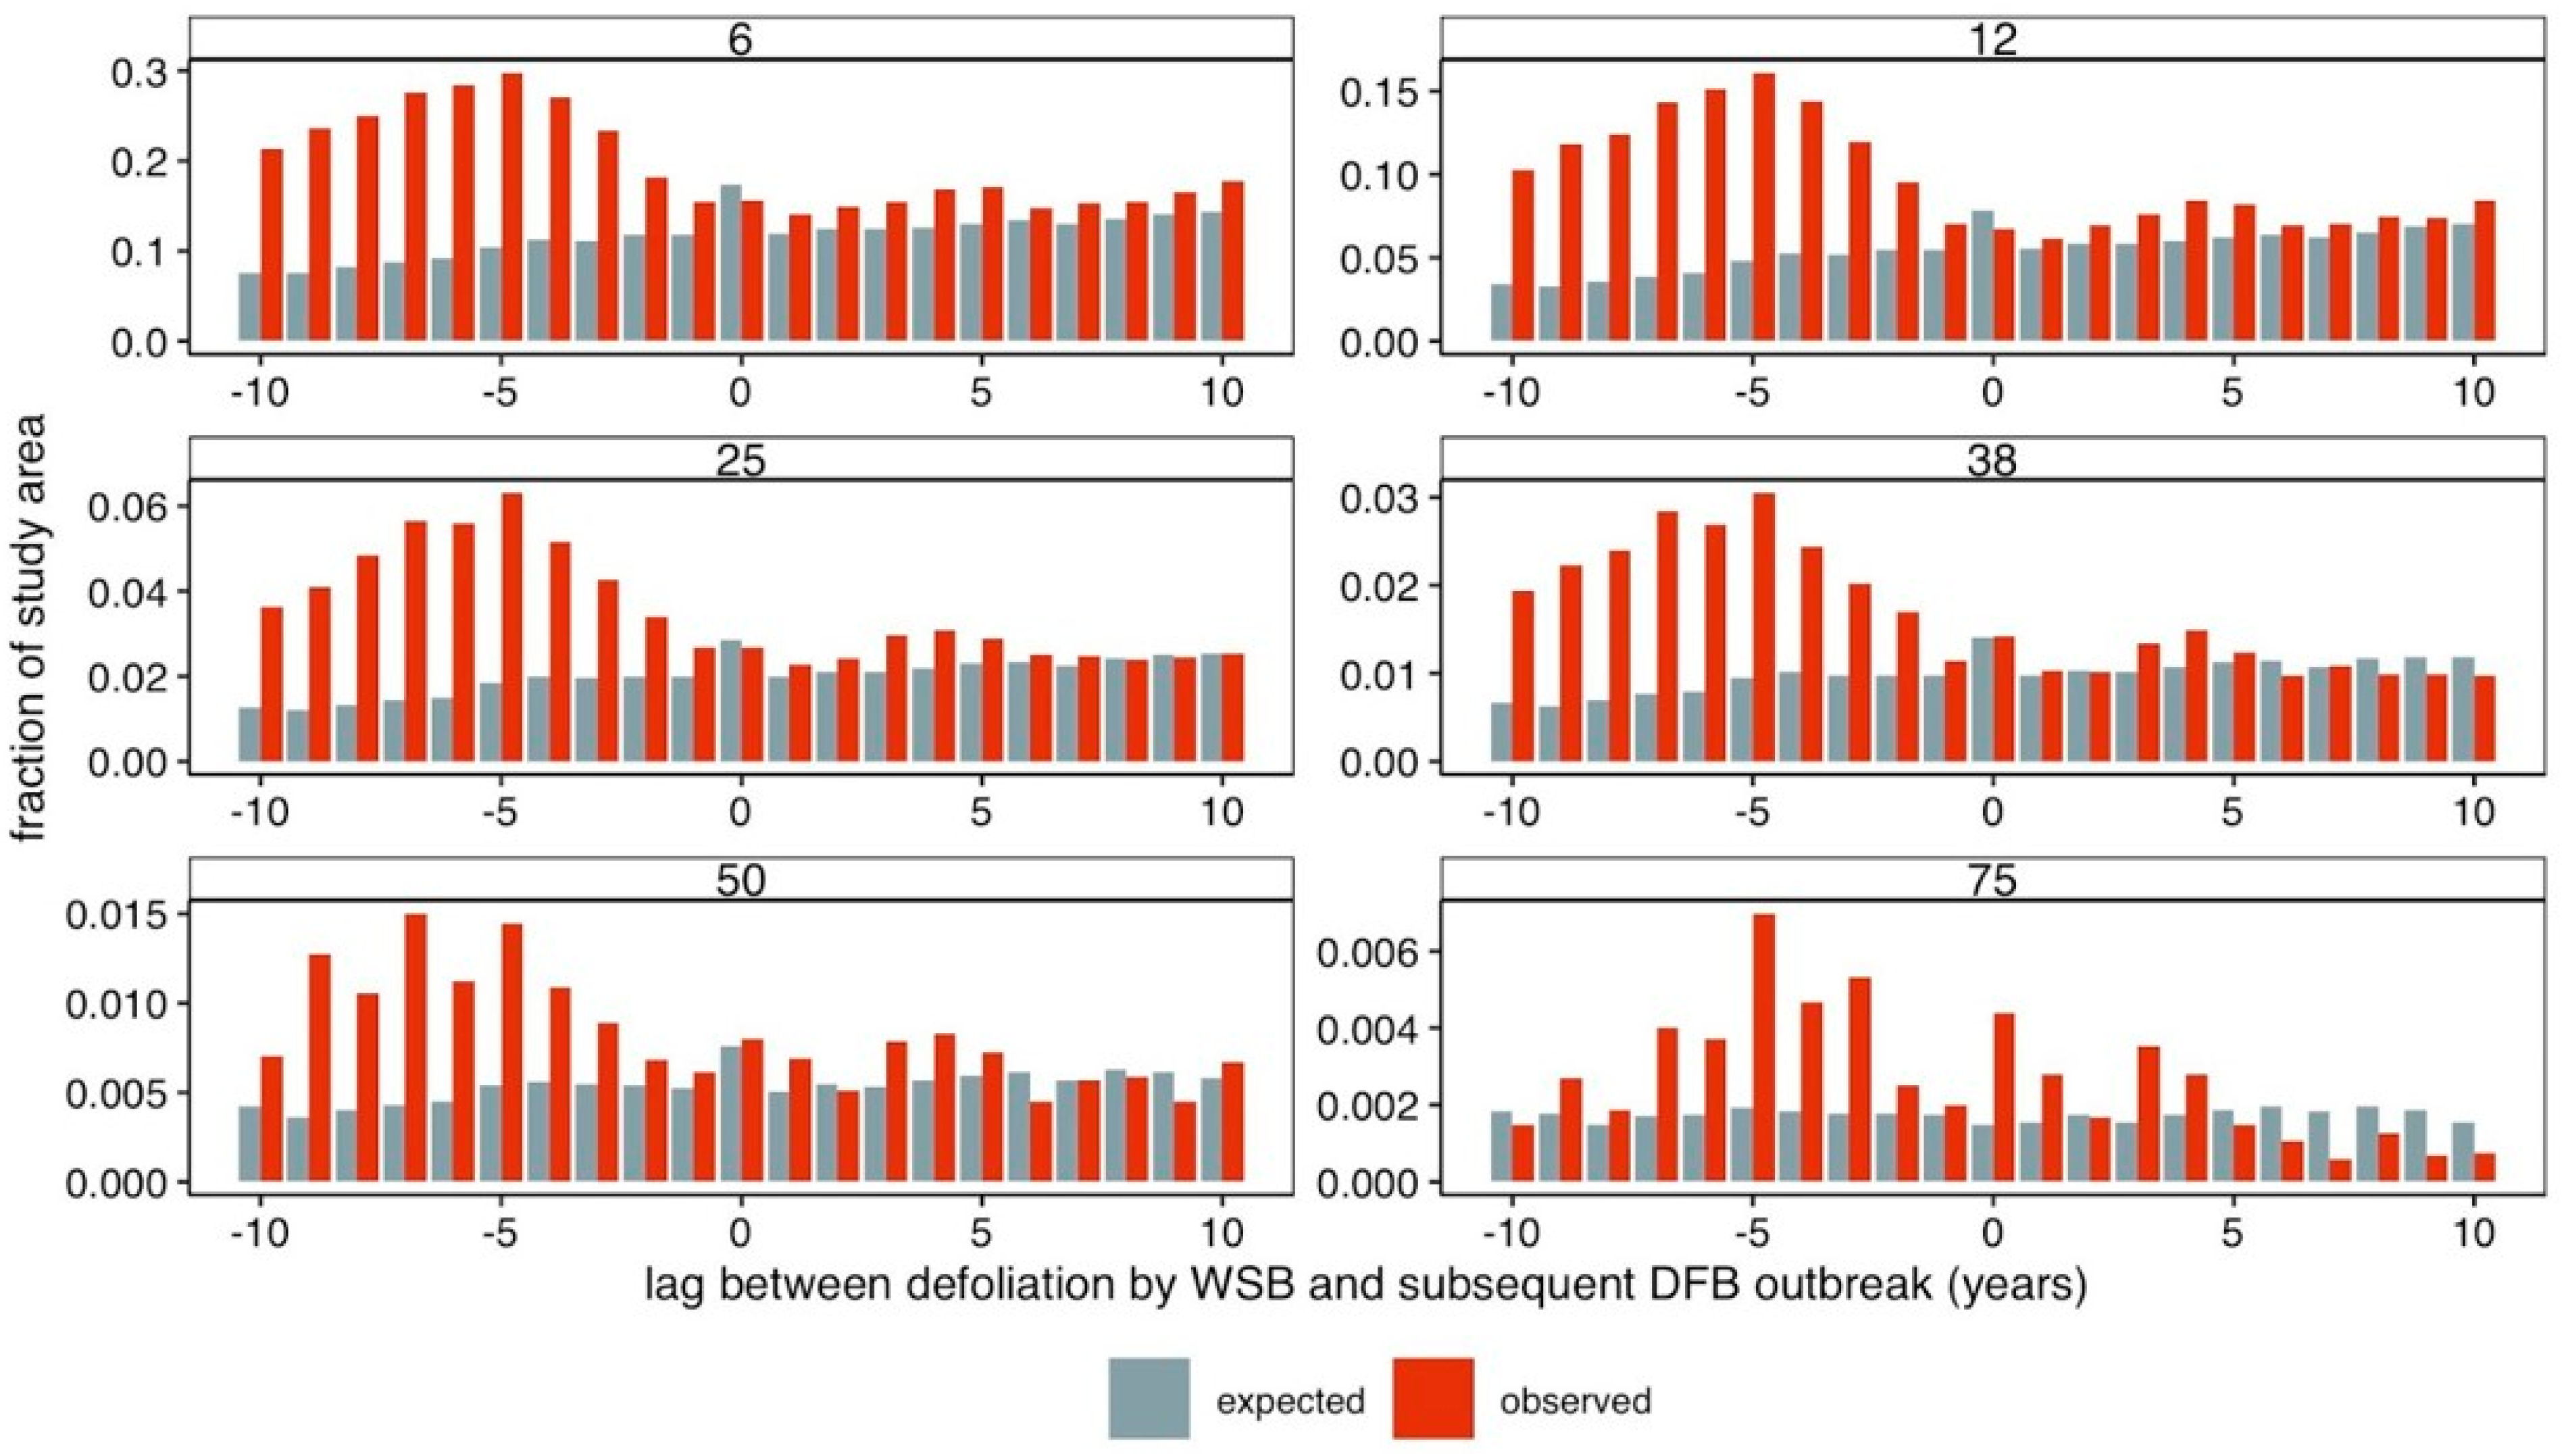
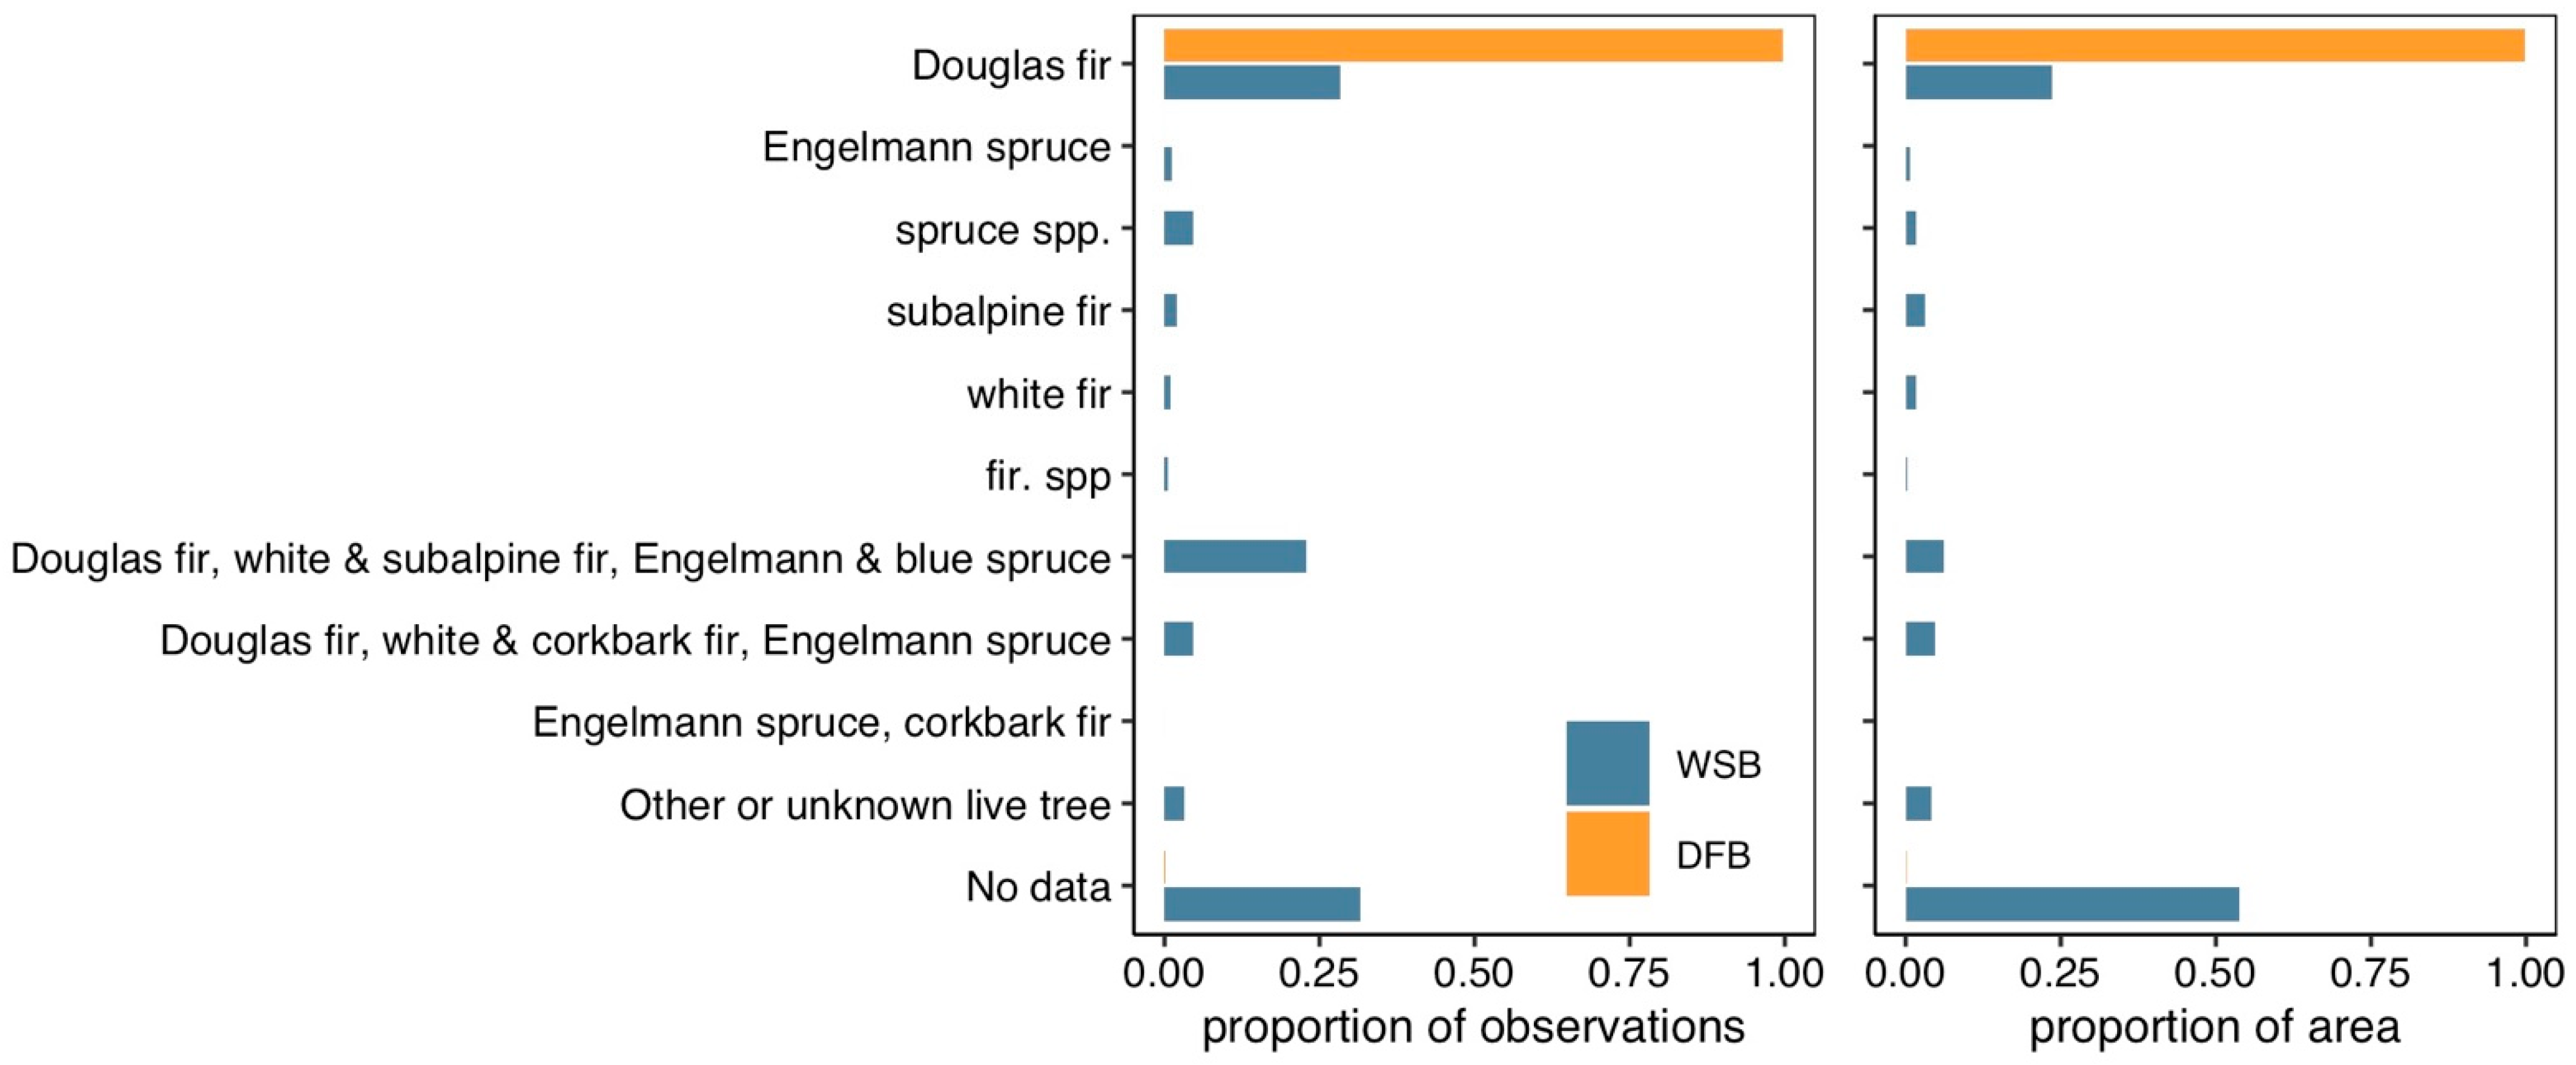
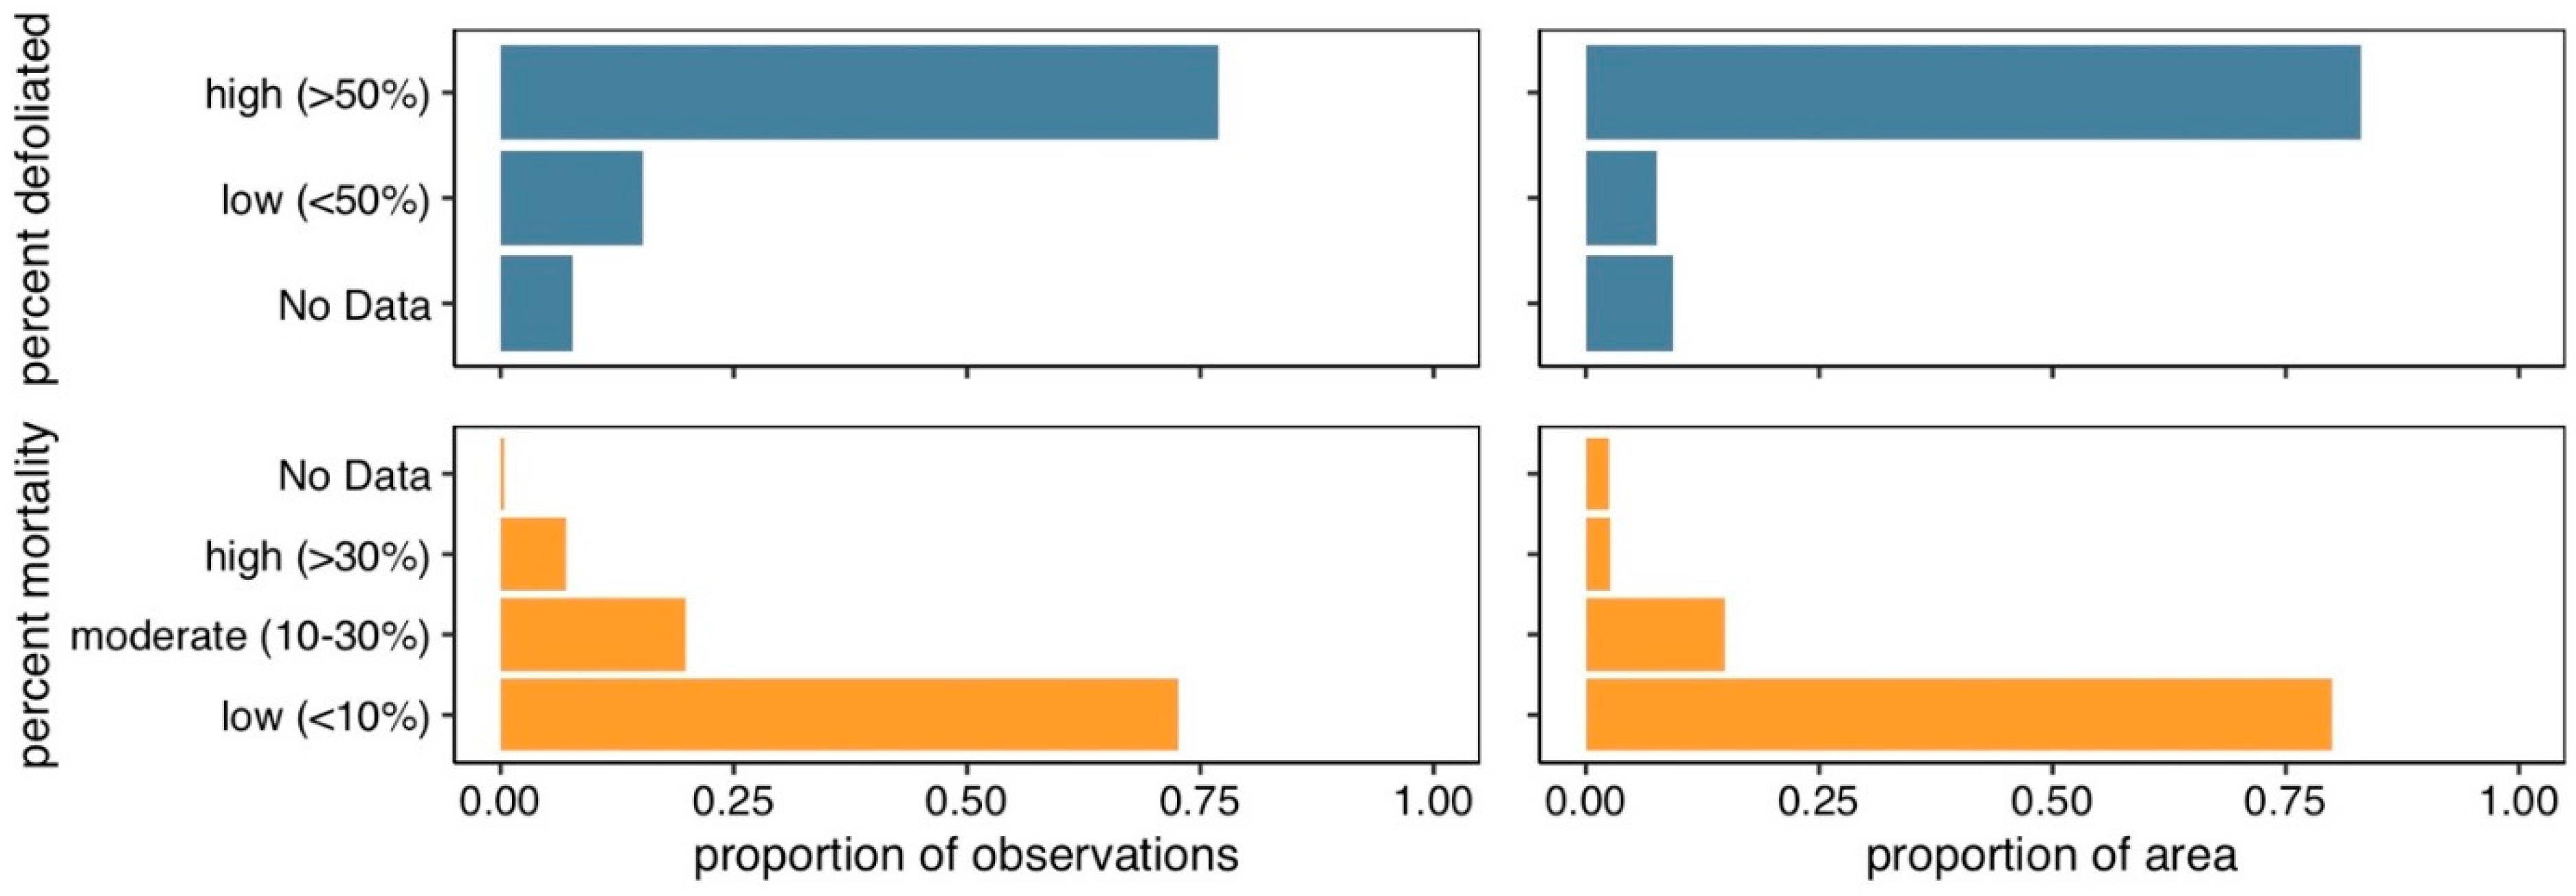
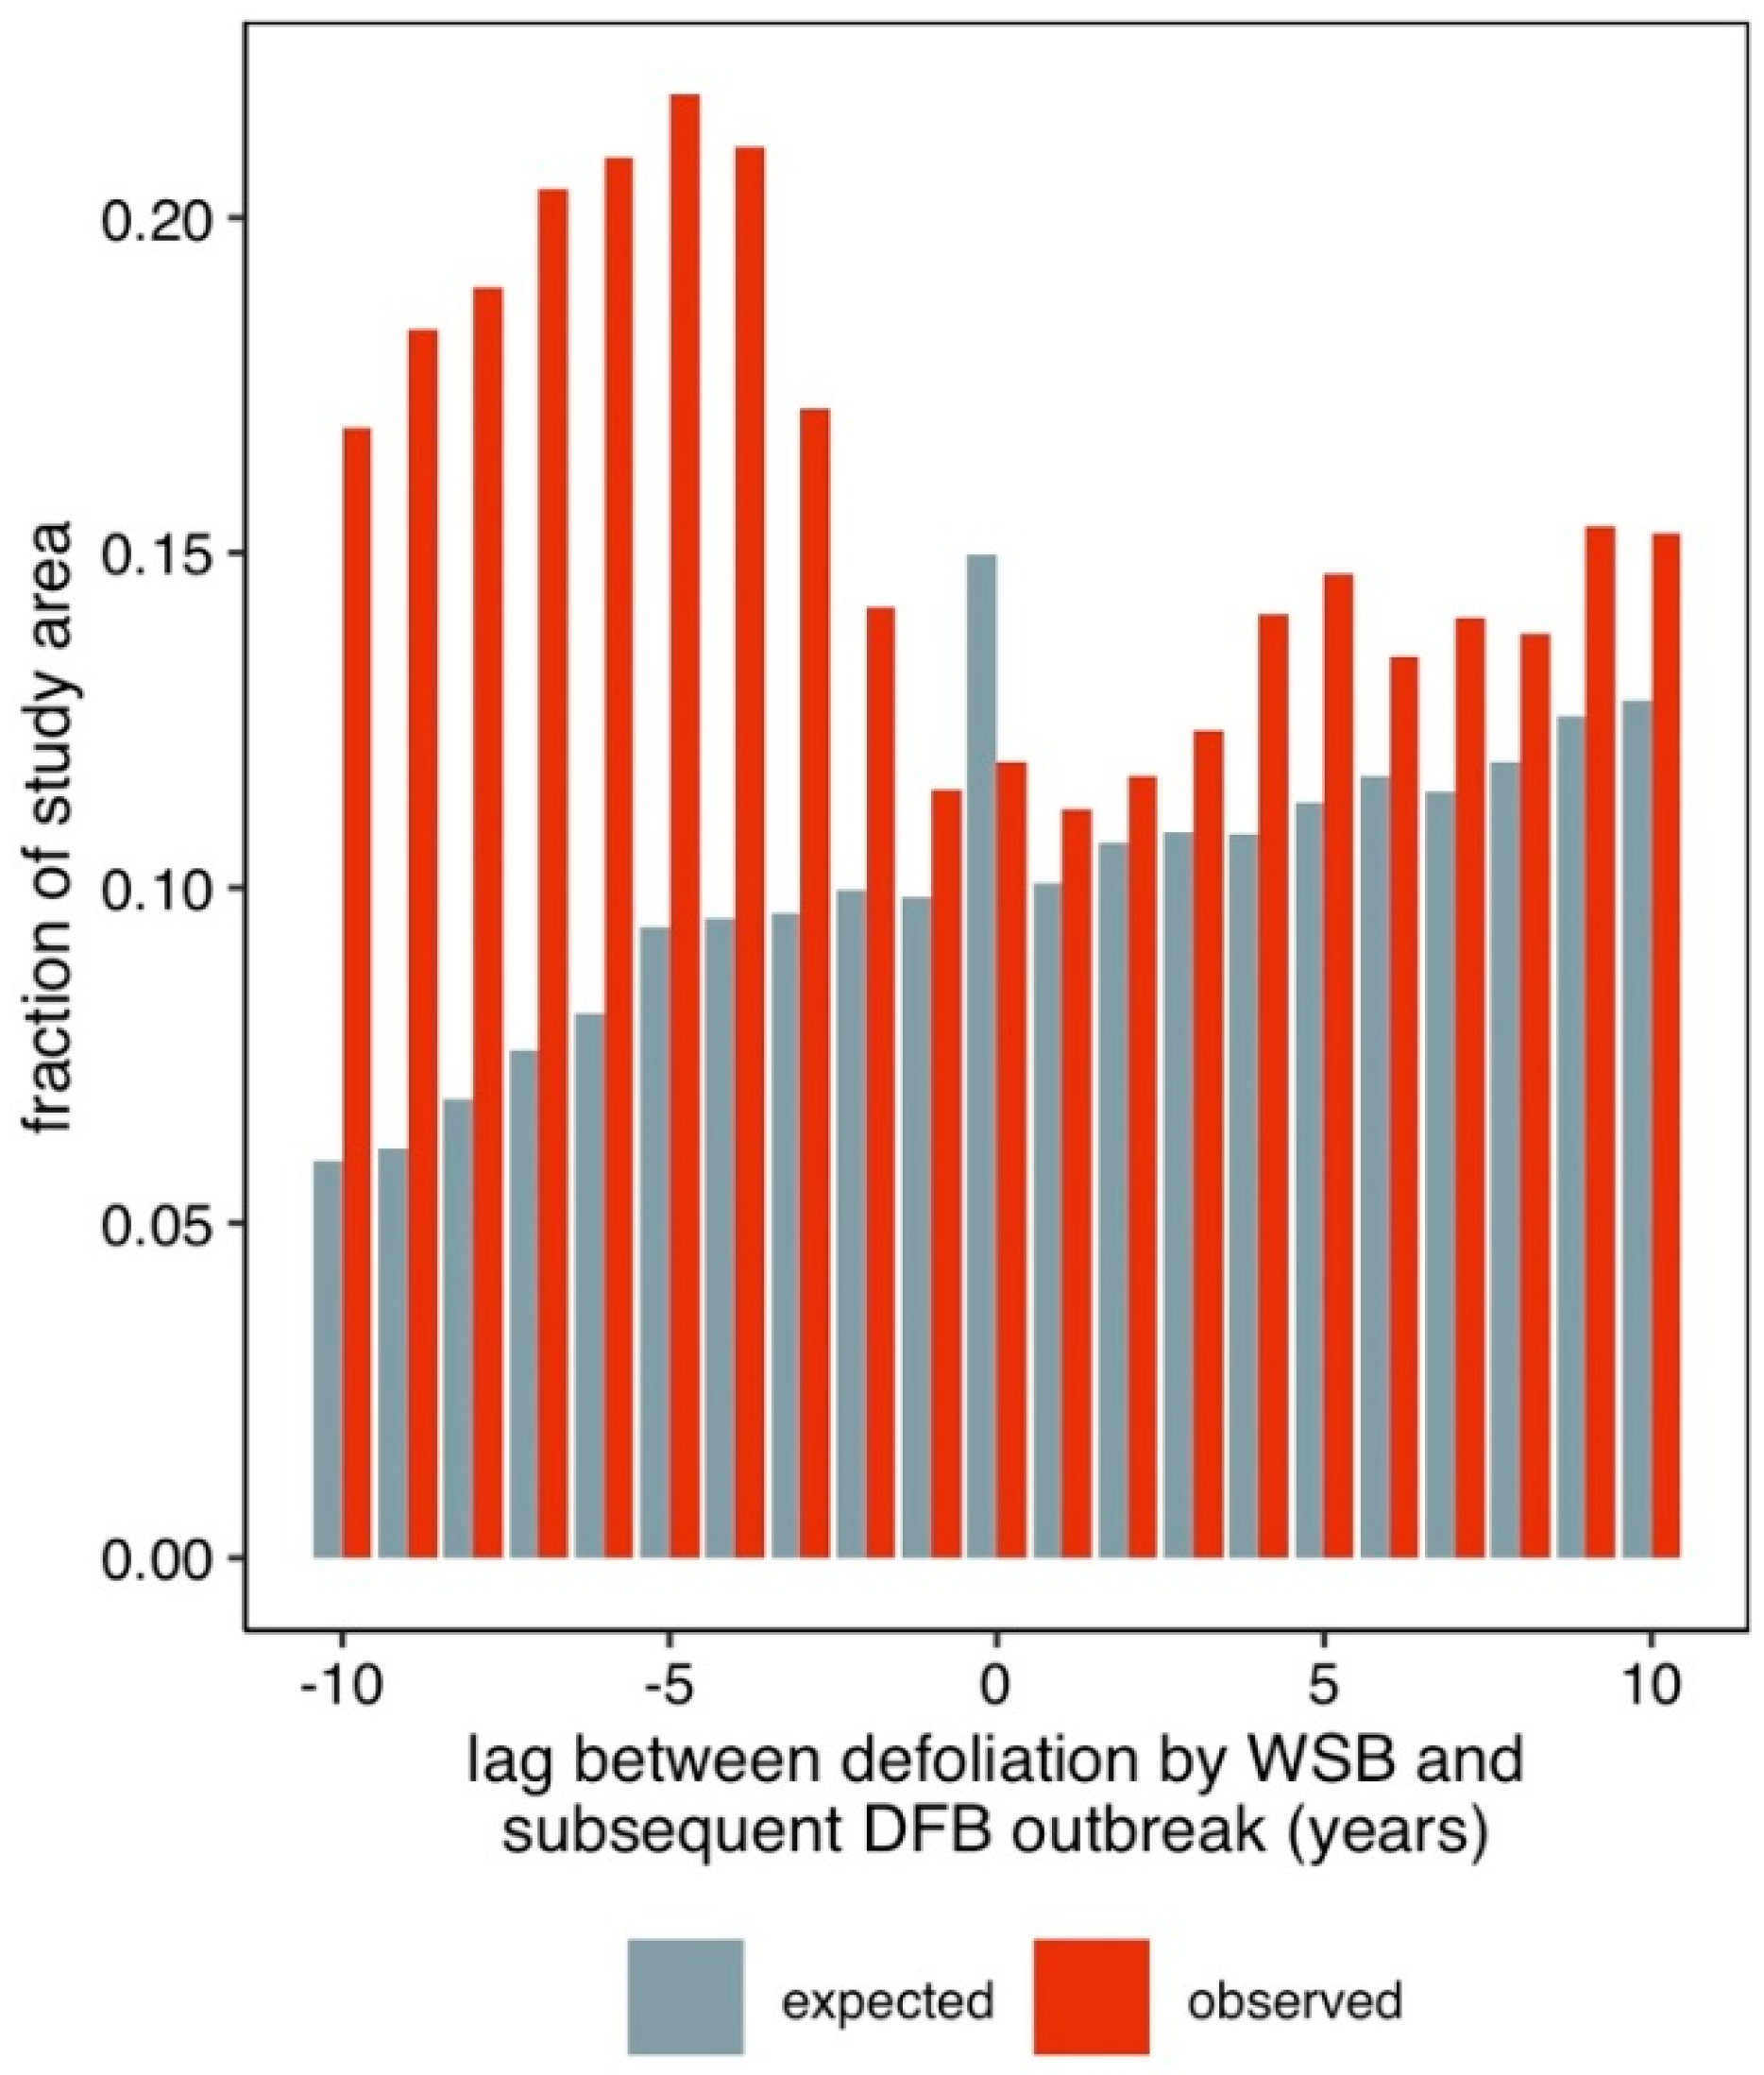
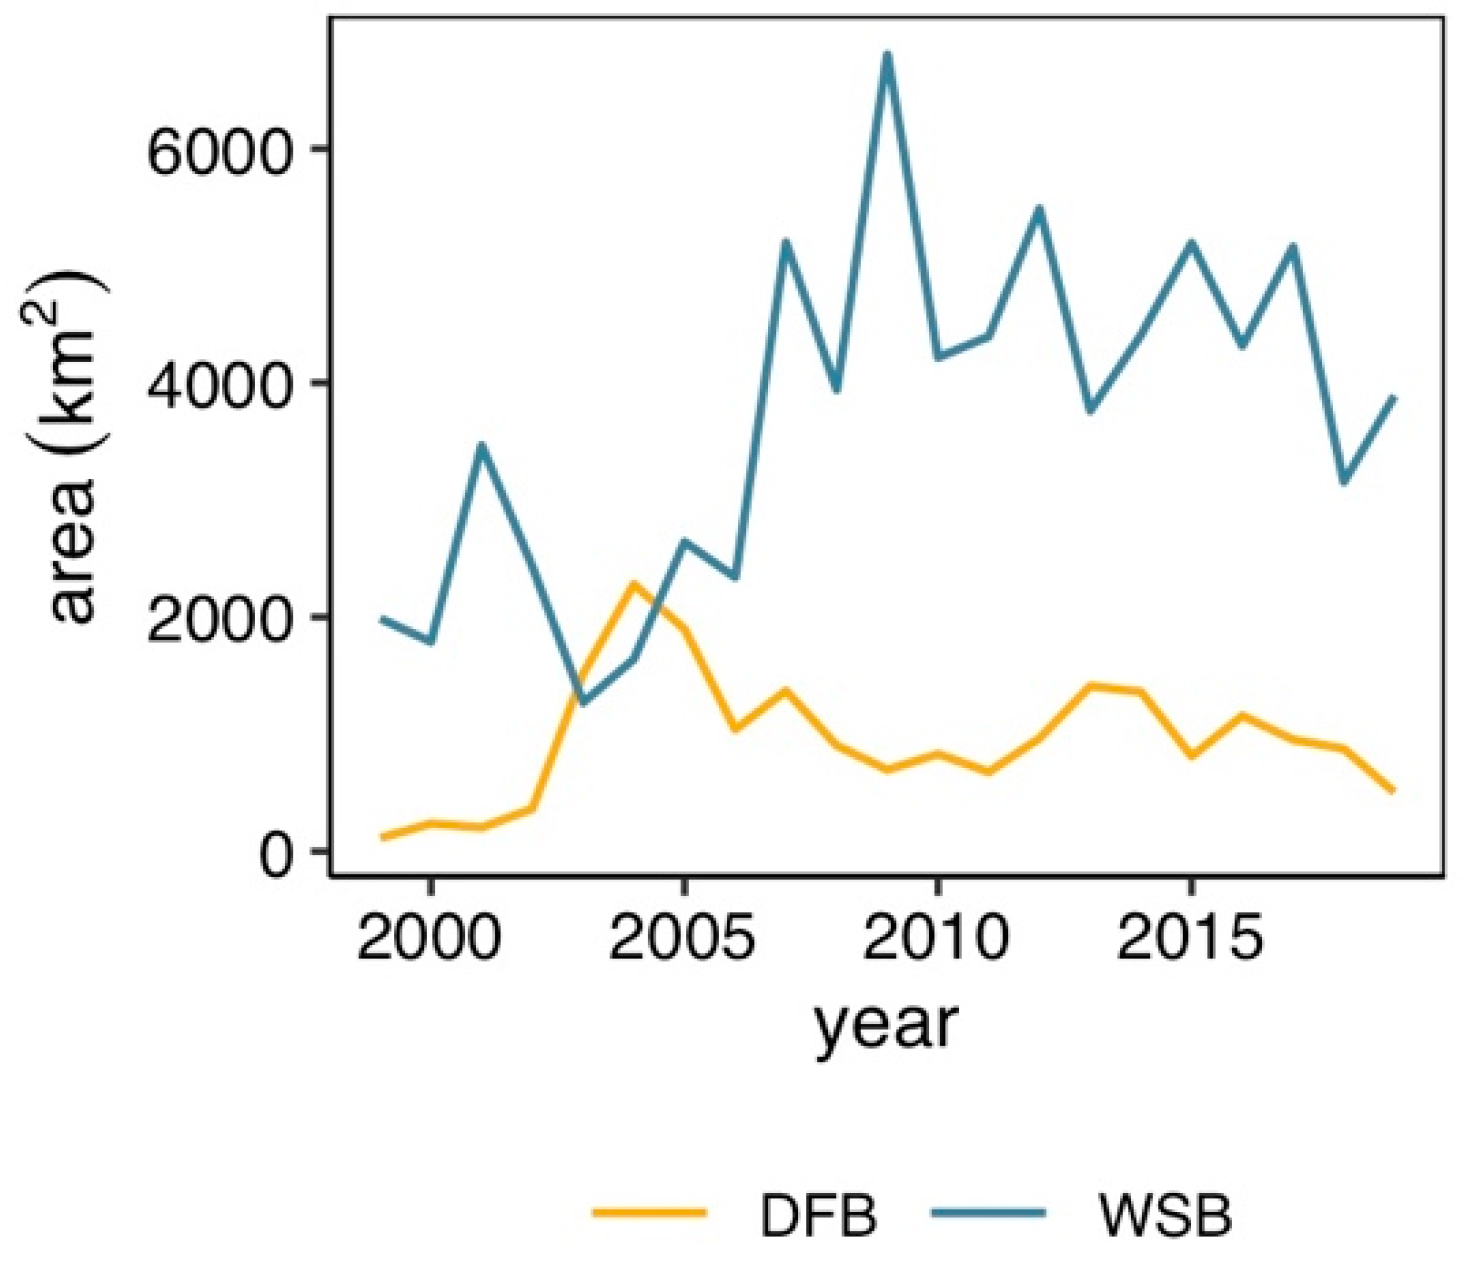
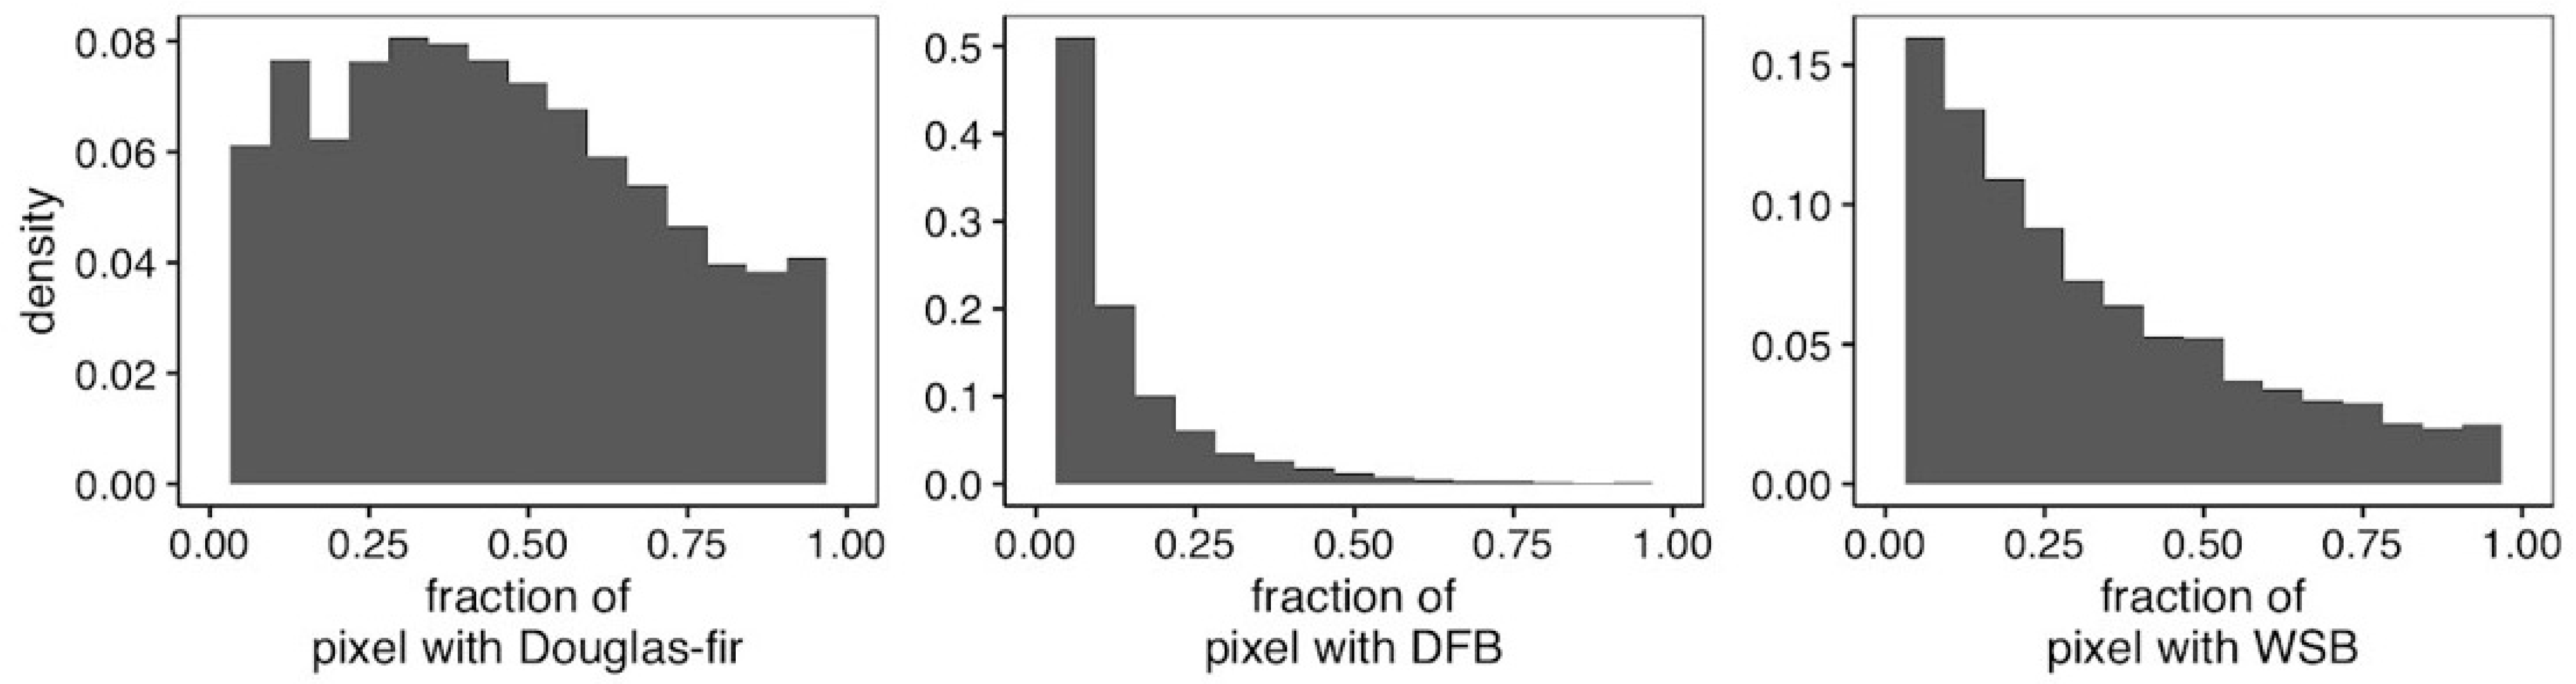
3. Results
4. Discussion
5. Conclusions
Author Contributions
Funding
Data Availability Statement
Conflicts of Interest
Appendix A

References
- Hicke, J.A.; Xu, B.; Meddens, A.J.H.; Egan, J.M. Characterizing Recent Bark Beetle-Caused Tree Mortality in the Western United States from Aerial Surveys. For. Ecol. Manag. 2020, 475, 118402. [Google Scholar] [CrossRef]
- Loeffler, D.; Anderson, N. Impacts of the Mountain Pine Beetle on Sawmill Operations, Costs, and Product Values in Montana. For. Prod. J. 2017, 68, 15–24. [Google Scholar] [CrossRef]
- Arnberger, A.; Ebenberger, M.; Schneider, I.E.; Cottrell, S.; Schlueter, A.C.; von Ruschkowski, E.; Venette, R.C.; Snyder, S.A.; Gobster, P.H. Visitor Preferences for Visual Changes in Bark Beetle-Impacted Forest Recreation Settings in the United States and Germany. Environ. Manag. 2018, 61, 209–223. [Google Scholar] [CrossRef] [PubMed]
- Martin, K.; Norris, A.; Drever, M. Effects of Bark Beetle Outbreaks on Avian Biodiversity in the British Columbia Interior: Implications for Critical Habitat Management. J. Ecosyst. Manag. 2006, 7, 10–24. [Google Scholar]
- Kurz, W.A.; Dymond, C.C.; Stinson, G.; Rampley, G.J.; Neilson, E.T.; Carroll, A.L.; Ebata, T.; Safranyik, L. Mountain Pine Beetle and Forest Carbon Feedback to Climate Change. Nature 2008, 452, 987–990. [Google Scholar] [CrossRef] [PubMed]
- Hansen, E.M.; Bentz, B.J.; Turner, D.L. Temperature-Based Model for Predicting Univoltine Brood Proportions in Spruce Beetle (Coleoptera: Scolytidae). Can. Entomol. 2001, 133, 827–841. [Google Scholar] [CrossRef]
- Bentz, B.J.; Logan, J.A.; Vandygriff, J.C. Latitudinal Variation in Dendroctonus ponderosae (Coleoptera: Scolytidae) Development Time and Adult Size. Can. Entomol. 2001, 133, 375–387. [Google Scholar] [CrossRef]
- Powell, J.A.; Logan, J.A. Insect Seasonality: Circle Map Analysis of Temperature-Driven Life Cycles. Theor. Popul. Biol. 2005, 67, 161–179. [Google Scholar] [CrossRef]
- Mitton, J.B.; Ferrenberg, S.M. Mountain Pine Beetle Develops an Unprecedented Summer Generation in Response to Climate Warming. Am. Nat. 2012, 179, E163–E171. [Google Scholar] [CrossRef] [Green Version]
- Bentz, B.J.; Duncan, J.P.; Powell, J.A. Elevational Shifts in Thermal Suitability for Mountain Pine Beetle Population Growth in a Changing Climate. Forestry 2016, 89, 271–283. [Google Scholar] [CrossRef]
- Chapman, T.B.; Veblen, T.T.; Schoennagel, T. Spatiotemporal Patterns of Mountain Pine Beetle Activity in the Southern Rocky Mountains. Ecology 2012, 93, 2175–2185. [Google Scholar] [CrossRef] [PubMed]
- Huang, J.; Kautz, M.; Trowbridge, A.M.; Hammerbacher, A.; Raffa, K.F.; Adams, H.D.; Goodsman, D.W.; Xu, C.; Meddens, A.J.H.; Kandasamy, D.; et al. Tree Defence and Bark Beetles in a Drying World: Carbon Partitioning, Functioning and Modelling. New Phytol. 2020, 225, 26–36. [Google Scholar] [CrossRef] [PubMed] [Green Version]
- Erbilgin, N.; Zanganeh, L.; Klutsch, J.; Chen, S.; Zhao, S.; Ishangulyyeva, G.; Burr, S.; Gaylord, M.; Hofstetter, R.; Keefover-Ring, K.; et al. Combined Drought and Bark Beetle Attacks Deplete Non-Structural Carbohydrates and Promote Death of Mature Pine Trees. Plant Cell Environ. 2021, 44, 3866–3881. [Google Scholar] [CrossRef] [PubMed]
- Masson-Delmotte, V.; Zhai, P.; Pirani, A.; Connors, S.L.; Péan, C.; Berger, S.; Caud, N.; Chen, Y.; Goldfarb, L.; Gomis, M.I.; et al. (Eds.) IPCC Climate Change 2021: The Physical Science Basis. Contribution of Working Group I to the Sixth Assessment Report of the Intergovernmental Panel on Climate Change; Cambridge University Press: New York, NY, USA, 2021. [Google Scholar]
- Bentz, B.J.; Régnière, J.; Fettig, C.J.; Hansen, E.M.; Hayes, J.L.; Hicke, J.A.; Kelsey, R.G.; Negrón, J.F.; Seybold, S.J. Climate Change and Bark Beetles of the Western United States and Canada: Direct and Indirect Effects. BioScience 2010, 60, 602–613. [Google Scholar] [CrossRef]
- Seidl, R.; Thom, D.; Kautz, M.; Martin-Benito, D.; Peltoniemi, M.; Vacchiano, G.; Wild, J.; Ascoli, D.; Petr, M.; Honkaniemi, J.; et al. Forest Disturbances under Climate Change. Nat. Clim. Chang. 2017, 7, 395–402. [Google Scholar] [CrossRef] [Green Version]
- Kane, J.M.; Varner, J.M.; Metz, M.R.; van Mantgem, P.J. Characterizing Interactions between Fire and Other Disturbances and Their Impacts on Tree Mortality in Western U.S. Forests. For. Ecol. Manag. 2017, 405, 188–199. [Google Scholar] [CrossRef]
- Buma, B. Disturbance Interactions: Characterization, Prediction, and the Potential for Cascading Effects. Ecosphere 2015, 6, 1–15. [Google Scholar] [CrossRef]
- Burton, P.J.; Jentsch, A.; Walker, L.R. The Ecology of Disturbance Interactions. BioScience 2020, 70, 854–870. [Google Scholar] [CrossRef]
- Simard, M.; Romme, W.H.; Griffin, J.M.; Turner, M.G. Do Mountain Pine Beetle Outbreaks Change the Probability of Active Crown Fire in Lodgepole Pine Forests? Ecol. Monogr. 2011, 81, 3–24. [Google Scholar] [CrossRef]
- Bebi, P.; Kulakowski, D.; Veblen, T.T. Interactions between Fire and Spruce Beetles in a Subalpine Rocky Mountain Forest Landscape. Ecology 2003, 84, 362–371. [Google Scholar] [CrossRef]
- Paine, R.T.; Tegner, M.J.; Johnson, E.A. Compounded Perturbations Yield Ecological Surprises. Ecosystems 1998, 1, 535–545. [Google Scholar] [CrossRef]
- Andrus, R.A.; Hart, S.J.; Tutland, N.; Veblen, T.T. Future Dominance by Quaking Aspen Expected Following Short-Interval, Compounded Disturbance Interaction. Ecosphere 2021, 12, e03345. [Google Scholar] [CrossRef]
- Turner, M.G.; Calder, W.J.; Cumming, G.S.; Hughes, T.P.; Jentsch, A.; LaDeau, S.L.; Lenton, T.M.; Shuman, B.N.; Turetsky, M.R.; Ratajczak, Z.; et al. Climate Change, Ecosystems and Abrupt Change: Science Priorities. Philos. Trans. R. Soc. B Biol. Sci. 2020, 375, 20190105. [Google Scholar] [CrossRef] [Green Version]
- USFS and Its Partners USDA Forest Service—Aerial Survey Data Download 2020; USDA: Washington, DC, USA, 2020.
- Brookes, M.H.; Campbell, R.W.; Colbert, J.J.; Mitchell, R.G.; Stark, R.W. Western Spruce Budworm; U.S. Department of Agriculture, Forest Service: Washington, DC, USA, 1987.
- Alfaro, R.I.; Sickle, G.A.V.; Thomson, A.J.; Wegwitz, E. Tree Mortality and Radial Growth Losses Caused by the Western Spruce Budworm in a Douglas-Fir Stand in British Columbia. Can. J. For. Res. 1982, 12, 780–787. [Google Scholar] [CrossRef]
- Swetnam, T.W.; Lynch, A.M. A Tree-Ring Reconstruction of Western Spruce Budworm History in the Southern Rocky Mountains. For. Sci. 1989, 35, 962–986. [Google Scholar]
- Raffa, K.F.; Grégoire, J.-C.; Staffan Lindgren, B. Natural History and Ecology of Bark Beetles. In Bark Beetles; Vega, F.E., Hofstetter, R.W., Eds.; Academic Press: San Diego, CA, USA, 2015; pp. 1–40. ISBN 978-0-12-417156-5. [Google Scholar]
- Raffa, K.F.; Aukema, B.H.; Bentz, B.J.; Carroll, A.L.; Hicke, J.A.; Turner, M.G.; Romme, W.H. Cross-Scale Drivers of Natural Disturbances Prone to Anthropogenic Amplification: The Dynamics of Bark Beetle Eruptions. BioScience 2008, 58, 501–517. [Google Scholar] [CrossRef] [Green Version]
- Raffa, K.F.; Aukema, B.H.; Erbilgin, N.; Klepzig, K.D.; Wallin, K.F. Interactions among Conifer Terpenoids and Bark Beetles across Multiple Levels of Scale: An Attempt to Understand Links between Population Patterns and Physiological Processes. Recent Adv. Phytochem. 2005, 39, 79–118. [Google Scholar]
- Aukema, B.H.; McKee, F.R.; Wytrykush, D.L.; Carroll, A.L. Population Dynamics and Epidemiology of Four Species of Dendroctonus (Coleoptera: Curculionidae): 100 Years since J.M. Swaine. Can. Entomol. 2016, 148, S82–S110. [Google Scholar] [CrossRef] [Green Version]
- US EPA Level III Ecoregions of the Conterminous United States 2013; U.S. Environmental Protection Agency: Corvallis, OR, USA, 2013.
- PRISM Climate Group Monthly 30-Year Climate Normals (1981–2010); Oregon State University: Corvallis, OR, USA, 2021.
- Homer, C.; Dewitz, J.; Jin, S.; Xian, G.; Costello, C.; Danielson, P.; Gass, L.; Funk, M.; Wickham, J.; Stehman, S.; et al. Conterminous United States Land Cover Change Patterns 2001–2016 from the 2016 National Land Cover Database. ISPRS J. Photogramm. Remote Sens. 2020, 162, 184–199. [Google Scholar] [CrossRef]
- Peet, R.K. Forests and Meadows of the Rocky Mountains. In North American Terrestrial Vegetation; Barbour, M.G., Billings, W.D., Eds.; Cambridge University Press: New York, NY, USA, 1988; Volume 1, pp. 75–122. [Google Scholar]
- Ellenwood, J.R.; Krist, F.J., Jr.; Romero, S.A. National Individual Tree Species Atlas; U.S. Department of Agriculture, Forest Service, Forest Health Technology Enterprise Team: Fort Collins, CO, USA, 2015.
- Forest Health Protection Field Guide to Diseases & Insects of the Rocky Mountain Region; U.S. Department of Agriculture, Forest Service, Rocky Mountain Research Station: Fort Collins, CO, USA, 2010; pp. 1–336.
- Swetnam, T.; Baisan, C. Historical Fire Regime Patterns in the Southwestern United States since AD 1700. Fire Effects in Southwestern Forest. In Proceedings of the 2nd La Mesa Fire Symposium, Los Alamos, NM, USA, 29–31 March 1994; pp. 11–32. [Google Scholar]
- Sherriff, R.L.; Platt, R.V.; Veblen, T.T.; Schoennagel, T.L.; Gartner, M.H. Historical, Observed, and Modeled Wildfire Severity in Montane Forests of the Colorado Front Range. PLoS ONE 2014, 9, e106971. [Google Scholar] [CrossRef] [Green Version]
- Coleman, T.W.; Graves, A.D.; Heath, Z.; Flowers, R.W.; Hanavan, R.P.; Cluck, D.R.; Ryerson, D. Accuracy of Aerial Detection Surveys for Mapping Insect and Disease Disturbances in the United States. For. Ecol. Manag. 2018, 430, 321–336. [Google Scholar] [CrossRef]
- USGS. USFS Monitoring Trends in Burn Severity Fire Occurrence Dataset (FOD) Point Locations from 1984–2018; USGS: Reston, VA, USA, 2020.
- USFS TimberHarvest 2020; USFS: Washington, DC, USA, 2020.
- Ross, N. fasterize: Fast Polygon to Raster Conversion. R Package Version 1.0.3. 2020. Available online: https://CRAN.R-project.org/package=fasterize (accessed on 6 February 2022).
- Johnson, E.W.; Ross, J. Quantifying Error in Aerial Survey Data. Aust. For. 2008, 71, 216–222. [Google Scholar] [CrossRef]
- O’Sullivan, D.; Unwin, D. Geographic Information Analysis; John Wiley & Sons: Hoboken, NJ, USA, 2014. [Google Scholar]
- Kulakowski, D.; Veblen, T.T. Influences of Fire History and Topography on the Pattern of a Severe Wind Blowdown in a Colorado Subalpine Forest. J. Ecol. 2002, 90, 806–819. [Google Scholar] [CrossRef]
- Hart, S.J.; Schoennagel, T.; Veblen, T.T.; Chapman, T.B. Area Burned in the Western United States Is Unaffected by Recent Mountain Pine Beetle Outbreaks. Proc. Natl. Acad. Sci. USA 2015, 112, 4375–4380. [Google Scholar] [CrossRef] [Green Version]
- Negrón, J.; Lynch, A.; Schaupp, W.; Mercado, J. Douglas-Fir Tussock Moth-and Douglas-Fir Beetle-Caused Mortality in a Ponderosa Pine/Douglas-Fir Forest in the Colorado Front Range, USA. Forests 2014, 5, 3131–3146. [Google Scholar] [CrossRef] [Green Version]
- Wright, L.C.; Berryman, A.A.; Wickman, B.E. Abundance of the Fir Engraver (Scoltyus Ventralis), and the Douglas-Fir Beetle (Dendroctonus psueduotsuga), Following Tree Defoliation by the Douglas-Fir Tussock Moth (Orgyia Psuedotsugata). Can. Entomol. 1984, 116, 293–305. [Google Scholar] [CrossRef]
- Karel, T.H.; Man, G. Major Forest Insect and Disease Conditions in the United States: 2015; United States Department of Agriculture, Forest Service, Forest Health Protection: Washington, DC, USA, 2017; p. 56.
- Negrón, J.F. Probability of Infestation and Extent of Mortality Associated with the Douglas-Fir Beetle in the Colorado Front Range. For. Ecol. Manag. 1998, 107, 71–85. [Google Scholar] [CrossRef]
- Hadley, K.S.; Veblen, T.T. Stand Response to Western Spruce Budworm and Douglas-Fir Bark Beetle Outbreaks, Colorado Front Range. Can. J. For. Res. 1993, 23, 479–491. [Google Scholar] [CrossRef]
- Flower, A. Three Centuries of Synchronous Forest Defoliator Outbreaks in Western North America. PLoS ONE 2016, 11, e0164737. [Google Scholar] [CrossRef] [Green Version]
- Agne, M.C.; Beedlow, P.A.; Shaw, D.C.; Woodruff, D.R.; Lee, E.H.; Cline, S.P.; Comeleo, R.L. Interactions of Predominant Insects and Diseases with Climate Change in Douglas-Fir Forests of Western Oregon and Washington, USA. For. Ecol. Manag. 2018, 409, 317–332. [Google Scholar] [CrossRef]
- Higuera, P.E.; Metcalf, A.L.; Miller, C.; Buma, B.; McWethy, D.B.; Metcalf, E.C.; Ratajczak, Z.; Nelson, C.R.; Chaffin, B.C.; Stedman, R.C.; et al. Integrating Subjective and Objective Dimensions of Resilience in Fire-Prone Landscapes. BioScience 2019, 69, 379–388. [Google Scholar] [CrossRef] [PubMed] [Green Version]
- Egan, J.M.; Kaiden, J.; Lestina, J.; Stasey, A.; Jenne, J.L. Techniques to Enhance Assessment and Reporting of Pest Damage Estimated with Aerial Detection Surveys; USDA, United States Forest Service, Forest Health Protection: Missoula, MT, USA, 2019. Available online: https://www.fs.usda.gov/Internet/FSE_DOCUMENTS/fseprd696759.pdf (accessed on 6 February 2022).


| Variable | Description | Type | Year | Resolution |
|---|---|---|---|---|
| Aerial detection survey damage areas [25] | Areas of damage and associated attributes, including the primary pest or pathogen causing damage, and severity of injury | Polygon | 1999–2019 | Compiled at 1:100,000 scale |
| Burned area boundaries [42] | Historic fire perimeters | Polygon | 1984–2018 | Compiled at 1:24,000–1:5000 scale |
| Timber harvest [43] | Management activities that removed forest biomass, reported through Forest Service Activity Tracking System (FACTS) database | Polygon | 1850–2019 | Digitized using either aerial imagery or GPS field collected points |
| Aerial detection survey area surveyed [25] | Extent of surveyed areas | Polygon | 1999–2019 | Compiled at 1:100,000 scale |
| Fractional cover of individual tree species [37] | The number of 30 × 30 m subpixels predicted to contain the tree species | Raster | ca. 2002 | 240 × 240 m |
Publisher’s Note: MDPI stays neutral with regard to jurisdictional claims in published maps and institutional affiliations. |
© 2022 by the authors. Licensee MDPI, Basel, Switzerland. This article is an open access article distributed under the terms and conditions of the Creative Commons Attribution (CC BY) license (https://creativecommons.org/licenses/by/4.0/).
Share and Cite
Cole, H.M.; Andrus, R.A.; Butkiewicz, C.; Rodman, K.C.; Santiago, O.; Tutland, N.J.; Waupochick, A.; Hart, S.J. Outbreaks of Douglas-Fir Beetle Follow Western Spruce Budworm Defoliation in the Southern Rocky Mountains, USA. Forests 2022, 13, 371. https://doi.org/10.3390/f13030371
Cole HM, Andrus RA, Butkiewicz C, Rodman KC, Santiago O, Tutland NJ, Waupochick A, Hart SJ. Outbreaks of Douglas-Fir Beetle Follow Western Spruce Budworm Defoliation in the Southern Rocky Mountains, USA. Forests. 2022; 13(3):371. https://doi.org/10.3390/f13030371
Chicago/Turabian StyleCole, Hailey M., Robert A. Andrus, Cori Butkiewicz, Kyle C. Rodman, Olivia Santiago, Niko J. Tutland, Angela Waupochick, and Sarah J. Hart. 2022. "Outbreaks of Douglas-Fir Beetle Follow Western Spruce Budworm Defoliation in the Southern Rocky Mountains, USA" Forests 13, no. 3: 371. https://doi.org/10.3390/f13030371