Article

Exploring the Dynamic Impact of Extreme Climate Events on Vegetation Productivity under Climate Change

1
Institute of Eco-Chongming (IEC), Key Laboratory of Geographic Information Science (Ministry of Education), School of Geographic Sciences, East China Normal University, Shanghai 200241, China
2
Department of Hydraulic Engineering, Faculty of Civil Engineering and Geoscience, Delft University of Technology, Stevinweg 1, 2628CN Delft, The Netherlands
3
School of Atmospheric Sciences, Key Laboratory of Tropical Atmosphere-Ocean System (Ministry of Education), Sun Yat-sen University, Zhuhai 519082, China
4
School of Urban and Regional Sciences, East China Normal University, Shanghai 200241, China
*
Author to whom correspondence should be addressed.
Forests 2023, 14(4), 744; https://doi.org/10.3390/f14040744
Submission received: 18 February 2023 / Revised: 20 March 2023 / Accepted: 31 March 2023 / Published: 5 April 2023

Abstract

:
As global warming continues to intensify, the relationship between diurnal temperature range (DTR) and vegetation productivity continues to change over time. However, the impact of DTR changes on vegetation activities remains uncertain. Thus, further study about how DTR changes affect the physiological activities of plants is also urgently needed. In this study, we employed copula function theory to analyze the impact of DTR on Normalized Difference Vegetation Index (NDVI) values during the spring, summer, and autumn seasons from 1982 to 2014 for various land types in the Inner Mongolia Plain (IMP), China. The results showed that the relationship between DTR and NDVI in the IMP was characterized by correlation at the upper tail and asymptotical independence at the lower tail. This demonstrated that the DTR had little effect on NDVI when they reached their minimum value. However, it has a significant impact on NDVI at its maximum values. This study provides valuable insight into the dynamic impact of monthly DTR on different land use types under climate change.

1. Introduction

Vegetation serves as a sensitive indicator of global climate change. The climate elements significantly affect the characteristics and dynamics of vegetation phenology, productivity, and distribution [1]. Therefore, understanding the response process of vegetation activities to climate change is critical to investigate the relationship between climate and vegetation [2]. Slight increase in temperature and precipitation can enhance vegetation activities, while excessive increase (above 3 °C for temperature or 50% for precipitation) can have a detrimental effect [3]. As global warming intensifies, the relationship between temperature and vegetation productivity evolves [4,5,6]. Normalized Difference Vegetation Index (NDVI) is widely used to characterize vegetation growth and coverage at various spatial and temporal scales [7,8]. However, individual studies of vegetation’s temporal and spatial variation characteristics or drought distribution cannot fully capture the complex relationship between vegetation and climate. The multivariate frequency method, by integrating univariate distributions, can analyze the relationship between vegetation and climate more accurately. Hence, employing a multivariate approach to investigate the interrelationship between vegetation and climate elements could provide a more accurate assessment of climate warming stress. Further studies are needed to understand the effect of temperature changes on the physiological activities of vegetation.
The diurnal temperature range (DTR), which is an important climate variable, is calculated as the monthly average of the difference between daily maximum temperature (TX) and daily minimum temperature (TN) [9]. The variations in DTR have significant impact on the growth and development of vegetation [10]. As a crucial factor in the vegetation ecosystem, the DTR affects the growth dynamics, structures, and functions of vegetation by altering its growth environments [11]. Based on long-term remote sensing data and meteorological data, previous studies have explored the spatiotemporal distribution characteristics of NDVI and its relationship with precipitation and temperature at various time scales [12,13,14]. However, limited research has been conducted on the effect of DTR on vegetation dynamics and the influence of seasonal asymmetric changes on vegetation activities [15]. Therefore, further investigation is needed to fully understand the impact of DTR on vegetation and its response to seasonal changes.
In recent years, the effects of climate change on vegetation have been studied through the use of correlation coefficients, linear regression, and probability evaluation models [16,17,18]. For instance, Vicente–Serrano et al. evaluated the resilience and resistance of vegetation to drought under climate change by analyzing the linear correlation between the Standardized Precipitation Evapotranspiration Index (SPEI) and the NDVI at various time scales [19]. While previous research primarily focused on the analysis of a single variable, the growth of vegetation is influenced by multiple factors. The copula method, widely used in statistics to model the interdependence between two or more variables, offers a comprehensive approach to examining the relationship between multiple variables [20,21,22,23]. Furthermore, previous research has mainly analyzed the mean status of climate change; however, it is the more frequent extreme climate events that have had a greater impact on ecosystems in recent years [24]. Therefore, it is important to consider the effects of extreme events when analyzing the impact of climate change on vegetation dynamics.
The Inner Mongolian steppe represents a substantial grassland ecosystem located in Northern China, comprising 13.5% of the total area of grassland in the region, and playing significant ecological roles [25]. Global warming has a significant impact on vegetation growth and species migration to colder and more humid places. The asymmetry of DTR and differences in geographical and social environments have substantial impacts on the change of vegetation patterns across various regions [26]. Despite this, there is still limited understanding of the vegetation dynamics over the long-term and its responses to extreme climate events in the IMP [27].
Hence, we propose a joint distribution model to comprehensively investigate the interaction between DTR and NDVI during spring, summer, and autumn across various land types in the IMP. This model combines the cutting-edge remote sensing model with a statistical model to quantify the joint distribution and probability of DTR and NDVI in different seasons. The findings from this study have potential implications for decision-making in developing adaptation measures in IMP and other agricultural farming zones.
The rest of the article is structured as follows. Section 2 provides details of the study region. Section 3 presents the dataset and copula-based framework. Section 4 contains the results of the analysis. Section 5 discusses the advantages and limitations of this work. Finally, Section 6 provides a summary of the study.

2. Research Area

The Inner Mongolia Plateau (IMP), a region of significant ecological and agricultural importance, was selected as the study area for this research (Figure 1). It is located in northern China and encompasses a wide range of elevations, ranging from 82 to 3430 m above sea level [28]. The region is characterized by a diversity of climates, with most areas being classified as arid, semi-arid, or semi-humid, with the distribution of these climates gradually shifting from west to east. Meanwhile, precipitation gradually decreases from east to west, with an annual variation ranging from 50 to 450 mm [27]. The average annual temperature in the region is approximately −1 to 10 °C. This complex topography and distance from the oceans, results in vast grasslands in the east and deserts widespread in the west [27]. As one of the most important bases for agriculture and livestock production, the IMP is highly sensitive and vulnerable to change in the DTR.

3. Materials and Methods

3.1. Meteorological Data and Preprocessing

The daily temperature data was collected for the period 1982–2014 from 90 meteorological stations located in various land types in the IMP, provided by the China Meteorological Administration (https://data.cma.cn) (accessed on 3 March 2021). According to the growth laws of vegetation in the IMP, the months from March to May, June to August, and September to October are designated as spring, summer, and autumn, respectively. These three seasons approximately align with the three physiological stages of vegetation, which involve the transition from green to maturing, maturing to aging, and aging to hibernating.

3.2. NDVI Data and Preprocessing

The NDVI dataset utilized in this study spans from 1982 to 2014 and is comprised of Advanced Very-High-Resolution Radiometer (AVHRR) data and Moderate-Resolution Imaging Spectroradiometer (MODIS) data, respectively. This dataset has been extensively employed to examine large-scale alterations in vegetation phenology at the regional scales [26]. To minimize the impact of cloud or noise in the daily NDVI images, a formula for NDVI calculation was applied using the surface reflectance data of AVHRR and MODIS to generate daily NDVI data. The daily NDVI data of AVHRR and MODIS were synthesized into monthly NDVI data through the Maximum Value Composites (MVC) method.

3.3. Maximum Value Composites

In this study, we employed the MVC technique proposed by Holben to mitigate the influence of atmospheric conditions [24]. The specific formula of MVC is as follows:
N D V I i = M a x N D V I i j ,
where N D V I i refers to the NDVI in the ith month or the ith year, and N D V I i j refers to the NDVI data on the jth 15-day in the ith month or on the jth month in the ith year.

3.4. Dependence Modelling via Copulas

We define the joint distribution of DTR and NDVI, F D T R , N D V I as F D T R , N D V I = C F D T R , F N D V I where F D T R and F N D V I are marginal distributions of DTR and NDVI, and C is the associated dependence function, i.e., copula, modelling the dependence between DTR and NDVI independently from their marginal distributions [29,30]. Hence, we select marginal distributions among the most commonly used distribution functions for extremes, namely: generalized extreme value (GEV), Pearson type III (P-III), Gumbel, exponential, and Weibull.
The copula function provided by Sklar can model the dependence structure and joint probability distributions. In this study, Gaussian, T, Clayton, Frank, and Gumbel copula functions are selected to establish joint distribution between DTR and NDVI. These five copula functions have always been common choices for related models due to their performances. Table 1 presents the various copula function forms used in the analysis.
In order to assess the accuracy of the fitting and to determine the appropriate copula function using a non-parametric estimation method, the Akaike information criterion (AIC), Bayesian information criterion (BIC), and root mean square error (RMSE) are utilized as the selection criteria for the copula function clusters.
A I C = 2 ι θ ^ y + 2 K ,
B I C = 2 ι θ ^ y + K l n n ,
K is the number of estimated parameters in the model, including the intercept, and ι θ ^ y is a log-likelihood at its maximum point of the estimated model; n is a sample size. The rule of selection was that the smaller the value of the AIC, the better the model, and the same for the BIC, thus
R M S E = 1 n i = 1 n X C i X O I 2 ,
where n is the number of observations; X C is the theoretical probability of copula; and X O is the empirical probabilities of observations. It is also worth noting that the dependence between DTR and NDVI is given by their linear correlation, i.e., Spearman’s ρ , or concordant/discordant pairs, i.e., Kendall τ .

4. Results

4.1. Trend Analysis of Seasonal DTR and NDVI

Figure 2 shows the trends of DTR and NDVI for the seasons of spring, summer, and autumn, across different land types (forest, forest-steppe, typical steppe, and desert steppe) from 1982 to 2014. The DTR and NDVI values for each season were obtained by computing the average of all the pixels in corresponding images. The results indicate a declining trend in the inter-annual range of DTR during the spring season, while a noticeable upward trend in DTR was observed in the summer and autumn seasons. This is consistent with the characteristics of global warming, reflecting an increase in temperature. The highest value of DTR in the IMP was 17.61 °C while the lowest value was 10.29 °C. The highest values of DTR were predominantly distributed in forests, and the lowest values were primarily in the typical steppe.
Figure 2 shows the changing trends of NDVI during spring, summer, and autumn in forest, forest-steppe, typical steppe, and desert steppe. Among the three seasons, summer exhibited the highest overall NDVI, with a relatively small annual variation and a slightly declining trend. The NDVI of the forest, forest-steppe, typical steppe, and desert steppe displayed an obvious upward trend. During the summer season, the NDVI of the forest, forest-steppe, and desert steppe demonstrated a decline, while that of the typical steppe revealed an increase. In autumn, the NDVI of the forests showed an upward trend, while the other land types exhibited a downward trend.

4.2. Dependency between DTR and NDVI

We used Kendall and Spearman coefficients to quantify the correlation between DTR and NDVI in different seasons and land types. The results indicate a significant positive correlation between DTR and NDVI across seasons and land types (p < 0.0001). The analysis of the seasonal DTR and NDVI from 1982 to 2014 shows that different seasons and land types exhibited varying responses to DTR, demonstrating the significant role that DTR plays in vegetation growth.
Table 2 shows that different seasons had different responses to DTR in different land types. The findings in Table 2 indicate a strong dependence on DTR for autumn, with a significant positive correlation ( τ > 0.42) between DTR and NDVI (p < 0.0001). The typical steppe showed a high sensitivity to DTR changes, as reflected in its significant positive correlation (0.3608, 0.3432, and 0.4523). The desert steppe had a weak response to DTR in the spring season but higher positive correlations in summer and autumn, indicating that the increased DTR accelerated vegetation growth during these seasons. Additionally, the results reveal that the NDVI in forest and forest-steppe exhibited a weak response to DTR in the spring and summer seasons, with a coefficient lower than 0.3. However, in the autumn, DTR showed positive correlations with NDVI, where the highest coefficient was 0.4282. This demonstrates a positive impact of high DTR on vegetation growth in the forest during this season.

4.3. Parameter Estimation and Selection of Copula Function

The marginal distributions were employed to transform DTR and NDVI into uniform marginals, u D T R and u N D V I , correspondingly. Then, the optimal copula was selected among the Clayton, T, Frank, Gumbel, and Gaussian copula families. The parameters of each family were estimated using the maximum likelihood method, and RMSE criteria were calculated for these copulas. The family with the lowest RMSE value was then chosen. Only the log-likelihood can be used to evaluate the model fit for the criteria AIC or BIC. However, there is no definite conclusion regarding the specific form of dependence. For instance, the Gumbel copula would be a suitable function for forests during the spring season. The Frank copula is the most appropriate fit for DTR and NDVI for typical steppe during the spring season.
Based on the optimal copula function selected through the criteria of the maximum likelihood method, we calculated the joint probability distributions of DTR and NDVI during spring, summer, and autumn in forest, forest-steppe, typical steppe, and desert steppe.
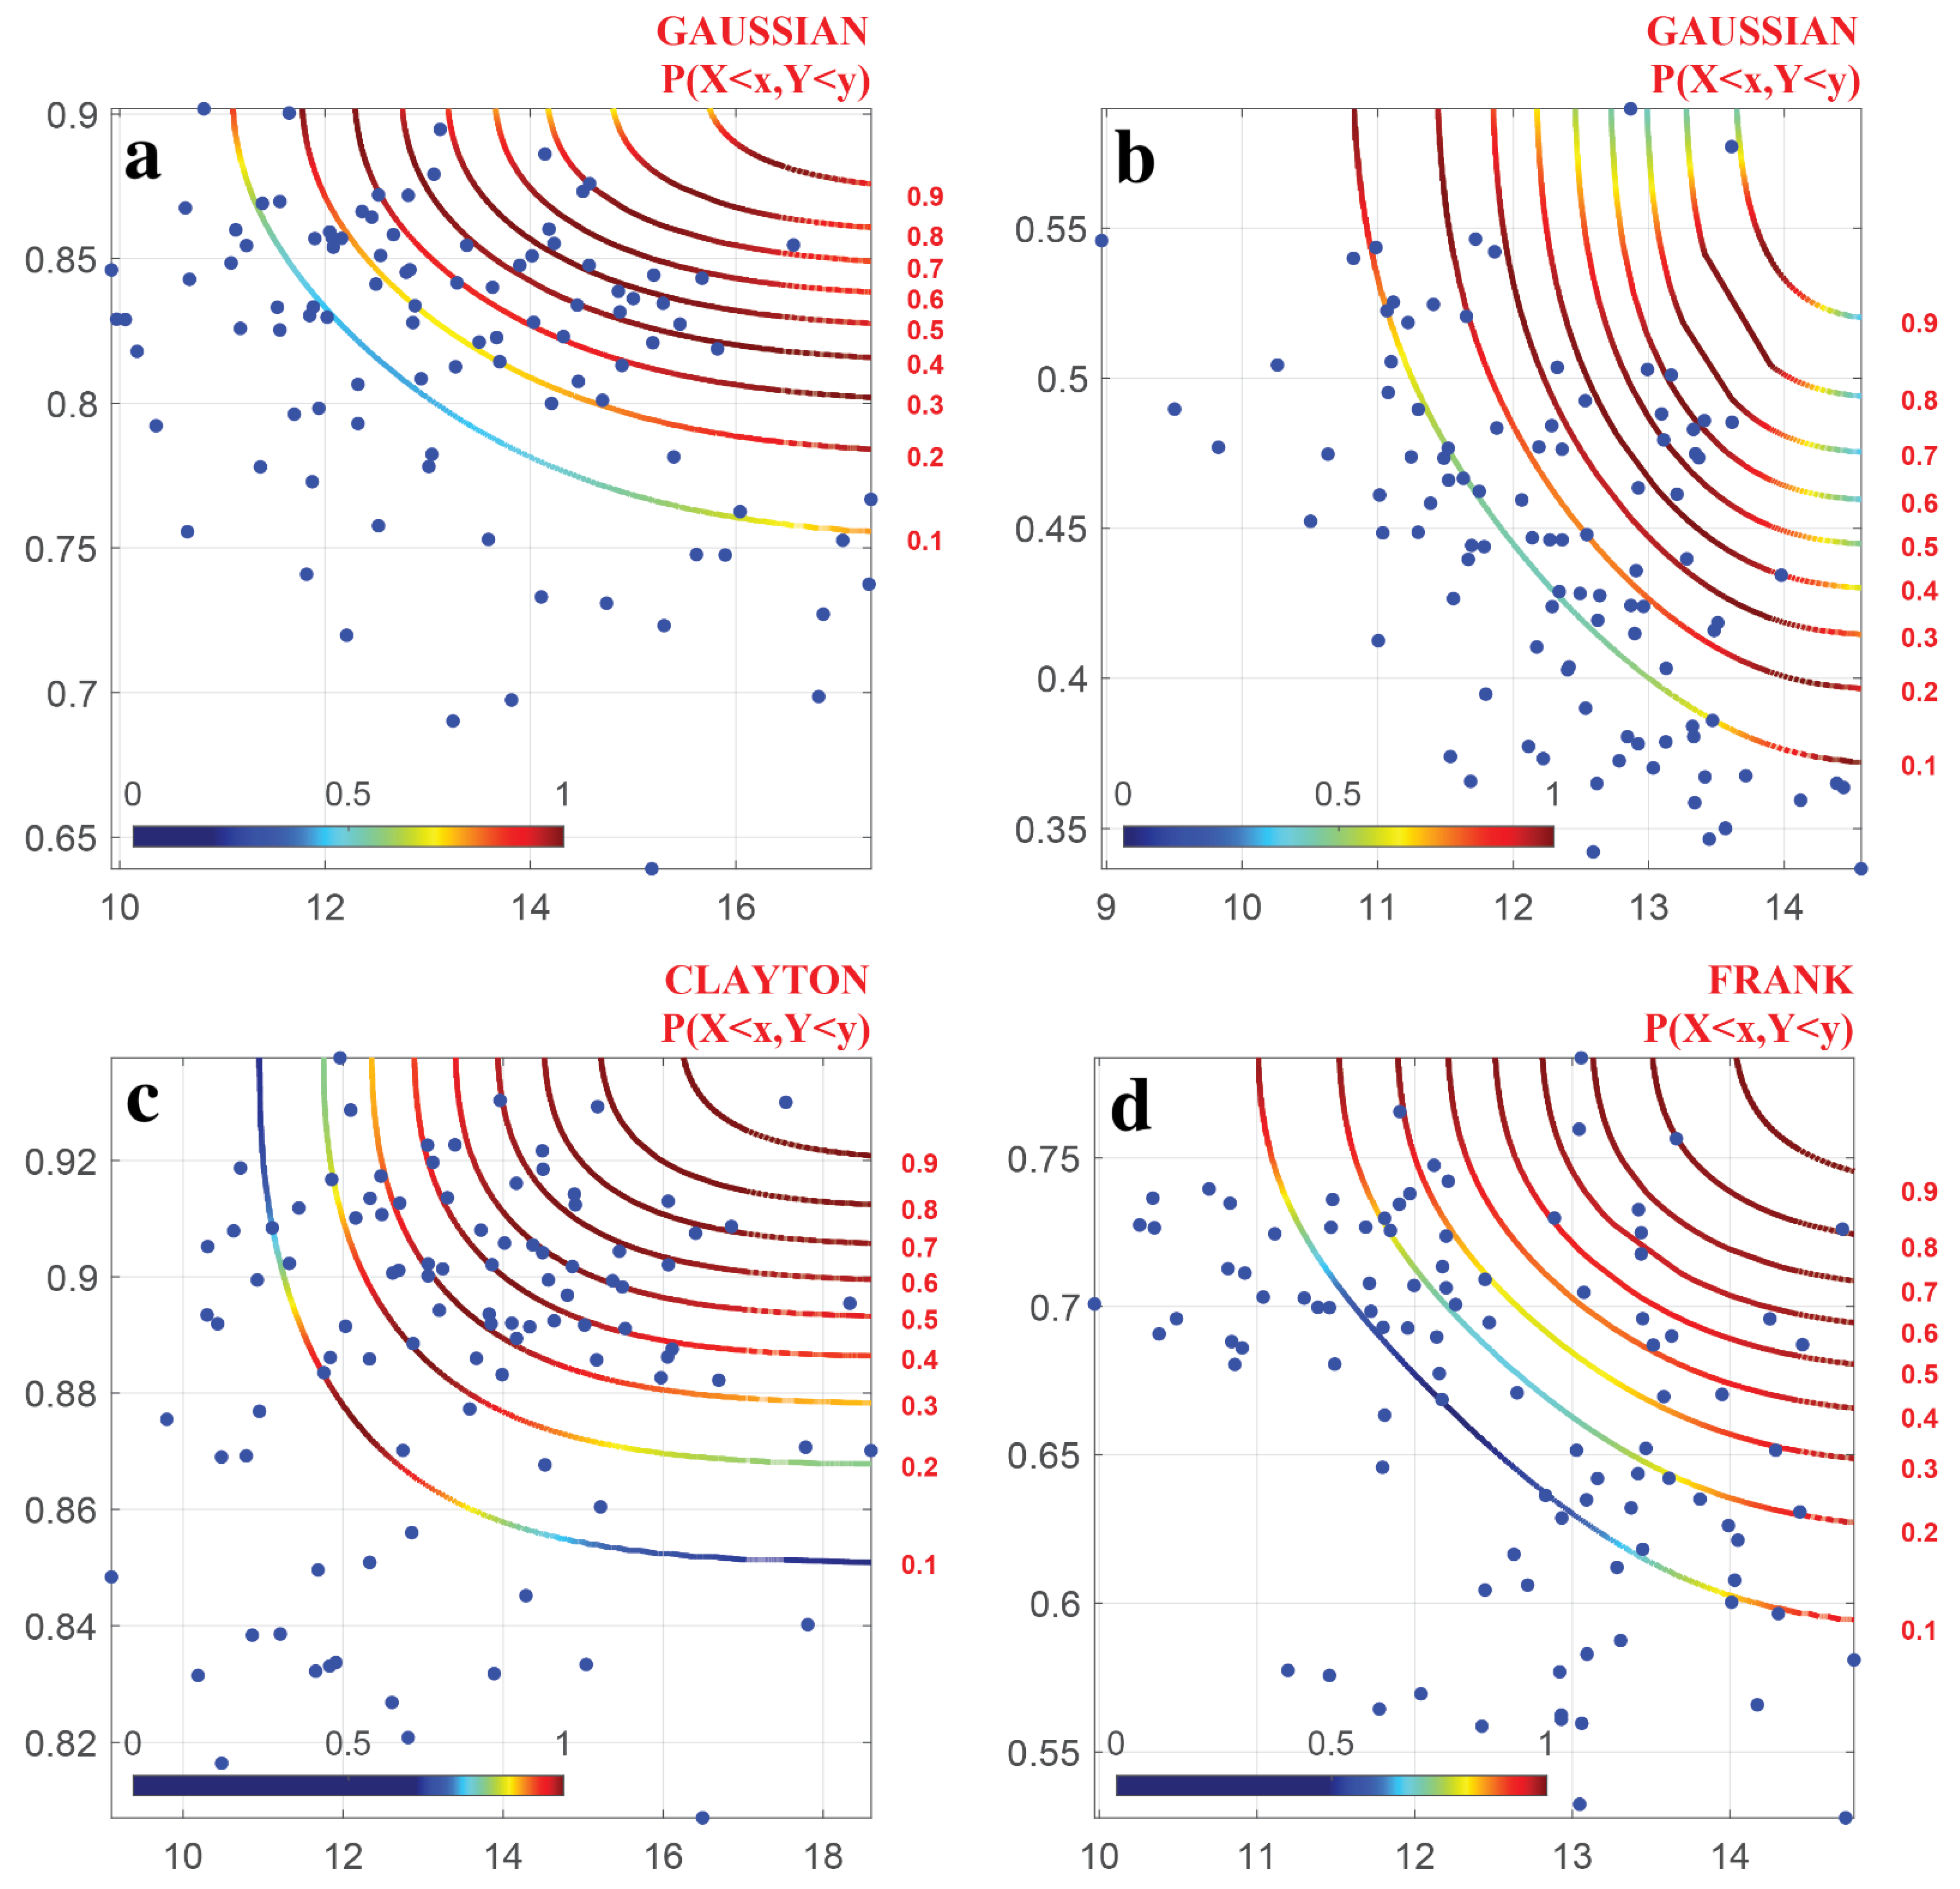
Figure 3 depicts the joint probability distribution relationship of the monthly DTR and NDVI during spring across different land types. The joint probability distribution function offers insights into the correlations of DTR and NDVI across different value ranges. The figure reveals an asymmetric and tilted dependency structure of monthly scale data, wherein minimum DTR values had minimal impact on NDVI, while maximum DTR values had a significant impact on NDVI. A contour map can be used to derive the interval distribution of DTR-NDVI for joint probabilities of 0.1–0.9. Higher joint probabilities correspond to larger NDVI values or larger DTR values. Moreover, joint probabilities of different DTR and NDVI combinations on the same contour line display significant differences. For instance, in Figure 3, when DTR was greater than 14 °C in a typical steppe, the joint probability was more than 0.7, indicating that plant growth was likely to be in a good state. Conversely, on the same probability contour line (probability = 0.7), the probability was higher for DTR values in the interval of 14–16 °C compared to the interval of 12–14 °C.
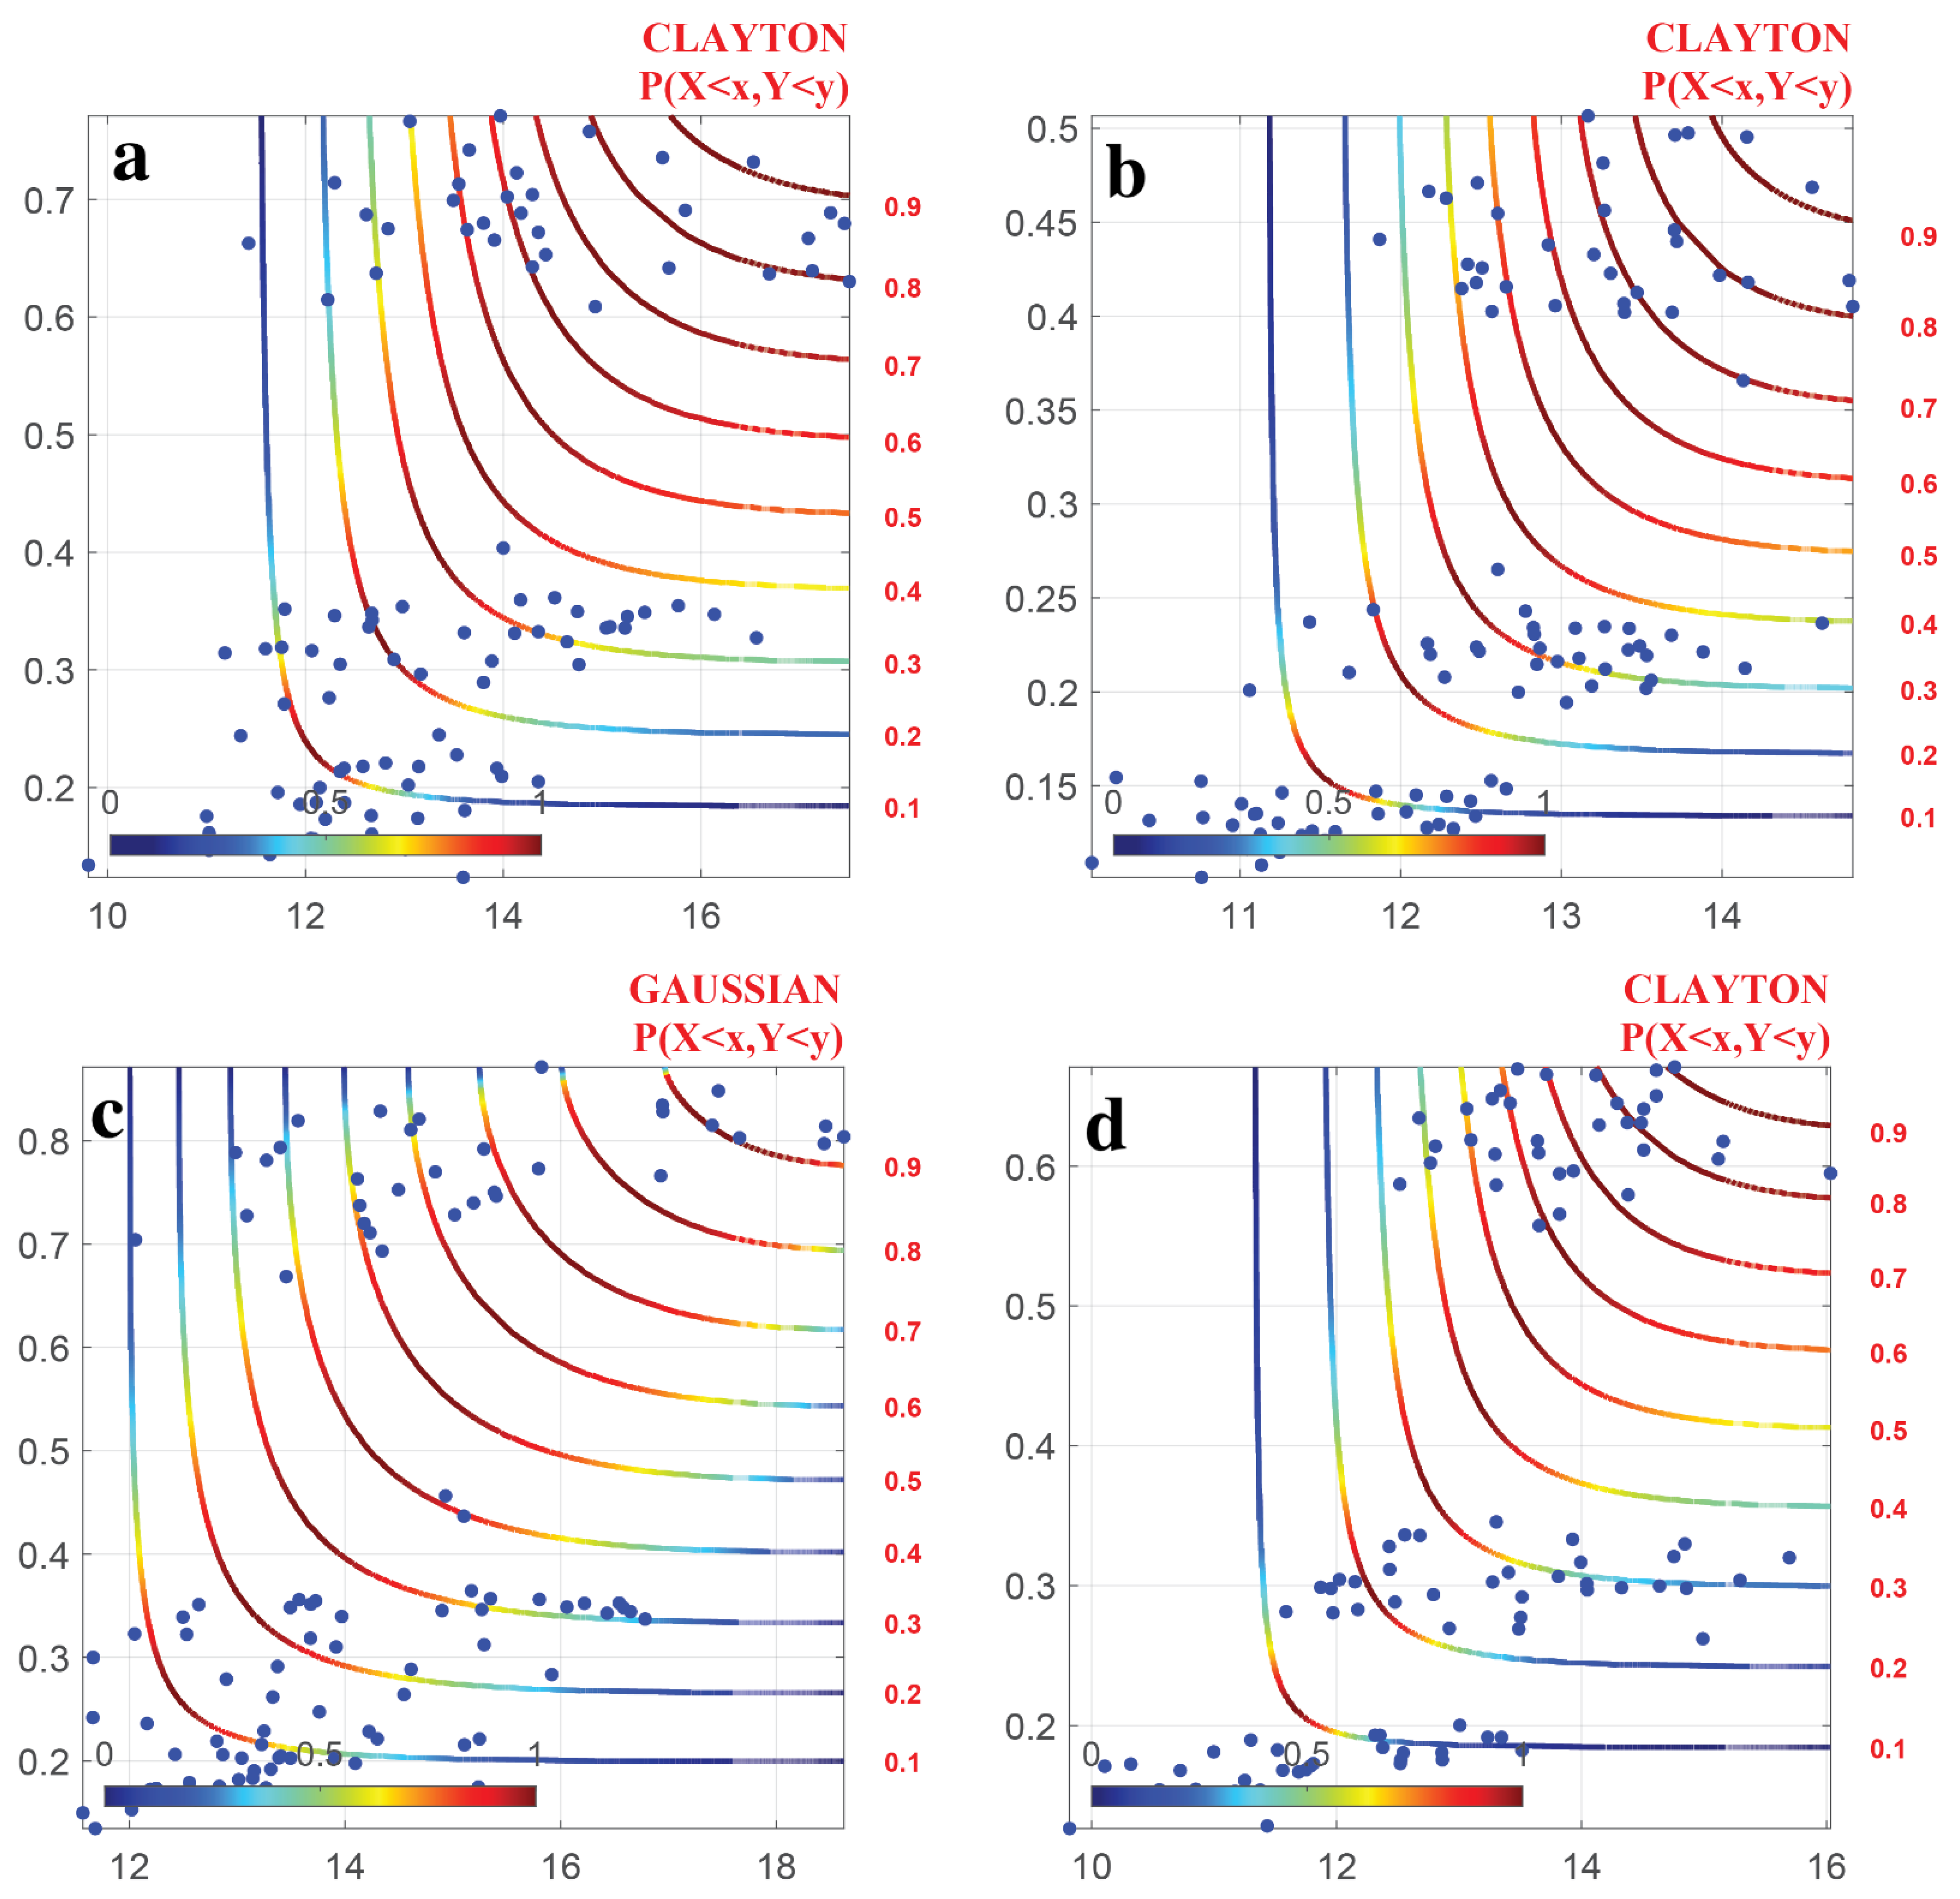
Figure 4 displays the dependency relationship between monthly DTR and NDVI during the growing season from 1982 to 2014 in different land types, including forest, forest-steppe, typical steppe, and desert steppe. The figure shows the values of the DTR and the NDVI when the joint probability is 0.1–0.9. One of the main features of the figure is an asymmetric and inclined dependency structure of monthly scale data. The joint probability was greater when the NDVI was larger at a fixed DTR value or when the DTR was greater at a fixed NDVI value. The probability distribution function of the DTR and NDVI also demonstrated that the upper tail was higher than the lower tail. Specifically, the minimum DTR had a negligible effect on the NDVI, while the maximum DTR had a substantial impact. The threshold values of DTR were 13 °C (forest), 12.5 °C (forest-steppe), 12.7 °C (typical steppe), and 13.1 °C (desert steppe), respectively, with NDVI values of 0.89, 0.68, 0.44, and 0.83. For each of these DTR intervals, the joint probabilities of the two were greater than 0.5, indicating a greater impact on the NDVI.
Figure 5 displays the isograms of the joint exceedance probabilities of DTR and NDVI in the forest, forest-steppe, typical steppe, and desert steppe. According to the joint exceedance probability graph, we obtain the joint exceedance probabilities for any arbitrary mean values of DTR and NDVI. The figure shows the different combinations of DTR and NDVI that were both greater than or equal to a specific value when the joint exceedance probabilities were 0.1–0.9, respectively. The joint exceedance probability increased as the values of the DTR and the NDVI decreased, implying that the occurrence probability of both the DTR and the NDVI exceeding a smaller value was greater than the probability of both exceeding a larger value.

5. Discussion

5.1. Change of NDVI in Different Land Use Types

During the period from 1982 to 2014, the monthly NDVI during spring exhibited an overall increasing trend in the forest, desert steppe, forest-steppe, and typical steppe. This finding is consistent with the findings of previous studies on the NDVI changes in the Inner Mongolia Plateau. The positive correlation between DTR and NDVI across all vegetation types suggests that a larger daily temperature range promotes vegetation growth. This relationship can be explained by the fact that warmer daytime temperatures increase plant photosynthesis, while cooler nighttime temperatures reduce respiration, leading to higher net photosynthetic accumulation and ultimately favoring the growth and development of vegetation, as described in previous research [23].

5.2. Response of NDVI to DTR

Compared to the correlation analysis of NDVI with DTR on an annual and seasonal scale, examining the response of NDVI to DTR on a monthly scale provides a deeper understanding of the influence of hydrothermal changes on NDVI [16,31]. The analysis of monthly time series can effectively depict the long-term correlation between NDVI and climate factors while removing the seasonal fluctuations caused by temperature, precipitation, solar radiation, and agricultural production. This approach provides a more rigorous means to investigate the response mechanism of NDVI to climate factors. Therefore, this study analyzes the response characteristics of monthly NDVI to DTR. When DTR falls within an appropriate range, plants’ physiological activities accelerate, leading to higher NDVI. Insufficient heat reduces the physiological activities of plants, which slows down their growth, causing them to wither. However, when DTR is too high, increased temperature enhances evapotranspiration, causing excessive consumption of soil water and ultimately adversely affecting vegetation growth [32].

5.3. Uncertainties in This Study

Vegetation growth is influenced by both natural climate change and anthropogenic activities. While deseasonalization of NDVI data can reduce signals associated with seasonal characteristics such as temperature, precipitation, and regular agricultural activities, the contribution of human activities to NDVI changes is still unclear and needs further quantification. Moreover, the low spatial resolution of NDVI data may limit the ability to detect and assess the influence of climate factors. Therefore, further research should focus on constructing high-resolution vegetation index datasets and exploring the attribution of regional vegetation cover changes. It is noteworthy to investigate the effects of asymmetric day-and-night warming on natural ecosystems, as global warming rates vary both spatially and temporally and can significantly impact the growth of vegetation. To improve the robustness of our findings, future studies could explore the use of high-resolution vegetation index datasets and separate the impact of human activities from natural climate change.

6. Conclusions

In this study, we employed meteorological and satellite remote sensing data from 1982 to 2014 to analyze the impact of DTR on NDVI across different land types. The copula theory was employed to discuss the response characteristics of NDVI in IMP to monthly DTR. The main conclusions are as follows:
(1)
During 1982 to 2014, seasonal DTR trends indicated significant increases during summer and autumn, while showing decreases in spring for the four land types. Summer had the highest overall NDVI with a slightly decreasing trend, while the NDVI of forest, forest-steppe, typical steppe, and desert steppe showed an overall increasing trend. During summer, the NDVI of the forest, forest-steppe and desert steppe decreased, and that of the typical steppe increased. During autumn, the NDVI of the forest increased while others decreased.
(2)
We found that the effects of DTR on vegetation in different land types showed seasonal variations. NDVI was found to be highly responsive to DTR throughout the growing season. Vegetation in the typical steppe was more sensitive to changes in DTR as it promotes vegetation growth and development. In autumn and summer, DTR showed positive correlations with NDVI in forest and forest-steppe, while the coefficient of DTR and NDVI was lower than 0.3 during spring and summer.
(3)
The joint distribution of DTR and NDVI indicate that when DTR and NDVI reached their minimum values, DTR had little effect on NDVI, while they had a significant impact on NDVI when they reached their maximum values. The probability of plant growth inhibition was higher when the climate factor exceeded a certain threshold.

Author Contributions

Conceptualization, H.X. and J.T.; methodology, H.X., J.T. and C.L.; software, H.X. and J.T.; validation, H.X., J.T. and Y.N.; data curation, H.X. and C.L.; writing—review and editing, H.X., J.T., C.L. and J.W. All authors have read and agreed to the published version of the manuscript.

Funding

The authors would like to thank the sponsors of this work: the National Natural Science Foundation of China (grant no. 42001222), the Major Program of National Social Science Foundation of China (grant no. 18ZDA105).

Data Availability Statement

The data are available from the corresponding author on reasonable request.

Acknowledgments

We are thankful to all who helped in this study and grateful to anonymous reviewers for their comments, which allowed us to improve the initial manuscript.

Conflicts of Interest

The authors declare no conflict of interest.

References

  1. Jiang, B.; Liang, S.; Yuan, W. Observational evidence for impacts of vegetation change on local surface climate over northern China using the Granger causality test. J. Geophys. Res. Biogeosciences 2015, 120, 1–12. [Google Scholar] [CrossRef]
  2. Zhao, Q.; Ma, X.; Liang, L.; Yao, W. Spatial–Temporal Variation Characteristics of Multiple Meteorological Variables and Vegetation over the Loess Plateau Region. Appl. Sci. 2020, 10, 1000. [Google Scholar] [CrossRef] [Green Version]
  3. Shen, M.; Piao, S.; Jeong, S.-J.; Zhou, L.; Zeng, Z.; Ciais, P.; Chen, D.; Huang, M.; Jin, C.-S.; Li, L.Z. Evaporative cooling over the Tibetan Plateau induced by vegetation growth. Proc. Natl. Acad. Sci. USA 2015, 112, 9299–9304. [Google Scholar] [CrossRef] [PubMed] [Green Version]
  4. Piao, S.; Nan, H.; Huntingford, C.; Ciais, P.; Friedlingstein, P.; Sitch, S.; Peng, S.; Ahlström, A.; Canadell, J.G.; Cong, N. Evidence for a weakening relationship between interannual temperature variability and northern vegetation activity. Nat. Commun. 2014, 5, 5018. [Google Scholar] [CrossRef] [Green Version]
  5. Piao, S.; Liu, Q.; Chen, A.; Janssens, I.A.; Fu, Y.; Dai, J.; Liu, L.; Lian, X.; Shen, M.; Zhu, X. Plant phenology and global climate change: Current progresses and challenges. Glob. Chang. Biol. 2019, 25, 1922–1940. [Google Scholar] [CrossRef]
  6. Piao, S.; Mohammat, A.; Fang, J.; Cai, Q.; Feng, J. NDVI-based increase in growth of temperate grasslands and its responses to climate changes in China. Glob. Environ. Chang. 2006, 16, 340–348. [Google Scholar] [CrossRef]
  7. Tang, R.; He, B.; Chen, H.W.; Chen, D.; Chen, Y.; Fu, Y.H.; Yuan, W.; Li, B.; Li, Z.; Guo, L. Increasing terrestrial ecosystem carbon release in response to autumn cooling and warming. Nat. Clim. Chang. 2022, 12, 380–385. [Google Scholar] [CrossRef]
  8. Dusenge, M.E.; Duarte, A.G.; Way, D.A. Plant carbon metabolism and climate change: Elevated CO2 and temperature impacts on photosynthesis, photorespiration and respiration. New Phytol. 2019, 221, 32–49. [Google Scholar] [CrossRef] [Green Version]
  9. Kong, D.; Miao, C.; Duan, Q.; Lei, X.; Li, H. Vegetation-Climate Interactions on the Loess Plateau: A Nonlinear Granger Causality Analysis. J. Geophys. Res. Atmos. 2018, 123, 11068–11079. [Google Scholar] [CrossRef]
  10. Tan, J.; Piao, S.; Chen, A.; Zeng, Z.; Ciais, P.; Janssens, I.A.; Mao, J.; Myneni, R.B.; Peng, S.; Peñuelas, J. Seasonally different response of photosynthetic activity to daytime and night-time warming in the Northern Hemisphere. Glob. Change Biol. 2015, 21, 377–387. [Google Scholar] [CrossRef]
  11. He, G.; Li, Z. Asymmetry of Daytime and Nighttime Warming in Typical Climatic Zones along the Eastern Coast of China and Its Influence on Vegetation Activities. Remote Sens. 2020, 12, 3604. [Google Scholar] [CrossRef]
  12. He, G.; Zhen, X.; Li, Z.; Shen, W.; Han, J.; Zhang, L.; Li, X.; Zhang, R. Influence of variations of hydrothermal conditions on normalized difference vegetation index in typical temperature zones along the east coast of China. Front. Earth Sci. 2020, 8, 574101. [Google Scholar] [CrossRef]
  13. Cui, L.; Wang, L.; Qu, S.; Singh, R.P.; Lai, Z.; Yao, R. Spatiotemporal extremes of temperature and precipitation during 1960–2015 in the Yangtze River Basin (China) and impacts on vegetation dynamics. Theor. Appl. Climatol. 2019, 136, 675–692. [Google Scholar] [CrossRef]
  14. Luo, M.; Sa, C.; Meng, F.; Duan, Y.; Liu, T.; Bao, Y. Assessing extreme climatic changes on a monthly scale and their implications for vegetation in Central Asia. J. Clean. Prod. 2020, 271, 122396. [Google Scholar] [CrossRef]
  15. Wang, S.; Liu, Q.; Huang, C. Vegetation Change and Its Response to Climate Extremes in the Arid Region of Northwest China. Remote Sens. 2021, 13, 1230. [Google Scholar] [CrossRef]
  16. Peng, S.; Piao, S.; Ciais, P.; Myneni, R.B.; Chen, A.; Chevallier, F.; Dolman, A.J.; Janssens, I.A.; Penuelas, J.; Zhang, G. Asymmetric effects of daytime and night-time warming on Northern Hemisphere vegetation. Nature 2013, 501, 88–92. [Google Scholar] [CrossRef]
  17. Liu, Z.; Peng, C.; Xiang, W.; Tian, D.; Deng, X.; Zhao, M. Application of artificial neural networks in global climate change and ecological research: An overview. Chin. Sci. Bull. 2010, 55, 3853–3863. [Google Scholar] [CrossRef]
  18. Bouraoui, F.; Vachaud, G.; Li, L.; Le Treut, H.; Chen, T. Evaluation of the impact of climate changes on water storage and groundwater recharge at the watershed scale. Clim. Dyn. 1999, 15, 153–161. [Google Scholar] [CrossRef]
  19. Vicente-Serrano, S.M.; Gouveia, C.; Camarero, J.J.; Beguería, S.; Trigo, R.; López-Moreno, J.I.; Azorín-Molina, C.; Pasho, E.; Lorenzo-Lacruz, J.; Revuelto, J. Response of vegetation to drought time-scales across global land biomes. Proc. Natl. Acad. Sci. USA 2013, 110, 52–57. [Google Scholar] [CrossRef] [Green Version]
  20. Zhao, J.; Huang, S.; Huang, Q.; Wang, H.; Leng, G.; Peng, J.; Dong, H. Copula-based abrupt variations detection in the relationship of seasonal vegetation-climate in the Jing River Basin, China. Remote Sens. 2019, 11, 1628. [Google Scholar] [CrossRef] [Green Version]
  21. Wu, Y.; Zhang, X.; Fu, Y.; Hao, F.; Yin, G. Response of vegetation to changes in temperature and precipitation at a semi-arid area of Northern China based on multi-statistical methods. Forests 2020, 11, 340. [Google Scholar] [CrossRef] [Green Version]
  22. Li, H.; Li, Y.; Huang, G.; Sun, J. Quantifying effects of compound dry-hot extremes on vegetation in Xinjiang (China) using a vine-copula conditional probability model. Agric. For. Meteorol. 2021, 311, 108658. [Google Scholar] [CrossRef]
  23. Won, J.; Seo, J.; Kim, S. A copula model integrating atmospheric moisture demand and supply for vegetation vulnerability mapping. Sci. Total Environ. 2022, 812, 151464. [Google Scholar] [CrossRef]
  24. Singh, B.R.; Singh, O. Study of impacts of global warming on climate change: Rise in sea level and disaster frequency. In Global Warming—Impacts and Future Perspective; Singh, B.R., Singh, O., Eds.; Intech Open: London, UK, 2012; p. 5816. [Google Scholar]
  25. Li, C.; Wang, J.; Hu, R.; Yin, S.; Bao, Y.; Ayal, D.Y. Relationship between vegetation change and extreme climate indices on the Inner Mongolia Plateau, China, from 1982 to 2013. Ecol. Indic. 2018, 89, 101–109. [Google Scholar] [CrossRef]
  26. Li, C.; Leal Filho, W.; Yin, J.; Hu, R.; Wang, J.; Yang, C.; Yin, S.; Bo, Y.; Ayal, D.Y. Assessing vegetation response to multi-time-scale drought across inner Mongolia plateau. J. Clean. Prod. 2018, 179, 210–216. [Google Scholar] [CrossRef]
  27. Li, C.; Wang, J.; Yin, S.; Bao, Y.; Li, Y.; Yu, S. Drought hazard assessment and possible adaptation options for typical steppe grassland in Xilingol League, Inner Mongolia, China. Theor. Appl. Climatol. 2019, 136, 1339–1346. [Google Scholar] [CrossRef]
  28. Na, R.; Na, L.; Du, H.; He, H.S.; Shan, Y.; Zong, S.; Huang, L.; Yang, Y.; Wu, Z. Vegetation Greenness Variations and Response to Climate Change in the Arid and Semi-Arid Transition Zone of the Mongo-Lian Plateau during 1982–2015. Remote Sens. 2021, 13, 4066. [Google Scholar] [CrossRef]
  29. Sklar, A. Random variables, joint distribution functions, and copulas. Kybernetika 1973, 9, 449–460. [Google Scholar]
  30. Salvadori, G.; De Michele, C. Frequency analysis via copulas: Theoretical aspects and applications to hydrological events. Water Resour. Res. 2004, 40, W12511. [Google Scholar] [CrossRef]
  31. Sun, D.; Pinker, R.T.; Kafatos, M. Diurnal temperature range over the United States: A satellite view. Geophys. Res. Lett. 2006, 33, L05705. [Google Scholar] [CrossRef] [Green Version]
  32. Yuan, G.; Zhang, L.; Liang, J.; Cao, X.; Guo, Q.; Yang, Z. Impacts of initial soil moisture and vegetation on the diurnal temperature range in arid and semiarid regions in China. J. Geophys. Res. Atmos. 2017, 122, 11568–11583. [Google Scholar] [CrossRef]
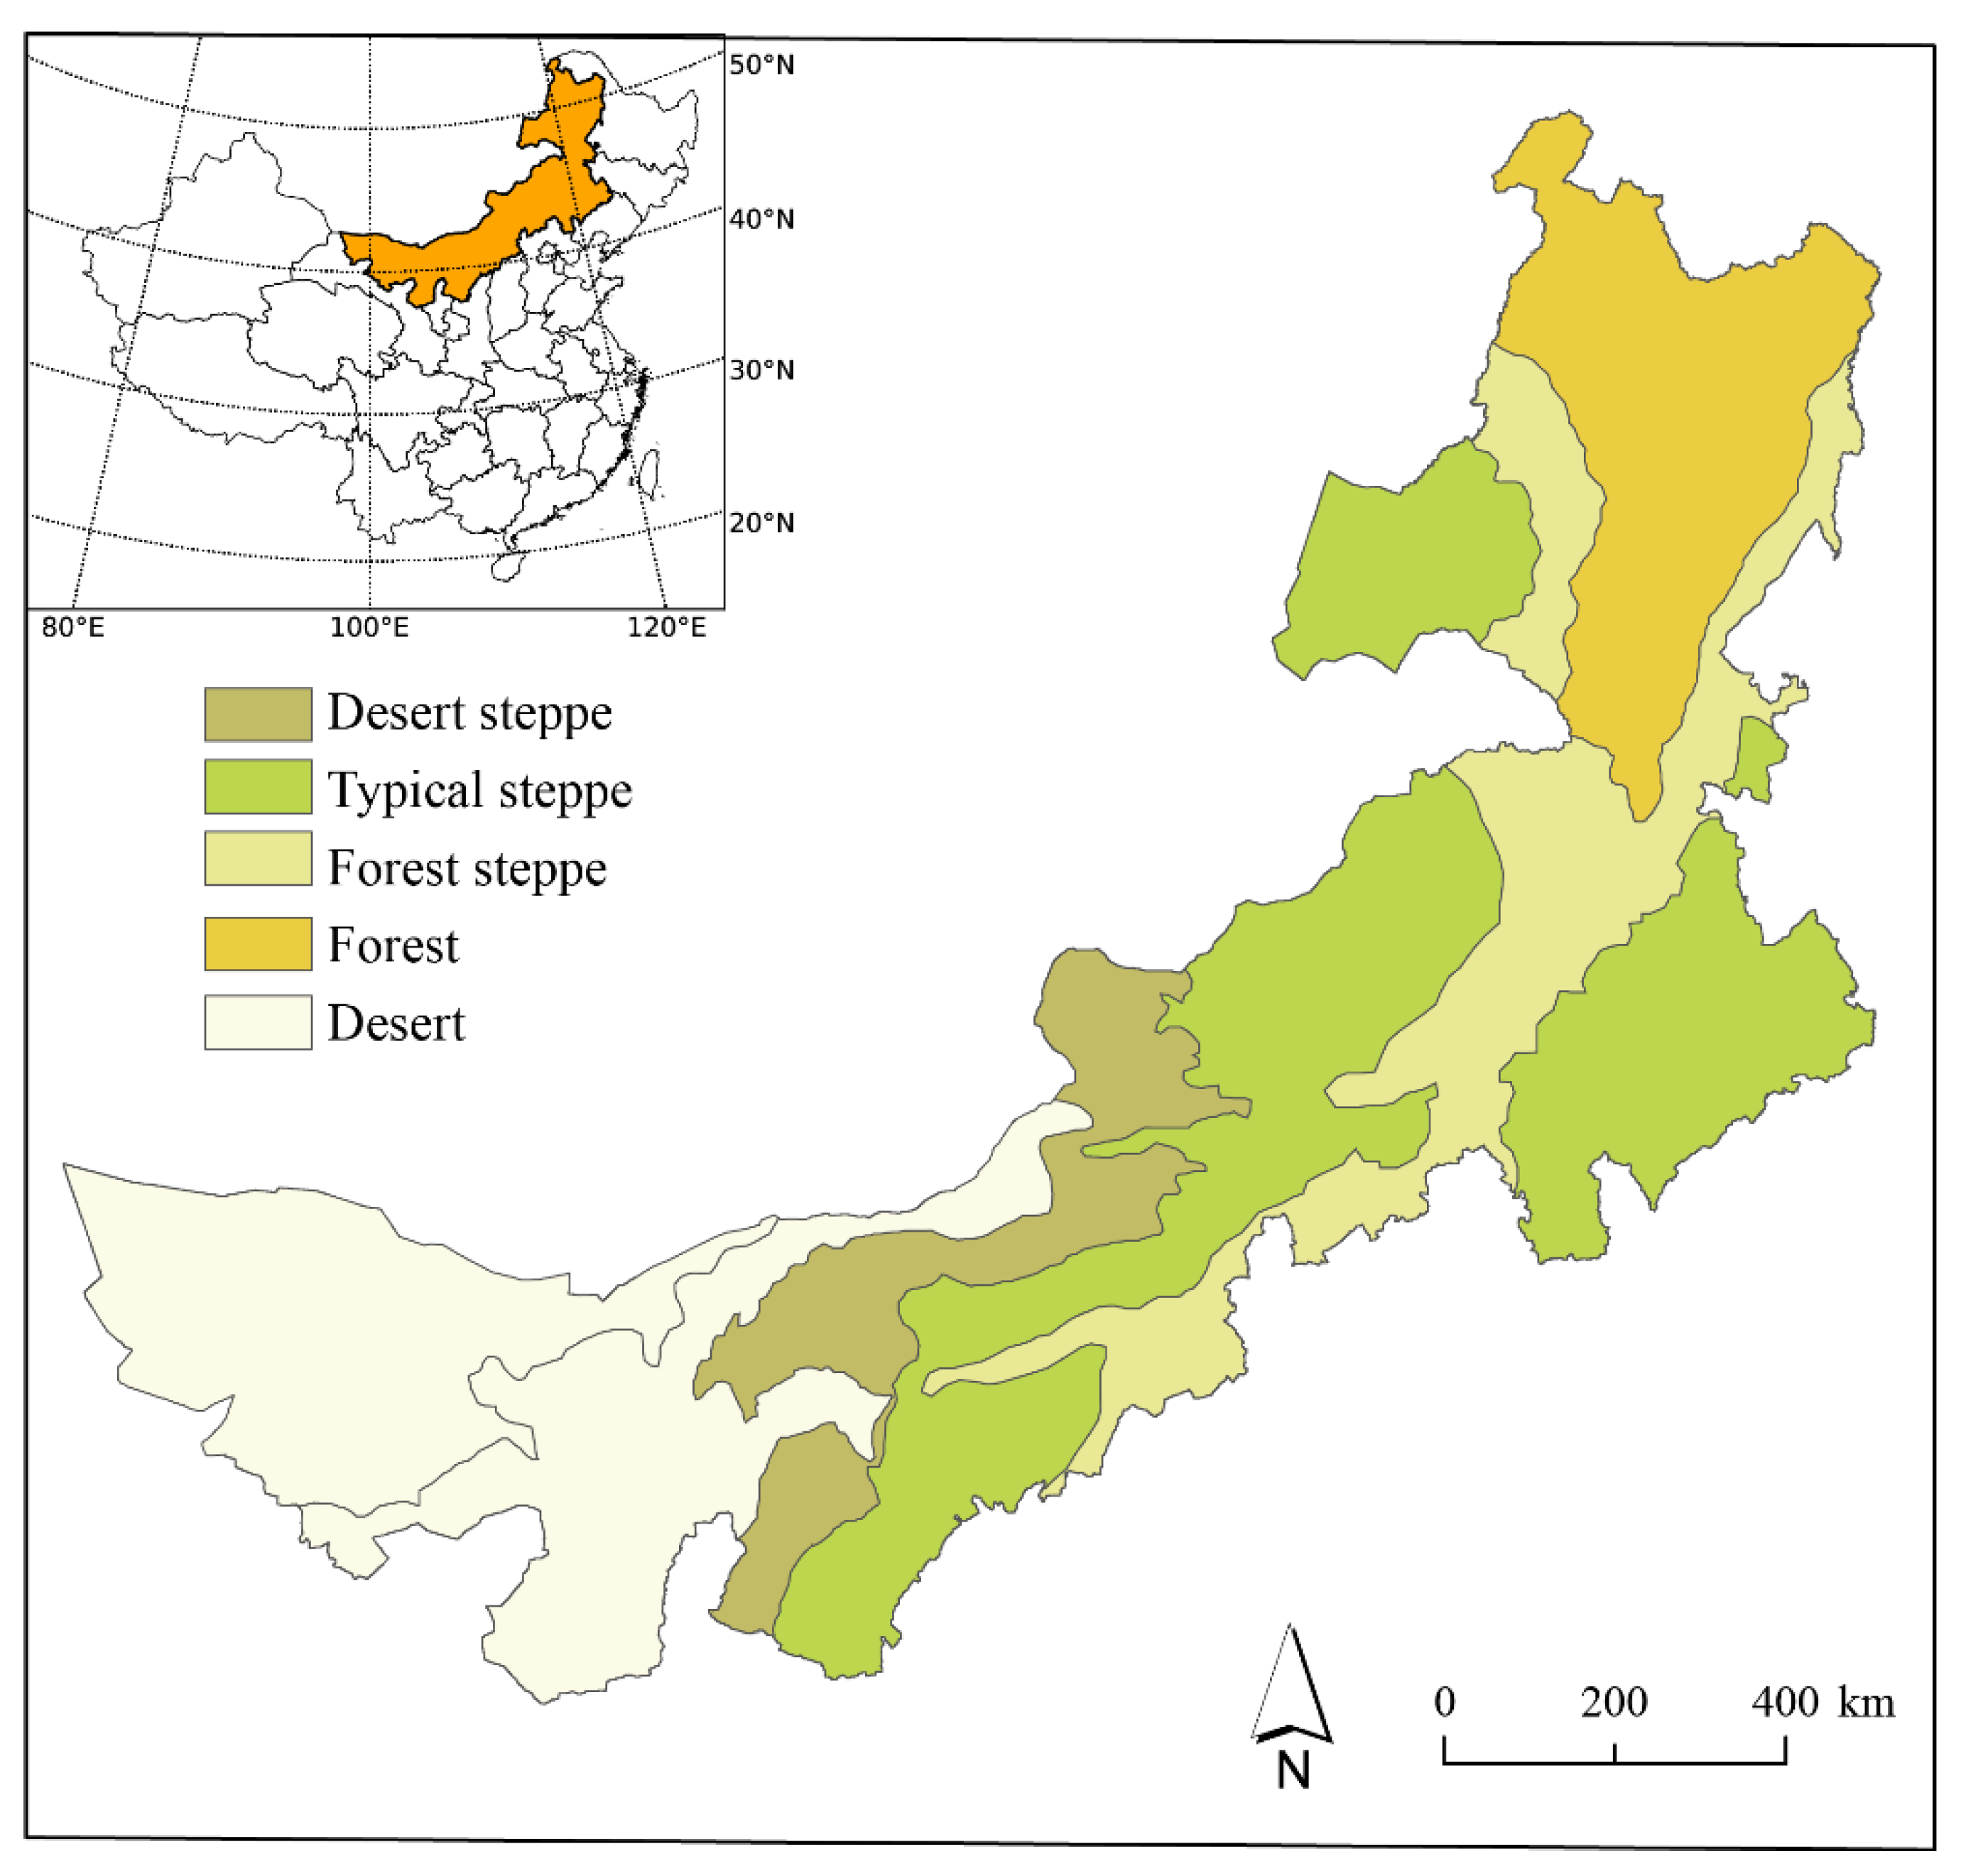
Figure 1. Location and land use types of IMP.
Forests 14 00744 g001
Figure 2. Historical trends of the DTR and NDVI in spring, summer, and autumn under different land types from 1982 to 2014.
Forests 14 00744 g002
Figure 3. Copula joint probability distributions of DTR and NDVI in spring under different land types. (a) Desert steppe; (b) typical steppe; (c) forest; (d) forest-steppe.
Forests 14 00744 g003
Figure 4. Copula joint probability distributions of DTR and NDVI in summer for different land types. (a) Desert steppe; (b) typical steppe; (c) forest; (d) forest-steppe.
Forests 14 00744 g004
Figure 5. Copula joint probability distributions of DTR and NDVI in autumn under different land types. (a) Desert steppe; (b) typical steppe; (c) forest; (d) forest steppe.
Forests 14 00744 g005
Table 1. Copula families and their closed-form mathematical description.
Copula Function NameMathematical Description
Gaussian ϕ 1 ( u ) ϕ 1 ( v ) 1 2 π 1 θ 2 e x p 2 θ x y x 2 y 2 2 1 θ 2 d x d y
T t θ 2 1 u t θ 2 1 v Γ θ 2 + 2 / 2 Γ θ 2 / 2 π θ 2 1 θ 1 2 1 + x 2 2 θ 1 x y + y 2 θ 2 θ 2 + 2 / 2 d x d y
Clayton m a x u θ + v θ 1,0 1 / θ
Frank 1 θ l n 1 + ( e x p ( θ u ) 1 ) ( e x p ( θ v ) 1 ) e x p ( θ ) 1
Gumbel e x p ( l n ( u ) ) θ + ( l n ( v ) ) θ 1 / θ
Table 2. Dependency between seasonal DTR and NDVI in the forest, forest-steppe, typical steppe, and desert steppe.
Land TypeSeasonKendallSpearman
Desert steppeSpring0.05090.0924
ForestSpring0.15260.2284
Forest steppeSpring0.28420.4364
Typical steppeSpring0.36080.5137
Desert steppeSummer0.39550.5595
ForestSummer0.06660.1078
Forest steppeSummer0.26840.4049
Typical steppeSummer0.34320.4736
Desert steppeAutumn0.22440.3608
ForestAutumn0.42820.6073
Forest steppeAutumn0.49660.6946
Typical steppeAutumn0.45230.6565
Disclaimer/Publisher’s Note: The statements, opinions and data contained in all publications are solely those of the individual author(s) and contributor(s) and not of MDPI and/or the editor(s). MDPI and/or the editor(s) disclaim responsibility for any injury to people or property resulting from any ideas, methods, instructions or products referred to in the content.