Article

Forecasting Appropriate Habitats for Rare and Endangered Indocalamus Species in China in Response to Climate Change

1
College of Landscape Architecture and Art, Fujian Agriculture and Forestry University, Fuzhou 350002, China
2
College of Architecture and Civil Engineering, Fujian College of Water Conservancy and Electric Power, Sanming 365000, China
3
College of Forestry, Fujian Agriculture and Forestry University, Fuzhou 350002, China
*
Author to whom correspondence should be addressed.
Forests 2024, 15(10), 1693; https://doi.org/10.3390/f15101693
Submission received: 30 July 2024 / Revised: 19 September 2024 / Accepted: 24 September 2024 / Published: 25 September 2024
(This article belongs to the Section Forest Biodiversity)

Abstract

:
China’s rare and endangered bamboo species belonging to the Indocalamus genus, specifically Indocalamus decorus Q. H. Dai, Indocalamus hirsutissimus Z. P. Wang & P. X. Zhang, and Indocalamus pedalis (Keng) P. C. Keng, possess notable value in biodiversity conservation and have significant potential for use in landscape design. Using an enhanced MaxEnt model, this study forecasted shifts in the species’ potential range under four separate climate scenarios (SSP1-RCP2.6, SSP2-RCP4.5, SSP3-RCP7.0, and SSP5-RCP8.5), considering both the historical period (1970–2000, referred to as “the current period”) and upcoming timeframes (2021–2040, 2041–2060, 2061–2080, and 2081–2100). The analysis disclosed that the present total potential habitat area for these species is approximately 251.79 × 10⁴ km2, with high, medium, and low suitability areas occupying 0.15 × 10⁴ km2, 125.39 × 10⁴ km2, and 126.26 × 10⁴ km2, respectively. The minimum temperature of the coldest month emerged as the critical determinant of their potential habitat distribution. Expected climate changes are likely to increase the suitable habitat for these species, although areas with low suitability might slightly diminish, with Guizhou and Chongqing showing the least impact. The distribution centers of suitable habitats for the three plant species consistently exhibit a westward shift under various climate scenarios. These results contribute valuable insights for the spatial distribution, continuous monitoring, sustainable management, and ex situ conservation in response to climate change.

1. Introduction

Throughout the 21st century, the influence of climate change has become a crucial factor reshaping species’ spatial distributions [1,2]. The Sixth Assessment Report from the Intergovernmental Panel on Climate Change (IPCC) forecasts a global average temperature increase of 1.4–4.4 °C by the century’s end [3,4]. As global environmental challenges escalate, climate change has evolved into an urgent matter that demands immediate focus. This phenomenon has precipitated a range of environmental problems, including more frequent extreme weather events, ecosystem degradation, and the abovementioned rise in global temperatures. These changes exert profound effects on both human societies and natural ecosystems, creating significant challenges for biodiversity conservation [5,6]. Rare and endangered plant species are particularly susceptible to the consequences of global warming and severe climatic conditions. Shifts in local hydrothermal conditions may further elevate the risk of species extinction [7]. Consequently, examining how climate change affects species distribution is essential for ensuring long-term conservation and sustainable management [8]. Gaining a better understanding of the relationship between climate change and the geographic range of rare and endangered species is pivotal for strengthening biodiversity conservation efforts and maintaining ecological balance [9,10].
Bamboo species represent a critical element of terrestrial forest ecosystems, characterized by their extensive distribution, rapid growth, high yield, strong regenerative abilities, and a wide range of applications and economic importance. These attributes contribute to their substantial economic, ecological, and social benefits [11,12,13]. China holds the world’s richest bamboo resources, leading globally in terms of species diversity, distribution area, and biomass. As documented in the Flora of China [14], the country hosts 34 genera and 534 bamboo species. Members of the Indocalamus genus are generally shrubs or small shrub-like plants with broad leaves, recognized for their medicinal, edible, and significant ornamental value. Notably, I. decorus, I. hirsutissimus, and I. pedalis are classified as rare and endangered species, appearing in the Catalogue of China’s Rare and Endangered Plants [15].
Bamboo species exhibit extreme sensitivity to climate change throughout their growth stages [12,16,17]. The native habitats of the three rare and endangered Indocalamus species have already experienced the effects of climate change, increasing the risk of resource scarcity. Consequently, studying how climate change affects their geographic distribution is critically important. Such research provides a critical scientific foundation for habitat conservation and supports more effective strategies for the protection and introduction of these species. Developing habitat suitability maps for the rare and endangered Indocalamus species and forecasting the consequences of climate change is crucial for protecting their habitats and securing their long-term viability [18].
The advancement of computational statistics and Geographic Information Systems (GIS) has facilitated the exploration of the relationships between environmental factors such as topography and bioclimatic variables and species distributions, establishing this as a central focus in ecological research [19,20,21]. In recent decades, studies examining the effects of climate change on species distribution have greatly accelerated the extensive use of Species Distribution Models (SDMs) [22]. SDMs utilize a range of algorithms across different temporal and spatial scales to infer the relationships between species presence and environmental conditions, enabling predictions of potential distributions [23]. By combining species occurrence data with environmental predictors, these models replicate species’ ecological niches and utilize statistical or theoretical approaches to create potential distribution maps, providing insights into spatial and temporal dynamics [24]. SDMs have played a key role in forecasting the influence of climate change on species distributions and have been widely employed in fields such as ecology, biogeography, evolutionary biology, and conservation [25]. Advances in technology have introduced a growing array of statistical methods and software tools for model construction and prediction [26,27]. Among the numerous species distribution models, the Maximum Entropy Model (MaxEnt) remains one of the most commonly used due to its strong predictive capabilities [28,29].
The MaxEnt model offers considerable advantages in addressing challenges posed by sparse and unevenly distributed data [30], and it has shown superior accuracy and robustness in ecological data analysis [31]. Consequently, recent research utilizing the MaxEnt model for predicting bamboo species distributions has achieved notable advancements. For example, investigations into Dendrocalamus sinicus [32], Thamnocalamus spathiflorus [33], and Dendrocalamus latiflorus [34] have validated the reliability and suitability of MaxEnt in the ecological study of bamboo species. Nevertheless, existing research primarily targets the distribution prediction of common bamboo species, with relatively limited focus on rare and endangered bamboo species, particularly those within the Indocalamus genus. Thus, this study aims to fill this gap by forecasting the distributional patterns of three threatened Indocalamus species across different climate scenarios using the MaxEnt model. The findings of this study will improve our understanding of the ecological traits and distributional trends of these species, thus offering a scientific basis for their conservation and long-term management.
This study aims to utilize the species distribution model (MaxEnt) to evaluate the present and potential spatial distribution patterns of three threatened Indocalamus species under climate change conditions. Utilizing an optimized MaxEnt model, this research forecasts the potential distribution areas of these species across the current period and four projected future periods (2021–2040, 2041–2060, 2061–2080, and 2081–2100) under various climate scenarios (SSP1-RCP2.6, SSP2-RCP4.5, SSP3-RCP7.0, and SSP5-RCP8.5). The outcomes of this study will provide a scientific foundation for the management, conservation, introduction, and sustainable use of the rare and endangered Indocalamus species in China.

2. Research Methods

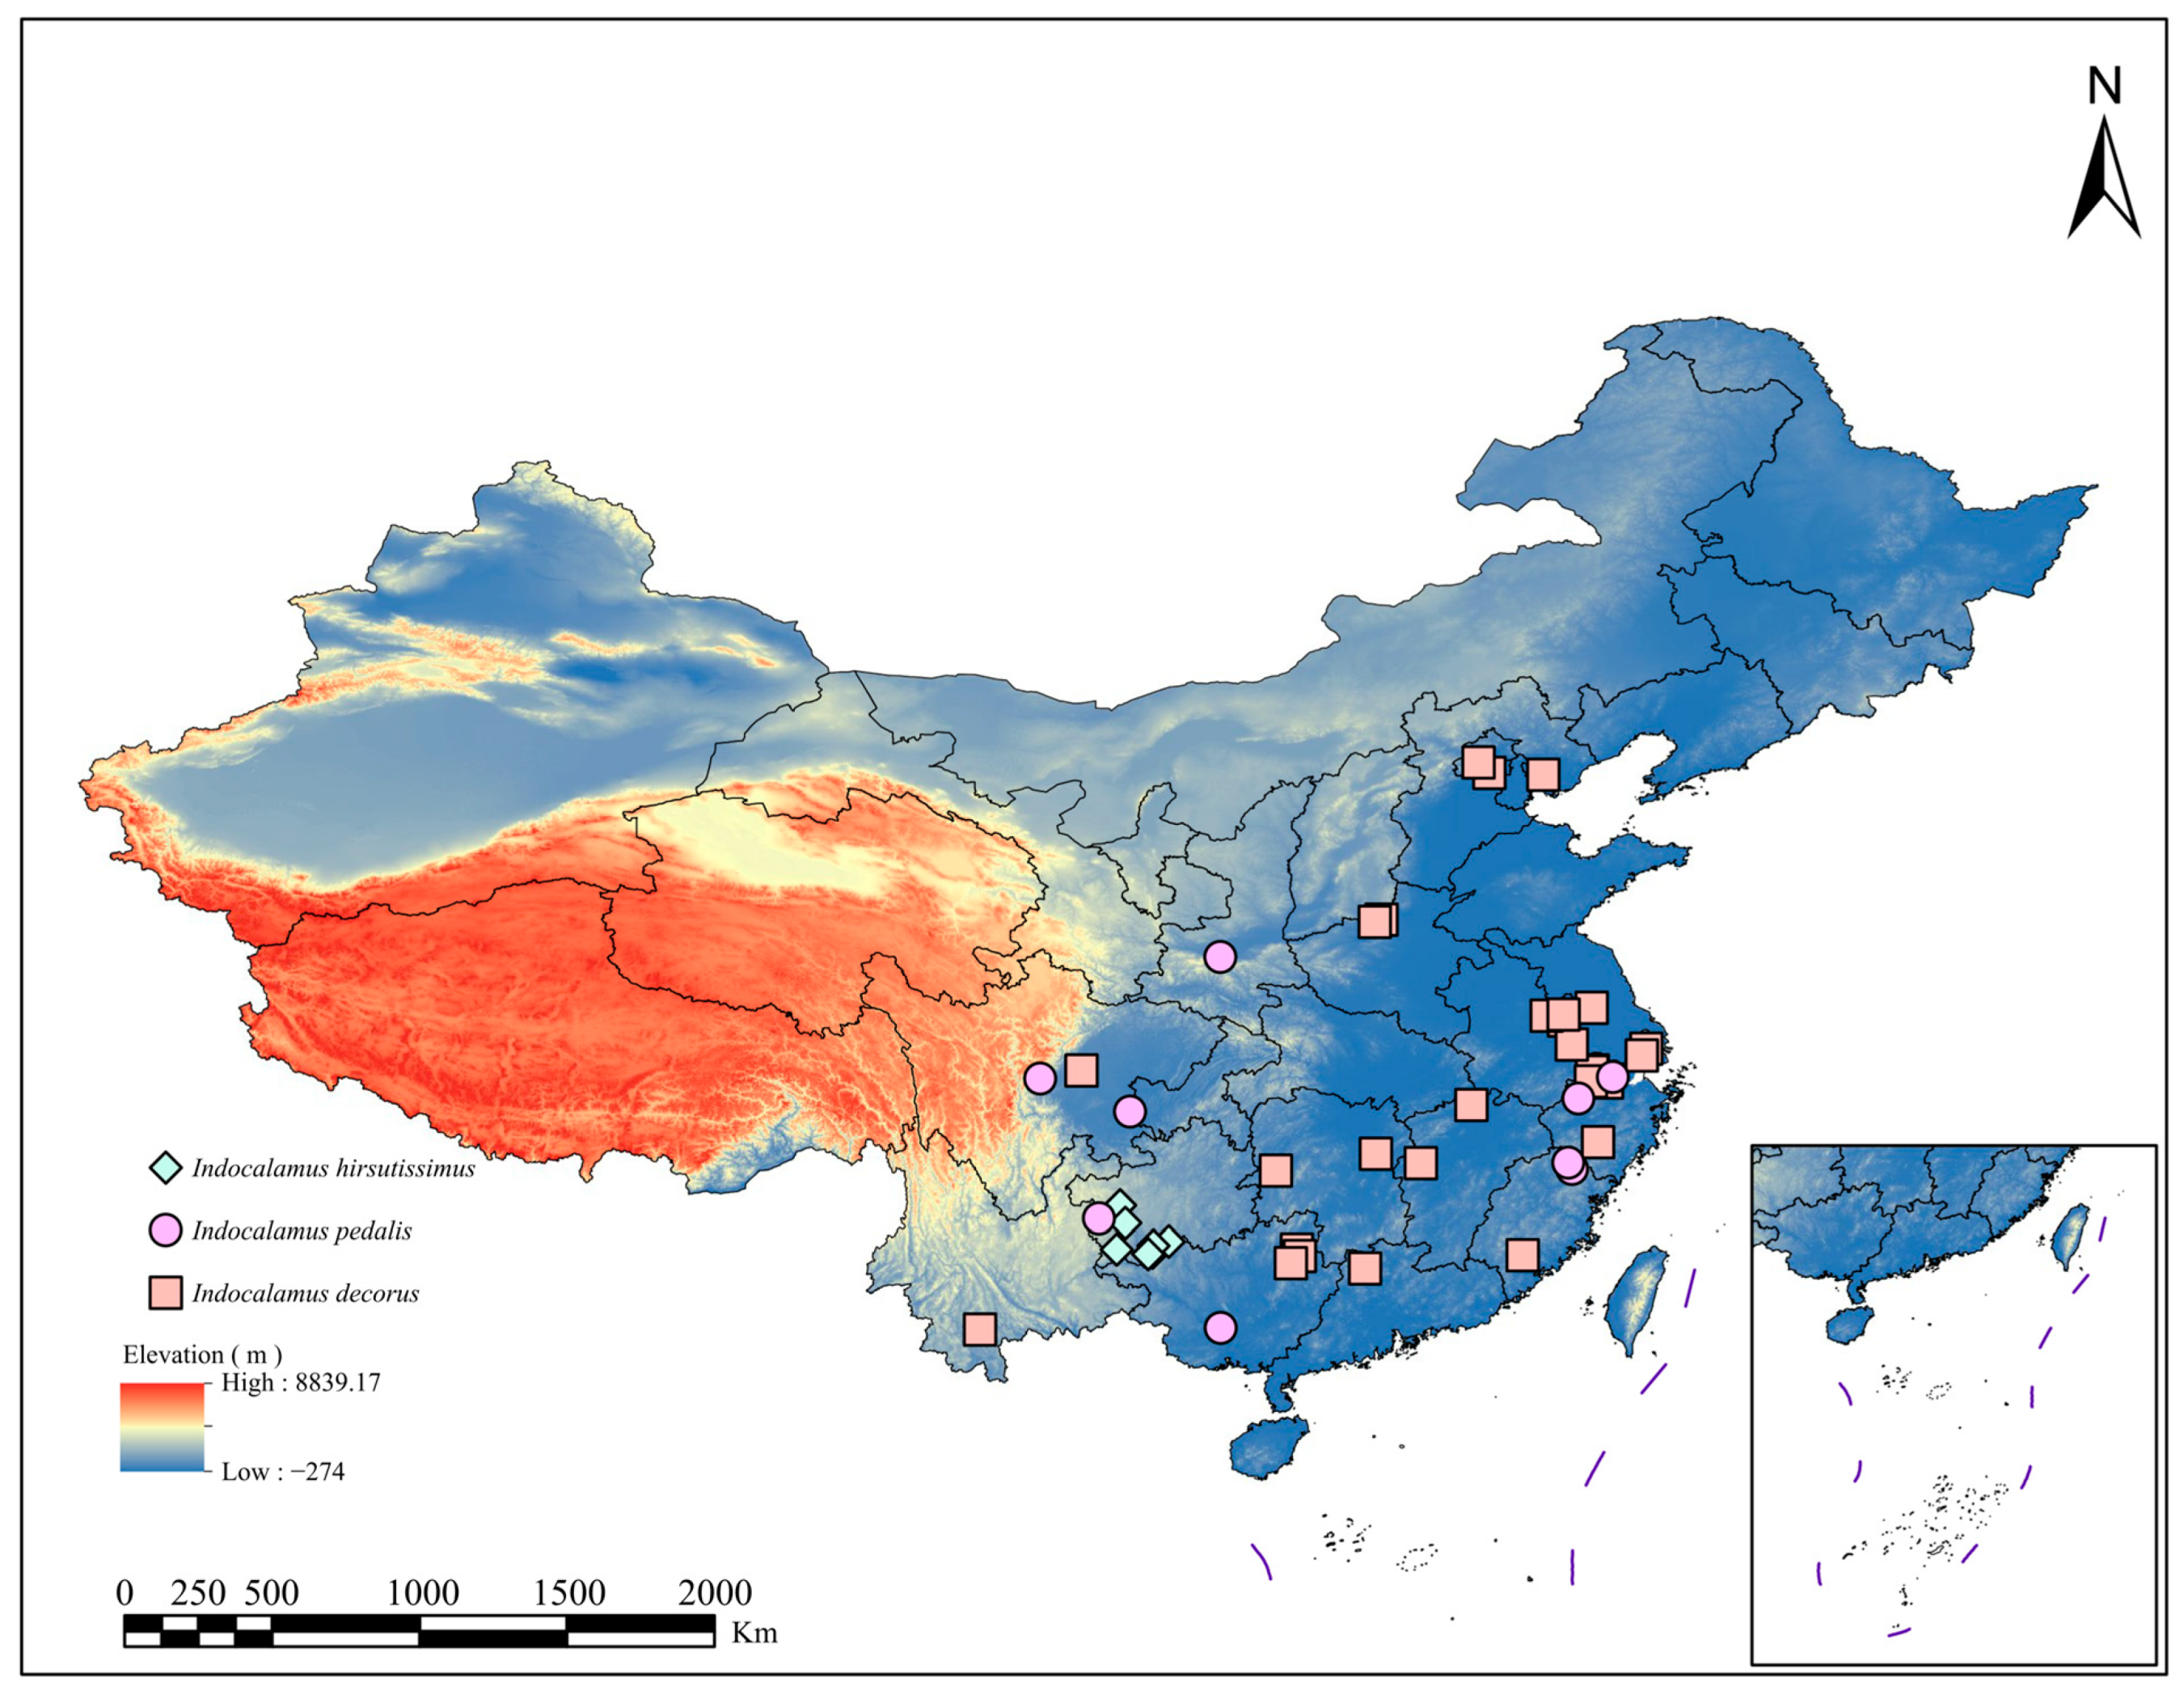
2.1. Gathering and Filtering of Sample Data

I. decorus is predominantly found in the southwestern regions of China, where it thrives in warm and humid environments. I. hirsutissimus typically occurs in forests at elevations around 600 m, with an ideal annual mean temperature between 16 and 22 degrees Celsius. I. pedalis, one of the most elusive species within the Indocalamus genus, inhabits rocky crevices along mountain slopes. This species is highly sensitive to environmental factors, particularly dependent on moist soil and forested habitats [14].
As a result of habitat fragmentation and human disturbances, all three of these bamboo species are under significant survival threats. Based on the China Biodiversity Red List (Higher Plants Volume) (https://www.mee.gov.cn/ (accessed on 15 June 2023)), the List of Threatened Species of Higher Plants in China (https://www.gov.cn/ (accessed on 17 June 2023)), the List of National Key Protected Wild Plants (https://www.gov.cn/ (accessed on 20 June 2023)), and the Illustrated Handbook of Rare and Endangered Plants of China [15], I. decorus and I. hirsutissimus are categorized as Vulnerable (VU), whereas I. pedalis is classified as Endangered (EN).
We gathered distribution records for the three endangered Indocalamus species from several sources, including the National Specimen Information Infrastructure (http://www.nsii.org.cn/ (accessed on 1 August 2023)), the Chinese Virtual Herbarium (https://www.cvh.ac.cn (accessed on 5 August 2023)), the Chinese Plant Photo Bank (https://ppbc.iplant.cn/ (accessed on 7 August 2023)), the Global Biodiversity Information Facility (GBIF https://www.gbif.org (accessed on 8 August 2023)), and the Flora of China (http://www.efloras.org (accessed on 20 August 2023)). After a thorough screening process to eliminate records lacking specific distribution details and duplicates, we retained only those entries with precise latitude and longitude coordinates or comprehensive distribution information. In the end, we compiled 44 distribution records for the three rare and endangered Indocalamus species (Figure 1).

2.2. Screening of Bioclimatic Variables

Bioclimatic variables play a crucial role in species distribution models (SDMs) and are frequently employed to develop plant niche models [35]. In our research, we relied on 19 climatic variable datasets from WorldClim (http://www.worldclim.org/) (retrieved on 26 August 2023), covering climate records for the present time frame (1970–2000) as well as four projected periods (2021–2040, 2041–2060, 2061–2080, and 2081–2100). To analyze the impact of various climate projections on SDM outcomes [36], we adopted emission pathways aligned with four distinct Shared Socioeconomic Pathways (SSPs): SSP1-RCP2.6, SSP2-RCP4.5, SSP3-RCP7.0, and SSP5-RCP8.5. We employed the BCC-CSM2-MR general circulation model, which has demonstrated accurate simulations of temperature and precipitation in China [37]. Overall, our analysis involved one dataset of present-day climate and 16 future climate scenario datasets, yielding a total of 17 datasets.
By integrating 19 bioclimatic variables and species occurrence records, we constructed a MaxEnt model and applied the Jackknife technique to evaluate the relevance of each variable within the model [38]. Additionally, ENMTools (version 1.0.4) was employed to compute the Pearson correlation coefficients (R) for pairwise comparisons among the 19 bioclimatic variables, where an absolute value of |R| ≥ 0.8 was regarded as significant. [39]. For pairs of bioclimatic variables with significant correlation, only the variable contributing more to the model was retained [22,36].

2.3. Model Development, Optimization, and Evaluation

In constructing the MaxEnt model with MaxEnt (version 3.4.4), we randomly selected 70% of the data for training the model, reserving the remaining 30% for testing to ensure that the species distribution probabilities approximate a normal distribution [40] The primary parameters were configured as follows: The maximum number of iterations was set to 5000; cross-validation was chosen as the replicate run type; and the model was repeated 10 times.
To optimize the Feature Class (FC) and Regularization Multiplier (RM) of the MaxEnt model, we employed the R package kuenm (https://github.com/marlonecobos/kuenm, accessed on 13 October 2023). Initially, the RM range was defined from 0.1 to 4.0, with increments of 0.1, generating 40 distinct RM values. Subsequently, the five FCs in the MaxEnt model (linear (l), quadratic (q), hinge (h), product (p), and threshold (t)) were freely combined, yielding 31 possible FC combinations (e.g., l, q, p, t, h, lq, lp, lt, lh, qp, qt, qh, pt, ph, th, lqp, lqt, lqh, lpt, lph, lth, qpt, qph, qth, pth, lqpt, lqph, lqth, lpth, qpth, and lqpth). This process resulted in a total of 1240 FC and RM parameter combinations. For model selection, we identified the optimal model as one with an omission rate (OR) below the threshold (0.05) and a ∆AICc less than 2 [41,42].
Following model construction, the predictive accuracy was assessed using the Area Under the Receiver Operating Characteristic Curve (AUC) [43]. The mean AUC value ranges from 0 to 1, with an AUC > 0.85 suggesting that the model is reliable and the predictions are accurate. Moreover, a smaller difference between the AUC values of the training and test datasets indicates greater model reliability [44].

2.4. Delineation of Suitable Areas and Analysis of Low-Impact Regions

Species habitat suitability is generally represented by values between 0 to 1, with higher values indicating areas more favorable for species growth. The selection of a threshold plays a crucial role in predicting suitability levels and, consequently, in calculating the area of suitable habitats [45,46]. Among various thresholds, the Maximum Test Sensitivity Plus Specificity (MTSPS) is regarded as more effective for classifying suitability levels [35]. Accordingly, we adopted MTSPS as the threshold, identifying regions with suitability values below MTSPS as unsuitable for species growth. The range of suitability from MTSPS to 1 was split into three equal categories, indicating low-, medium-, and high-suitability zones [47]. The area of each suitability region and its changes across multiple future scenarios were assessed using ArcGIS (version 10.7).
Low-impact areas (LIAs) are regions where species are less affected by climate change, and these can be forecasted by overlaying binary suitability maps from several future time periods and identifying the intersecting regions [48,49]. Initially, spatial regions with suitability values above the MTSPS threshold are classified as suitable areas, while those below the threshold are deemed unsuitable, creating binary suitability maps [49]. Subsequently, in ArcGIS (version 10.7), the potential suitability maps for different periods are overlaid, and the regions of complete overlap across various maps are identified to delineate the species’ low-impact areas. Finally, these low-impact areas are examined under the current and four future Shared Socioeconomic Pathways (SSPs) (SSP1-RCP2.6, SSP2-RCP4.5, SSP3-RCP7.0, and SSP5-RCP8.5).

2.5. Analysis of Spatial Pattern Changes and Core Distribution Shifts

Spatial pattern changes are defined as shifts in species’ potential suitable habitats over time, which are detected by overlaying binary suitability maps from different temporal datasets [2]. By comparing the spatial changes under present conditions and four projected future Shared Socioeconomic Pathways (SSPs) over various periods, we identified 16 distinct change patterns. Using ArcGIS (version 10.7), we overlaid the potential suitable area distribution maps from these periods to construct matrices of suitability and unsuitability for the species, and based on these matrices, we conducted further analysis on the spatial variations in suitable habitat distributions across present and future climate scenarios.
We utilized the SDM tool box v2.5 in ArcGIS (version 10.7) to calculate trends in changes to species’ suitable areas and to compare the centroids of various regions. The suitable areas were transformed into polygons, and shifts in the centroids were analyzed to reflect both the direction and extent of changes in these areas. This research explored potential centroid shifts across multiple periods and climate conditions. The migration distances of suitable regions were calculated using latitude and longitude data [50,51].

3. Results

3.1. Evaluation of Model Accuracy and Contributions of Environmental Variables

Following an initial assessment of 19 bioclimatic factors, eight were identified for use in model development, refinement, and assessment: mean diurnal range (BIO2), isothermality (BIO3), minimum temperature of the coldest month (BIO6), mean temperature of wettest quarter (BIO8), mean temperature of warmest quarter (BIO10), annual precipitation (BIO12), precipitation of driest month (BIO14), and precipitation of the warmest quarter (BIO18). The model optimization results showed that the optimal feature class (FC) was lqt, with a regularization multiplier (RM) of 1.3. The AUC for the training set (AUCTrain) was 0.853 ± 0.053, while the AUC for the test set (AUCTest) was 0.898 ± 0.043. The absolute difference between AUCTrain and AUCTest (|AUCDiff|) was 0.045, demonstrating the model’s high predictive accuracy. After optimization, the contribution percentages of the bioclimatic variables in the final model were as follows: BIO6 (75.0%) > BIO2 (11.0%) > BIO10 (5.3%) > BIO12 (3.4%) > BIO18 (2.4%) > BIO8 (1.4%) > BIO14 (1.1%) > BIO3 (0.4%).

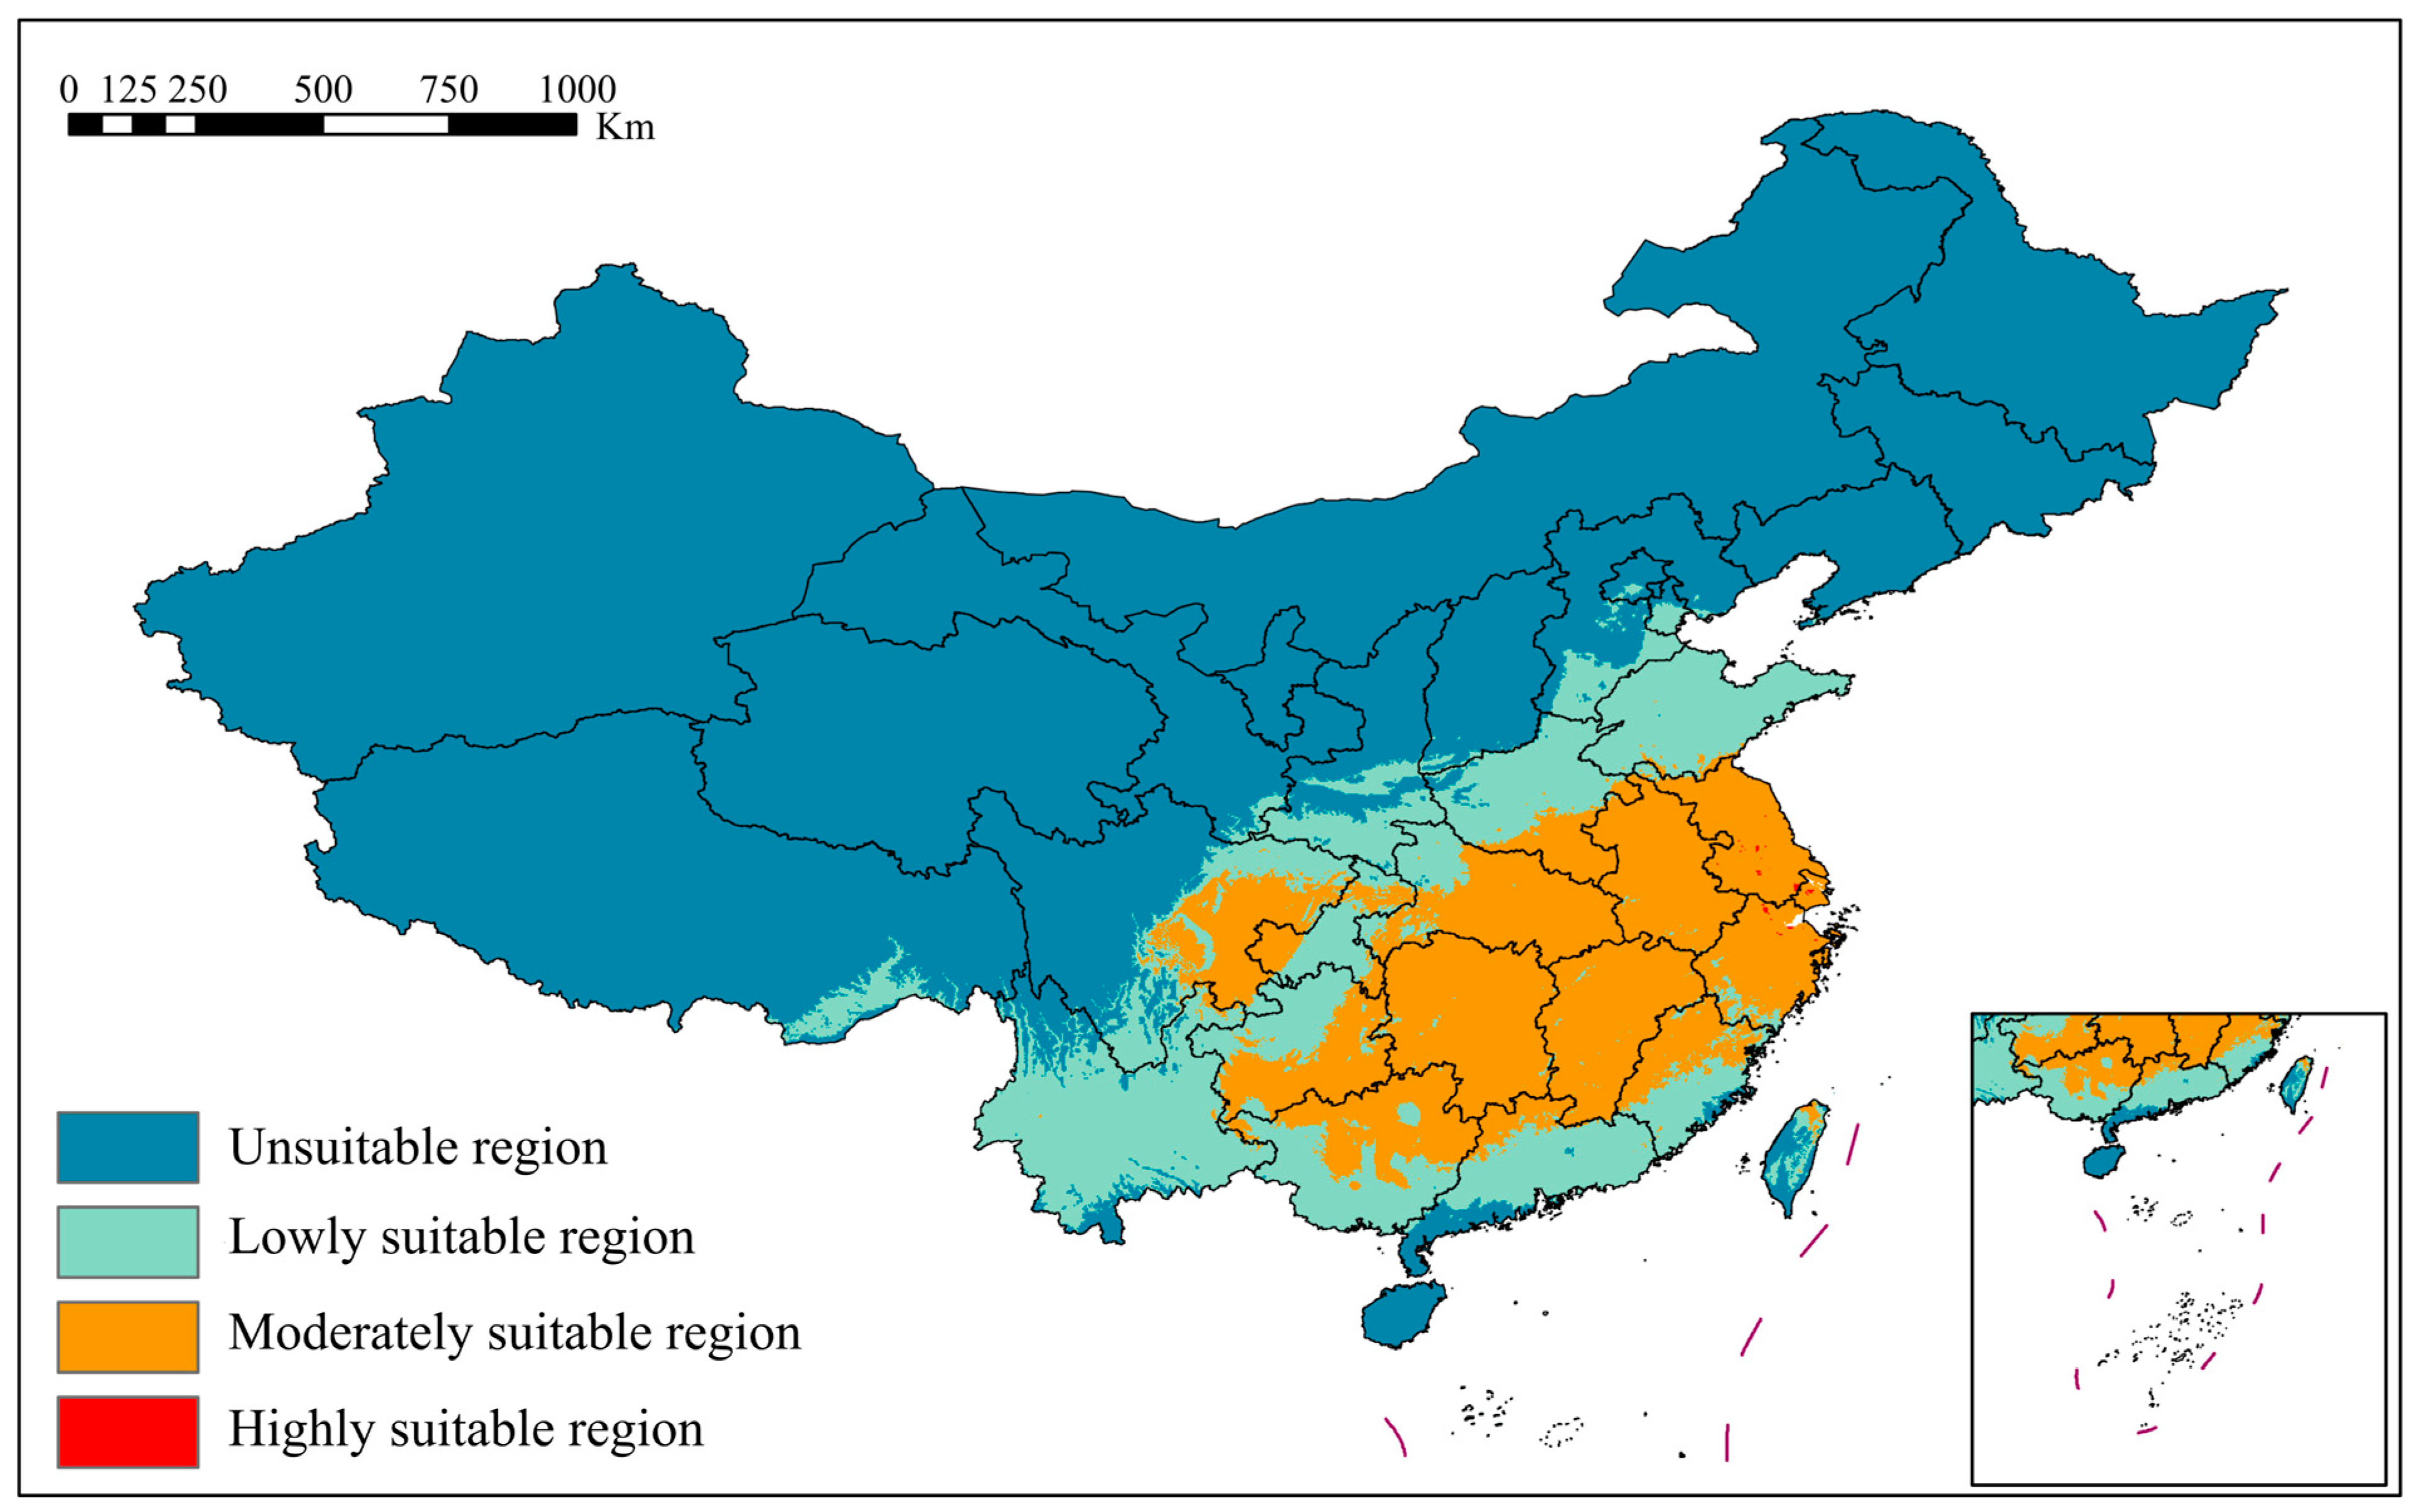
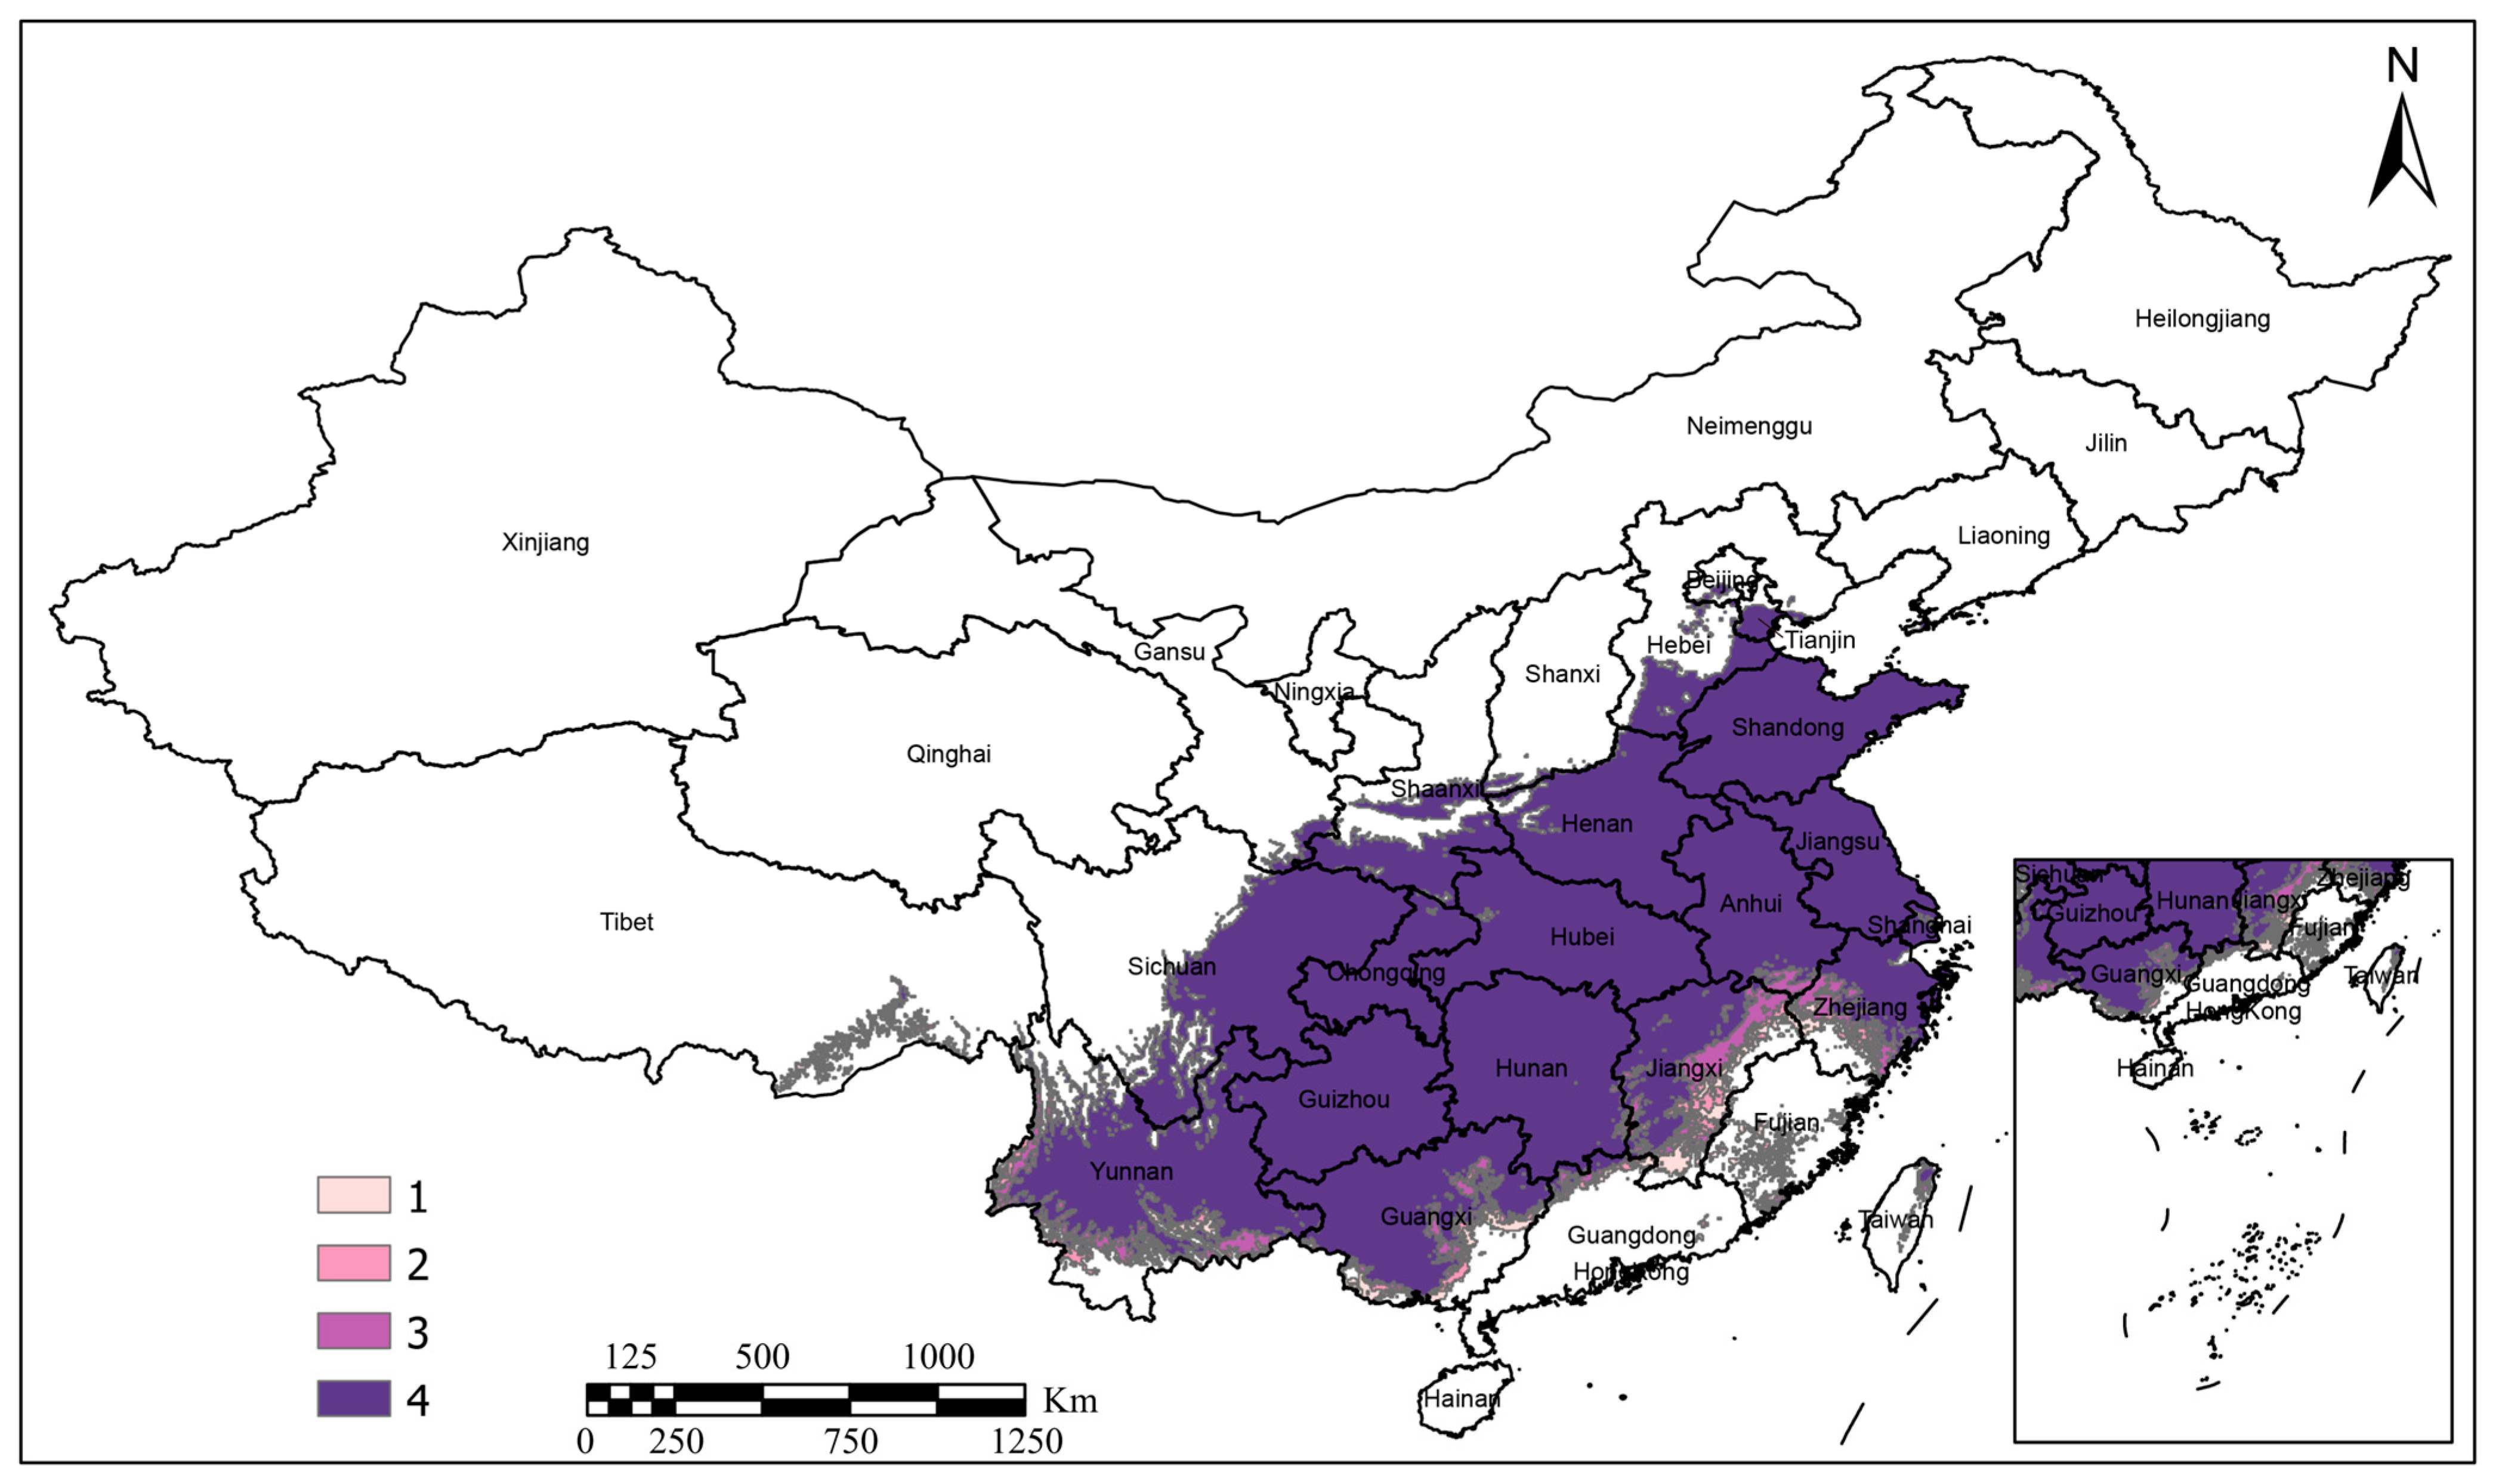
3.2. Analysis of Current Potential Suitable Distribution Areas

Using the MTSPS threshold of 0.2360, spatial units were categorized as follows: 0–0.2360 for unsuitable areas, 0.2361–0.4907 for low-suitability areas, 0.4908–0.7453 for medium-suitability areas, and 0.7454–1 for high-suitability areas (Figure 2). Medium-suitability regions are primarily located in central and southeastern China, whereas high-suitability regions are concentrated along the eastern coast. Currently, the total potential suitable area for the three rare and endangered Indocalamus species is 251.79 × 10⁴ km2, with the main distributions found in the provinces of Guizhou, Hunan, Jiangxi, Hubei, Anhui, Jiangsu, Zhejiang, and Fujian. Additionally, fragmented distributions appear in Guangxi, Guangdong, Sichuan, and Henan. The forecasted areas for high, medium, and low suitability span 0.15 × 10⁴ km2, 125.39 × 10⁴ km2, and 126.26 × 10⁴ km2, respectively. Generally, the distribution of suitable regions increases gradually from the north to the south and spreads from the west to the east.
Figure 1 illustrates the current primary distribution of three species of the genus Indocalamus, which is concentrated in southeastern and central China. A comparison between Figure 1 and Figure 2 reveals a significant discrepancy between the current distribution of Indocalamus species and their potential suitable habitats. This mismatch may be further exacerbated by future climate change.

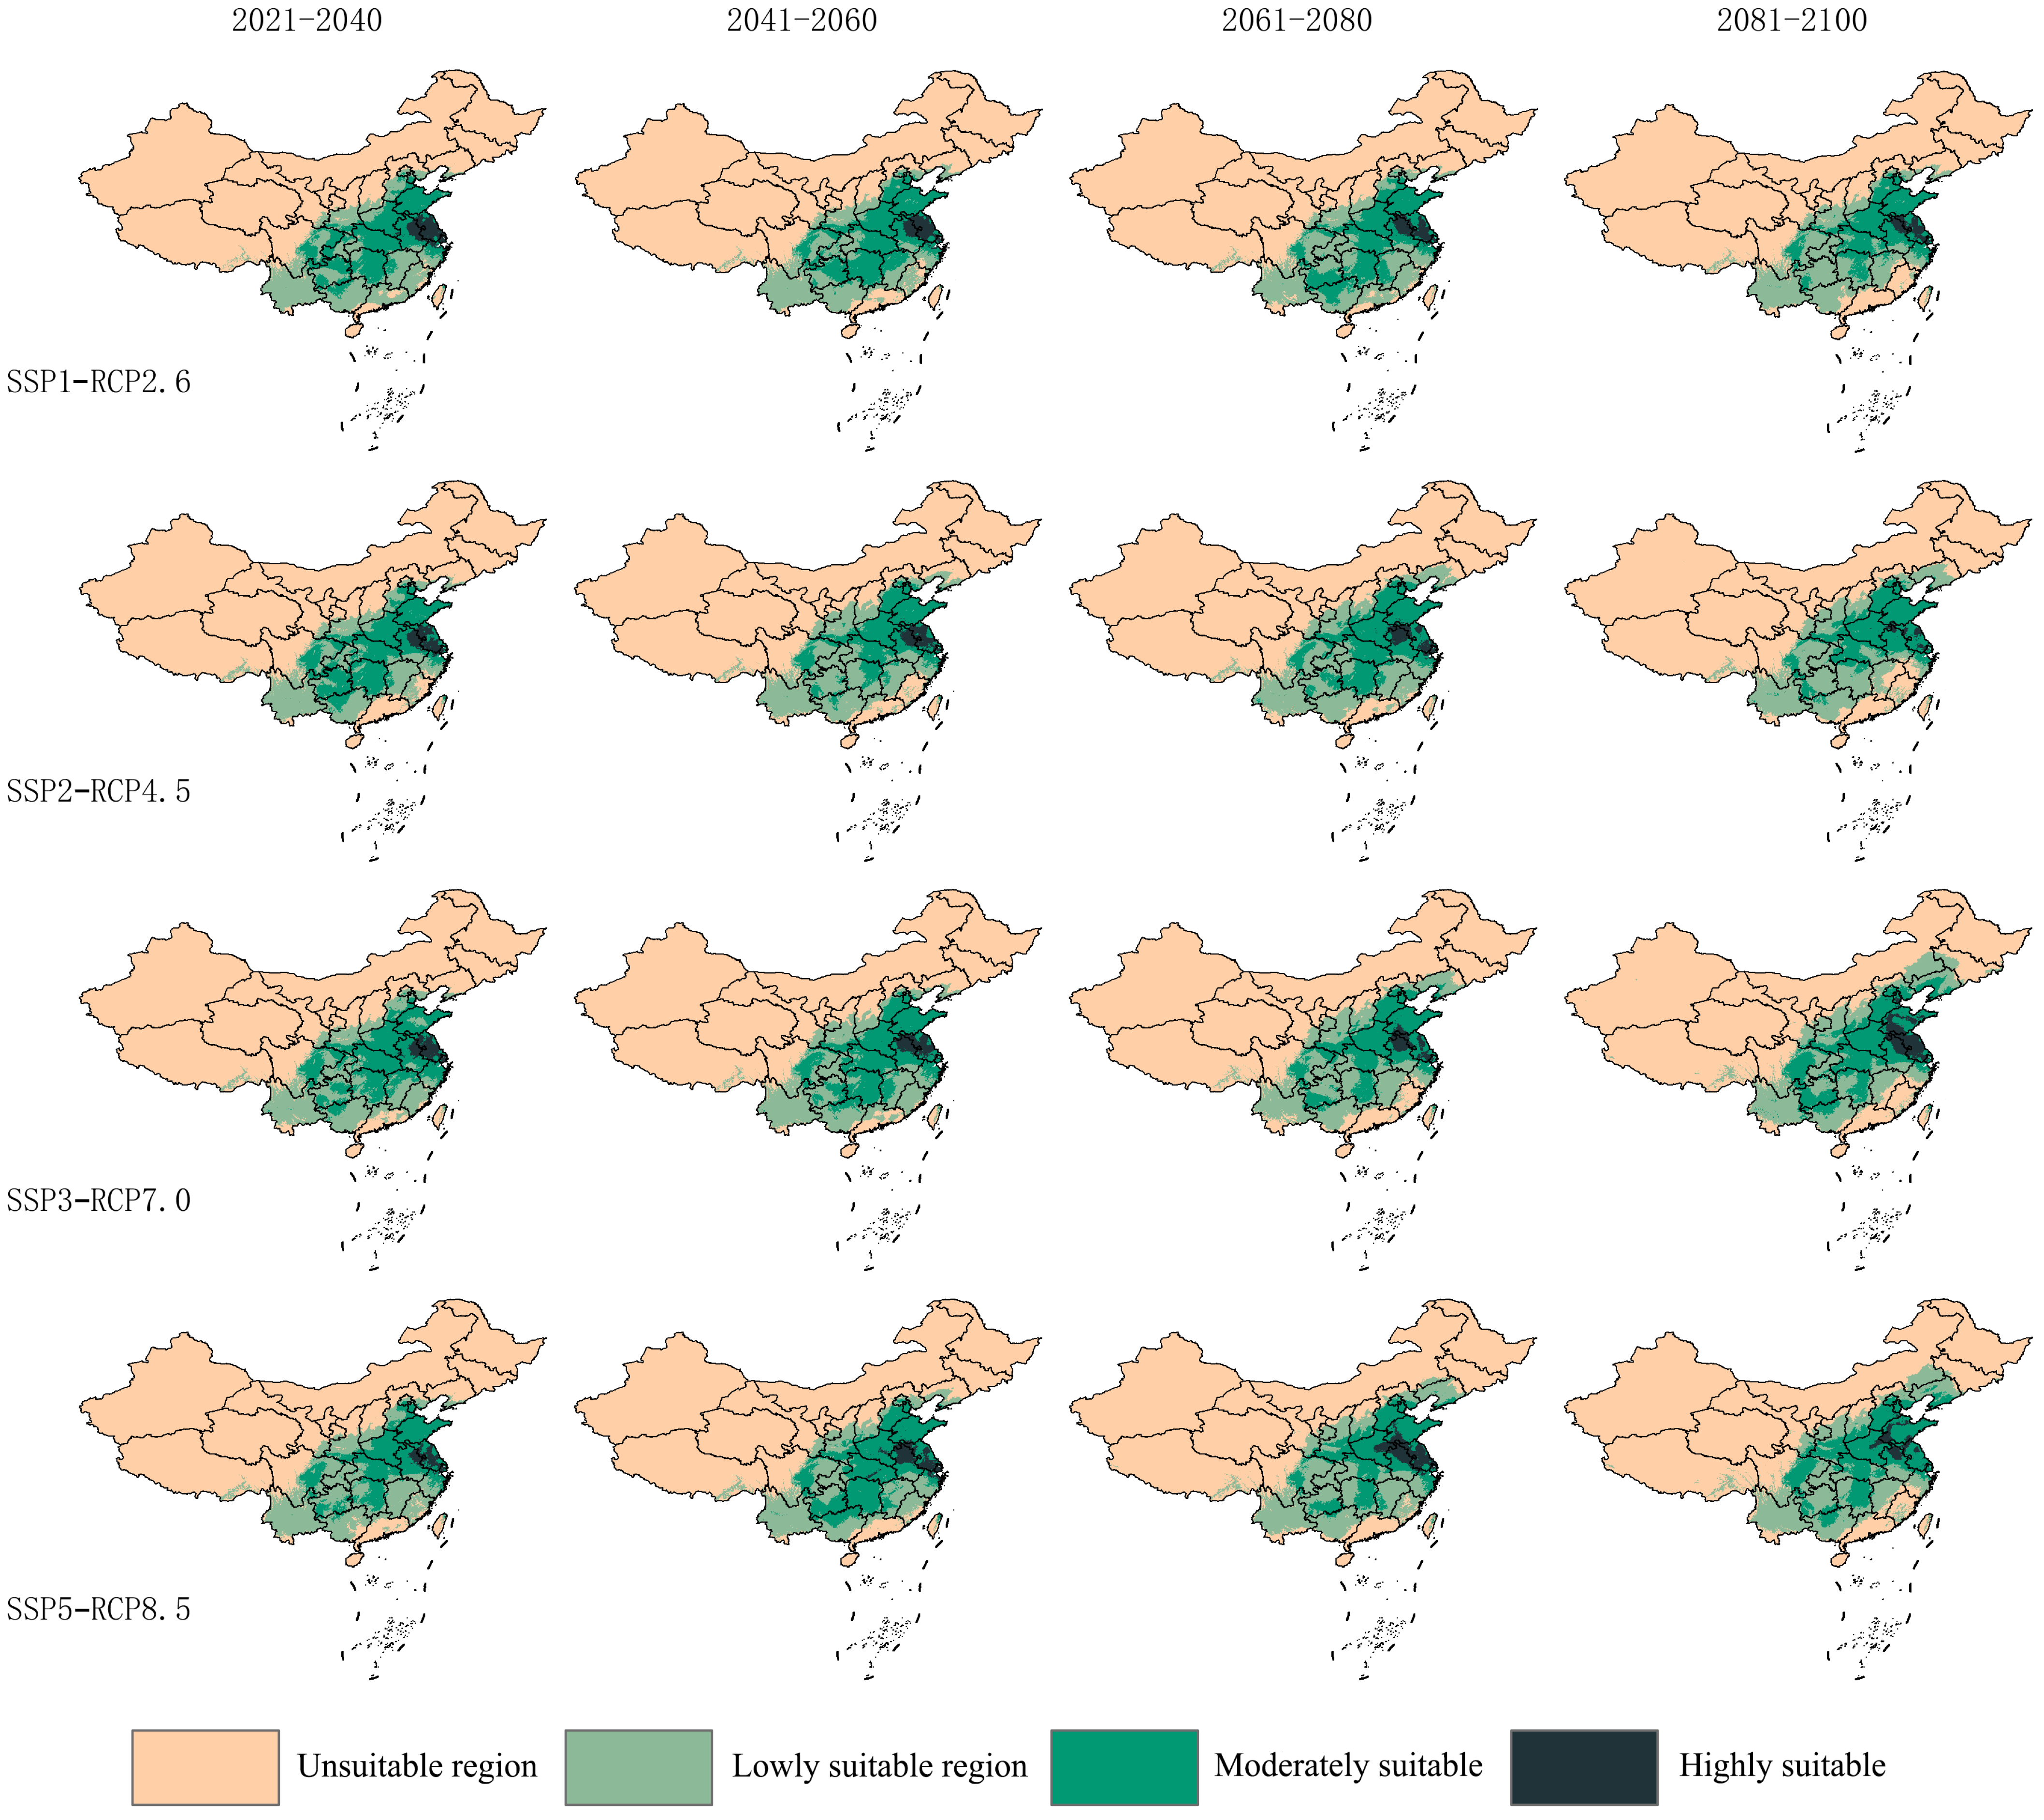
3.3. Future Potential Suitable Areas

Under varying climate scenarios, the spatial distribution and shifts in potential suitable habitats for the three rare and endangered Indocalamus species exhibit significant differences across the four future periods. Analysis of Figure 3 and Figure 4 indicates that, compared to the current conditions, both high-suitability and low-suitability areas expand markedly under different climate scenarios, whereas medium-suitability areas experience a pronounced reduction.
In the SSP1-RCP2.6 scenario, the area of high-suitability regions increases across all periods: 13.03 × 10⁴ km2 during 2021–2040, 11.45 × 10⁴ km2 during 2041–2060, 10.79 × 10⁴ km2 during 2061–2080, and 8.70 × 10⁴ km2 during 2081–2100. Overall, high-suitability regions are mainly concentrated in eastern and central China, while low-suitability regions are found in central and southwestern China.
In the SSP2-RCP4.5 scenario, the total suitable area remains relatively stable, with a notable expansion occurring between 2061 and 2080, reaching 282.02 × 10⁴ km2. High-suitability areas are projected to expand significantly and then stabilize, although a slight reduction is expected during the 2081–2100 period, with areas of 10.48 × 10⁴ km2, 10.17 × 10⁴ km2, 10.75 × 10⁴ km2, and 3.65 × 10⁴ km2 for the four periods, respectively. Compared to SSP1-RCP2.6, the growth rate of suitable areas is somewhat slower, with high-suitability regions remaining primarily concentrated in eastern and central China.
In the SSP3-RCP7.0 scenario, the total suitable area expands across all periods, with the most pronounced expansion occurring between 2081 and 2100, when the total suitable area reaches 301.30 × 10⁴ km2. The medium- and high-suitability areas display a pattern of initial expansion, subsequent contraction, and then further expansion.
In the SSP5-RCP8.5 scenario, the total suitable area gradually expands, growing from 261.94 × 10⁴ km2 in the 2021–2040 period to 296.280 × 10⁴ km2 by 2081–2100. As depicted in Figure 3 and Figure 4, high-suitability areas are extensively distributed across the eastern and central regions, with relatively few areas experiencing contraction.

3.4. Low-Impact Suitable Distribution Areas

The area of low-impact zones for three rare and endangered species of the genus Indocalamus varies under different Shared Socioeconomic Pathways (SSPs) scenarios (Table 1). In the most optimistic SSP1-RCP2.6 scenario, the low-impact zone area is the largest, covering approximately 94.36% of the current suitable habitat, indicating strong climate adaptability. This suggests that under low-emission scenarios, the habitats of these species will be less affected by the negative impacts of climate change. However, in the SSP2-RCP4.5 and SSP3-RCP7.0 scenarios, the low-impact zone area slightly decreases, dropping to around 91% of the current suitable habitat. This implies that intensifying climate change may pose a threat to the species’ survival, particularly through further reductions in the marginally suitable habitat. Although the decline in low-impact zone area across scenarios is modest (remaining between 91% and 94%), this trend indicates that as climate change worsens, parts of the suitable habitat may face a higher risk of loss.
Overall, as climate change continues to intensify, the low-impact areas for the three rare and endangered Indocalamus species gradually diminish. Additionally, Figure 5 indicates that the key low-impact regions for these species are primarily located in Guizhou, Chongqing, Yunnan, Hunan, Guangxi, Hubei, Anhui, Jiangsu, Shanghai, as well as southern Hebei, northern Zhejiang, northern Jiangxi, and eastern Sichuan.

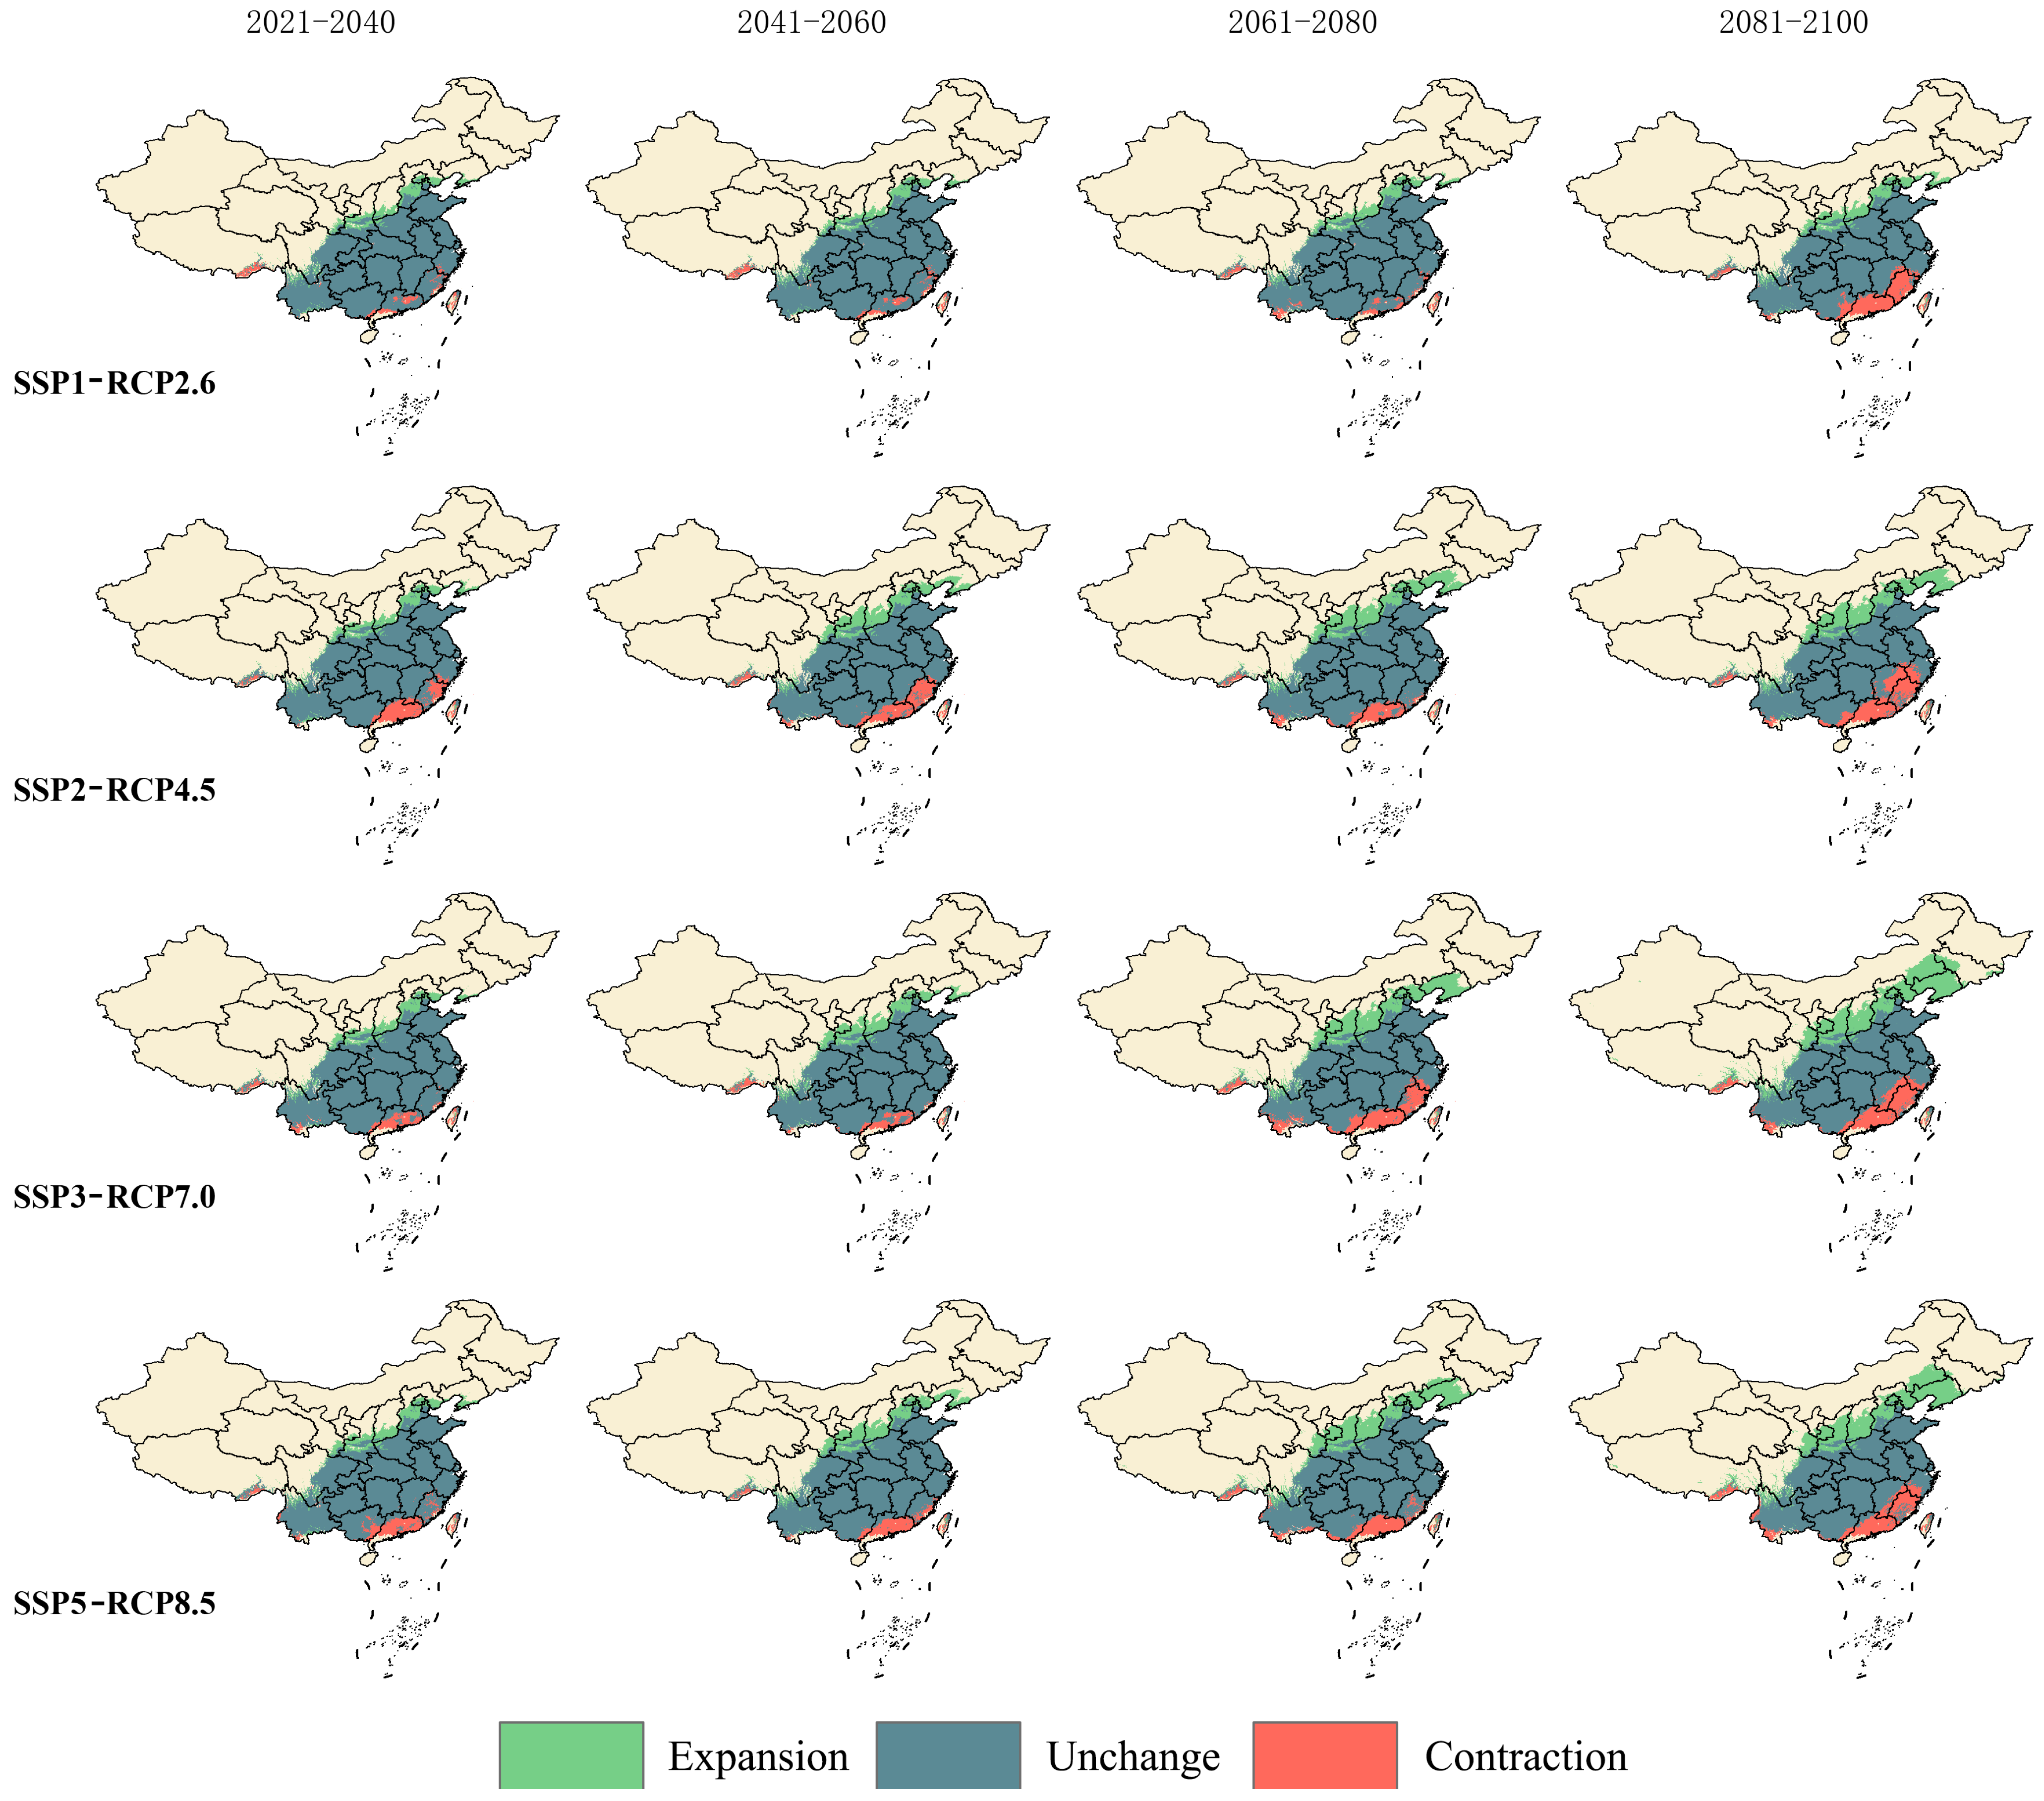
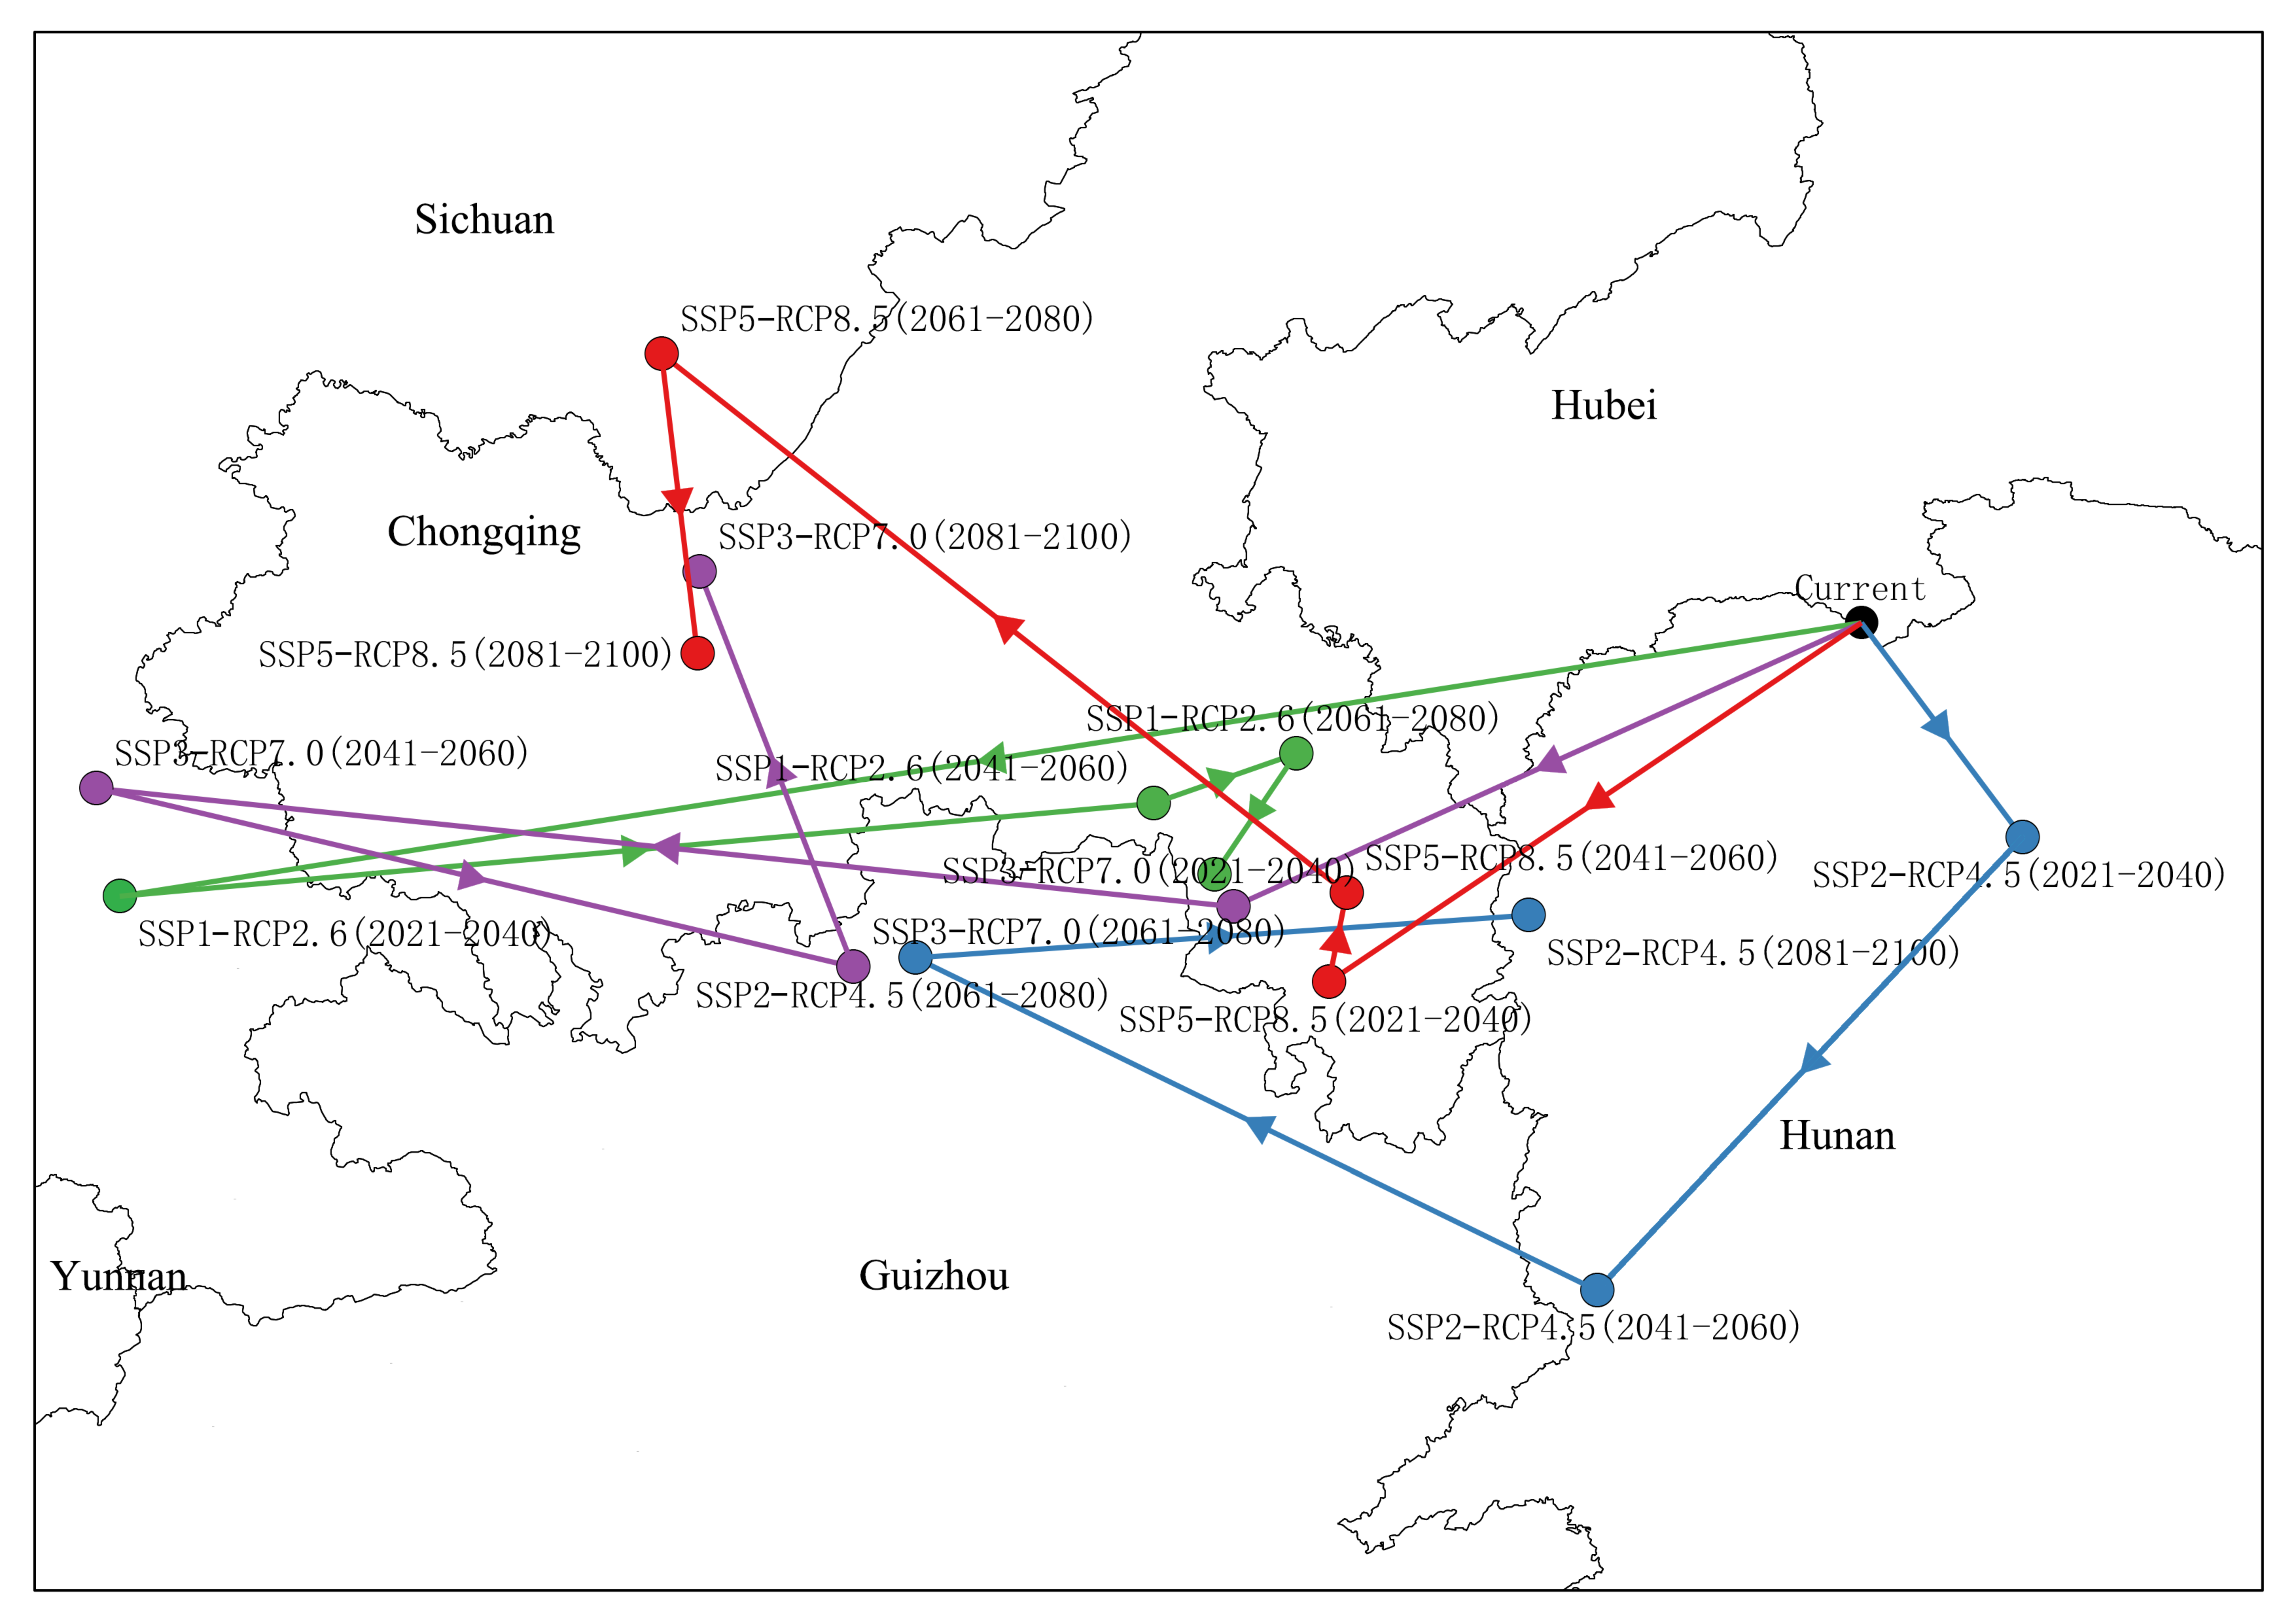
3.5. Trends in the Migration of Suitable Area Distribution Centers

As depicted in Figure 6, within the SSP1-RCP2.6 scenario, the core of the potential suitable region progressively shifts southwestward from its present position in Hubei Province, ultimately settling near the boundary between Guizhou Province and Chongqing. In this low-emission scenario, the suitable areas for the three rare and endangered Indocalamus species are expected to shift over time toward the more climate-favorable southwestern regions.
In the SSP2-RCP4.5 scenario, the core of the suitable region shows notable spatial variability. During the 2021–2040 period, the center shifts from Hubei toward Hunan. Afterward, it gradually moves southwest, ultimately reaching Guizhou Province by the 2061–2080 period. In this moderate-emission scenario, while the center’s migration shows some variability, the overall trend still points southwestward.
In the SSP3-RCP7.0 scenario, the migration path of the suitable habitat center exhibits complexity and phased shifts. From 2021 to 2040, the center moves southwest from its current location in Hubei Province. During the 2041–2060 period, it continues to shift westward, reaching the Sichuan Province region. By 2061–2080, the center migrates near the border of Guizhou Province and Chongqing Municipality. Finally, between 2081 and 2100, the center undergoes another significant shift, moving to the border area between Chongqing Municipality and Sichuan Province.
In the SSP5-RCP8.5 scenario, the center of the suitable habitat shifts rapidly southwest to the Chongqing region during the 2021–2040 period, briefly moves northward (slightly northeast) in the 2041–2060 period, then shifts significantly northwest between 2061 and 2100, and finally moves southward (slightly southeast) to reach Chongqing during the 2081–2100 period. This trajectory indicates that under an extreme emission scenario, the extent and speed of the habitat center’s migration significantly increase, with the suitable habitat shifting toward the warmer and wetter western regions.

4. Discussion

Forecasting the likely distribution of species’ suitable habitats through the MaxEnt model has become a commonly used approach in biology, ecology, biogeography, evolutionary studies, and species conservation efforts [25]. However, past studies often failed to fully optimize model parameters, leading to reduced prediction accuracy [52,53]. Research has demonstrated that factors such as the validation of species occurrence data, the selection of environmental variables, the choice of GCMs and SSPs, and the determination of thresholds significantly influence the accuracy of model predictions [9]. In this study, we systematically refined these parameters to improve the MaxEnt model’s accuracy in forecasting the suitable habitats for Indocalamus species, offering a more accurate simulation of their potential distribution. This approach also offers valuable insights for the study of other species distribution models.
The spatial distribution of plants is predominantly influenced by climatic factors, with hydrothermal conditions acting as the dominant forces behind their distributional patterns [54]. Variations in precipitation can affect soil moisture, which in turn influences plant reproduction and growth [55]. In our study, we identified the minimum temperature during the coldest month (BIO6) and the mean diurnal temperature variation (BIO2) as the critical bioclimatic factors influencing the potential distribution of the three rare and endangered Indocalamus species. BIO6 contributed 75.0% to the final model, indicating that extremely low temperatures may threaten species viability or disrupt phenological cycles and seasonal shifts, positioning low temperatures as a primary limiting factor in the distribution of these rare species. While BIO6 had the greatest impact on the distribution model, this does not downplay the significance of other climatic variables. Low temperatures may interact with other environmental factors, collectively influencing plant growth conditions [56,57].
Under future climate change scenarios, while moderate temperature increases may temporarily promote plant growth [58,59], sustained global warming could gradually push temperatures beyond the optimal range for these species. Plants have a specific threshold for temperature tolerance, and when this threshold is exceeded, their growth and survival are adversely affected [60], leading to a reduction in suitable habitats. Additionally, as climate change progresses, the frequency and severity of extreme weather events—such as droughts, heatwaves, and heavy rainfall—are projected to increase [61,62]. These extreme events often have destructive effects on plant communities, potentially causing declines in species richness and biodiversity [63,64] and weakening ecosystem resilience, which further contributes to habitat contraction. Overall, from a pre-2100 perspective, the potential suitable habitats of three rare and endangered species of the genus Fargesia gradually shift westward. This suggests that as the greenhouse effect intensifies and the average temperature exceeds the tolerance limit of Indocalamus, the distribution range of these species will progressively contract.
Indocalamus represents a group of bamboo species with considerable economic value and that is well suited for cultivation in regions south of the Yangtze River in China. Moreover, the three rare and endangered Indocalamus species offer significant ornamental value, making them ideal candidates for landscape use. However, due to habitat degradation caused by human activity and climate change, the resources available to these species are steadily diminishing. Model forecasts suggest that the potential suitable habitats for Indocalamus are expected to gradually shift toward the southwestern and eastern regions of China in the future. As a result, these regions should be prioritized in conservation efforts to secure the species’ ongoing survival in optimal conditions. This recommendation aligns with current plant conservation approaches and is crucial for reducing the impacts of climate change on species’ habitats [65].
Low-impact areas (LIAs) refer to regions where species habitats are projected to remain stable amid future climate change scenarios [36], making them critical for long-term conservation efforts. Our analysis suggests that LIAs will be concentrated in regions such as Chongqing, Guizhou, Sichuan, Yunnan, Hunan, and Hubei. These areas, characterized by high ecological stability, are ideal for introducing and cultivating new populations of rare and endangered Indocalamus species. Developing cultivation strategies in these regions proactively will support species persistence and mitigate the negative impacts of climate change on Indocalamus growth. Furthermore, given the shifting nature of suitable habitats, we recommend establishing ecological corridors to link these suitable areas, promoting natural species dispersal and gene flow [66].
Although this study focuses primarily on how bioclimatic variables affect species distribution, it is crucial to acknowledge that species distribution is also shaped by various other factors, including interspecies competition, disease, soil conditions, topography, and human activities [54]. Future research should incorporate both biotic and abiotic factors to develop a more comprehensive understanding of the distribution patterns of rare and endangered Indocalamus species. Additionally, this study assumes that species possess sufficient dispersal capabilities under climate change, allowing them to migrate to climatically favorable areas. However, variables such as migration rates and geographical or ecological isolation can profoundly influence species distribution and should be considered in future research [66,67,68]. Species distribution models often assume that ecological niches remain constant when predicting species–environment interactions, though in reality, niches may shift in response to environmental changes [69]. Therefore, future studies should aim to improve these models to more accurately simulate and forecast species distribution under changing climate conditions.

5. Conclusions

This study employed an optimized MaxEnt model to predict the potential distribution and shifts in suitable habitats for three rare and endangered Indocalamus species under four Shared Socioeconomic Pathways (SSP1-RCP2.6, SSP2-RCP4.5, SSP3-RCP7.0, and SSP5-RCP8.5) across the current period (1970–2000) and four future periods (2021–2040, 2041–2060, 2061–2080, and 2081–2100). The results revealed that the potential suitable habitat areas are expected to expand under all four future climate scenarios. Based on predictions from different climate scenarios and time periods, the low-impact zones are primarily concentrated in Chongqing, Sichuan, Guizhou, and surrounding areas. The center of suitable habitats for the three rare and endangered species of the genus Indocalamus gradually shifts westward. The findings of this study provide critical insights for the survey, conservation, and utilization of genetic resources of these rare and endangered Indocalamus species. Furthermore, future research should integrate more biotic and abiotic factors and consider aspects such as species migration rates and niche shifts to develop a more comprehensive understanding and protection strategy for Indocalamus and other rare and endangered species.

Author Contributions

Conceptualization, Y.X.; methodology, Y.X.; software, H.H. and L.C. (Lijia Chen); validation, Y.X., H.H., L.C. (Lijia Chen), and Y.Z.; formal analysis, F.W., J.X. and Y.X.; investigation, Y.X.; and J.L.; resources, H.H. and L.C. (Lijia Chen); data curation, Y.X.; writing—original draft preparation, Y.X.; writing—review and editing, Y.X., F.W. and J.X.; visualization, Y.X.; supervision, Y.Z.; project administration, T.H., L.C. (Lingyan Chen), J.R., L.C. (Liguang Chen), and Y.Z.; funding acquisition, Y.Z. All authors have read and agreed to the published version of the manuscript.

Funding

This research was funded by: National Key R&D Program of China (Grant No. 2023YFD2201201), The Collaborative Innovation Center for Efficient Cultivation and Utilization of Bamboo Resources.

Data Availability Statement

The data in this paper need to remain confidential for the time being and therefore cannot currently be made public.

Conflicts of Interest

The authors declare no conflicts of interest.

References

  1. Record, S.; Fitzpatrick, M.C.; Finley, A.O.; Veloz, S.; Ellison, A.M. Should Species Distribution Models Account for Spatial Autocorrelation? A Test of Model Projections across Eight Millennia of Climate Change. Glob. Ecol. Biogeogr. 2013, 22, 760–771. [Google Scholar] [CrossRef]
  2. Santos-Hernández, A.F.; Monterroso-Rivas, A.I.; Granados-Sánchez, D.; Villanueva-Morales, A.; Santacruz-Carrillo, M. Projections for Mexico’s Tropical Rainforests Considering Ecological Niche and Climate Change. Forests 2021, 12, 119. [Google Scholar] [CrossRef]
  3. Carroll, C.; Dunk, J.R.; Moilanen, A. Optimizing Resiliency of Reserve Networks to Climate Change: Multispecies Conservation Planning in the Pacific Northwest, USA. Glob. Chang. Biol. 2010, 16, 891–904. [Google Scholar] [CrossRef]
  4. Braunisch, V.; Coppes, J.; Arlettaz, R.; Suchant, R.; Schmid, H.; Bollmann, K. Selecting from Correlated Climate Variables: A Major Source of Uncertainty for Predicting Species Distributions under Climate Change. Ecography 2013, 36, 971–983. [Google Scholar] [CrossRef]
  5. Cursach, J.; Moragues, E.; Rita, J. The Key Role of Accompanying Species in the Response of the Critically Endangered Naufraga balearica (Apiaceae) to Climatic Factors. Plant Ecol. 2018, 219, 561–576. [Google Scholar] [CrossRef]
  6. Menzel, A.; Sparks, T.H.; Estrella, N.; Roy, D.B. Altered Geographic and Temporal Variability in Phenology in Response to Climate Change. Glob. Ecol. Biogeogr. 2006, 15, 498–504. [Google Scholar] [CrossRef]
  7. Costion, C.M.; Simpson, L.; Pert, P.L.; Carlsen, M.M.; John Kress, W.; Crayn, D. Will Tropical Mountaintop Plant Species Survive Climate Change? Identifying Key Knowledge Gaps Using Species Distribution Modelling in Australia. Biol. Conserv. 2015, 191, 322–330. [Google Scholar] [CrossRef]
  8. Forester, B.R.; DeChaine, E.G.; Bunn, A.G. Integrating Ensemble Species Distribution Modelling and Statistical Phylogeography to Inform Projections of Climate Change Impacts on Species Distributions. Divers. Distrib. 2013, 19, 1480–1495. [Google Scholar] [CrossRef]
  9. Yang, Z.; Bai, Y.; Alatalo, J.M.; Huang, Z.; Yang, F.; Pu, X.; Wang, R.; Yang, W.; Guo, X. Spatio-Temporal Variation in Potential Habitats for Rare and Endangered Plants and Habitat Conservation Based on the Maximum Entropy Model. Sci. Total Environ. 2021, 784, 147080. [Google Scholar] [CrossRef]
  10. Ye, X.; Zhao, G.; Zhang, M.; Cui, X.; Fan, H.; Liu, B. Distribution Pattern of Endangered Plant Semiliquidambar cathayensis (Hamamelidaceae) in Response to Climate Change after the Last Interglacial Period. Forests 2020, 11, 434. [Google Scholar] [CrossRef]
  11. Li, X.; Mao, F.; Du, H.; Zhou, G.; Xing, L.; Liu, T.; Han, N.; Liu, Y.; Zhu, D.; Zheng, J.; et al. Spatiotemporal Evolution and Impacts of Climate Change on Bamboo Distribution in China. J. Environ. Manag. 2019, 248, 109265. [Google Scholar] [CrossRef] [PubMed]
  12. Cupertino-Eisenlohr, M.A.; Vinicius-Silva, R.; Meireles, L.D.; Eisenlohr, P.V.; Meira-Neto, J.A.A.; Santos-Goncalves, A.P. Stability or Breakdown under Climate Change? A Key Group of Woody Bamboos Will Find Suitable Areas in Its Richness Center. Biodivers. Conserv. 2017, 26, 1845–1861. [Google Scholar] [CrossRef]
  13. Bhandawat, A.; Sharma, V.; Sharma, H.; Sood, A.; Sharma, R.K. Development and Crosstransferability of Functionally Relevant Microsatellite Markers in Dendrocalamus latiflorus and Related Bamboo Species. J. Genet. 2015, 94, 48–55. [Google Scholar] [CrossRef]
  14. Wu, Z.Y.; Raven, P.; Hong, D.Y. Flora of China; Botanical Garden Press: St. Louis, MO, USA, 2013. [Google Scholar]
  15. Department of Wildlife Conservation and Nature Reserve Management, State Forestry Administration, Institute of Botany, Chinese Academy of Sciences. Illustrated Handbook of Rare and Endangered Plants of China; China Forestry Publishing House: Beijing, China, 2013. [Google Scholar]
  16. Zhang, M.; Keenan, T.F.; Luo, X.; Serra-Diaz, J.M.; Li, W.; King, T.; Cheng, Q.; Li, Z.; Andriamiarisoa, R.L.; Raherivelo, T.N.A.N.; et al. Elevated CO2 Moderates the Impact of Climate Change on Future Bamboo Distribution in Madagascar. Sci. Total Environ. 2022, 810, 152235. [Google Scholar] [CrossRef]
  17. Zhao, H.; Yang, X.; Shi, S.; Xu, Y.; Yu, X.; Ye, X. Climate-Driven Distribution Changes for Bashania fargesii in the Qinling Mountains and Its Implication for Panda Conservation. Glob. Ecol. Conserv. 2023, 46, e02610. [Google Scholar] [CrossRef]
  18. Wu, Y.; Li, J.; Yu, L.; Wang, S.; Lv, Z.; Long, H.; Zhai, J.; Lin, S.; Meng, Y.; Cao, Z.; et al. Overwintering Performance of Bamboo Leaves, and Establishment of Mathematical Model for the Distribution and Introduction Prediction of Bamboos. Front. Plant Sci. 2023, 14, 1255033. [Google Scholar] [CrossRef]
  19. Vicente, J.R.; Fernandes, R.F.; Randin, C.F.; Broennimann, O.; Goncalves, J.; Marcos, B.; Pocas, I.; Alves, P.; Guisan, A.; Honrado, J.P. Will Climate Change Drive Alien Invasive Plants into Areas of High Protection Value? An Improved Model-Based Regional Assessment to Prioritise the Management of Invasions. J. Environ. Manag. 2013, 131, 185–195. [Google Scholar] [CrossRef]
  20. Tabor, J.A.; Koch, J.B. Ensemble Models Predict Invasive Bee Habitat Suitability Will Expand under Future Climate Scenarios in Hawai’i. Insects 2021, 12, 443. [Google Scholar] [CrossRef]
  21. Oduor, A.M.O.; Yang, B.; Li, J. Alien Ornamental Plant Species Cultivated in Taizhou, Southeastern China, May Experience Greater Range Expansions than Native Species under Future Climates. Glob. Ecol. Conserv. 2023, 41, e02371. [Google Scholar] [CrossRef]
  22. Anderson, R.P. A Framework for Using Niche Models to Estimate Impacts of Climate Change on Species Distributions. Ann. N. Y. Acad. Sci. 2013, 1297, 8–28. [Google Scholar] [CrossRef]
  23. Xu, Z.; Luo, Y.; Qin, S.; Zhu, G.; Li, D. Current Status and Geographic Distribution of Bamboo Specimens in Chinese Herbaria. Biodiversity 2021, 29, 897–909. [Google Scholar]
  24. Elith, J.; Leathwick, J.R. Species Distribution Models: Ecological Explanation and Prediction across Space and Time. Annu. Rev. Ecol. Evol. Syst. 2009, 40, 677–697. [Google Scholar] [CrossRef]
  25. Araújo, M.B.; Guisan, A. Five (or so) Challenges for Species Distribution Modelling. J. Biogeogr. 2006, 33, 1677–1688. [Google Scholar] [CrossRef]
  26. Marmion, M.; Luoto, M.; Heikkinen, R.K.; Thuiller, W. The Performance of State-of-the-Art Modelling Techniques Depends on Geographical Distribution of Species. Ecol. Model. 2009, 220, 3512–3520. [Google Scholar] [CrossRef]
  27. Zhao, Z.; Guo, Y.; Wei, H.; Ran, Q.; Gu, W. Predictions of the Potential Geographical Distribution and Quality of a Gynostemma pentaphyllum Base on the Fuzzy Matter Element Model in China. Sustainability 2017, 9, 1114. [Google Scholar] [CrossRef]
  28. Brown, J.L. SDMtoolbox: A Python-Based GIS Toolkit for Landscape Genetic, Biogeographic and Species Distribution Model Analyses. Methods Ecol. Evol. 2014, 5, 694–700. [Google Scholar] [CrossRef]
  29. Brown, J.L.; Bennett, J.R.; French, C.M. SDMtoolbox 2.0: The next Generation Python-Based GIS Toolkit for Landscape Genetic, Biogeographic and Species Distribution Model Analyses. PeerJ 2017, 5, e4095. [Google Scholar] [CrossRef]
  30. Elith, J.; Phillips, S.J.; Hastie, T.; Dudík, M.; Chee, Y.E.; Yates, C.J. A Statistical Explanation of MaxEnt for Ecologists. Divers. Distrib. 2011, 17, 43–57. [Google Scholar] [CrossRef]
  31. Pearson, R.G.; Raxworthy, C.J.; Nakamura, M.; Townsend Peterson, A. Predicting Species Distributions from Small Numbers of Occurrence Records: A Test Case Using Cryptic Geckos in Madagascar. J. Biogeogr. 2007, 34, 102–117. [Google Scholar] [CrossRef]
  32. Dou, P.; Dong, Y.; Chen, L.; Yang, H.-Q. Modeling the Potential Distribution of Different Types of Dendrocalamus sinicus, the Strongest Woody Bamboo in the World, with MaxEnt Model. Peerj 2022, 10, e13847. [Google Scholar] [CrossRef]
  33. Meena, R.K.; Bhandari, M.S.; Thakur, P.K.; Negi, N.; Pandey, S.; Kant, R.; Sharma, R.; Sahu, N.; Avtar, R. MaxEnt-Based Potential Distribution Mapping and Range Shift under Future Climatic Scenarios for an Alpine Bamboo Thamnocalamus spathiflorus in Northwestern Himalayas. Land 2024, 13, 931. [Google Scholar] [CrossRef]
  34. Chen, L.-J.; Xie, Y.-Q.; He, T.-Y.; Chen, L.-Y.; Rong, J.-D.; Chen, L.-G.; Zheng, Y.-S. Projecting the Impacts of Climate Change, Soil, and Landscape on the Geographic Distribution of Ma Bamboo (Dendrocalamus latiflorus Munro) in China. Forests 2024, 15, 1321. [Google Scholar] [CrossRef]
  35. Tang, C.Q.; Matsui, T.; Ohashi, H.; Dong, Y.-F.; Momohara, A.; Herrando-Moraira, S.; Qian, S.; Yang, Y.; Ohsawa, M.; Luu, H.T.; et al. Identifying Long-Term Stable Refugia for Relict Plant Species in East Asia. Nat. Commun. 2018, 9, 4488. [Google Scholar] [CrossRef] [PubMed]
  36. Zhao, Q.; Mi, Z.-Y.; Lu, C.; Zhang, X.-F.; Chen, L.-J.; Wang, S.-Q.; Niu, J.-F.; Wang, Z.-Z. Predicting Potential Distribution of Ziziphus spinosa (Bunge) H.H. Hu Ex F.H. Chen in China under Climate Change Scenarios. Ecol. Evol. 2022, 12, e8629. [Google Scholar] [CrossRef]
  37. Xing, D.; Hao, Z. The Principle of Maximum Entropy and Its Application in Ecological Research. Biodiversity 2011, 19, 295–302. [Google Scholar]
  38. Keliang, Z.; Sun, L.; Tao, J. Impact of Climate Change on the Distribution of Euscaphis japonica (Staphyleaceae) Trees. Forests 2020, 11, 525. [Google Scholar] [CrossRef]
  39. Warren, D.L.; Matzke, N.J.; Cardillo, M.; Baumgartner, J.B.; Beaumont, L.J.; Turelli, M.; Glor, R.E.; Huron, N.A.; Simões, M.; Iglesias, T.L.; et al. ENMTools 1.0: An R Package for Comparative Ecological Biogeography. Ecography 2021, 44, 504–511. [Google Scholar] [CrossRef]
  40. Phillips, S.J.; Dudík, M. Modeling of Species Distributions with Maxent: New Extensions and a Comprehensive Evaluation. Ecography 2008, 31, 161–175. [Google Scholar] [CrossRef]
  41. Cahill, A.E.; Aiello-Lammens, M.E.; Fisher-Reid, M.C.; Hua, X.; Karanewsky, C.J.; Yeong Ryu, H.; Sbeglia, G.C.; Spagnolo, F.; Waldron, J.B.; Warsi, O.; et al. How Does Climate Change Cause Extinction? Proc. R. Soc. B Biol. Sci. 2013, 280, 20121890. [Google Scholar] [CrossRef]
  42. Warren, B.H.; Bakker, F.T.; Bellstedt, D.U.; Bytebier, B.; Claßen-Bockhoff, R.; Dreyer, L.L.; Edwards, D.; Forest, F.; Galley, C.; Hardy, C.R.; et al. Consistent Phenological Shifts in the Making of a Biodiversity Hotspot: The Cape Flora. BMC Evol. Biol. 2011, 11, 39. [Google Scholar] [CrossRef]
  43. Lobo, J.M.; Jiménez-Valverde, A.; Real, R. AUC: A Misleading Measure of the Performance of Predictive Distribution Models. Glob. Ecol. Biogeogr. 2008, 17, 145–151. [Google Scholar] [CrossRef]
  44. Warren, D.L.; Seifert, S.N. Ecological Niche Modeling in Maxent: The Importance of Model Complexity and the Performance of Model Selection Criteria. Ecol. Appl. 2011, 21, 335–342. [Google Scholar] [CrossRef] [PubMed]
  45. Arenas-Castro, S.; Gonçalves, J.F.; Moreno, M.; Villar, R. Projected Climate Changes Are Expected to Decrease the Suitability and Production of Olive Varieties in Southern Spain. Sci. Total Environ. 2020, 709, 136161. [Google Scholar] [CrossRef] [PubMed]
  46. Hu, Z.; Hu, J.; Hu, H.; Zhou, Y. Predictive Habitat Suitability Modeling of Deep-Sea Framework-Forming Scleractinian Corals in the Gulf of Mexico. Sci. Total Environ. 2020, 742, 140562. [Google Scholar] [CrossRef]
  47. Li, W.; Yu, Y.; Liu, P.; Tang, R.; Dai, Y.; Li, L.; Zhang, L. Identifying Climate Refugia and Its Potential Impact on Small Population of Asian Elephant (Elephas maximus) in China. Glob. Ecol. Conserv. 2019, 19, e00664. [Google Scholar] [CrossRef]
  48. Pan, J.; Fan, X.; Luo, S.; Zhang, Y.; Yao, S.; Guo, Q.; Qian, Z. Predicting the Potential Distribution of Two Varieties of Litsea coreana (Leopard-Skin Camphor) in China under Climate Change. Forests 2020, 11, 1159. [Google Scholar] [CrossRef]
  49. Zhao, Q.; Zhang, Y.; Li, W.-N.; Hu, B.-W.; Zou, J.-B.; Wang, S.-Q.; Niu, J.-F.; Wang, Z.-Z. Predicting the Potential Distribution of Perennial Plant Coptis chinensis Franch. in China under Multiple Climate Change Scenarios. Forests 2021, 12, 1464. [Google Scholar] [CrossRef]
  50. Smith, A.B.; Godsoe, W.; Rodríguez-Sánchez, F.; Wang, H.-H.; Warren, D. Niche Estimation Above and Below the Species Level. Trends Ecol. Evol. 2019, 34, 260–273. [Google Scholar] [CrossRef]
  51. Zurell, D.; Franklin, J.; König, C.; Bouchet, P.J.; Dormann, C.F.; Elith, J.; Fandos, G.; Feng, X.; Guillera-Arroita, G.; Guisan, A.; et al. A Standard Protocol for Reporting Species Distribution Models. Ecography 2020, 43, 1261–1277. [Google Scholar] [CrossRef]
  52. Yan, H.; Feng, L.; Zhao, Y.; Feng, L.; Wu, D.; Zhu, C. Prediction of the Spatial Distribution of Alternanthera philoxeroides in China Based on ArcGIS and MaxEnt. Glob. Ecol. Conserv. 2020, 21, e00856. [Google Scholar] [CrossRef]
  53. Yan, H.; Feng, L.; Zhao, Y.; Feng, L.; Zhu, C.; Qu, Y.; Wang, H. Predicting the Potential Distribution of an Invasive Species, Erigeron canadensis L., in China with a Maximum Entropy Model. Glob. Ecol. Conserv. 2020, 21, e00822. [Google Scholar] [CrossRef]
  54. Sun, S.; Zhang, Y.; Huang, D.; Wang, H.; Cao, Q.; Fan, P.; Yang, N.; Zheng, P.; Wang, R. The Effect of Climate Change on the Richness Distribution Pattern of Oaks (Quercus L.) in China. Sci. Total Environ. 2020, 744, 140786. [Google Scholar] [CrossRef]
  55. Feng, L.; Sun, J.; Shi, Y.; Wang, G.; Wang, T. Predicting Suitable Habitats of Camptotheca acuminata Considering Both Climatic and Soil Variables. Forests 2020, 11, 891. [Google Scholar] [CrossRef]
  56. López-Carrasco, C.; López-Sánchez, A.; San Miguel, A.; Roig, S. The Effect of Tree Cover on the Biomass and Diversity of the Herbaceous Layer in a Mediterranean Dehesa. Grass Forage Sci. 2015, 70, 639–650. [Google Scholar] [CrossRef]
  57. Ayalew, B.; Hylander, K.; Adugna, G.; Zewdie, B.; Zignol, F.; Tack, A.J.M. Impact of Climate and Management on Coffee Berry Disease and Yield in Coffee’s Native Range. Basic Appl. Ecol. 2024, 76, 25–34. [Google Scholar] [CrossRef]
  58. Büntgen, U.; Palosse, A.; Dolezal, J.; Liebhold, A. Introducing the Concepts of Range-Pinning and Allee Effects to Explain Reduced Temperature Sensitivity of Global Treeline Dynamics. Glob. Chang. Biol. 2024, 30, e17288. [Google Scholar] [CrossRef]
  59. Zhou, A.; Ge, B.; Chen, S.; Kang, D.; Wu, J.; Zheng, Y.; Ma, H. Leaf Ecological Stoichiometry and Anatomical Structural Adaptation Mechanisms of Quercus Sect. Heterobalanus in Southeastern Qinghai-Tibet Plateau. BMC Plant Biol. 2024, 24, 325. [Google Scholar] [CrossRef]
  60. Chmura, D.J.; Banach, J.; Kempf, M.; Kowalczyk, J.; Mohytych, V.; Szeligowski, H.; Buraczyk, W.; Kowalkowski, W. Growth and Productivity of European Beech Populations Show Plastic Response to Climatic Transfer at the North-Eastern Border of the Species Range. For. Ecol. Manag. 2024, 565, 122043. [Google Scholar] [CrossRef]
  61. Henley, B.J.; McGregor, H.V.; King, A.D.; Hoegh-Guldberg, O.; Arzey, A.K.; Karoly, D.J.; Lough, J.M.; DeCarlo, T.M.; Linsley, B.K. Highest Ocean Heat in Four Centuries Places Great Barrier Reef in Danger. Nature 2024, 632, 320–326. [Google Scholar] [CrossRef]
  62. Masson-Delmotte, V. The Physical Science Basis of Climate Change Empowering Transformations, Insights from the IPCC AR6 for a Climate Research Agenda Grounded in Ethics. PLoS Clim. 2024, 3, e0000451. [Google Scholar] [CrossRef]
  63. Ghosh, S.; Matthews, B.; Petchey, O.L. Temperature and Biodiversity Influence Community Stability Differently in Birds and Fishes. Nat. Ecol. Evol. 2024. [Google Scholar] [CrossRef] [PubMed]
  64. Hein, S.R.; Farleigh, K.; Berg, D.J. Riverscape Genomics of the Endangered Freshwater Mussel Lampsilis rafinesqueana. Freshw. Biol. 2024, 69, 1438–1453. [Google Scholar] [CrossRef]
  65. Hannah, L.; Midgley, G.F.; Millar, D. Climate Change-Integrated Conservation Strategies. Glob. Ecol. Biogeogr. 2002, 11, 485–495. [Google Scholar] [CrossRef]
  66. Forgiarini, C.; Meimberg, H.; Curto, M.; Stiehl-Alves, E.M.; Vijayan, T.; Engl, P.T.; Bräuchler, C.; Kollmann, J.; de Souza-Chies, T.T. Low Genetic Differentiation despite High Habitat Fragmentation in an Endemic and Endangered Species of Iridaceae from South America: Implications for Conservation. Bot. J. Linn. Soc. 2024, boae036. [Google Scholar] [CrossRef]
  67. Tomiolo, S.; Ward, D. Species Migrations and Range Shifts: A Synthesis of Causes and Consequences. Perspect. Plant Ecol. Evol. Syst. 2018, 33, 62–77. [Google Scholar] [CrossRef]
  68. Huang, E.; Chen, Y.; Fang, M.; Zheng, Y.; Yu, S. Environmental Drivers of Plant Distributions at Global and Regional Scales. Glob. Ecol. Biogeogr. 2021, 30, 697–709. [Google Scholar] [CrossRef]
  69. Wilting, A.; Cord, A.; Hearn, A.J.; Hesse, D.; Mohamed, A.; Traeholdt, C.; Cheyne, S.M.; Sunarto, S.; Jayasilan, M.-A.; Ross, J.; et al. Modelling the Species Distribution of Flat-Headed Cats (Prionailurus planiceps), an Endangered South-East Asian Small Felid. PLoS ONE 2010, 5, e9612. [Google Scholar] [CrossRef]
Figure 1. The distribution records of three rare and endangered species of the genus Indocalamus in China.
Forests 15 01693 g001
Figure 2. Projected habitat range for three rare and endangered species of the genus Indocalamus under current climatic conditions.
Forests 15 01693 g002
Figure 3. Predicted distribution of three rare and endangered species of the genus Indocalamus under future climate scenarios.
Forests 15 01693 g003
Figure 4. Changes of potential suitable areas for three rare and endangered species of the genus Indocalamus under present and projected climate scenarios. The colors in the figure illustrate the changes in suitable habitat areas for the three species under current and projected climate scenarios. Green indicates the expansion of suitable areas, blue-green indicates stable suitable areas, red indicates a contraction of suitable areas, and yellow represents unaffected regions, meaning these areas are not part of the analysis for changes in suitable habitats.
Forests 15 01693 g004
Figure 5. Predicted low-impact areas for three rare and endangered species of the genus Indocalamus under different shared socioeconomic pathways. In the figure, the different colors show the projected habitat suitability of the species under multiple climate scenarios over future periods, with darker colors representing more stable and suitable habitats. Color 1 (light pink) represents the lowest grade of low-impact areas; color 2 (pink) indicates the second-lowest grade; color 3 (purple) denotes a higher grade; and color 4 (dark purple) signifies the highest grade of low-impact areas.
Forests 15 01693 g005
Figure 6. Shifts in the central distribution of suitable habitats for three rare and endangered species of the genus Indocalamus across various climate scenarios. The four lines depict future climate change scenarios under four distinct Shared Socioeconomic Pathways: green for SSP1-RCP2.6: blue for SSP2-RCP4.5, purple for SSP3-RCP7.0, and red for SSP5-RCP8.5. The arrows illustrate the extent and trajectory of change over time.
Forests 15 01693 g006
Table 1. Low-impact areas for three rare and endangered species of the genus Indocalamus under different shared socioeconomic pathways.
LIA StatisticsShared Socio-Economic Pathways (SSPs)
entry 1SSP1-RCP
2.6
SSP2-RCP4.5SSP3-RCP7.0SSP5-RCP 8.5
Geographic area (×104 km2)237.61229.96229.69231.89
Percentage of current suitable area (%)94.3691.3391.2292.05
Percentage of SSP1-2.6 area (%)100.0096.7896.6697.59
Disclaimer/Publisher’s Note: The statements, opinions and data contained in all publications are solely those of the individual author(s) and contributor(s) and not of MDPI and/or the editor(s). MDPI and/or the editor(s) disclaim responsibility for any injury to people or property resulting from any ideas, methods, instructions or products referred to in the content.

