Article

Genome-Wide Identification, Expression Analysis, and Transcriptome Analysis of the NPF Gene Family under Various Nitrogen Conditions in Eucalyptus grandis

by
Guangyou Li
1,
Deming Yang
1,
Yang Hu
2,
Jianmin Xu
1,
Juan Li
1 and
Zhaohua Lu
1,*
1
Key Laboratory of State Forestry and Grassland Administration on Tropical Forestry, Research Institute of Tropical Forestry, Chinese Academy of Forestry, Guangzhou 510520, China
2
Xinhui Research Institute of Forestry Science, Jiangmen 529100, China
*
Author to whom correspondence should be addressed.
Forests 2024, 15(10), 1697; https://doi.org/10.3390/f15101697
Submission received: 17 August 2024 / Revised: 20 September 2024 / Accepted: 23 September 2024 / Published: 26 September 2024
(This article belongs to the Section Genetics and Molecular Biology)

Abstract

:
The NITRATE TRANSPORTER 1/PEPTIDE TRANSPORTER (NRT1/PTR) family (NPF) plays an important role in plant nitrate absorption, distribution, and nitrogen use efficiency. Nevertheless, few reports are available regarding Eucalyptus grandis NPF genes and their expression profiles. This study aims to identify and analyze NPF genes and their expression under various nitrogen (N) conditions. In this study, we successfully screened 64 NPF genes within the E. grandis genome. Subsequently, we conducted an extensive analysis, encompassing investigations into chromosome location, gene structure, phylogenetic relationship, promoter region, conserved motif, and gene expression profile. RNA-seq was conducted to analyze the expression profiles of EgNPF genes under different N conditions. The 64 NPF genes were categorized into eight distinct groups, exhibiting an uneven distribution among the 10 chromosomes of E. grandis, and no member was mapped on chromosome (Chr) 9. The examination of cis-regulatory elements revealed that NPF promoters were closely related to light responsive element, MeJA responsiveness, anaerobic induction, gibberellin responsiveness, low-temperature responsiveness, and auxin responsiveness. We used the comparative transcriptome method to identify the 10 differently expressed EgNPF genes of E. grandis under high-nitrogen (N: 119 mg/L) and low-nitrogen (N: 29.25 mg/L) conditions. Expression pattern analyses revealed that EUGRSUZ_G03119 showed an elevated expression in both leaves and roots under high-nitrogen conditions compared to low-nitrogen conditions, suggesting that EUGRSUZ_G03119 might affect nitrogen transport and redistribution, potentially boosting the stress tolerance of E. grandis in response to nitrogen deficiency. These findings may provide valuable insights into the evolutionary development of the NPF gene family in E. grandis and facilitate the clarification of the molecular mechanism underlying EgNPF-mediated N absorption and distribution in E. grandis.

1. Introduction

Nitrogen (N) is an indispensable mineral element involved in the physiological metabolism, growth, and development of plants [1,2]. Insufficient N supply can lead to stunted and slow growth, adversely affecting normal plant development. However, the excessive application of N fertilizers to the soil results in only 30%–40% being utilized by crops, and the remaining unabsorbed N may lead to several environmental issues, such as soil acidification, salinization, and water pollution [3,4,5]. Therefore, understanding the mechanisms of plant N absorption and transport is crucial for improving N use efficiency in plants and has significant implications for agricultural production and environmental protection.
Nitrate (NO3) is an important N source for plant growth and development, and its absorption and transport mainly rely on NO3 transporter (NRT) [6]. To adapt to soil environments with varying concentrations of NO3, plants have evolved distinct nitrate transport systems to regulate the absorption of nitrate by their roots [7]. In higher plants, there are two main NRTs: NRT1 and NRT2 [8]. NRT1 is a low-affinity NO3 transporter, primarily active in environments with high nitrate concentrations, while NRT2 is a high-affinity NO3 transporter, which mainly plays a role in low-nitrate environments [9]. The NRT1 gene family shares high sequence similarity with the PEPTIDE TRANSPORTER (PTR) gene family, leading to classify NRT1/PTR into the same gene family, now referred to as the NITRATE TRANSPORTER 1/PEPTIDE TRANSPORTER family (NPF), which is the largest one and plays multifunctional roles in nitrate uptake and transport in plants [10]. In recent years, an increasing number of members and functions of the NPF gene family have been identified across various plants. For instance, 53 NPF genes have been identified in the genome of the model plant Arabidopsis thaliana [11,12]. Moreover, AtNRT1.1/AtNPF6.3 was first identified as the NO3 transporter gene in A. thaliana [13]. Additionally, NPF members have also been identified in rice [14], cotton [15], apple [16], tea tree [17], spinach [18].
Eucalyptus grandis, as the most widely planted hardwood species in the world, possesses significant ecological and economic values due to its rapid growth rate, effective reduction of soil and water loss, and desirable wood properties [19]. The growth of E. grandis requires the support of N fertilizer and other nutrients [20]. Therefore, studying the molecular mechanisms of nitrogen absorption and transport in E. grandis is crucial for improving its N utilization efficiency. The function of the NPF gene as a major NO3 transporter has been extensively characterized in many plants. The chromosome-level genome of E. grandis has been published [21], but E. grandis NPF (EgNPF) genes have not yet been systematically analyzed to identify potential EgNPF genes involved in the absorption and transport of NO3. In this study, a total of 64 EgNPF genes were identified by bioinformatics methods, and their physical and chemical properties, gene structure, phylogenetic relationships, conserved motif duplication events, and cis-acting elements were analyzed. Through RNA-seq analysis and quantitative real-time PCR (qRT-PCR), we identified a set of potential EgNPF genes that are responsive to the absorption and transport of NO3. Our study may provide a basis for the further exploration of the functions of key EgNPF genes in response to N supply to create E. grandis variety with high N uptake and use.

2. Materials and Methods

2.1. Plant Materials

The experiment was conducted in 2023 at the greenhouse of the Research Institute of Tropical Forestry, Chinese Academy of Forestry (23°11′ N, 113°23′ E). Tissue-cultured clones of E. grandis (Qinglong) were used as the experimental material. In total, 18 healthy and uniform seedlings, each approximately 39 cm in height with a ground diameter of 3.5 mm, were planted in polypropylene containers filled with coconut husk. The seedlings were divided into two treatments of 9 plants each, receiving a high N treatment (HN: 119 mg/L) and a low N treatment (LN: 29.25 mg/L). The concentrations of other nutrients were the same as full-strength Hoagland solution and kept consistent across treatments (P: 15.5 mg/L; K: 298.0 mg/L; Mg: 48.1 mg/L; Ca: 210 mg/L; B: 0.5 mg/L; Mn: 0.5 mg/L; Zn: 0.5 mg/L; Cu: 0.5 mg/L; Mo: 0.5 mg/L; Fe: 5.6 mg/L) [22]. Each plant received 100 mL of the corresponding nutrient solution. There were three biological replicates per treatment, with three plants per replicate. After 24 h of treatment (23 December 2023), leaves (the third fully expanded leaf from the top) and roots from each treatment group were sampled and stored in liquid N [23].

2.2. RNA Extraction, cDNA Synthesis, and Transcriptome Sequencing

Total RNA extraction was performed employing the E.Z.N.A Plant RNA Isolation Kit (Omega Bio-tek Inc., Norcross, GA, USA). Concentration and purity of RNAs were assessed using the NanoDrop spectrophotometer 2000C (Thermo Fisher Scientific, Waltham, MA, USA), while the confirmation of RNA integrity was achieved through 1.0% agarose gel electrophoresis. The RNAs with OD260/OD280 values within the range of 1.8–2.0 were subsequently subjected to reverse transcription into cDNA using the PrimeScript™ RT reagent kit with gDNA Eraser (TaKaRa Biotechnology Co., Ltd., Dalian, China), following the manufacturer’s protocols. The resulting cDNAs were subsequently diluted at a 1:10 ratio with RNase-free water and stored at −20 °C for future qRT-PCR analyses. The cDNA libraries were constructed using the NEBNext® UltraTM RNA Library Prep Kit (New England Biolabs, Ipswich, MA, USA) following the manufacturer’s instructions. All cDNA libraries were sequenced using an Illumina HiSeqTM2000 system (Illumina. Inc., San Diego, CA, USA), generating reads with a length of 2 × 100 bp.

2.3. Identification of NPF Genes and Analysis of Physicochemical Properties in E. grandis

The complete protein sequence of E. grandis was obtained from the Genome Warehouse (GWH) at the National Genomics Data Center, Beijing Institute of Genomics (https://ngdc.cncb.ac.cn/, accessed on 5 May 2024). To identify NPF proteins within E. grandis, we downloaded the sequences of A. thaliana NPF proteins from the TAIR database (https://www.arabidopsis.org/, accessed on 5 May 2024). The BLASTP tool [24] with a threshold of E-value < 1 × 10⁻¹⁰ was applied for the local alignment of NPF protein sequences [25]. After an initial filtration, we downloaded the NPF proteins’ conserved domain (PF00854) from the Pfam database (http://pfam.xfam.org/, accessed on 5 May 2024) with the hidden Markov model (HMM) profile. HMMER v3.3.2 software [26] was used to search against the E. grandis protein sequences based on the HMM profile. Based on the obtained NPF protein sequences, we used the ExPASy tool to obtain basic information related to the structure and function of proteins, such as the number of amino acids, isoelectric point (PI), and molecular weight (MW) of the EgNPF family member sequences within E. grandis.

2.4. Phylogeny, Gene Structure, and Conserved Motif Analyses of EgNPF Genes

To determine the phylogenetic relationships of the EgNPF family genes, we first performed a multiple-sequence alignment of all EgNPF full-length protein sequences using the MAFFT v.7.471 software [27]. Based on the alignment FASTA format file, we then constructed phylogenetic trees for each gene using the maximum likelihood (ML) method with the RAxML-HPC v.8.0 software (1000 bootstrap replicates). The EgNPF gene structures were gained from the GFF3 annotation file of E. grandis and visualized by GSDS v2.0 (http://gsds.gao-lab.org/, accessed on 5 May 2024). The conserved motifs of NPF proteins were analyzed using MEME suite v5.5.5 (https://meme-suite.org/meme/tools/meme, accessed on 5 May 2024) with 10 predicted motif parameters.

2.5. Analysis of Promoter of EgNPF Genes

The 2000 bp sequence upstream of the EgNPF genes were extracted from the whole-genome sequence. PlantCARE (http://bioinformatics.psb.ugent.be/webtools/plantcare/html/, accessed on 5 May 2024) was used to predict a variety of cis-acting regulatory elements.

2.6. Chromosomal Localization and Collinearity Analysis of EgNPF Genes

Based on the whole-genome sequence and the GFF3 annotation profile of E. grandis, we obtained the position information file of EgNPF gene family members and drew their chromosomal localization map using the MG2C v2 tool (https://qiaoyundeng.github.io/#:~:text=Mapgene2ch, accessed on 5 May 2024). Genome and GFF3 annotation files of A. thaliana, Populus euphratica, and Oryza sativa from NCBI were used for collinearity analysis. The collinearity analysis of NPF genes with multiple species was performed using the MCScanX v.1.1.11 tool [28]. In order to obtain more gene duplication events and collinearity relationships within E. grandis, the intraspecific collinearity analysis of EgNPF gene family members was carried out, and the tandem and segmental gene pairs were generated using TBtools v2.096.

2.7. Expression Analysis of Selected EgNPF Genes

Following the rigorous process of adapter trimming and quality control of the RNA-seq reads, the resulting high-quality sequences were aligned to the reference genomes using HiSAT2 with default settings [29]. Then, the StringTie program [30] was employed with default parameters to determine the expected number of FPKMs mapped. We carefully selected 10 target genes, namely EUGRSUZ_B00424, EUGRSUZ_B02630, EUGRSUZ_D02167, EUGRSUZ_F03048, EUGRSUZ_G03119, EUGRSUZ_E01723, EUGRSUZ_H02980, EUGRSUZ_J01183, EUGRSUZ_J01942, and EUGRSUZ_K00766 for qRT-PCR evaluation. Primers used for quantifying the expression of LchiWRKYs were designed by using the primer3 website (https://www.yeastgenome.org/primer3, accessed on 8 September 2024). qRT-PCR analysis was performed in a BioRad CFX96 Real-Time PCR platform (BioRad Laboratories, Inc., Hercules, CA, USA). The qRT-PCR experiments were performed utilizing the SYBR qPCR Master MIX (Vazyme Biotechnology Co., Nanjing, China). Three biological replicates were carried out. The relative expression levels were calculated by the 2−ΔΔCT method with the E. grandis 18S gene as an internal reference [31]. The data were statistically analyzed using the OriginPro 7.5 software. Ten-fold serial dilutions of cDNA fragments were used for the initial estimation of the PCR efficiencies of the qRT-PCR assays. EgLL samples were set as the control group for qRT-PCR.

2.8. Vector Construction and Subcellular Localization of EgNPF Gene

The full-length coding sequence (CDS) of the EUGRSUZ_G03119 gene, which includes Kpn I and BamH I restriction sites, was inserted into the pCAMBIA2300-35S-eGFP via in-fusion cloning. The recombinant pCAMBIA2300-35S-EUGRSUZ_G03119-eGFP vectors were further introduced into the GV3101 Agrobacterium tumefaciens strain for subcellular localization and transient expression in tobacco (Nicotiana benthamiana). The nuclear-localized AtH2B gene from A. thaliana was cloned [32], and a recombinant pCAMBIA2300-35S-AtH2B-Mcherry plasmid was constructed as a positive control, which was also transformed into Agrobacterium GV3101. Both engineered Agrobacterium of 35S::EUGRSUZ_G03119-eGFP and positive control (35S::AtH2B-Mcherry) were cultured in 30 mL LB medium at 28 °C for 16 h. The cultures were then centrifuged at 6000× g for 5 min, and the pellets were re-suspended in infiltration buffer (sterile deionized water, 10 mM MES, 150 μM AS, and 10 mM MgCl2) to an OD600 of 1.0. The suspensions were mixed in equal volumes with the positive control culture and incubated in the dark for 3 h. Tobacco plants were grown in the greenhouse with a 16/8 h light/dark photoperiod at 25 °C. Leaves were infiltrated with the recombinant strain suspensions and stored in a growth chamber for 60 h. All images were visualized by a Leica TCS SP8X DLS laser confocal microscope. The primer sequence CDS and information for the EUGRSUZ_G03119 gene are provided in Supplementary File S1.

2.9. Statistical Analysis

We used SPSS 19.0 statistical software (SPSS Inc., Chicago, IL, USA) to perform a one-way analysis of variance (ANOVA), and Duncan’s test was applied to evaluate the significance of differences, with a threshold of p < 0.05. Each treatment contained three biological replicates.

3. Results

3.1. Genome-Wide Identification of the EgNPF Gene Family in E. grandis

Members of the EgNPF gene family were identified in the E. grandis genome using the HMM program, resulting in the designation of 64 genes from EgNPF1 to EgNPF64 (Table S1). Our analysis revealed notable variations in both mRNA transcript lengths and the encoded protein sequences of these EgNPF genes. The coding sequences (CDS) of the 64 EgNPF genes ranged from 786 to 1950 bp, with their translated protein sequences varying from 262 to 650 amino acids. Among them, EgNPF2 exhibited the shortest amino acid sequence at 262 amino acid residues, while EgNPF37 had the longest at 650 amino acid residues. The theoretical isoelectric points (PIs) ranged from 4.87 (EgNPF17) to 5.09 (EgNPF2), and the molecular masses of the EgNPF proteins varied from 65,397.73 Da (EgNPF2) to 161,863.65 Da (EgNPF17) (Table S1).

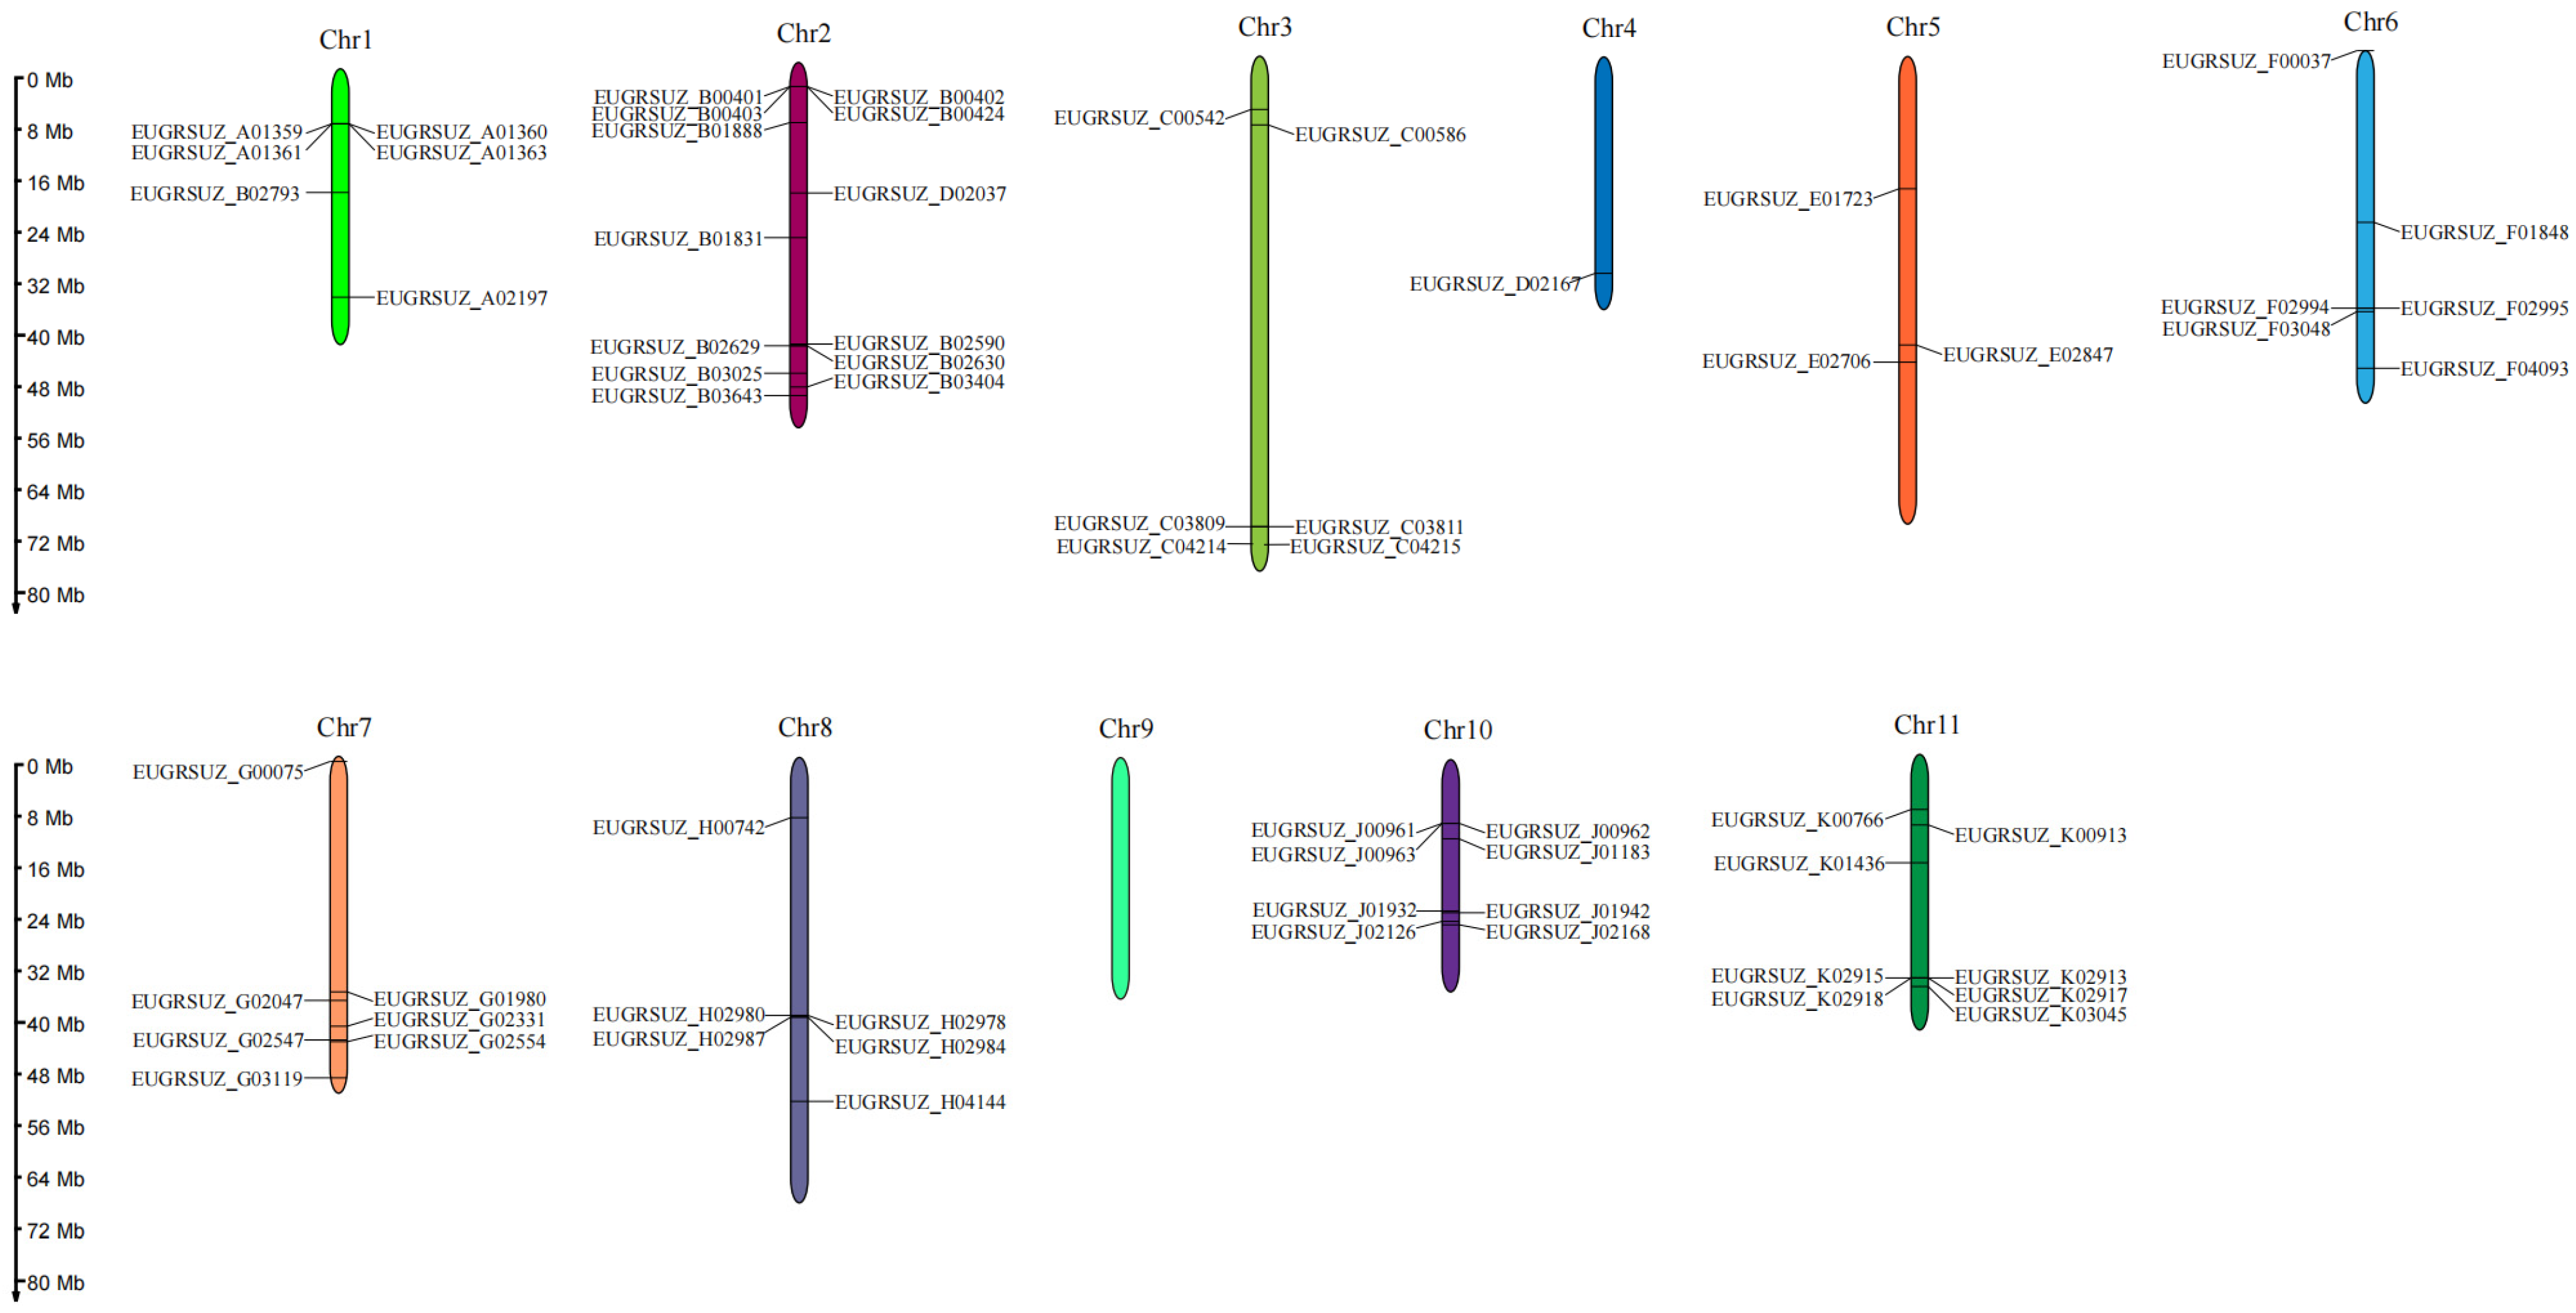
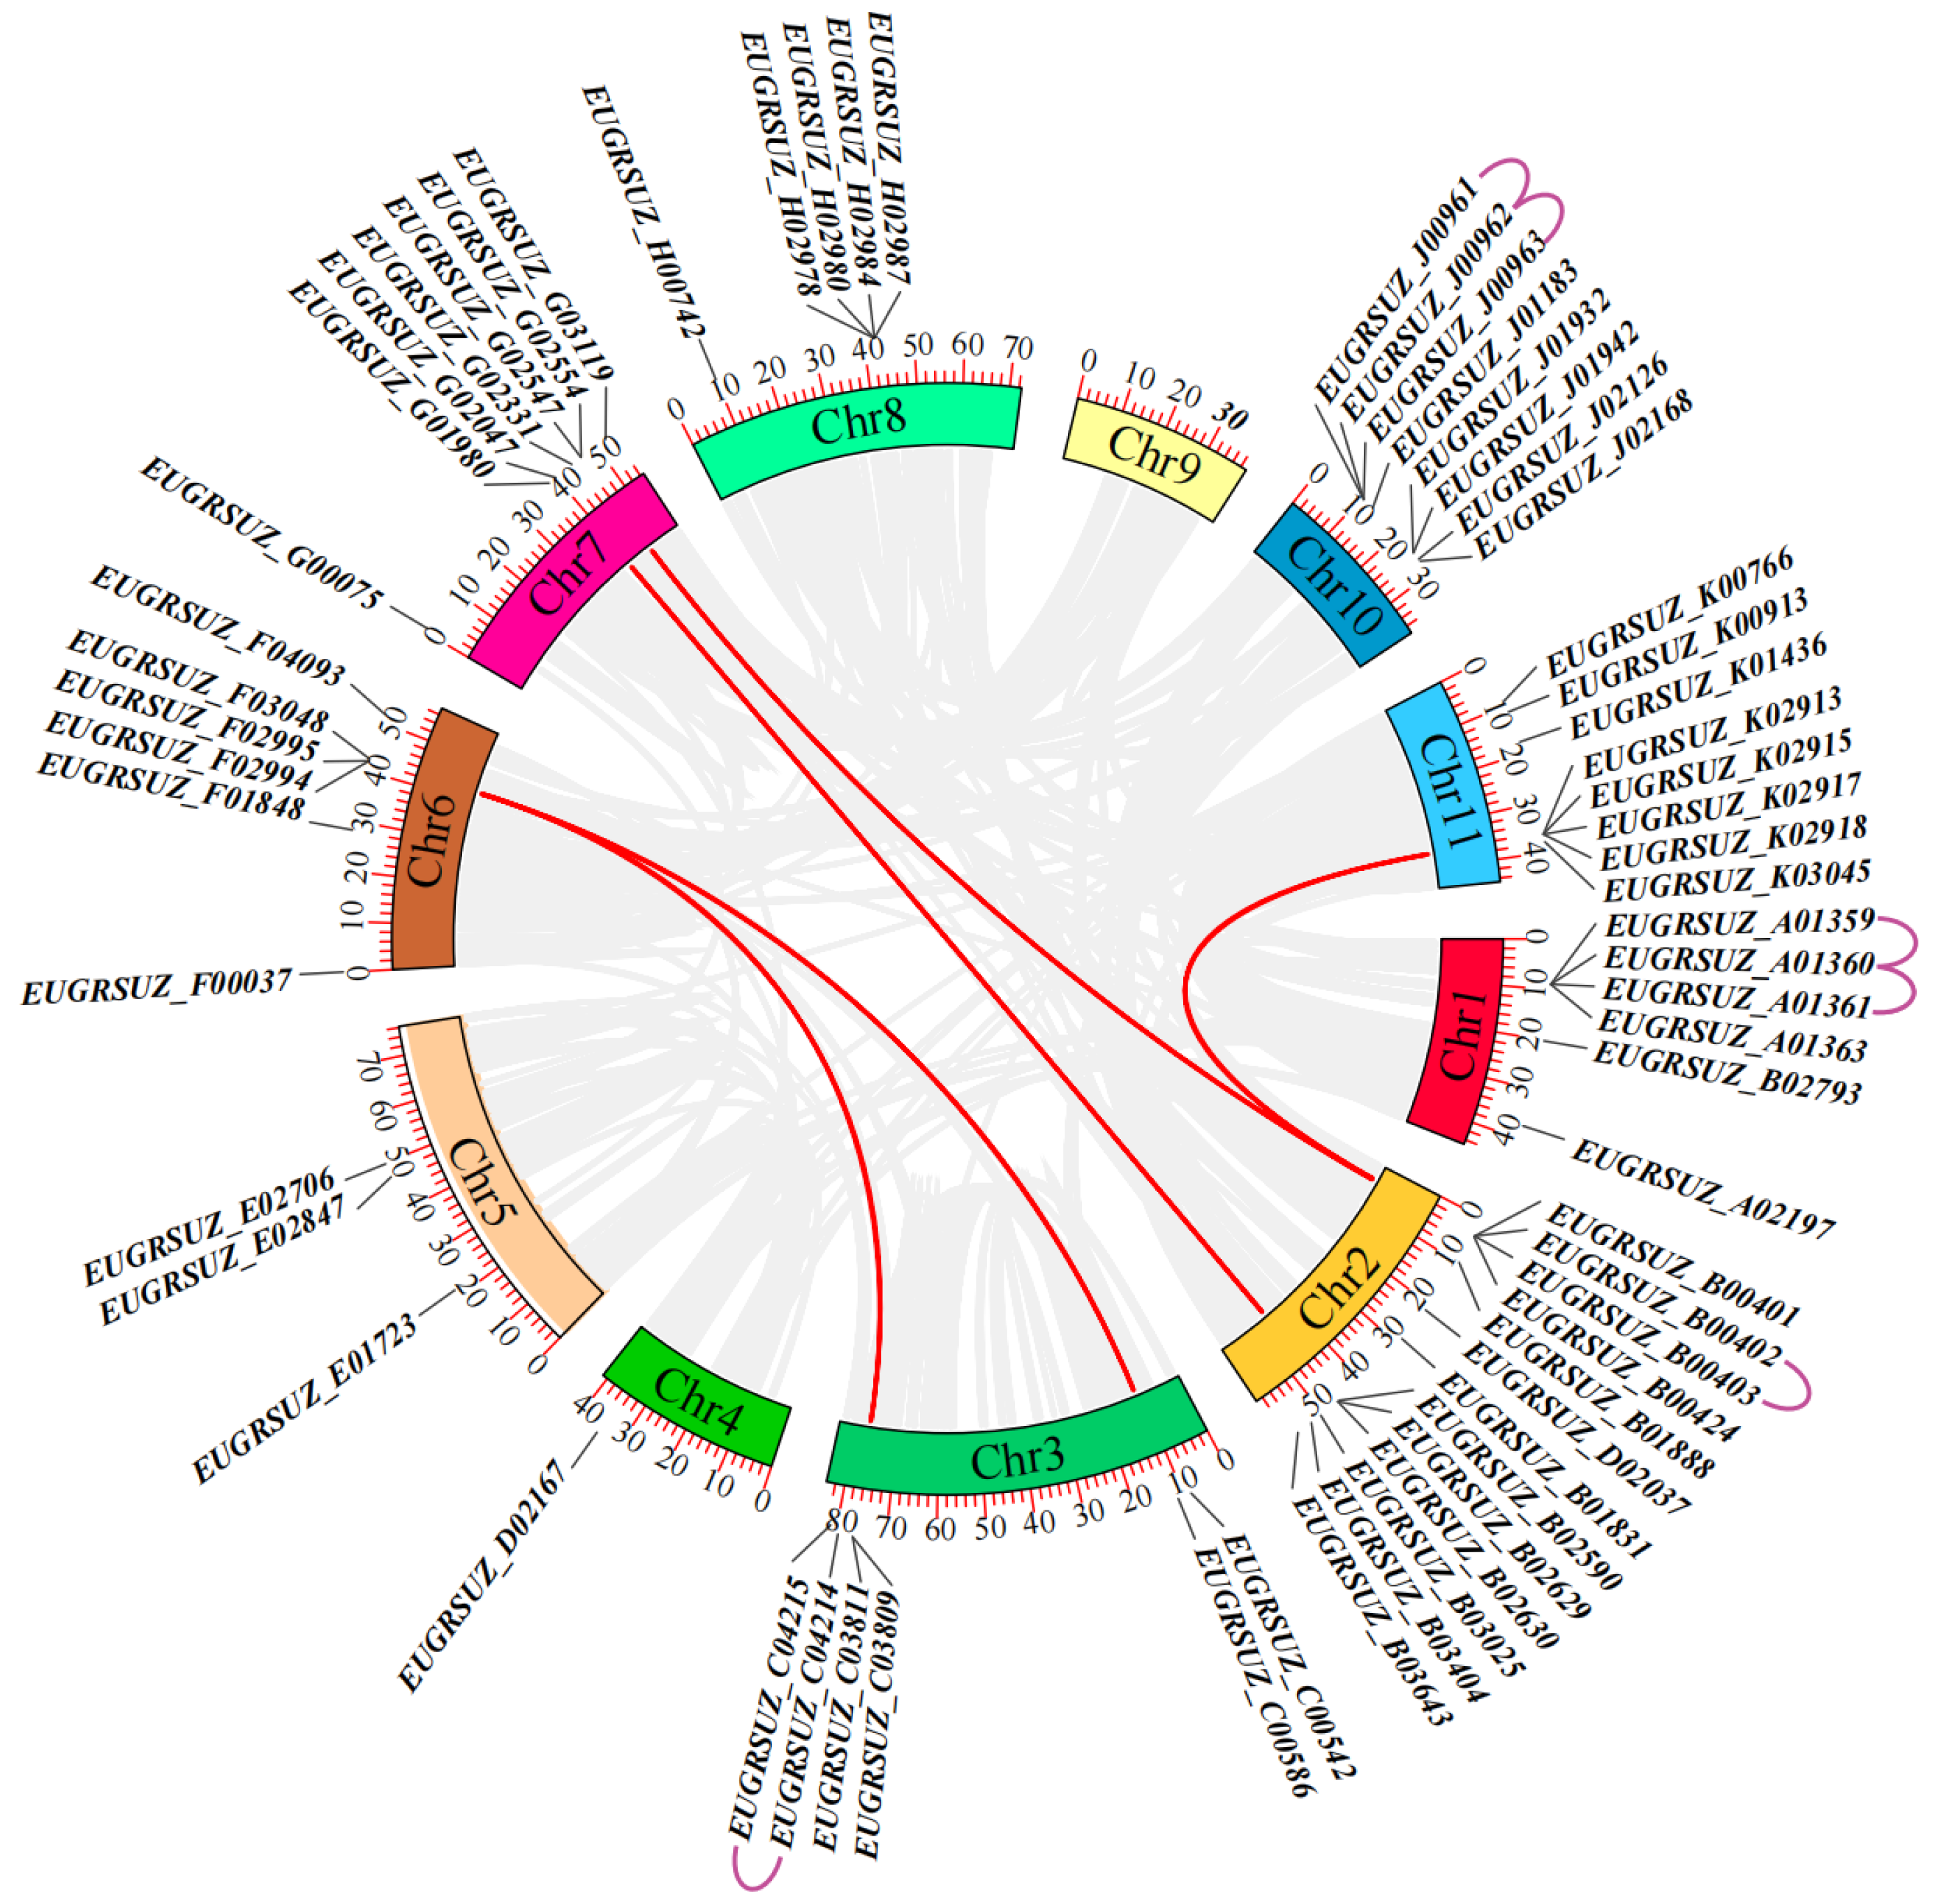
3.2. Chromosome Location, Gene Duplication, and Synteny Analysis of EgNPF Genes

All EgNPF genes were distributed across 10 chromosomes (Chrs), as shown in Figure 1. The highest number of EgNPF genes was found on Chr2, with a total of 13 genes. Chr10 and Chr11 each contained 8 genes, while Chr7 had 7 genes. Chr1, Chr3, Chr6, and Chr8 each had 6 genes. In contrast, the fewest EgNPF genes were located on Chr5 and Chr4, with only 3 and 1 gene(s), respectively (Figure 1). Additionally, we identified five pairs of segmental duplicated genes and six pairs of tandem duplicated genes among EgNPF genes in E. grandis, as illustrated in Figure 2 and Table S2.
We performed a syntenic analysis across three plant species (A. thaliana, P. euphratica, and O. sativa) to investigate the evolutionary relationships of NPF genes (Figure 3). We identified 28, 51, and 14 collinear gene pairs of EgNPF genes between E. grandis and A. thaliana, E. grandis and P. euphratica, and E. grandis and O. sativa, respectively (Figure 3). Both E. grandis and P. euphratica belong to woody plants within the angiosperms; 48.44% (31) of EgNPFs showed a collinear relationship with NPFs in P. euphratica, and NPF genes in E. grandis and P. euphratica showed higher numbers of evolutionarily conserved genes than E. grandis and A. thaliana (21), and E. grandis and O. sativa (10). EUGRSUZ_B02793.1, EUGRSUZ_B00401.1, and EUGRSUZ_F03048.1 correspond to two or more collinear gene pairs in A. thaliana and P. euphratica, and it is hypothesized that these EgNPF genes may play significant roles in the evolution of the NPF gene family. Additionally, we observed five common collinear gene pairs shared among E. grandis, A. thaliana, P. euphratica, and O. sativa (Figure 3).

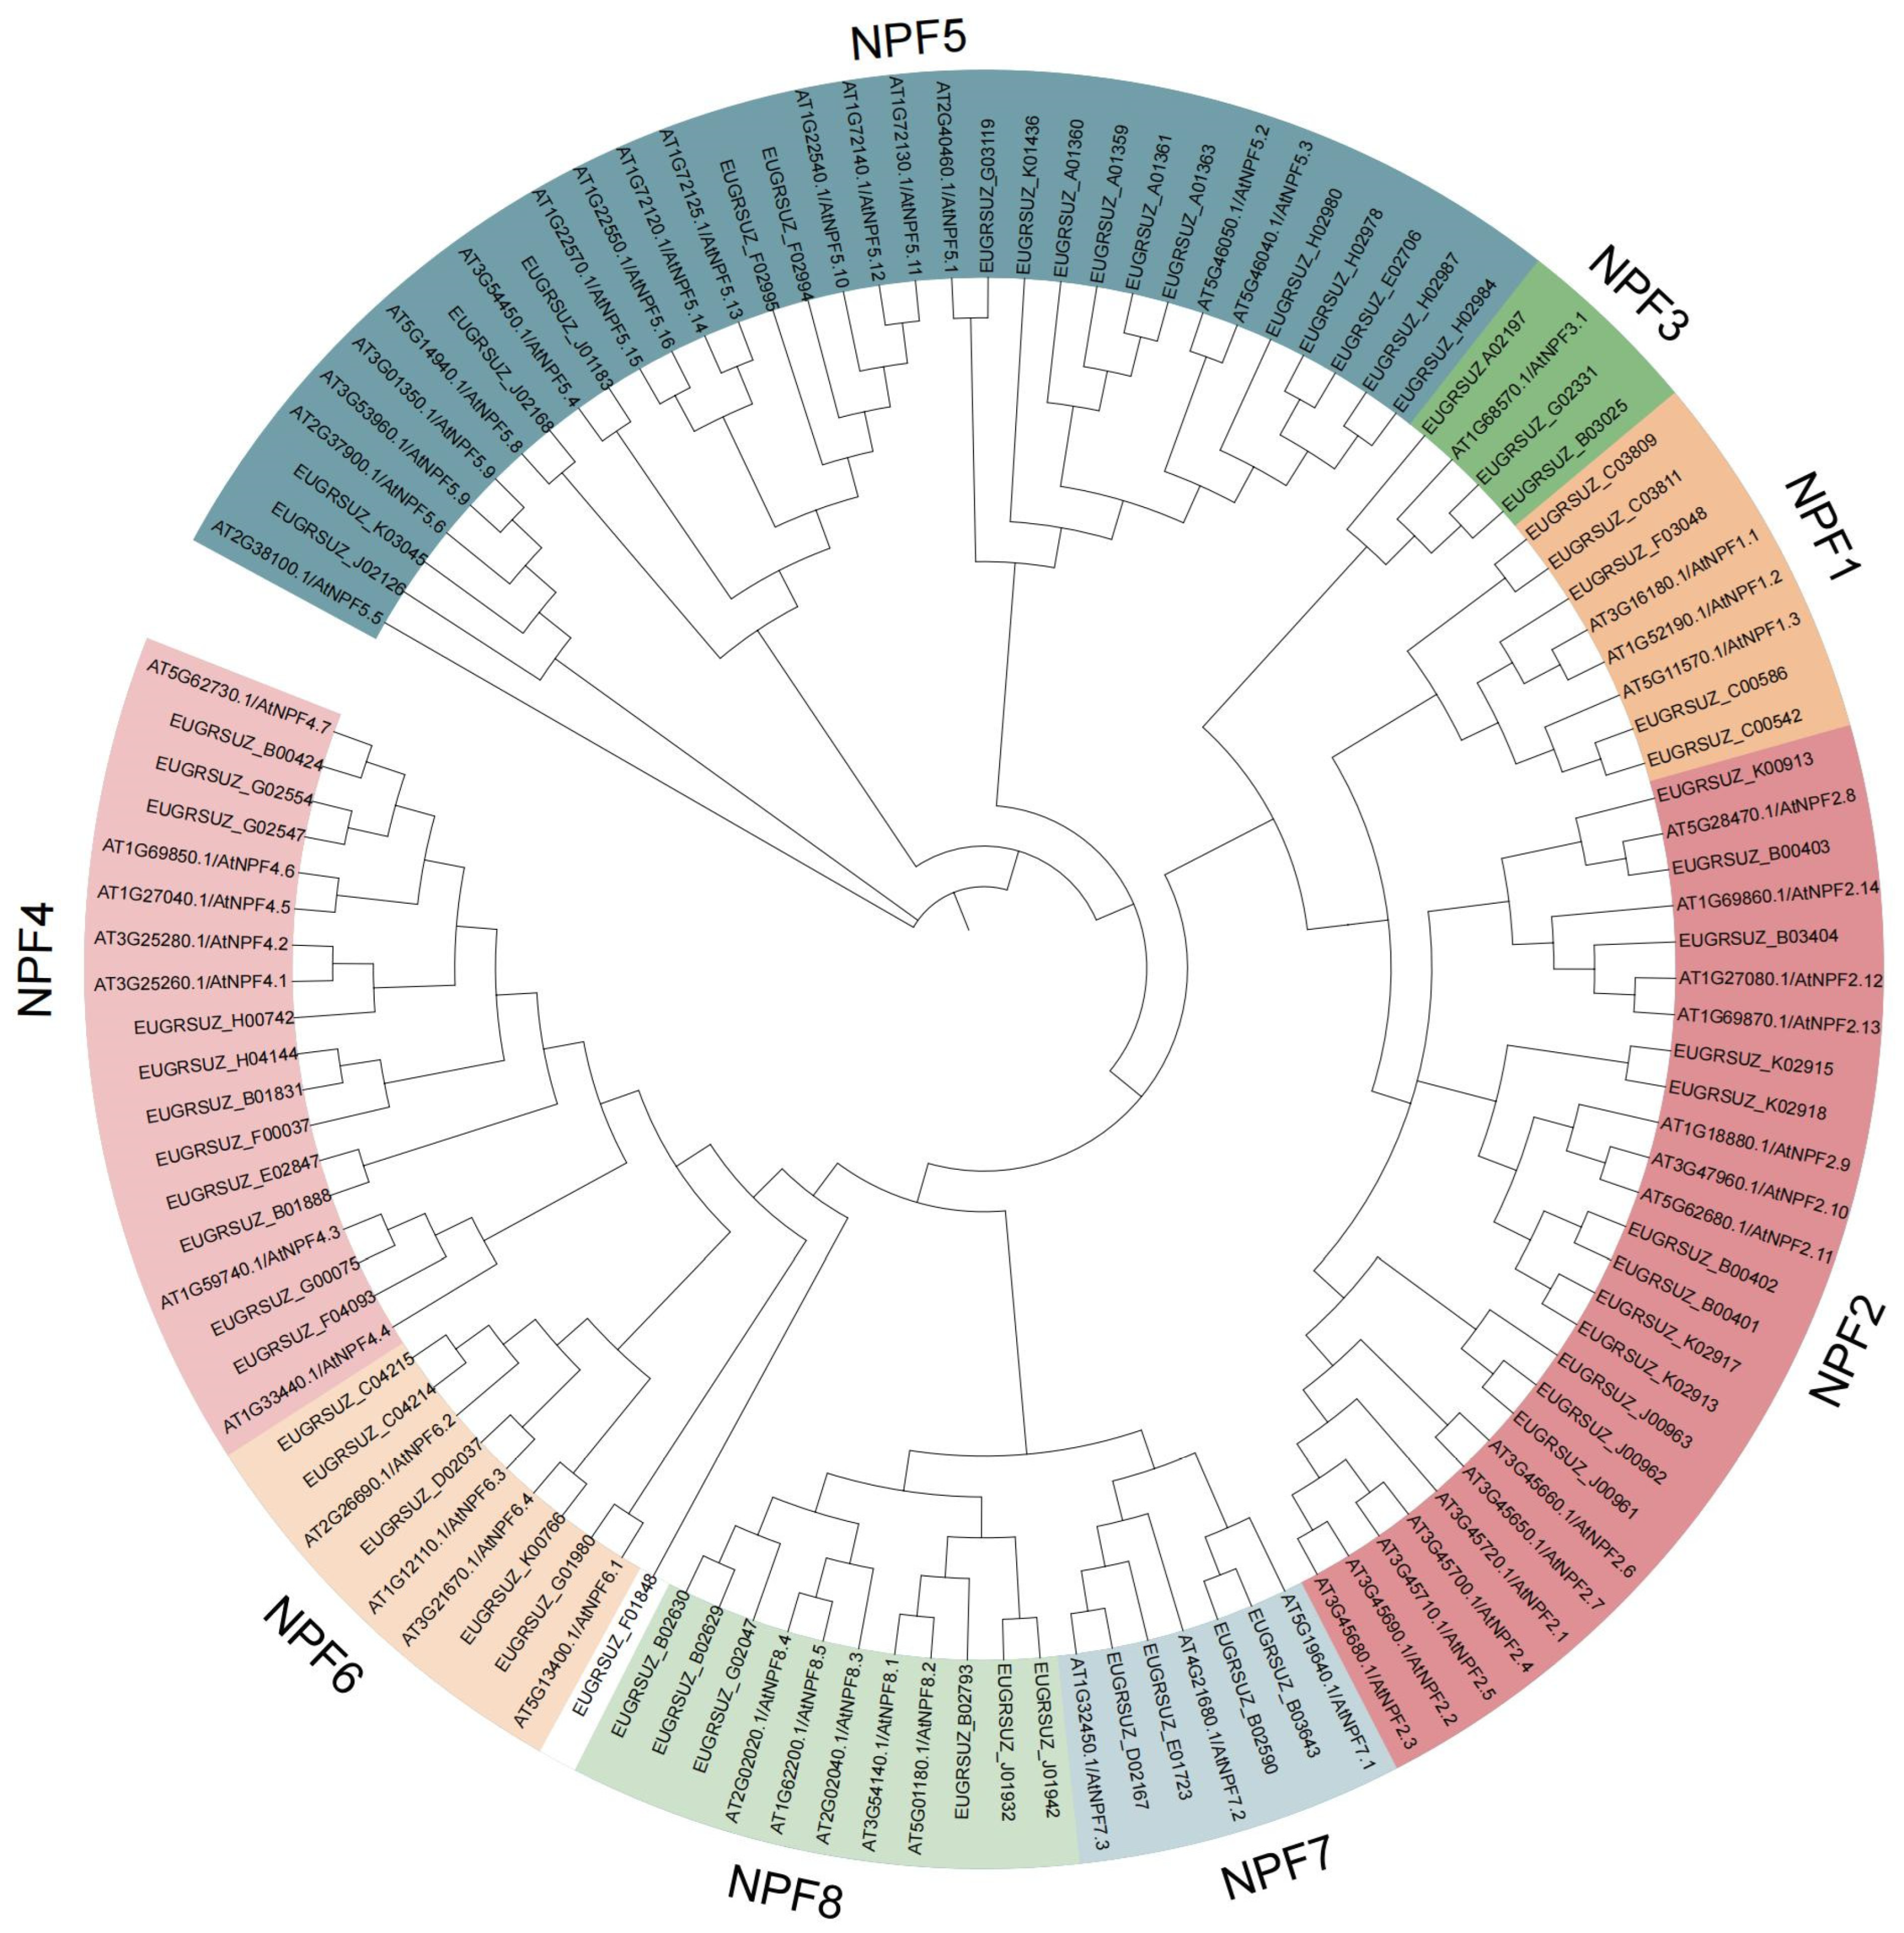
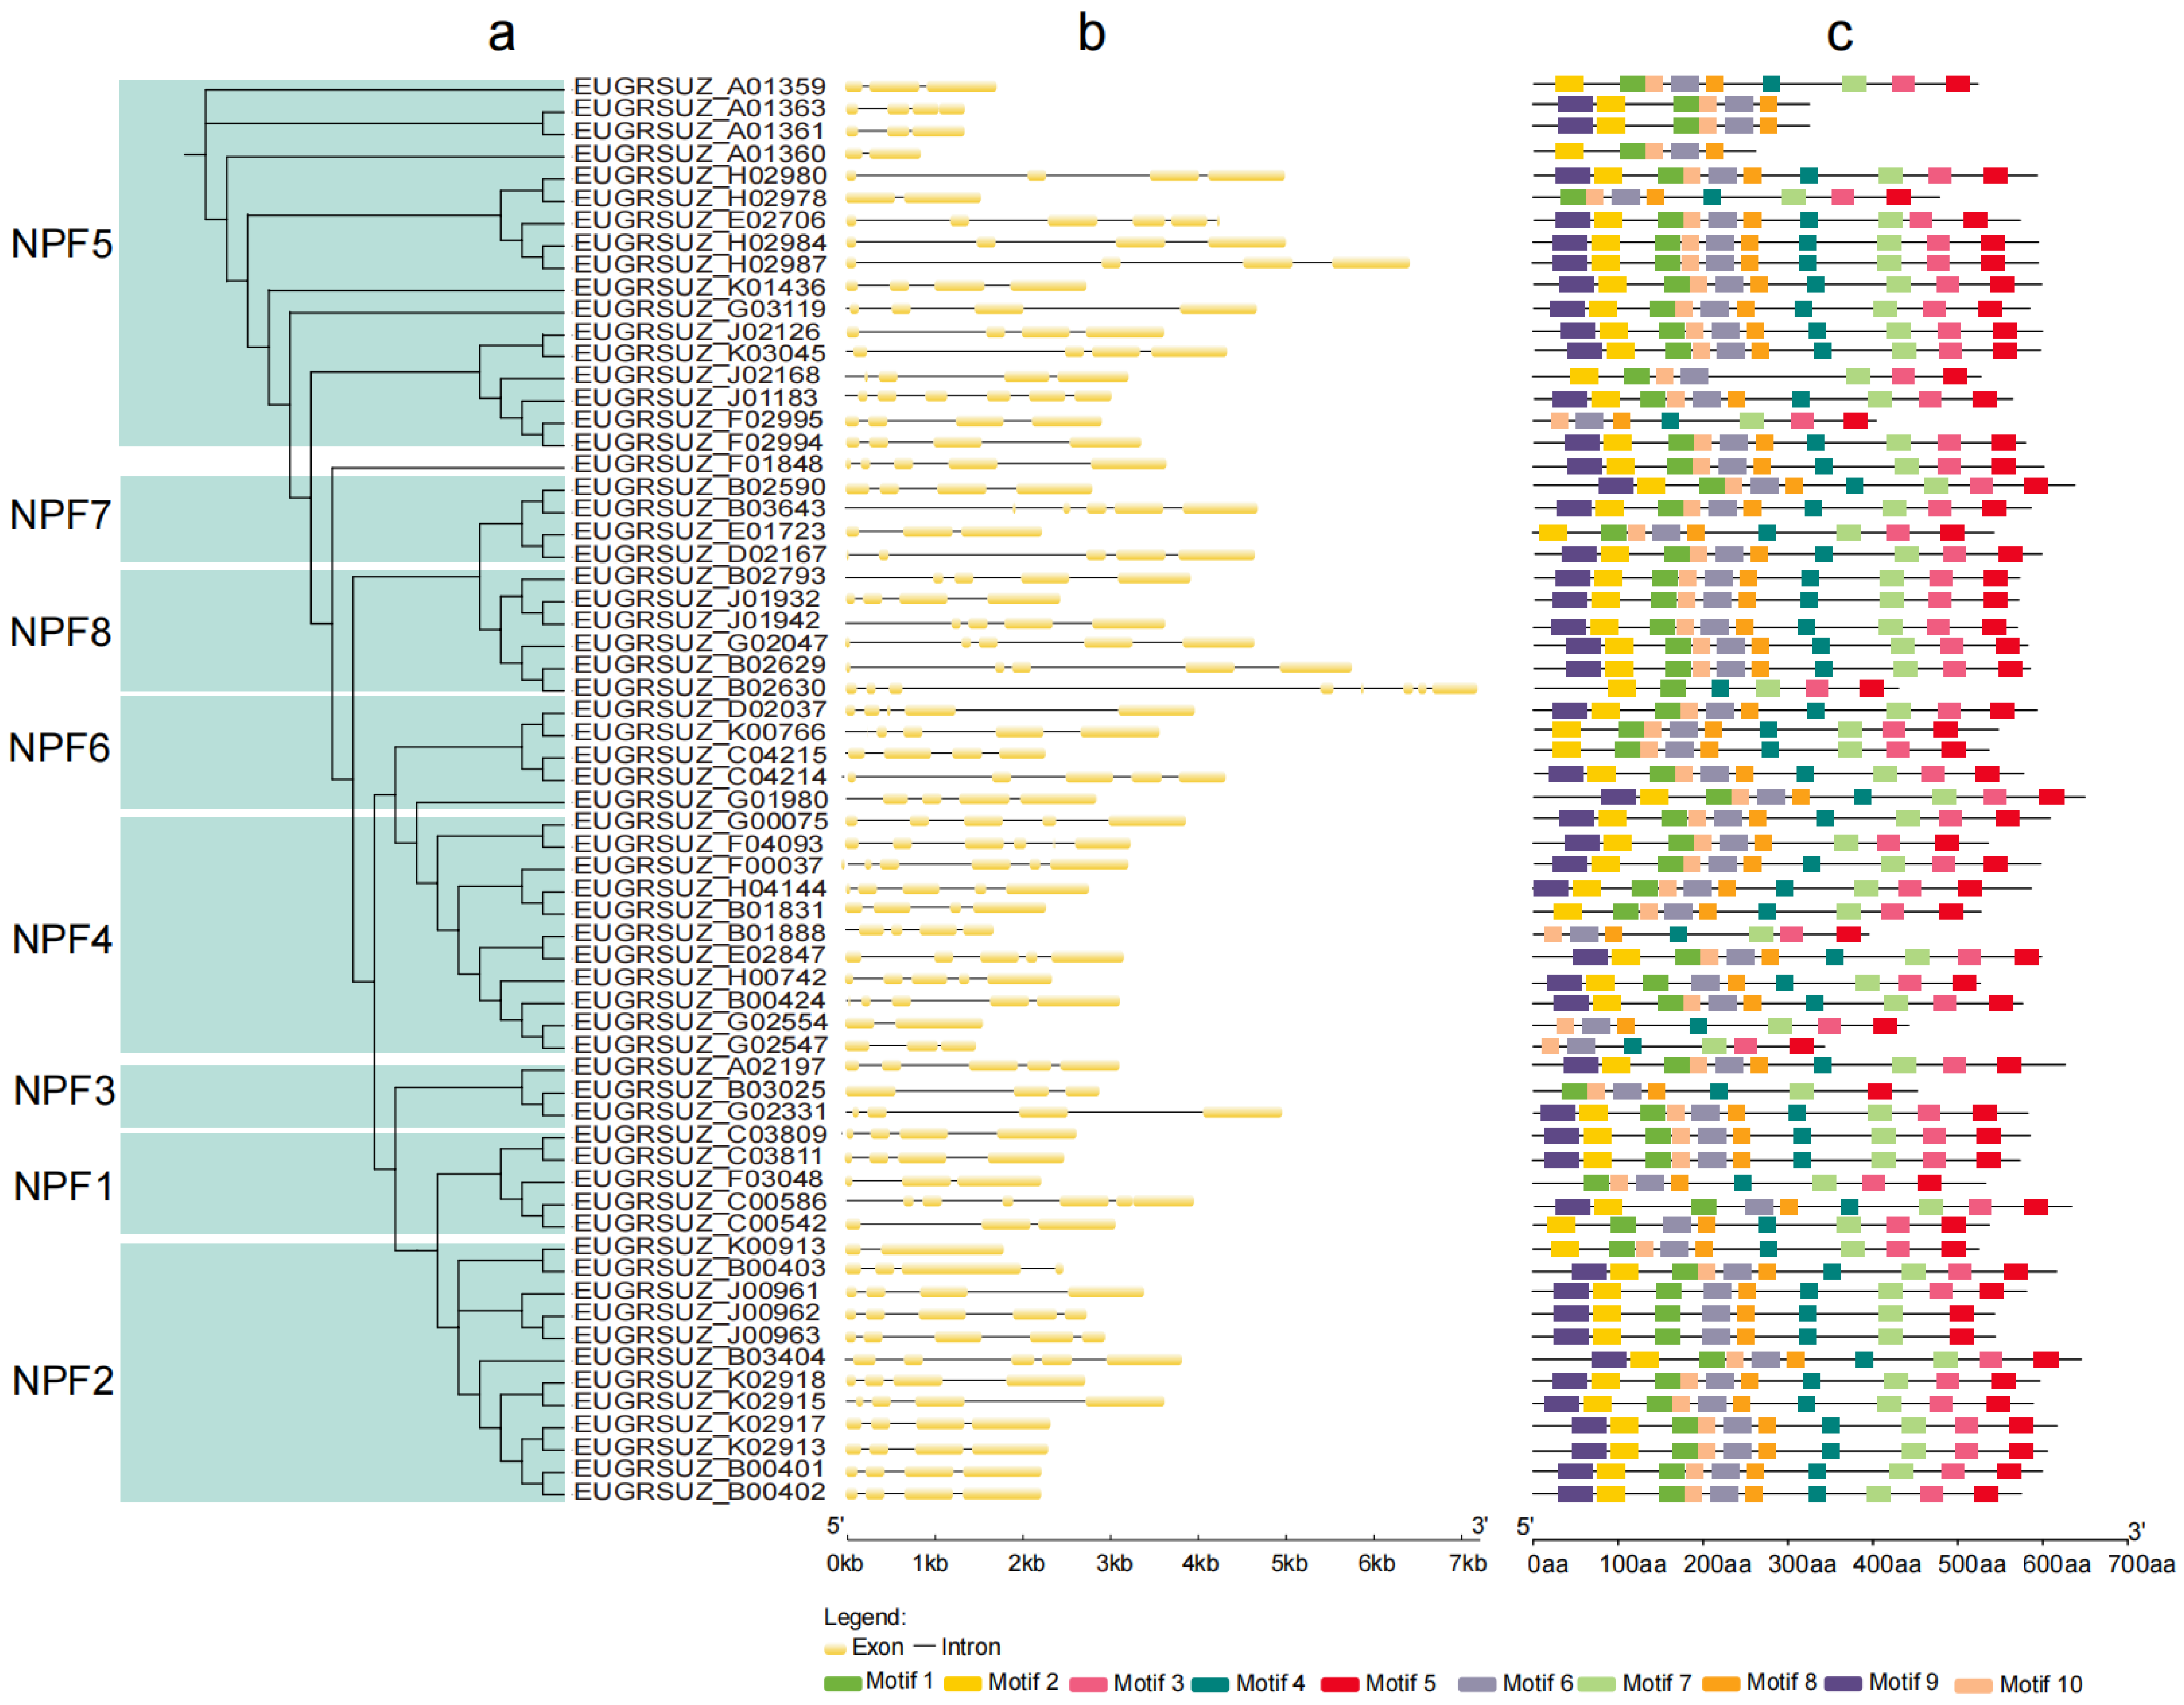
3.3. Phylogeny, Structural, and Conserved Motif Analysis of EgNPF Genes

We constructed a maximum likelihood (ML) phylogenetic tree using full-length protein sequences to explore the evolutionary relationships of EgNPF genes (Figure 4). The analysis classified the EgNPF genes into eight primary groups (Figure 4). The largest clade was NPF5, which included 17 members of the EgNPF family. Conversely, NPF3 had the fewest members, with only 3. The remaining groups were distributed as follows: NPF2 with 12 members, NPF4 with 11 members, NPF8 with 6 members, NPF6 with 5 members, and both NPF1 and NPF7 with 5 and 4 members, respectively. Notably, EUGRSUZ_F01848 did not cluster into any of the defined groups.
The gene structure of 64 EgNPF genes in E. grandis was analyzed (Figure 5). We observed considerable variation in gene structure among EgNPF members, with the exon number ranging from 2 to 8 and the gene lengths of EgNPF family gene sequences spanning from 864 (EUGRSUZ_A01360) to 9463 bp (EUGRSUZ_F02995). The majority of members had a total of 4 exons (27/42.19%) and 5 exons (18/28.13%). Many members of EgNPF within the same branch exhibited similar gene structures. For instance, the exon numbers for EgNPF members belonging to NPF6 were concentrated between 4 and 5. Additionally, EUGRSUZ_K02917, EUGRSUZ_K02913, EUGRSUZ_B00401, and EUGRSUZ_B00402 shared a similar structure, indicating potential functional redundancy among these genes. Conversely, certain genes from the same branch, like EUGRSUZ_B02630 and EUGRSUZ_B02629, exhibit structural differences, suggesting that these genes may have diverged functionally during evolution.
In the E. grandis genome, a total of 10 distinct motifs, labeled motif1 through motif10, were identified within the EgNPF gene family (Figure 5c). Of the 64 EgNPF genes, 42 contained at least 6 key motifs (motif 1, motif 2, motif 6, motif 8, motif 9, and motif 10). Members of NPF8 (except EUGRSUZ_B02630) shared a complete set of motifs (motif 1–motif10). The consistent motif patterns across most EgNPF proteins suggested a conserved structure.

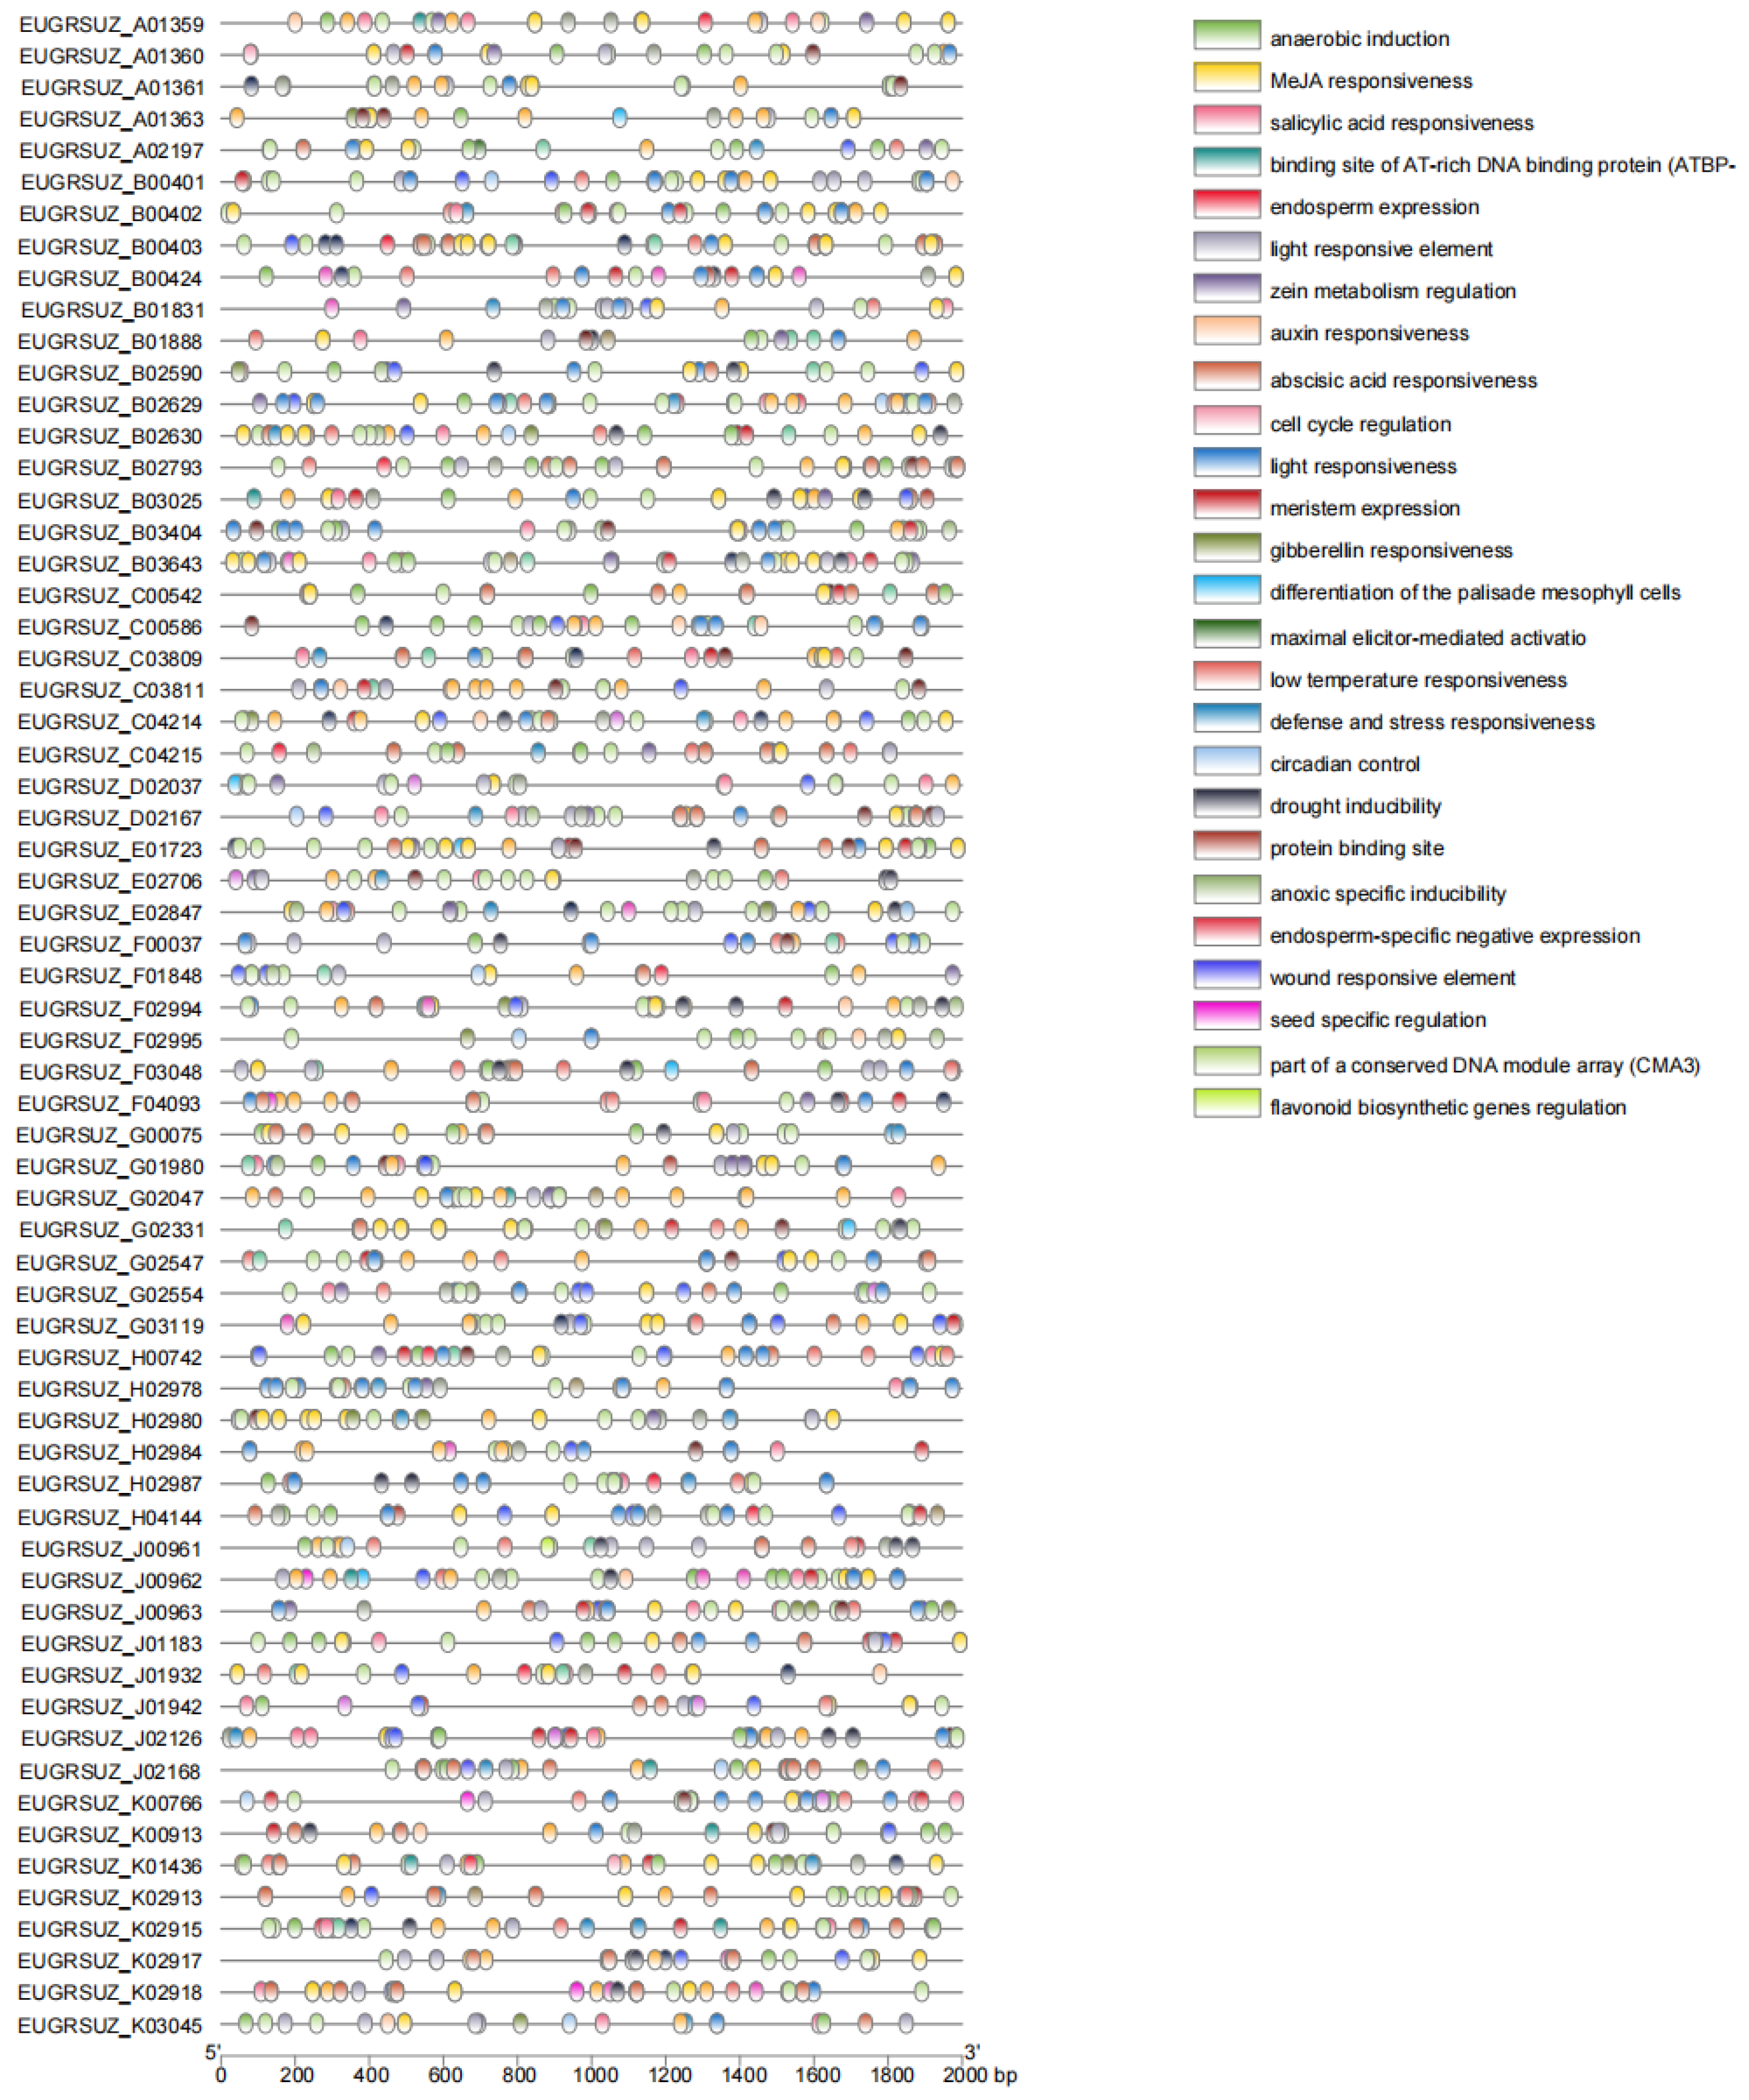
3.4. Promoter Region Analysis of EgNPF Genes

To identify cis-acting elements involved in N absorption and transport, we analyzed the promoter sequences of EgNPF genes in E. grandis (Figure 6). Our analysis revealed that most EgNPF gene promoters included cis-acting elements associated with light responsive element (64), MeJA responsiveness (60), anaerobic induction (48), gibberellin responsiveness (46), low-temperature responsiveness (38), auxin responsiveness (37), and salicylic acid responsiveness (35), indicating their role in regulating plant growth, development, and responding to various stresses and phytohormones. In contrast, a limited number of cis-elements, such as CMA3, seed-specific regulation, wound-responsive element, flavonoid biosynthetic gene regulation, and endosperm-specific negative expression, were found in the promoters of a minority of members (fewer than 5). These findings offered valuable insights into the regulatory mechanisms governing the EgNPF gene family under stress conditions and during plant growth and development.

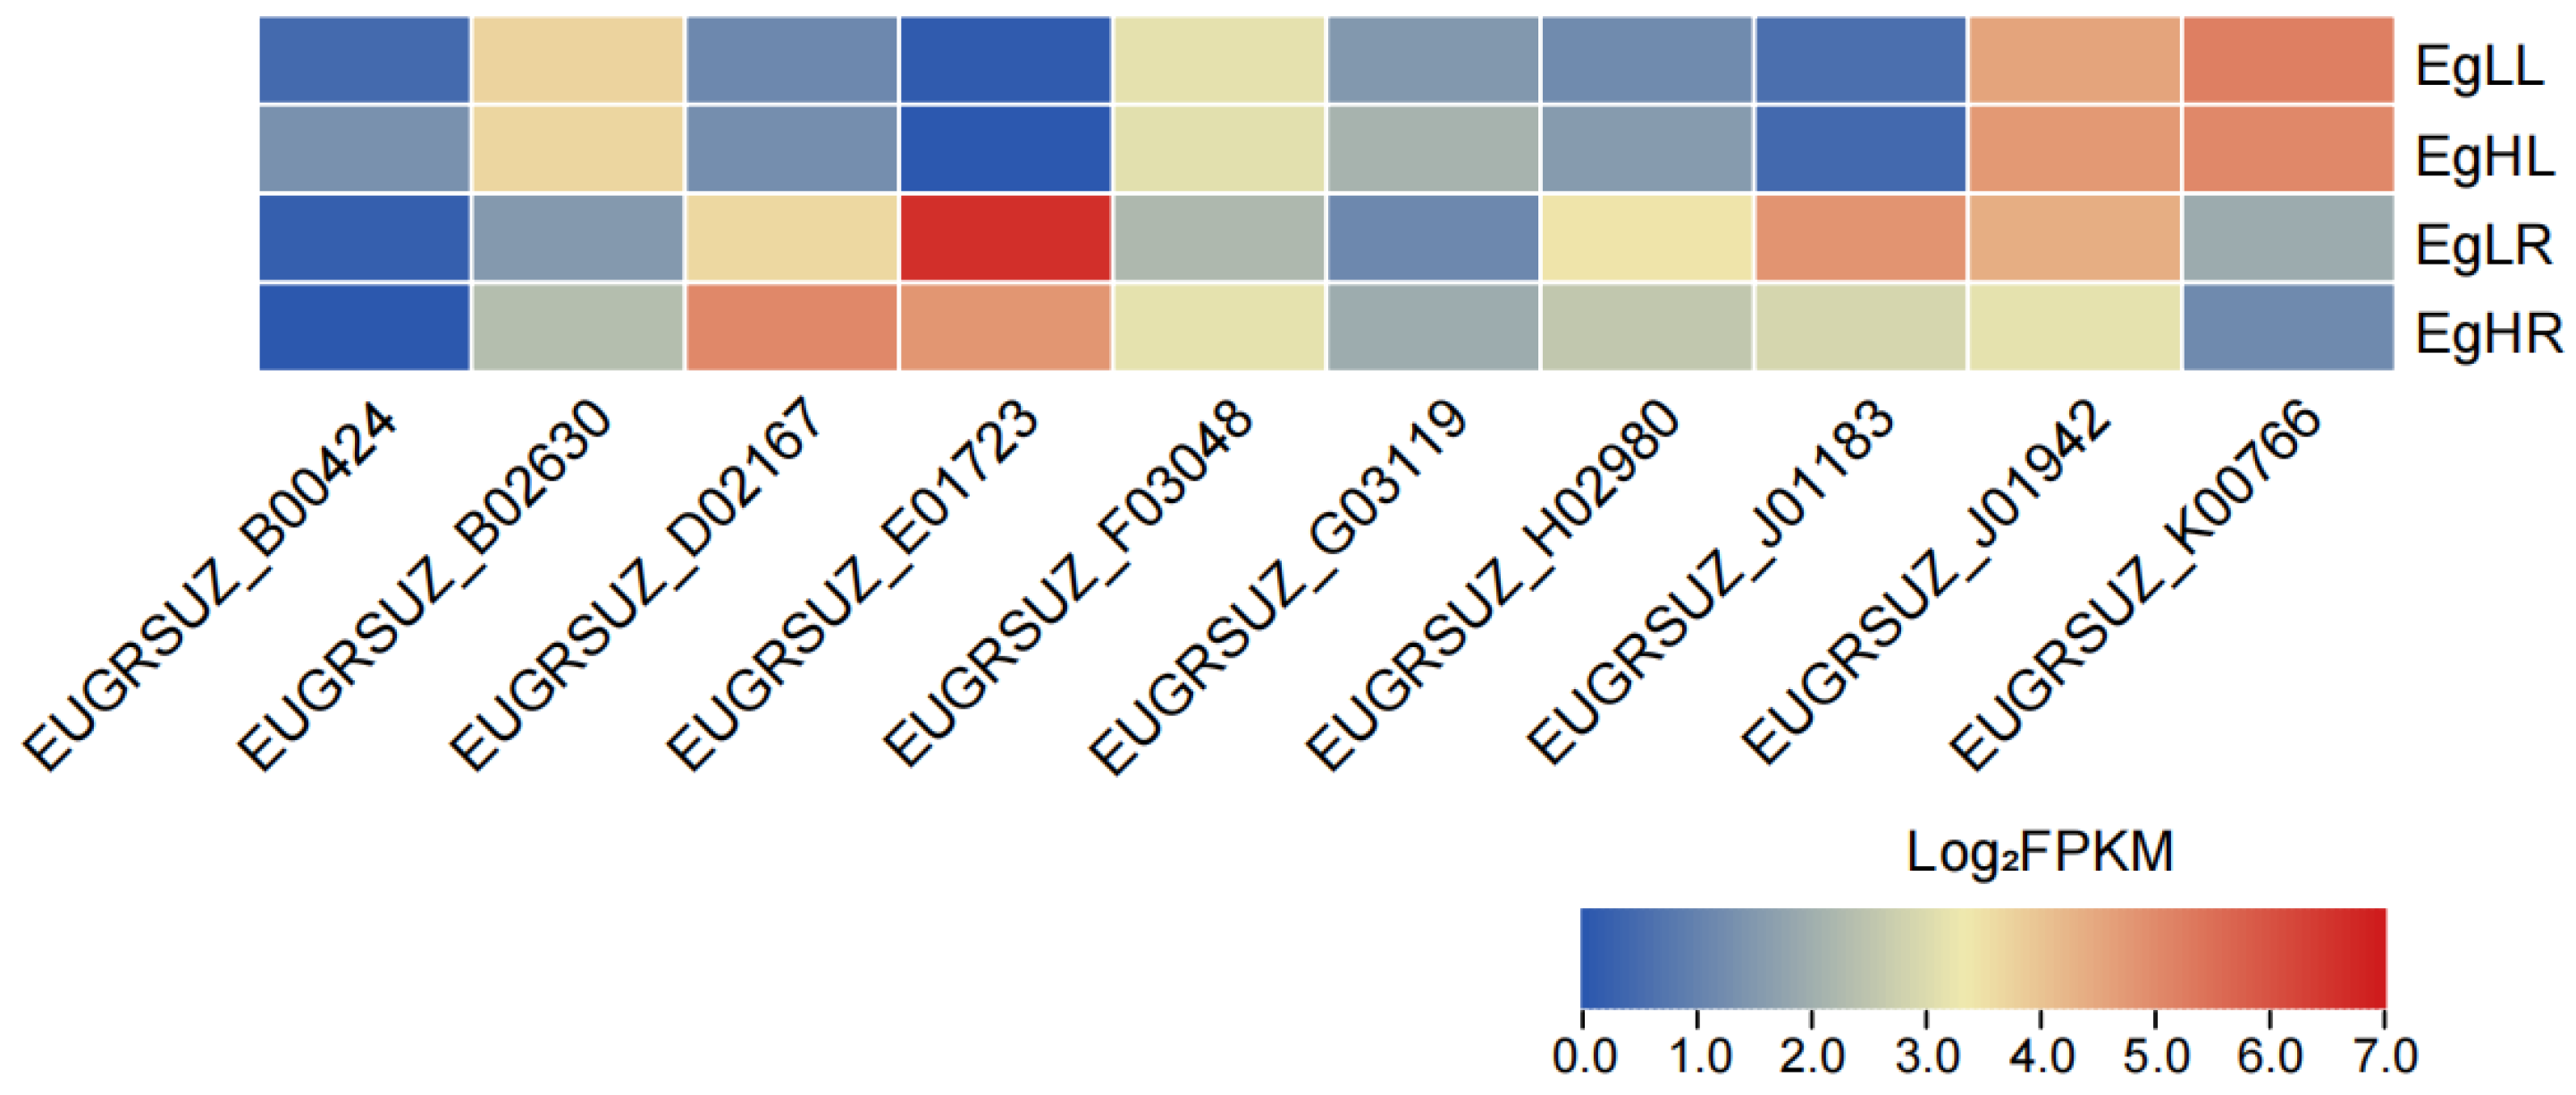
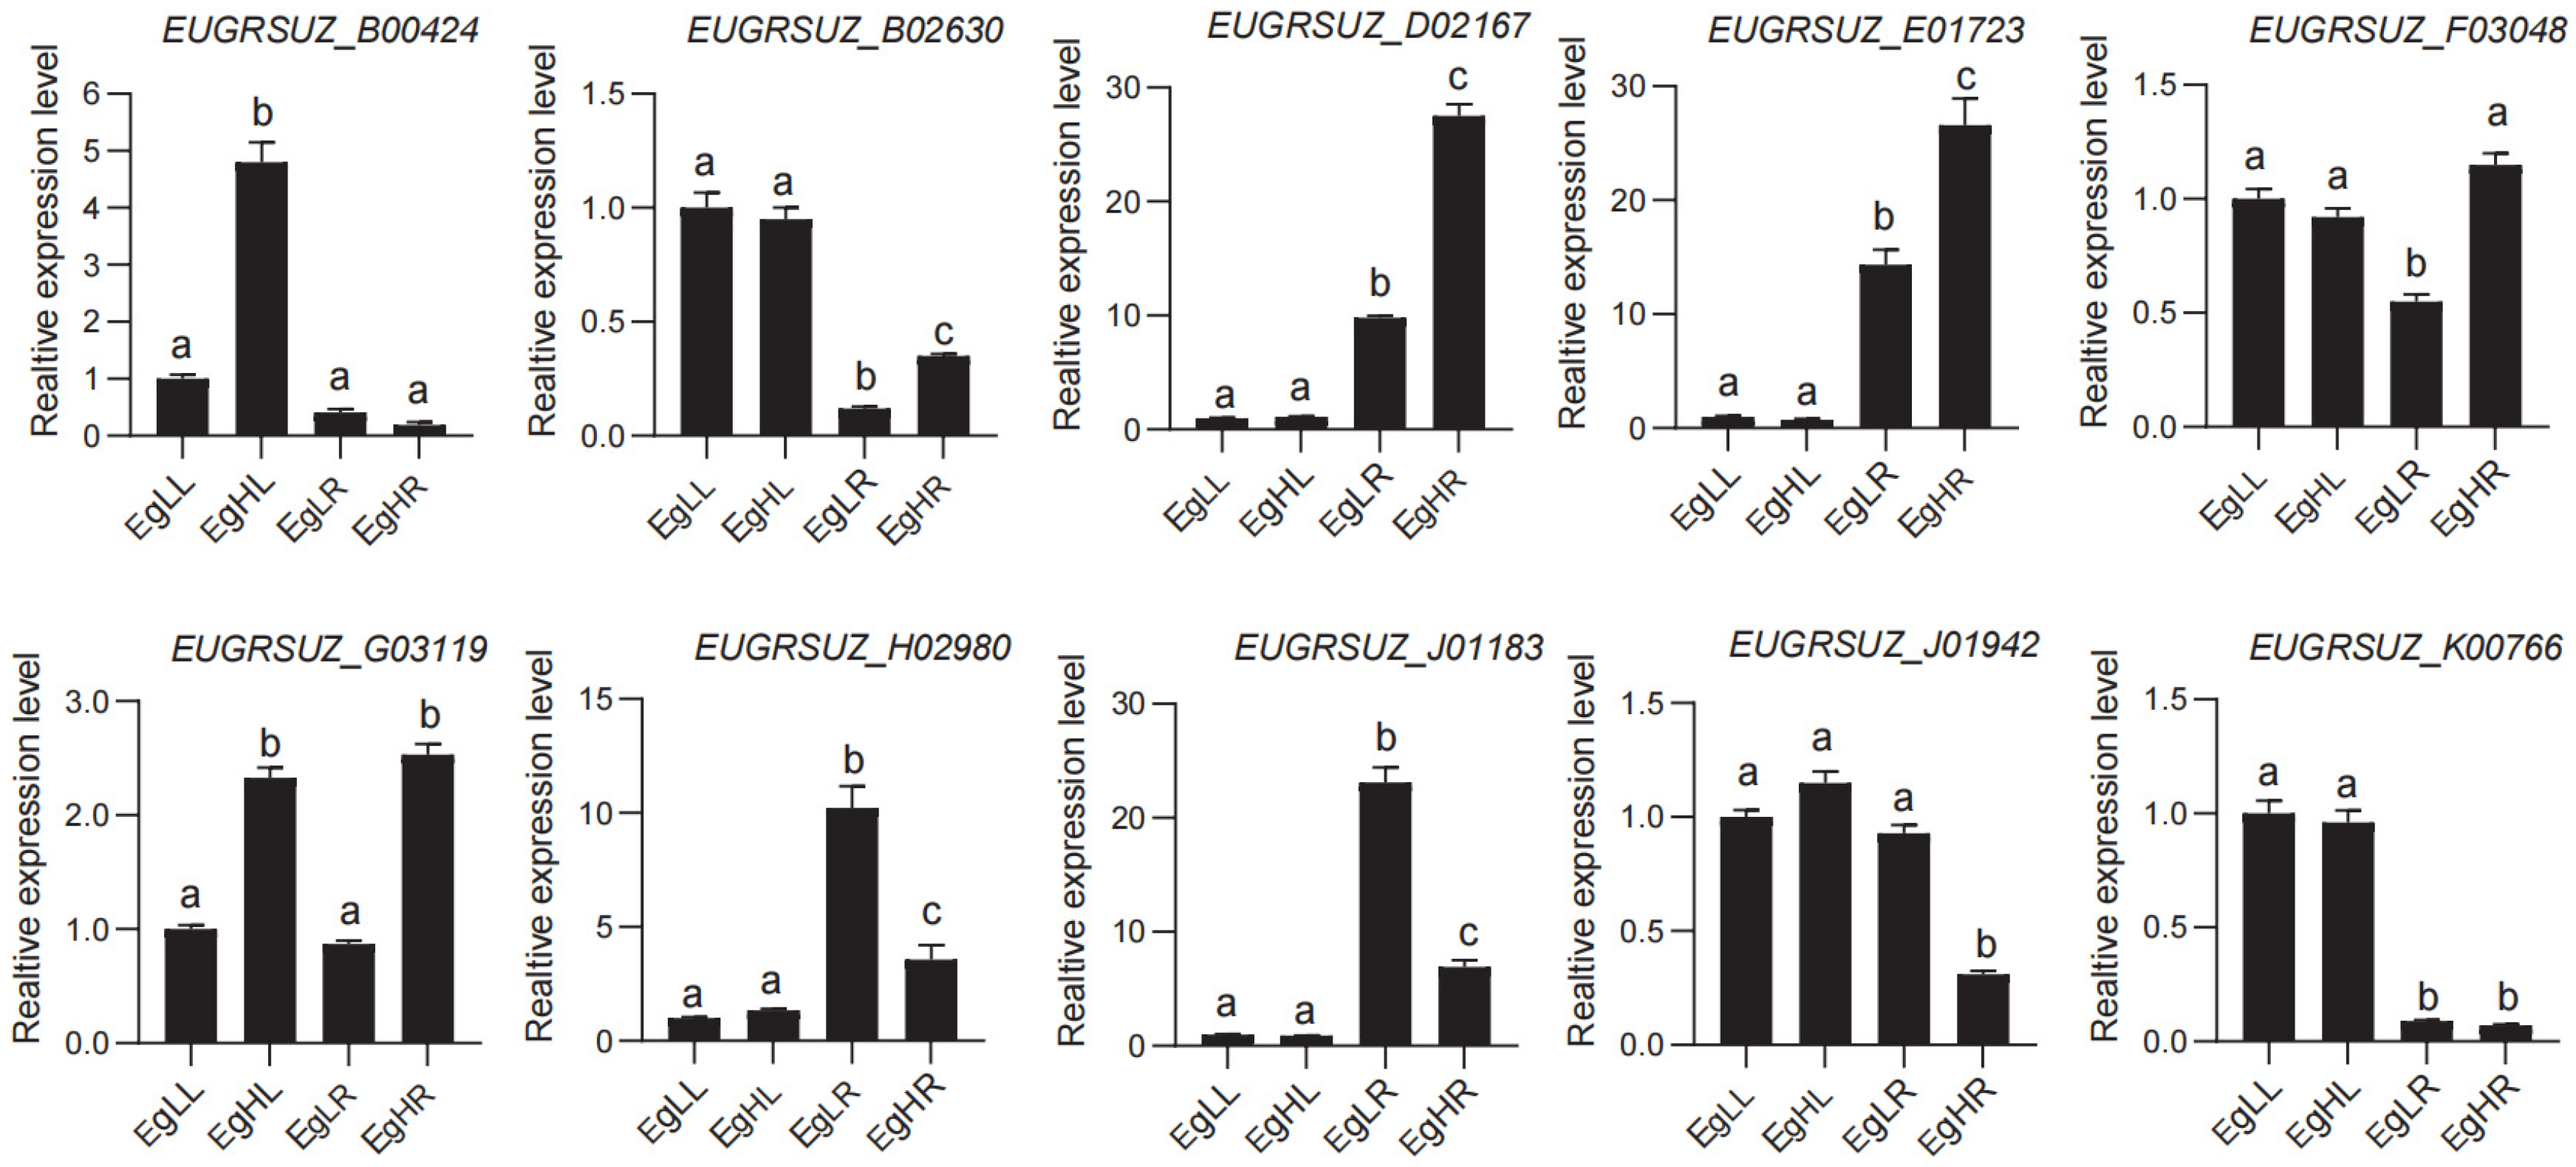
3.5. Expression Profiles of EgNPF Genes under Different N Supply Conditions

To investigate the potential functions of EgNPF genes in E. grandis under low and high N supply, RNA-seq was conducted using the Illumina HiSeqTM2000 system. Transcriptome profiling was performed on leaves and roots subjected to both low- and high N conditions. A total of over 76 Gb of clean data were acquired from 12 samples. The number of clean reads ranged from 19,541,802 to 24,549,274, with an average of 21,337,269 reads and an average Q30 value of 96.30%, indicating high read quality. Following alignment with the E. grandis genome, more than 90% of the clean reads were successfully mapped to the genome, with paired-end reads aligning to 46,274 annotated gene models in E. grandis.
A pairwise comparison between EgLL and EgHL samples identified 347 differentially expressed genes (DEGs). Of these, 307 genes were up-regulated and 40 genes were down-regulated in EgHL compared to EgLL. In the comparison between EgLR and EgHR, a total of 4812 DEGs were identified, including 2726 up-regulated and 2086 down-regulated genes. Aiming to discover the potential roles of EgNPF genes in E. grandis under low and high N supply, we investigated a total of 10 differentially expressed EgNPF genes and constructed a heatmap using the fragments per kilobase of transcript sequence per million base pair fragment (FPKM) values of these genes (Figure 7). Among 10 EgNPF DEGs, two genes (EUGRSUZ_B00424 and EUGRSUZ_G03119) exhibited elevated expression levels in EgHL compared to EgLL (Figure 7). Additionally, four EgNPFs (EUGRSUZ_B02630, EUGRSUZ_D02167, EUGRSUZ_F03048, and EUGRSUZ_G03119) were significantly up-regulated in EgLR compared to EgHR, and five EgNPFs (EUGRSUZ_E01723, EUGRSUZ_H02980, EUGRSUZ_J01183, EUGRSUZ_J01942, and EUGRSUZ_K00766) were down-regulated in EgLR compared to EgHR (Figure 7). Interestingly, EUGRSUZ_G03119 was identified as the homologous gene (AtNPF5.1) of A. thaliana (Figure 4), which was the only gene that was differentially expressed in both the EgLR vs. EgHR and EgLL vs. EgHL comparisons, and up-regulated in both EgHL and EgHR compared to EgLL and EgLR, respectively. These findings suggest that 10 differentially expressed EgNPF genes, especially EUGRSUZ_G03119, may play a pivotal role in E. grandis’ NO3 transport and N distribution process.
To verify the reliability of transcriptome data, the expression pattern of 10 EgNPF genes, namely, EUGRSUZ_B00424, EUGRSUZ_B02630, EUGRSUZ_D02167, EUGRSUZ_F03048, EUGRSUZ_G03119, EUGRSUZ_E01723, EUGRSUZ_H02980, EUGRSUZ_J01183, EUGRSUZ_J01942, and EUGRSUZ_K00766, were evaluated by qRT-PCR analysis. The results discovered that the relative expressions of the selected genes were in accordance with the FPKM values obtained from RNA-seq (Figure 8), validating the accuracy of our transcriptomic data in reflecting the expression profiles.

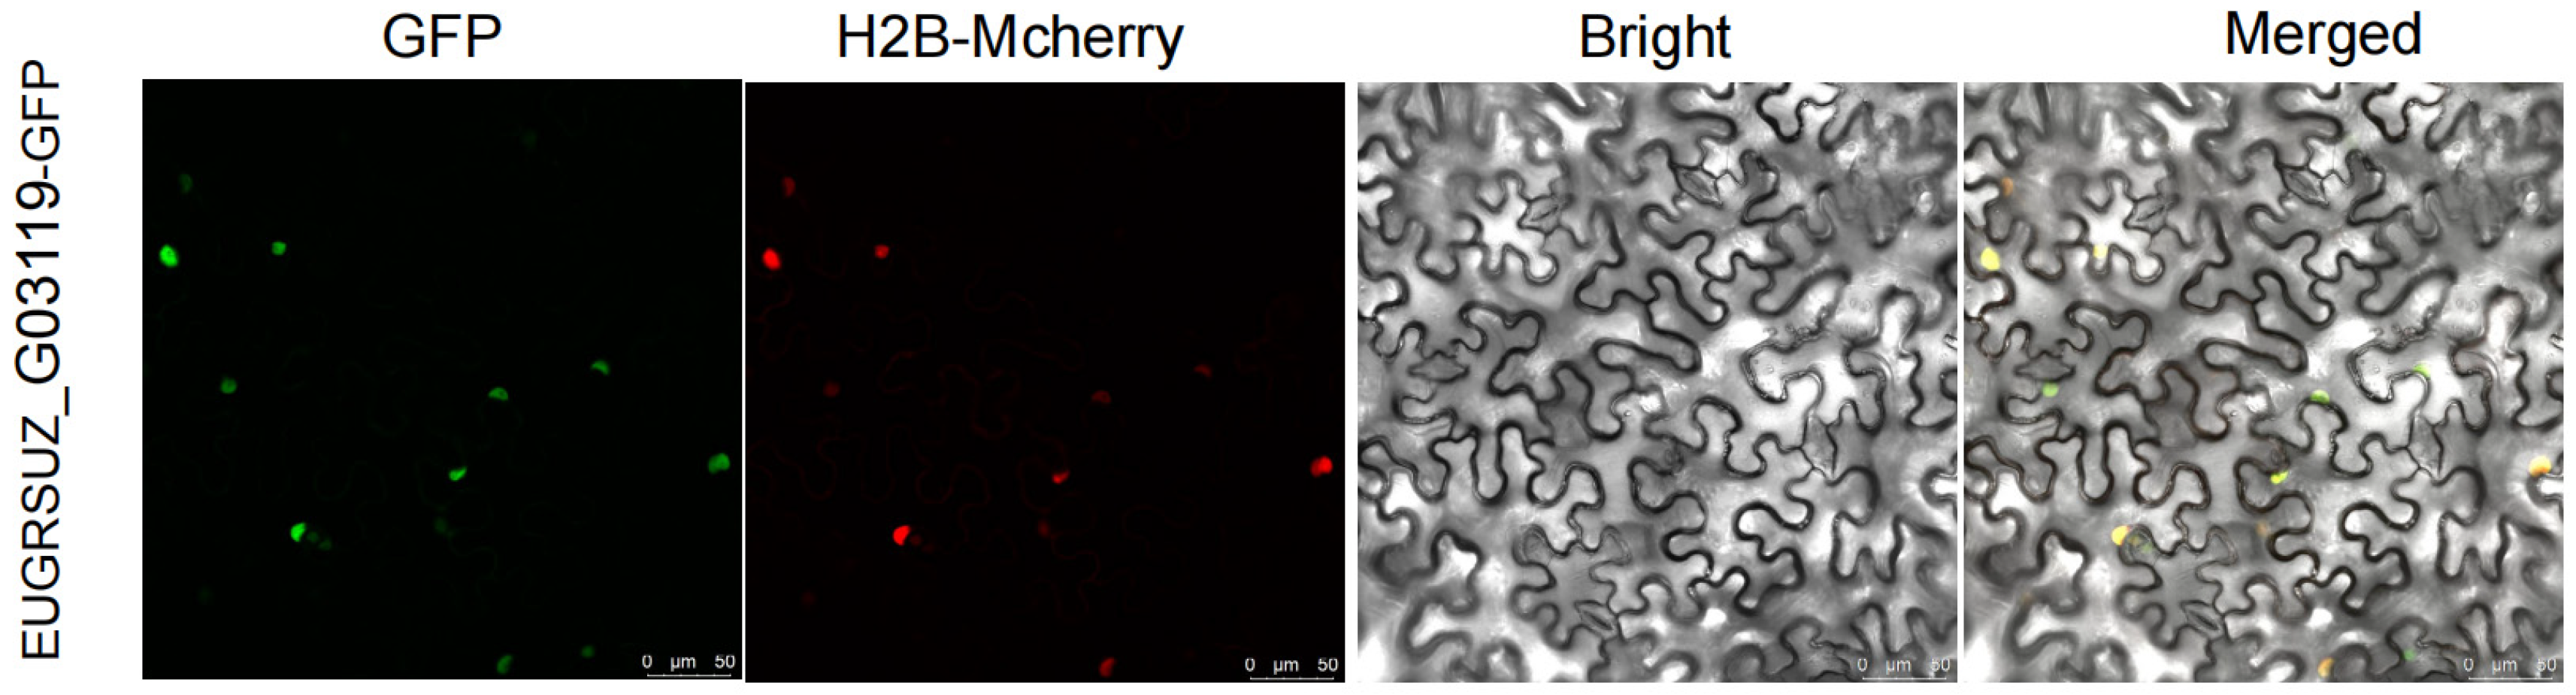
3.6. Subcellular Localization of EUGRSUZ_G03119

To investigate the subcellular localization of the EUGRSUZ_G03119 protein, vectors expressing EUGRSUZ_G03119 fused to GFP were constructed and used for a transient expression assay in N. benthamiana leaf cells. The EUGRSUZ_G03119-GFP fusion protein exclusively co-localized with H2B-mCherry in the nuclei (Figure 9), indicating that EUGRSUZ_G03119 is a nuclear protein, consistent with its potential function as a transcriptional regulator.

4. Discussion

4.1. Identification of NPF Genes in E. grandis

NPF genes play a critical role in the absorption and transport of nitrate within plants, are fundamental to the growth and development of plants, and have been identified in numerous species. In this study, we identified 64 NPF genes in the whole E. grandis genome. The 64 identified EgNPF proteins, except EUGRSUZ_F01848, were classed into 8 groups, broadly consistent with the classification and identification results in A. thaliana [7]. Specifically, we found that the numbers of EgNPF members (NPF1: 5, NPF2: 12, NPF3: 3, NPF4: 11, NPF5: 17, NPF6: 5, NPF7: 4, and NPF8: 6), except NPF2, were more than the number of AtNPF members (NPF1: 3, NPF2: 14, NPF3: 1, NPF4: 7, NPF5: 16, NPF6: 4, NPF7: 3, and NPF8: 5) in A. thaliana (Figure 4). Nonetheless, the number of NPF family members differs significantly across species, such as 54 members in Cucumis sativus [33], 193 members in Brassica napus [34], 143 members in Nicotiana tabacum [35], and 92 members in Setaria italica [36]. The number of EgNPF family members in E. grandis was relatively small compared to the above B. napus, N. tabacum, and S. italica, indicating the contraction of the NPF family during evolution. This contraction may be associated with species-specific adaptations, as E. grandis might not require as many NPF genes for N transport. Additionally, the genome of E. grandis (691.27 Mb) was considerably larger than that of A. thaliana (119.67 Mb) [37], suggesting that there was no strong correlation between genome size and the number of NPF members. In summary, when comparing NPF gene counts across different plants, substantial variation among species is evident. Several NPF genes were highly conserved in A. thaliana and E. grandis during evolution, indicating that the functions of these genes are relatively well conserved.

4.2. Chromosome Location, Duplication Events, and Synteny Relationships of EgNPF Genes

The distribution of EgNPF genes across 10 chromosomes in E. grandis showed an uneven pattern, with Chr2 containing the most genes (13), while Chr4 had the fewest (1). This uneven distribution suggests that certain chromosomes, like Chr2, may have undergone more duplication events or play a key role in important functions. Understanding this distribution aids in identifying genomic regions that contribute to traits like nutrient transport or stress tolerance, which can be valuable for the breeding or genetic improvement of E. grandis.
Segmental duplications contribute to genome expansion, while tandem duplications may drive functional diversification [38]. In this study, the identification of five segmental and six tandem duplicated EgNPF gene pairs in E. grandis underscored the role of gene duplication in expanding the NPF gene family. These events likely played a key role in the evolution and adaptation of E. grandis.
The syntenic analysis revealed that E. grandis shares 51 collinear EgNPF gene pairs with P. euphratica, significantly more than with A. thaliana (28) and O. sativa (14), indicating greater evolutionary conservation between the two woody angiosperms. Notably, genes like EUGRSUZ_B02793.1 and EUGRSUZ_B00401.1, which appear in multiple collinear pairs, likely played key roles in NPF gene family evolution. Additionally, five common collinear gene pairs shared across all species suggest that certain NPF genes have been conserved throughout angiosperm evolution, potentially due to their essential functions in plant development and adaptation.

4.3. Phylogenetic Relationships, Structural Comparison, and Conserved Motifs of EgNPF Genes

Many EgNPF members in the same group (NPF1, NPF2, NPF3, NPF4, and NPF6) exhibited slight variations in terms of exon length and number. Conversely, there were also certain genes from the same branch (NPF5, NPF7, and NPF8) that exhibited visible structural differences. Similar results have been reported in spinach [18] and cotton [15]. These structural variations, particularly in exon length and number, may influence gene expression or protein configuration, potentially impacting the transport efficiency or substrate specificity of EgNPF genes [39]. Furthermore, while the motif compositions were consistent within groups, they differed between groups, indicating that subfamily-specific motifs could impact the functional divergence of EgNPF genes. Such differences may affect the capacity of these genes to regulate N transport. These findings are consistent with earlier research conducted on maize [40].

4.4. Promoter Region Analysis of EgNPF Genes

The promoter analysis of EgNPF genes revealed a high frequency of cis-acting elements related to light responsiveness, MeJA responsiveness, and various stress responses. These findings indicated that EgNPF genes are crucial for regulating growth, development, and stress adaptation. In contrast, elements associated with seed-specific regulation and other specialized functions are less common. These findings highlighted the diverse roles of EgNPF genes in environmental adaptation and suggested potential targets for genetic improvement to enhance stress tolerance and growth.

4.5. Expression Profiles of EgNPF Genes under Different N Supply Conditions

Ten differentially expressed EgNPF genes were identified among two comparisons (EgLR vs. EgHR and EgLL vs. EgHL). Interestingly, only EUGRSUZ_G03119 (homologous gene named AtNPF5.1 in A. thaliana), belonging to group NPF5, exhibited higher expression pattern in both two tissues (leaves and roots) under high N supply conditions than low N supply conditions. These results were consistent with previous studies suggesting that AtNPF5.1 could participate in low-affinity nitrate transmembrane transporter activity and nitrate transmembrane transport [41]. These findings highlighted the potential role of EUGRSUZ_G03119 in nitrogen uptake and distribution in E. grandis.

4.6. Subcellular Localization of EUGRSUZ_G03119

The localization study of EUGRSUZ_G03119-GFP in N. benthamiana cells showed exclusive co-localization with H2B-mCherry in the nucleus, confirming that EUGRSUZ_G03119 is a nuclear protein. This research suggested EUGRSUZ_G03119’s role as a transcriptional regulator, potentially influencing gene expression related to nitrogen transport and stress response. Understanding the nuclear function of EUGRSUZ_G03119 is crucial for targeting genetic improvements in plants for enhanced stress tolerance and growth optimization.

5. Conclusions

E. grandis is the most widely planted hardwood species in the world. The NPF gene family is the largest one and plays multifunctional roles in nitrate uptake and transport in plants. In this study, we identified 64 members of NPF gene families in E. grandis. Expression pattern analyses clearly uncovered the role of several EgNPFs, including EUGRSUZ_B00424, EUGRSUZ_G03119, EUGRSUZ_B02630, EUGRSUZ_D02167, EUGRSUZ_F03048, EUGRSUZ_G03119, EUGRSUZ_E01723, EUGRSUZ_H02980, EUGRSUZ_J01183, EUGRSUZ_J01942, and EUGRSUZ_K00766, which showed different expressions in both leaves and roots under various nitrogen conditions. Moreover, the EUGRSUZ_G03119-GFP fusion protein exclusively co-localized with H2B-mCherry in the nuclei, indicating that EUGRSUZ_G03119 is a nuclear protein. These results improve our understanding of the role of NPFs in developmental processes and in salt stress and provide a theoretical basis for further studies aimed at exploring the N absorption and distribution in E. grandis.

Supplementary Materials

The following supporting information can be downloaded at: https://www.mdpi.com/article/10.3390/f15101697/s1, Table S1. Physical and chemical properties of NPF genes in E. grandis (CDS: coding DNA sequence; PI: isoelectric point; MW: molecular weight). Table S2. Duplication events involving the NPF gene pairs in E. grandis. File S1: The primer sequence CDS and information for EUGRSUZ_G03119 gene.

Author Contributions

Conceptualization, G.L.; methodology, G.L. and J.L.; software, G.L.; validation, Y.H. and J.X.; formal analysis, G.L. and D.Y.; investigation, G.L. and D.Y.; resources, Y.H., J.X. and Z.L.; data curation, G.L. and Z.L.; writing—original draft preparation, G.L.; writing—review and editing, Y.H., J.X. and Z.L.; visualization, G.L.; supervision, Z.L.; project administration, Z.L.; funding acquisition, G.L. and Z.L. All authors have read and agreed to the published version of the manuscript.

Funding

This work was funded by the National Key Research and Development Program of China during the 14th five-year plan Period (2023YFD2201003 and 2022YFD2200203) and the Fundamental Research Funds for the Central Non-Profit Research Institution of CAF (Nos. CAFYBB2022SY017 and CAFYBB2021SY001).

Data Availability Statement

A total of 12 transcriptome raw datasets produced by HiSeqTM2000 system were deposited in the Genome Sequence Archive (SRA) database (https://ngdc.cncb.ac.cn/gsa/browse/CRA017129, accessed on 20 June 2024) under the accession number CRA017129. The genomic sequences of E. grandis were obtained from the Genome Warehouse in National Genomics Data Center Beijing Institute of Genomics, China National Center for Bioinformation (https://ngdc.cncb.ac.cn/gwh/, accessed on 1 May 2024).

Acknowledgments

We thank Qiaowen Wei from National High-tech Base for Forest Seed Breeding (Gaoyao) for providing research materials.

Conflicts of Interest

The authors declare no conflict of interest. The founding sponsors had no role in the design of the study; in the collection, analysis, or interpretation of the data; in the writing of the manuscript; or in the decision to publish the results.

References

  1. Xuan, W.; Beeckman, T.; Xu, G. Plant nitrogen nutrition: Sensing and signaling. Curr. Opin. Plant Biol. 2017, 39, 57–65. [Google Scholar] [CrossRef] [PubMed]
  2. Vidal, E.A.; Alvarez, J.M.; Araus, V.; Riveras, E.; Brooks, M.D.; Krouk, G.; Ruffel, S.; Lejay, L.; Crawford, N.M.; Coruzzi, G.M.; et al. Nitrate in 2020: Thirty years from transport to signaling networks. Plant Cell 2020, 32, 2094–2119. [Google Scholar] [CrossRef] [PubMed]
  3. Li, H.; Hu, B.; Chu, C. Nitrogen use efficiency in crops: Lessons from Arabidopsis and rice. J. Exp. Bot. 2017, 68, 2477–2488. [Google Scholar] [CrossRef]
  4. Schulte-Uebbing, L.F.; Beusen, A.H.W.; Bouwman, A.F.; de Vries, W. From planetary to regional boundaries for agricultural nitrogen pollution. Nature 2022, 610, 507–512. [Google Scholar] [CrossRef]
  5. Kanter, D.R.; Chodos, O.; Nordland, O.; Rutigliano, M.; Winiwarter, W. Gaps and opportunities in nitrogen pollution policies around the world. Nat. Sustain. 2020, 3, 956–963. [Google Scholar] [CrossRef]
  6. Wang, Y.-Y.; Hsu, P.-K.; Tsay, Y.-F. Uptake, allocation and signaling of nitrate. Trends Plant Sci. 2012, 17, 458–467. [Google Scholar] [CrossRef]
  7. Tsay, Y.-F.; Chiu, C.-C.; Tsai, C.-B.; Ho, C.-H.; Hsu, P.-K. Nitrate transporters and peptide transporters. FEBS Lett. 2007, 581, 2290–2300. [Google Scholar] [CrossRef] [PubMed]
  8. Gojon, A.; Krouk, G.; Perrine-Walker, F.; Laugier, E. Nitrate transceptor(s) in plants. J. Exp. Bot. 2011, 62, 2299–2308. [Google Scholar] [CrossRef]
  9. Okamoto, M.; Kumar, A.; Li, W.; Wang, Y.; Siddiqi, M.Y.; Crawford, N.M.; Glass, A.D. High-affinity nitrate transport in roots of Arabidopsis depends on expression of the NAR2-like gene AtNRT3.1. Plant Physiol. 2006, 140, 1036–1046. [Google Scholar] [CrossRef]
  10. Léran, S.; Varala, K.; Boyer, J.C.; Chiurazzi, M.; Crawford, N.; Daniel-Vedele, F.; David, L.; Dickstein, R.; Fernandez, E.; Forde, B.; et al. A unified nomenclature of NITRATE TRANSPORTER 1/PEPTIDE TRANSPORTER family members in plants. Trends Plant Sci. 2014, 19, 5–9. [Google Scholar] [CrossRef]
  11. Okamoto, M.; Vidmar, J.J.; Glass, A.D.M. Regulation of NRT1 and NRT2 gene families of Arabidopsis thaliana: Responses to nitrate provision. Plant Cell Physiol. 2003, 44, 304–317. [Google Scholar] [CrossRef] [PubMed]
  12. Orsel, M.; Krapp, A.; Daniel-Vedele, F. Analysis of the NRT2 nitrate transporter family in Arabidopsis. Structure and gene expression. Plant Physiol. 2002, 129, 886–896. [Google Scholar] [CrossRef] [PubMed]
  13. Tsay, Y.F.; Schroeder, J.I.; Feldmann, K.A.; Crawford, N.M. The herbicide sensitivity gene CHL1 of Arabidopsis encodes a nitrate-inducible nitrate transporter. Cell 1993, 72, 705–713. [Google Scholar] [CrossRef] [PubMed]
  14. Hu, B.; Wang, W.; Ou, S.; Tang, J.; Li, H.; Che, R.; Zhang, Z.; Chai, X.; Wang, H.; Wang, Y.; et al. Variation in NRT1. 1B contributes to nitrate-use divergence between rice subspe-cies. Nat. Genet. 2015, 47, 834–838. [Google Scholar] [CrossRef] [PubMed]
  15. Dong, Q.; Wang, G.; Iqbal, A.; Muhammad, N.; Wang, X.; Gui, H.; Zhang, H.; Kayoumu, M.; Li, X.; Zhang, X.; et al. Identification and expression analysis of the NPF genes in cotton. Int. J. Mol. Sci. 2022, 23, 14262. [Google Scholar] [CrossRef]
  16. Wang, Q.; Liu, C.; Dong, Q.; Huang, D.; Li, C.; Li, P.; Ma, F. Genome-wide identification and analysis of apple NITRATE TRANSPORTER 1/PEPTIDE TRANSPORTER family (NPF) genes reveals MdNPF6.5 confers high capacity for nitrogen uptake under low-nitrogen conditions. Int. J. Mol. Sci. 2018, 19, 2761. [Google Scholar] [CrossRef]
  17. Wang, Y.; Wei, K.; Ruan, L.; Bai, P.; Wu, L.; Wang, L.; Cheng, H. Systematic investigation and expression profiles of the nitrate transporter 1/peptide transporter family (NPF) in tea plant (Camellia sinensis). Int. J. Mol. Sci. 2022, 23, 6663. [Google Scholar] [CrossRef]
  18. Wang, X.; Cai, X.; Xu, C.; Wang, Q. Identification and characterization of the NPF, NRT2 and NRT3 in spinach. Plant Physiol. Biochem. 2020, 158, 297–307. [Google Scholar] [CrossRef]
  19. Marília, G.S.C.; Paulo, M.; Tiago, S.B. Insights into temperature modulation of the Eucalyptus globulus and Eucalyptus grandis antioxidant and lignification subproteomes. Phytochemistry 2017, 137, 15–23. [Google Scholar]
  20. Grassi, G.; Meir, P.; Cromer, R.; Tompkins, D.; Jarvis, P.G. Photosynthetic parameters in seedlings of Eucalyptus grandis as affected by rate of nitrogen supply. Plant Cell Environ. 2002, 25, 1677–1688. [Google Scholar] [CrossRef]
  21. Myburg, A.A.; Grattapaglia, D.; Tuskan, G.A.; Hellsten, U.; Hayes, R.D.; Grimwood, J.; Jenkins, J.; Lindquist, E.; Tice, H.; Bauer, D.; et al. The genome of Eucalyptus grandis. Nature 2014, 510, 356–362. [Google Scholar] [CrossRef]
  22. Qin, J.; Yue, X.L.; Fang, S.Z.; Qian, M.Y.; Zhou, S.T.; Shang, X.L.; Yang, W.X. Responses of nitrogen metabolism, photosynthetic parameter and growth to nitrogen fertilization in Cyclocarya paliurus. For. Ecol. Manag. 2021, 502, 119715. [Google Scholar] [CrossRef]
  23. Chen, J.; Wan, H.; Zhu, W.; Dai, X.; Yu, Y.; Zeng, C. Identification and expression analysis of the isopentenyl transferase (IPT) gene family under lack of nitrogen stress in oilseed (Brassica napus L.). Plants 2023, 12, 2166. [Google Scholar] [CrossRef]
  24. Lavigne, R.; Seto, D.; Mahadevan, P.; Ackermann, H.W.; Kropinski, A.M. Unifying classical and molecular taxonomic classi-fication: Analysis of the podoviridae using BLASTP-based tools. Res. Microbiol. 2008, 159, 406–414. [Google Scholar] [CrossRef]
  25. Qu, Y.; Wang, J.; Qu, C.; Mo, X.; Zhang, X. Genome-wide identification of WRKY in Suaeda australis against salt stress. Forests 2024, 15, 1297. [Google Scholar] [CrossRef]
  26. Prakash, A.; Jeffryes, M.; Bateman, A.; Finn, R.D. The HMMER web server for protein sequence similarity search. Curr. Protoc. Bioinform. 2017, 60, 3–15. [Google Scholar] [CrossRef]
  27. Katoh, K.; Standley, D.M. MAFFT multiple sequence alignment software version 7: Improvements in performance and usability. Mol. Biol. Evol. 2013, 30, 772–780. [Google Scholar] [CrossRef]
  28. Wang, Y.; Tang, H.; DeBarry, J.D.; Tan, X.; Li, J.; Wang, X.; Lee, T.-H.; Jin, H.; Marler, B.; Guo, H.; et al. MCScanX: A toolkit for detection and evolutionary analysis of gene synteny and collinearity. Nucleic Acids Res. 2012, 40, e49. [Google Scholar] [CrossRef]
  29. Pertea, M.; Kim, D.; Pertea, G.M.; Leek, J.T.; Salzberg, S.L. Transcript-level expression analysis of RNA-seq experiments with HISAT, StringTie and Ballgown. Nat. Protoc. 2016, 11, 1650–1667. [Google Scholar] [CrossRef]
  30. Shumate, A.; Wong, B.; Pertea, G.; Pertea, M. Improved transcriptome assembly using a hybrid of long and short reads with StringTie. PLOS Comput. Biol. 2022, 18, e1009730. [Google Scholar] [CrossRef]
  31. Vega, A.; O’Brien, J.A.; Gutiérrez, R.A. Nitrate and hormonal signaling crosstalk for plant growth and development. Curr. Opin. Plant Biol. 2019, 52, 155–163. [Google Scholar] [CrossRef]
  32. Jiang, D.; Borg, M.; Lorković, Z.J.; Montgomery, S.A.; Osakabe, A.; Yelagandula, R.; Axelsson, E.; Berger, F. The evolution and functional divergence of the histone H2B family in plants. PLOS Genet. 2020, 16, e1008964. [Google Scholar] [CrossRef]
  33. Zhang, M.; Zhang, W.; Zheng, Z.; Zhang, Z.; Hua, B.; Liu, J.; Miao, M. Genome-wide identification and expression analysis of NPF genes in cucumber (Cucumis sativus L.). Plants 2023, 12, 1252. [Google Scholar] [CrossRef]
  34. Zhang, H.; Li, S.; Shi, M.; Wang, S.; Shi, L.; Xu, F.; Ding, G. Genome-wide systematic characterization of the NPF family genes and their transcriptional responses to multiple nutrient stresses in allotetraploid rapeseed. Int. J. Mol. Sci. 2020, 21, 5947. [Google Scholar] [CrossRef]
  35. Zhang, H.; Li, Z.; Xu, G.; Bai, G.; Zhang, P.; Zhai, N.; Zheng, Q.; Chen, Q.; Liu, P.; Jin, L.; et al. Genome-wide identification and characterization of NPF family reveals NtNPF6.13 involving in salt stress in Nicotiana tabacum. Front. Plant Sci. 2022, 13, 999403. [Google Scholar] [CrossRef]
  36. Cheng, J.; Tan, H.; Shan, M.; Duan, M.; Ye, L.; Yang, Y.; He, L.; Shen, H.; Yang, Z.; Wang, X. Genome-wide identification and characterization of the NPF genes provide new insight into low nitrogen tolerance in Setaria. Front. Plant Sci. 2022, 13, 1043832. [Google Scholar] [CrossRef]
  37. Hou, X.; Wang, D.; Cheng, Z.; Wang, Y.; Jiao, Y. A near-complete assembly of an Arabidopsis thaliana genome. Mol. Plant 2022, 15, 1247–1250. [Google Scholar] [CrossRef]
  38. Freeling, M. Bias in plant gene content following different sorts of duplication: Tandem, whole-genome, segmental, or by transposition. Annu. Rev. Plant Biol. 2009, 60, 433–453. [Google Scholar] [CrossRef]
  39. Bai, H.; Euring, D.; Volmer, K.; Janz, D.; Polle, A. The nitrate transporter (NPF2.7) optimizes nitrogen use efficiency in plants under low-nitrogen availability. Plant Physiol. 2013, 162, 1246–1254. [Google Scholar]
  40. Xu, Q.; Wang, Y.; Sun, W.; Li, Y.; Xu, Y.; Cheng, B.; Li, X. Genome-wide identification of nitrate transporter 1/peptide transporter family (NPF) induced by arbuscular mycorrhiza in the maize genome. Physiol. Mol. Biol. Plants 2024, 30, 757–774. [Google Scholar] [CrossRef]
  41. He, Y.-N.; Peng, J.-S.; Cai, Y.; Liu, D.-F.; Guan, Y.; Yi, H.-Y.; Gong, J.-M. Tonoplast-localized nitrate uptake transporters involved in vacuolar nitrate efflux and reallocation in Arabidopsis. Sci. Rep. 2017, 7, 6417. [Google Scholar] [CrossRef] [PubMed]
Figure 1. The locations of the EgNPF genes on the chromosomes of E. grandis. A total of 10 chromosomes with varying lengths are shown in relation to the Mb (million base pair) scale on the left, and individual chromosomes (bars) are labeled with respective EgNPF genes.
Forests 15 01697 g001
Figure 2. The positions of the EgNPF genes are marked on the chromosomes. Gray lines in the background represent all syntenic blocks within the E. grandis genome, red lines denote segmental duplication gene pairs, and purple lines in the outer ring highlight tandem duplication gene pairs.
Forests 15 01697 g002
Figure 3. Syntenic analysis of EgNPF genes was performed for E. grandis in comparison with three other plant species. Collinear blocks between E. grandis and the other plant genomes are illustrated with gray lines in the background, while syntenic pairs of EgNPF genes are marked in red.
Forests 15 01697 g003
Figure 4. Phylogenetic analysis of EgNPF proteins in E. grandis was conducted using a maximum likelihood (ML) tree based on 64 EgNPF sequences. The tree was then categorized into eight groups, each represented by a distinct color.
Forests 15 01697 g004
Figure 5. The phylogenetic relationship, gene structure, and motif compositions of EgNPF proteins. (a) The phylogenetic relationships among EgNPF proteins were examined using the maximum likelihood (ML) method, resulting in the identification of 8 distinct groups. (b) The gene structure analysis of the EgNPF gene family; exons shown as yellow rectangles and introns as black lines. (c) Motif prediction in EgNPF proteins was carried out using MEME, revealing conserved motifs represented by differently colored boxes.
Forests 15 01697 g005
Figure 6. Cis-acting components of EgNPF genes in E. grandis. All promoter sequences (2000 bp) were analyzed. The EgNPF genes are shown on the left. Scale bar at the base indicates length of promoter sequence.
Forests 15 01697 g006
Figure 7. Heatmap illustrating the expression levels of 10 differentially expressed EgNPF genes under different N supply conditions. EgLL means leaf under low N supply, EgLR means root under low N supply, EgHL means leaf under high N supply, and EgHR means root under high N supply.
Forests 15 01697 g007
Figure 8. Comparisons of expression levels of 10 EgNPF genes obtained by qRT-PCR analysis under different N supply conditions. Error bars indicate the standard deviation (n = 3). EgLL samples were set as the control group for qRT-PCR. Different letters above the bars indicate significant differences among different samples with Duncan’s test (p < 0.05).
Forests 15 01697 g008
Figure 9. Transient expression and subcellular localization of EUGRSUZ_G03119. The co-localization of EUGRSUZ_G03119-GFP and nuclei was determined by the GFP signal and H2B-mCherry histone. GFP was used as a negative control. The green fluorescence indicates the location of the GFP fusion protein. Red fluorescence indicates H2B-mCherry localization. The fluorescence in the Merged is produced by the overlap of the bright, green, and red channels. Scale bars, 10 μm.
Forests 15 01697 g009
Disclaimer/Publisher’s Note: The statements, opinions and data contained in all publications are solely those of the individual author(s) and contributor(s) and not of MDPI and/or the editor(s). MDPI and/or the editor(s) disclaim responsibility for any injury to people or property resulting from any ideas, methods, instructions or products referred to in the content.

