Review

Fluxes, Mechanisms, Influencing Factors, and Bibliometric Analysis of Tree Stem Methane Emissions: A Review

by
Yanyan Wei
1,2,
Jun Gao
1,2,
Xi Zhu
2,3,
Xiayan He
1,2,
Chuang Gao
1,2,
Zhongzhen Wang
1,2,
Hanbin Xie
4,* and
Min Zhao
1,2,*
1
School of Environmental and Geographical Sciences, Shanghai Normal University, Shanghai 200234, China
2
Yangtze River Delta Urban Wetland Ecosystem National Field Scientific Observation and Research Station, Shanghai 200234, China
3
College of Life Sciences, Shanghai Normal University, Shanghai 200234, China
4
Collections Conservation Research Center, Shanghai Natural History Museum, Branch of Shanghai Science and Technology Museum, Shanghai 200041, China
*
Authors to whom correspondence should be addressed.
Forests 2024, 15(7), 1214; https://doi.org/10.3390/f15071214
Submission received: 14 June 2024 / Revised: 5 July 2024 / Accepted: 9 July 2024 / Published: 12 July 2024
(This article belongs to the Section Forest Ecology and Management)

Abstract

:
Methane (CH4) emissions exert large effects on the global climate. Tree stems are vital sources of emissions in ecosystem CH4 budgets. This paper reviewed the number of publications, journals, authors, keywords, research hotspots, and challenges. A total of 990 articles from 2006 to 2022 were collected based on the Web of Science database. The intellectual base was analyzed using CiteSpace 6.3.1 and VOSviewer 1.6.20 softwares. The results illustrated a growing trend in the study of tree stem methane emissions. The United States was the most research-active country; however, the most active institution was the Chinese Academy of Sciences in China. The research on stem methane emission by Vincent Gauci, Katerina Machacova, Zhi-Ping Wang, Kazuhiko Terazawa, Kristofer R. Covey, and Sunitha R. Pangala has had a significant impact. Current research indicates that stem CH4 emissions significantly vary among different tree species and are influenced by leaf type, forest type, tree height, whether the trees are alive or dead, and other environmental conditions (such as soil water content, air temperature, CO2 fluxes, and specific density). Soil CH4 fluxes and production by methanogens in heartwood were the primary sources of tree stem methane. Some pectin or cellulose from trees may also be converted into methane. Moreover, methane can be produced and released during the decomposition of deadwood by basidiomycetes. Furthermore, there are some trends and challenges for the future: (1) distinguishing and quantifying emissions from various sources; (2) accurately assessing the impact of floods on methane emissions is crucial, as the water level is the main factor affecting CH4 emissions; and (3) addressing the limited understanding of the microbial mechanisms of methane production in different tree species and investigating how microbial communities affect the production and emission of methane is vital. These advances will contribute to the accurate assessment of methane emissions from global ecosystems.

1. Introduction

The concentration of methane (CH4), which is the second most important greenhouse gas [1]. The warming potential of CH4 is 28–34 times greater than that of CO2 on a mass-per-mass basis over a 100-year time scale [2]. Accurately assessing methane emissions is quite challenging due to the unorganized escape of methane, low leakage concentrations, large fluctuations, strong persistence, and more influencing factors compared to carbon dioxide [3]. In ecosystems, methanogens are important biological sources of methane (70% to 80%) [4]. However, ecosystems can also act as methane sinks because of the influence of methanotrophs and the availability of oxygen. Upland forest soils are the main CH4 sink [5]; however, wetland soils are the main source [6]. The tree roots may have evolved a robust ventilation system that allows for the efficient exchange of gases to cope with anoxic conditions due to poor soil permeability.
Therefore, methane produced in deep soil can be transported through the tree root ventilation system and released into the atmosphere via the stem ventilation tissues (a channel filled with gas) [7]. Stem-mediated methane emission sources alone may account for 5% to 10% of global methane emissions [8]. Plain (2021) has proven the “soil-tree-atmosphere” methane emission pathway through the 13CH4 isotope tracing technique [9].
In addition, the anaerobic environment in the heartwood of trees may contribute to the growth of methanogens and produce methane [10]. CH4 may also be produced by aerobic abiotic photochemical processes. Keppler (2006) determined that pectin plays an important role in the release of methane from trees using carbon isotope techniques [11]. Therefore, methane emissions from stems involve a complex process of methane production, transport, oxidation, and release [12]. Stems of tree species may have different mechanisms of methane processing and varied methane emissions. A few studies have reported stem CH4 emissions in forests under natural conditions [13,14,15,16,17,18,19]. Stem CH4 emissions may change due to water level [20,21]. Ultimately, methane emissions from tree stems are influenced by environmental conditions. Understanding stem methane dynamics is crucial for accurately assessing CH4 emissions from forest ecosystems. However, the key forest types and controlling factors of stem CH4 emissions are still unclear.
Bibliometric analysis is the quantitative analysis of scientific publications by useful scientific knowledge mapping tools (e.g., VOSviewer, CiteSpace, etc.) [22]. It can be used to estimate the characteristics, hotspots, and trends in research areas [23,24]. However, few researchers have reviewed the research of tree stem methane emissions by bibliometric metrology. Therefore, the objective of this review was to lay the foundation for accurately assessing CH4 emissions from forest ecosystems. First, a bibliometric analysis of research on stem CH4 emissions, such as the number of publications, journals, authors, keywords, and research hotspots in different periods from 2006 to 2022. Then, the research hotspots were discussed in depth for research on stem CH4 emissions. Our review will help researchers better understand the role of stem CH4 dynamics in accurately assessing CH4 emissions from forest ecosystems.

2. Materials and Methods

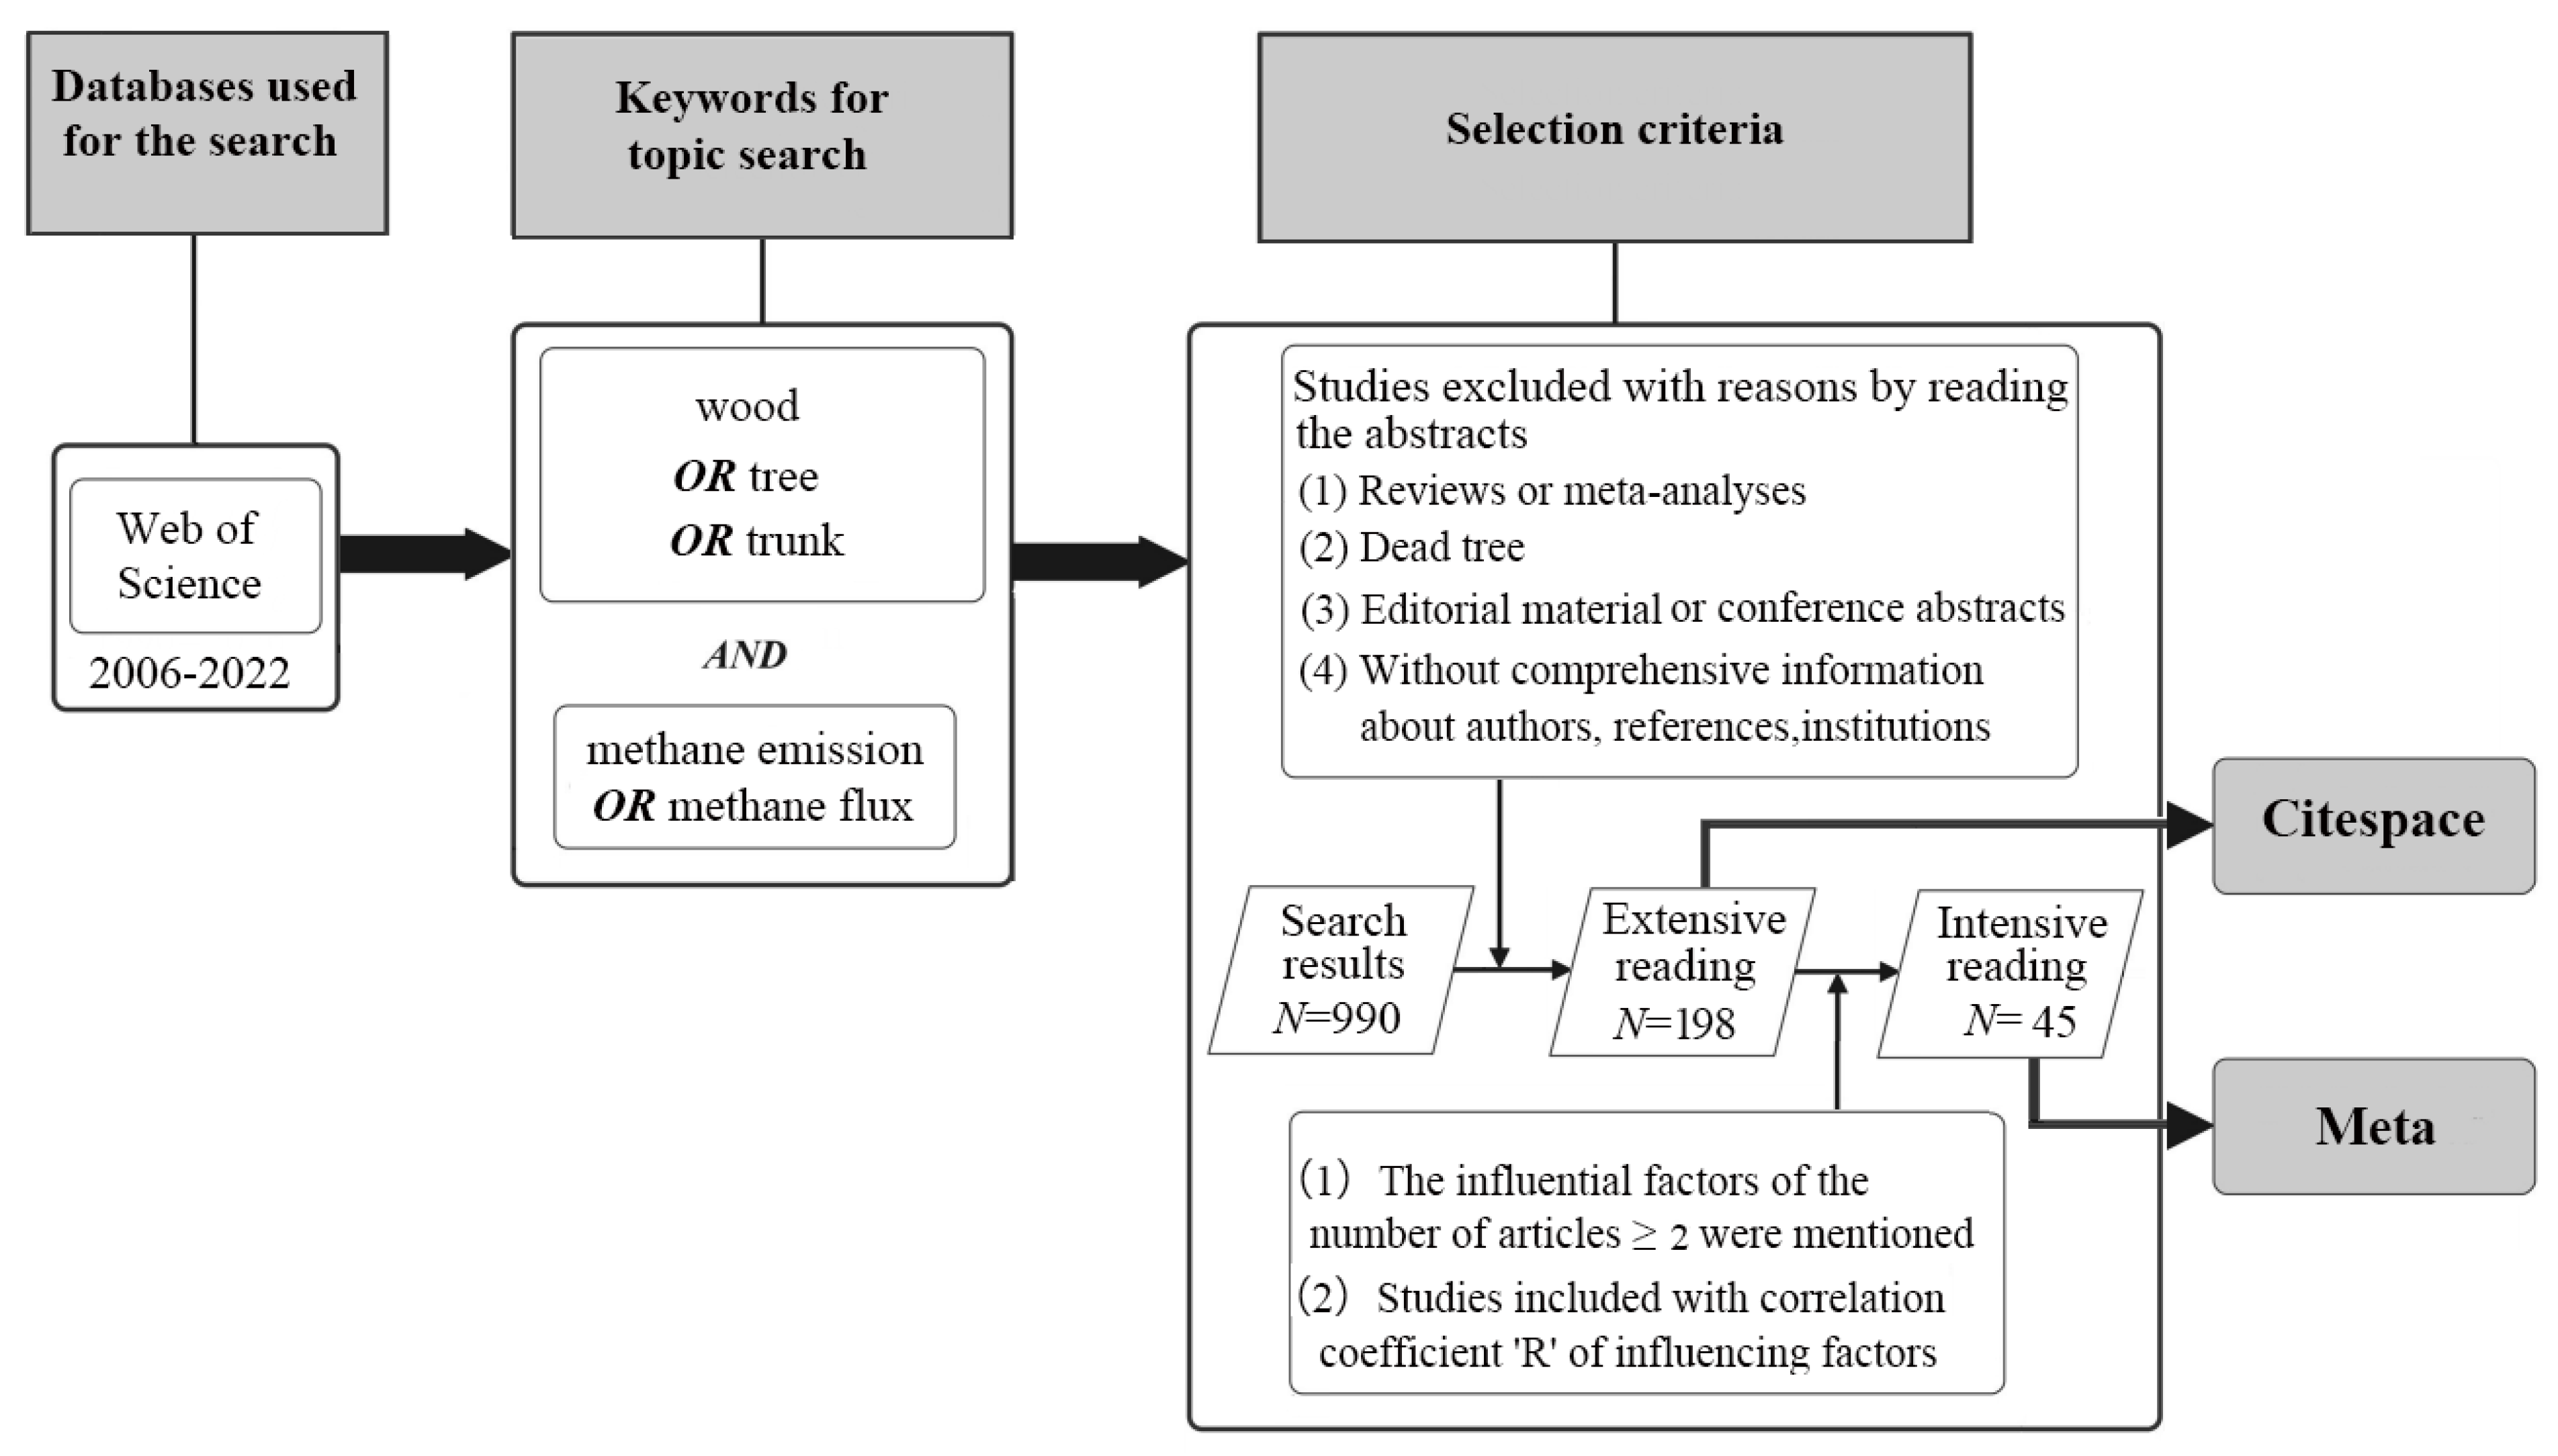
2.1. Data Collection

The first stage was to collect peer-reviewed studies of tree stem methane emissions. We established search keywords in the Web of Science (https://webofscience.clarivate.cn/wos/alldb/basic-search (accessed on 1 September 2023)) as follows: All = (methane emission or methane flux) and All = (tree trunk or tree stem). This initial topic search was denoted as the base dataset and resulted in 990 records from 2006 to 2022. Since not all of these records were about methane fluxes from live trees, the final dataset was 198 records (Figure 1). We exported all the bibliographic records to plain text format, including full documentation and references. A bibliometric analysis was designed to study the quantitative characteristics of the literature by using mathematical and statistical methods [25,26], which enables researchers to evaluate relevant publications [27]. Additionally, a scientometric analysis was designed to quantitatively analyze the inputs, outputs, and processes of scientific activities through statistical and computational techniques.

2.2. Analysis Method

CiteSpace is one of the most balanced and powerful Java applications for professional analysis of scientific literature. It allows for the application of scientometric analysis and knowledge visualization [28]. CiteSpace is described as a “scientific knowledge graph” because the laws, structure, and distribution of scientific knowledge are presented visually.
In CiteSpace 6.3.1 software (https://citespace.podia.com/download (accessed on 10 March 2024)), a time range can be selected from the main panel, and the node types of author, institution, country, keyword, and reference can establish different networks in a configuration function area to intuitively analyze the basic information of each node type. The betweenness centrality of nodes represents the key indicator of importance. The higher keyword frequency of occurrence with the larger node. The size of the font represents the betweenness centrality, with larger fonts indicating higher betweenness centrality. It is considered a collaboration when two appear in the same document based on the co-occurrence frequency matrix. Additionally, the keyword time network was formed by closely connected keywords during the same period based on VOSviewer 1.6.20 software (https://www.vosviewer.com/download (accessed on 31 October 2023)). It is worth noting that we removed irrelevant terms and words like unit of measurement, geographic locations, etc., before creating the final bibliomap. The betweenness centrality was calculated using Equation (1).
C e n t r a l i t y   ( node i ) = i j k p j k ( i ) p j k
In Equation (1), Pjk represents the number of shortest paths between node j and node k, and Pjk (i) is the number of those paths that pass through node i.
Then, the methods for measuring stem methane emissions, stem methane emission dynamics, mechanisms of methane sources, and environmental controlling factors were analyzed. Studies that could determine the extent to which environmental factors impact CH4 emissions using the correlation coefficient “R” were selected. A meta-analysis of the included studies was conducted with effect values (“R”) and 95% confidence interval (CI) as indicators of effect size using the statistical software Stata 14.0 (https://www.stata.com/stata14/ (accessed on 7 December 2023)). Meta-analysis is a statistical method designed to synthesize findings from multiple independent studies. It aims to obtain more accurate and comprehensive conclusions by conducting a significance analysis of the pooled results. A heterogeneity test was performed on the included articles. The meta-analysis was performed using a fixed-effect model when p ≥ 0.10 and I2 < 50%; otherwise, we used the random-effect model. To compare the consistency of the results between the two models, papers with a large influence on the combined results were excluded for a sensitivity analysis. Publication bias was detected using Egger’s t-test in the statistical software, and p ≤ 0.05 was regarded as statistically significant for the influence of environmental factors on stem methane emission.

3. Bibliometric Analysis

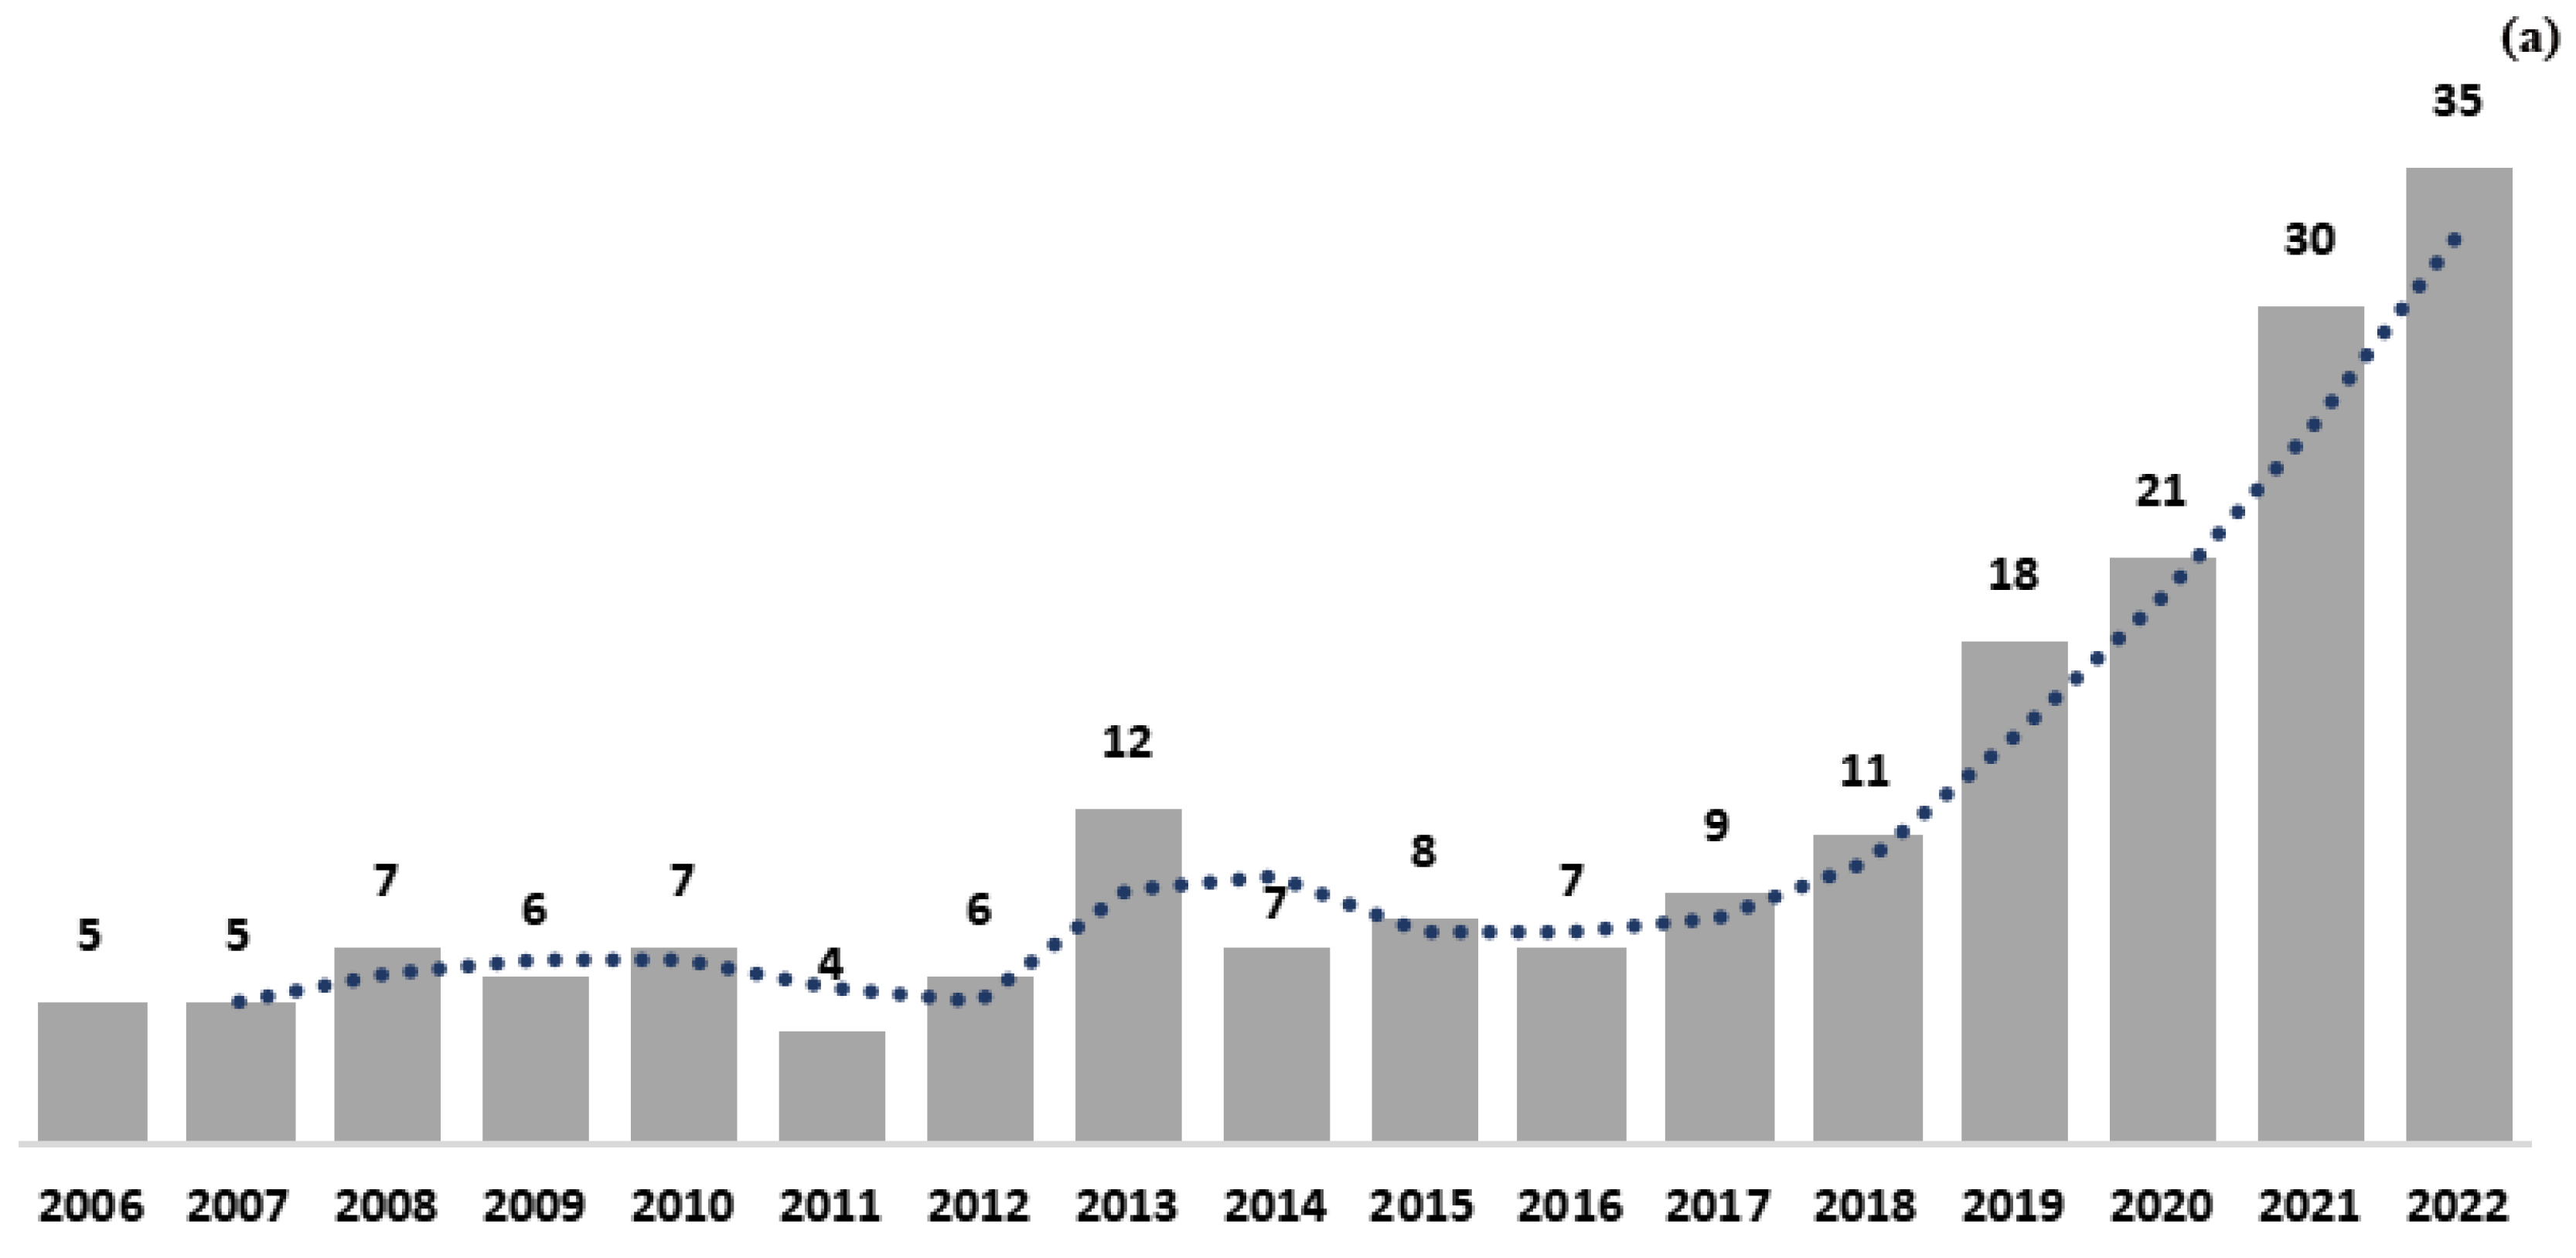
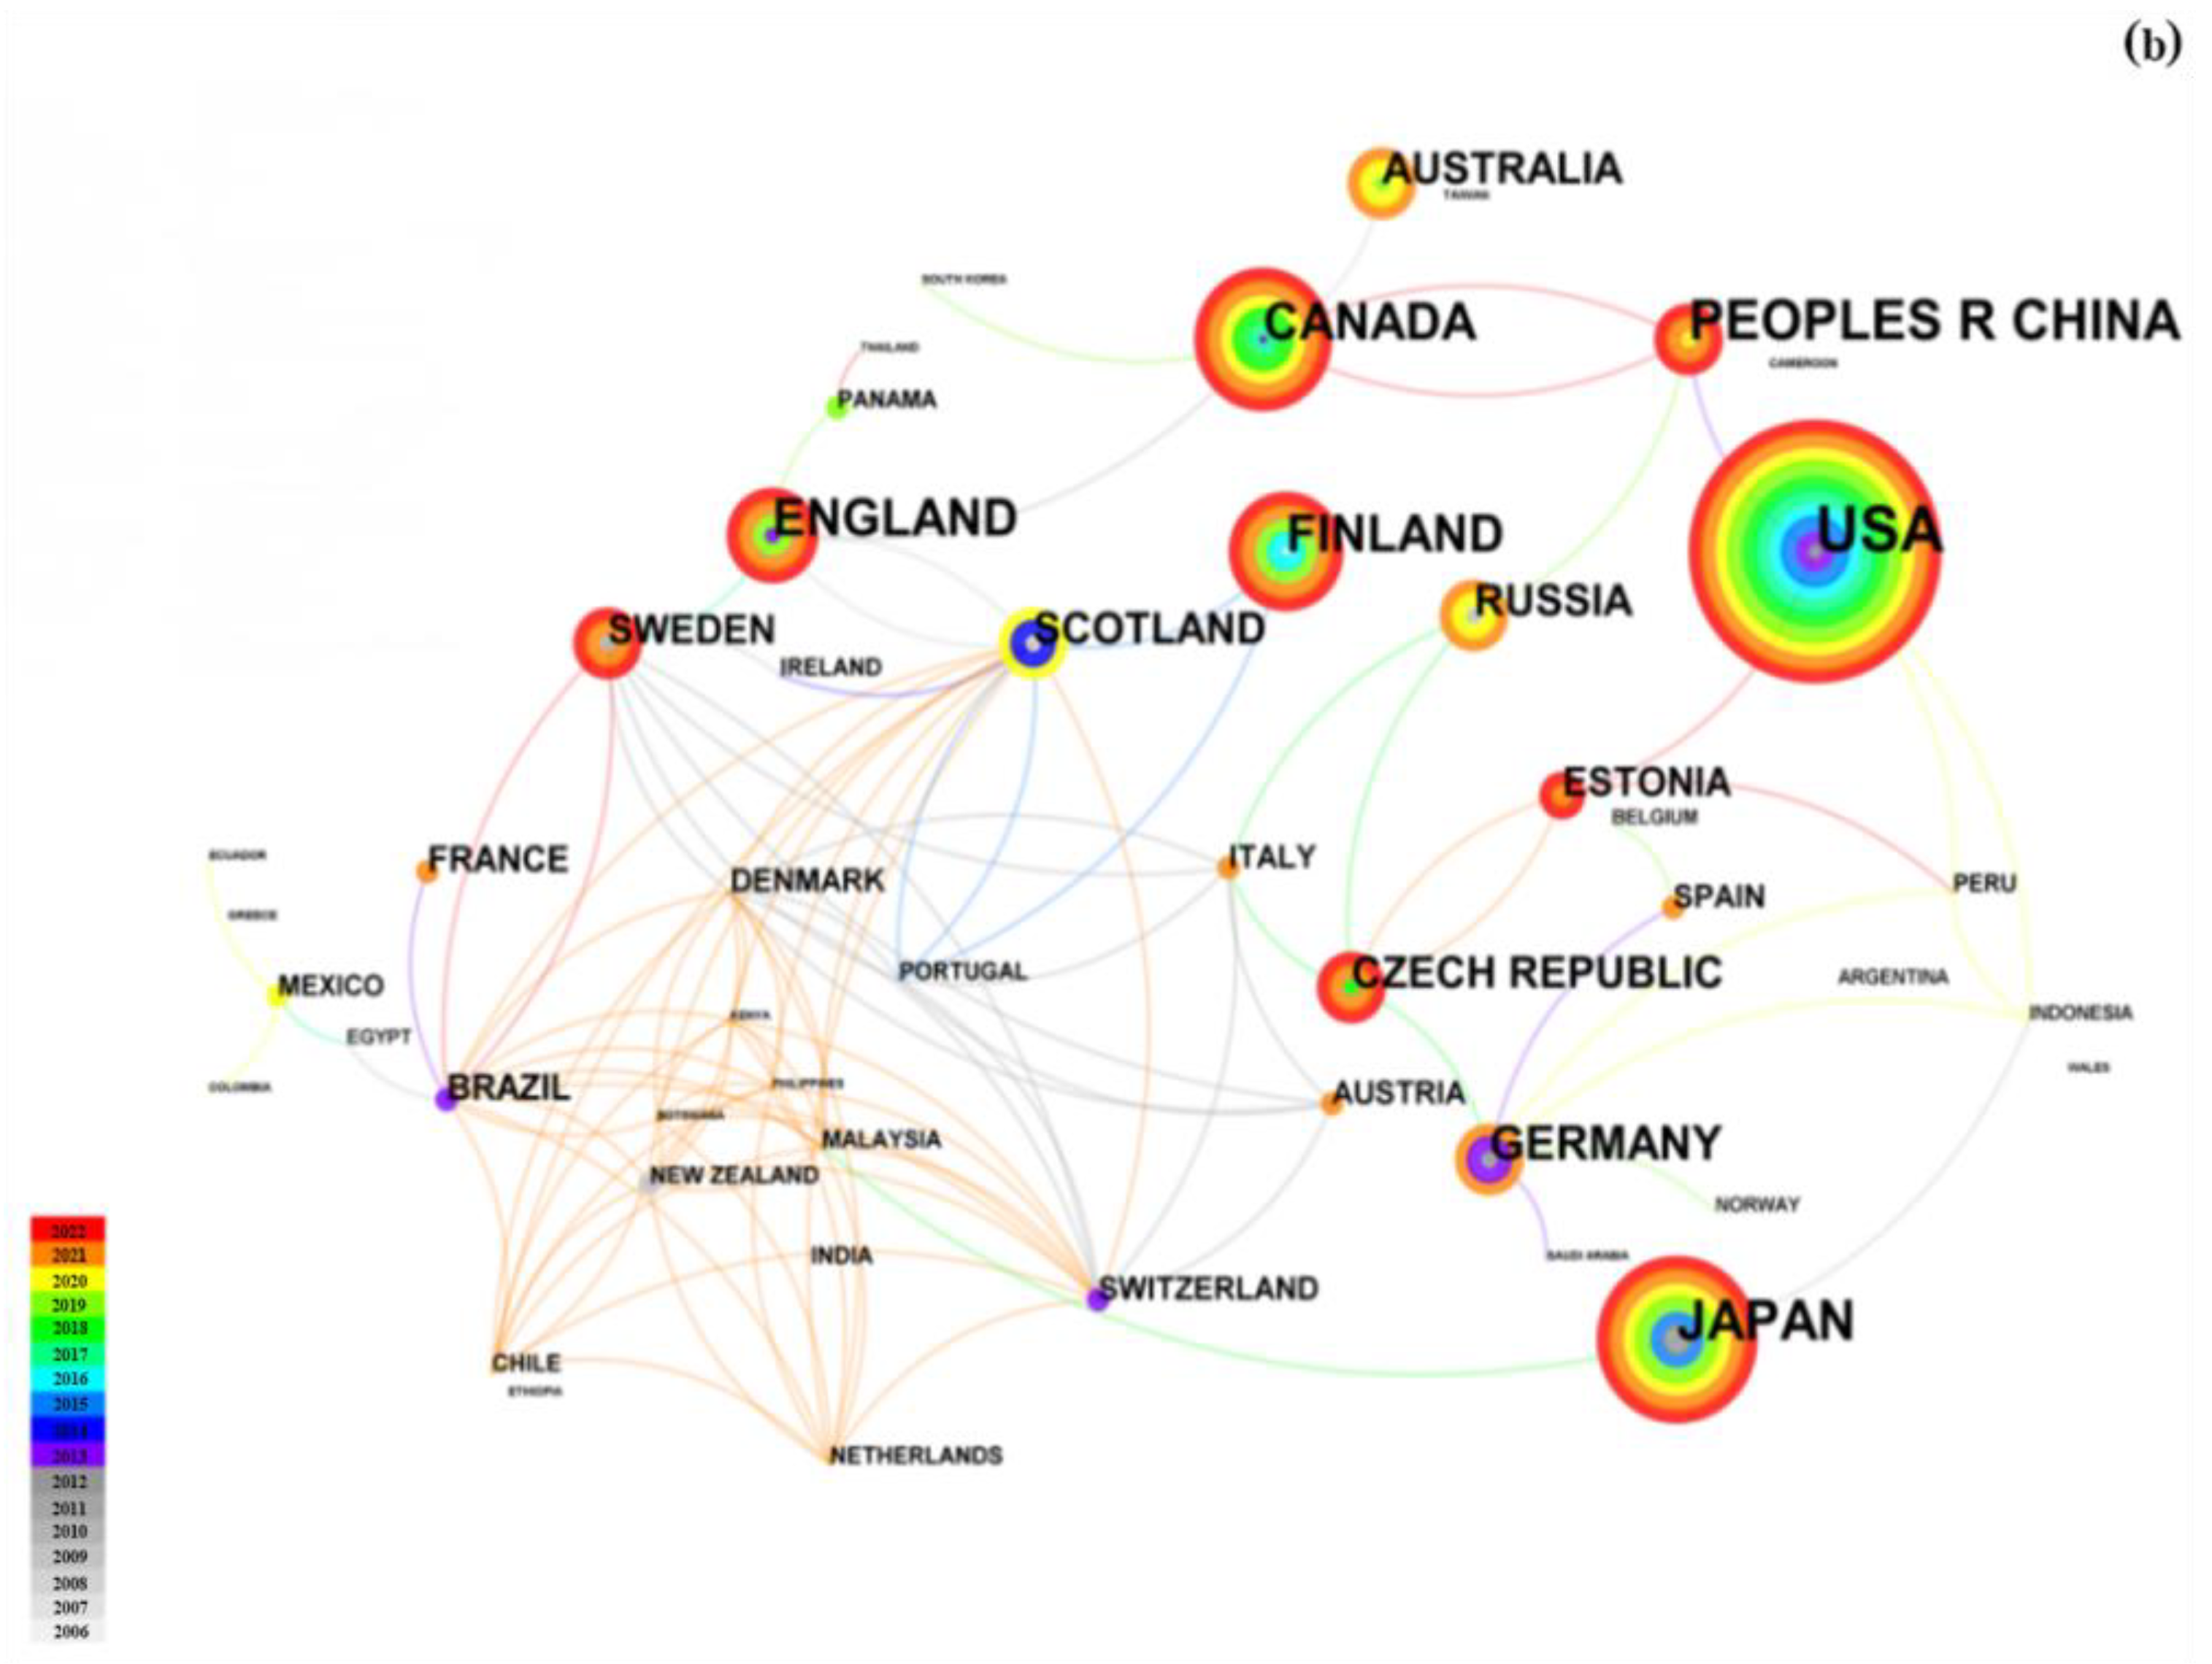
3.1. Document Numbers and Countries

The number of published articles for each year from 2006 to 2022 is shown in Figure 2a. From 2006 to 2012, the number of articles per year was relatively stable at an average of five. The number of articles increased by 50% in 2013 compared to 2012 and accounted for about 23% of the articles published from 2006 to 2013. However, in 2014, the number of articles decreased by about 50% compared to 2013. In 2015, goal 13 of the Sustainable Development Goals was proposed, and the number of articles on tree stem methane emissions continued to rise [29]. By identifying the number of articles published in different countries, it is possible to pinpoint the countries that have made the most significant contribution to tree methane emission research [30], as shown by the rings in Figure 2b [31]. Papers from 49 countries were published between 2006 and 2022. The United States published the largest number of articles in the field, accounting for about 14.0% of the total number, followed by China (7.2%), Japan (6.9%), Canada (6.2%), and the United Kingdom (6.2%). Research into tree stem methane emissions mainly comes from developed countries. China is the only developing country among the top five. Collaboration between countries is displayed through links between institutions. More than 80% of countries cooperated with other countries. Switzerland, Sweden, Chile, New Zealand, Denmark, Brazil, and the Netherlands were shown to have cooperated more with other countries. China also cooperated with the United States, Canada, and Russia.

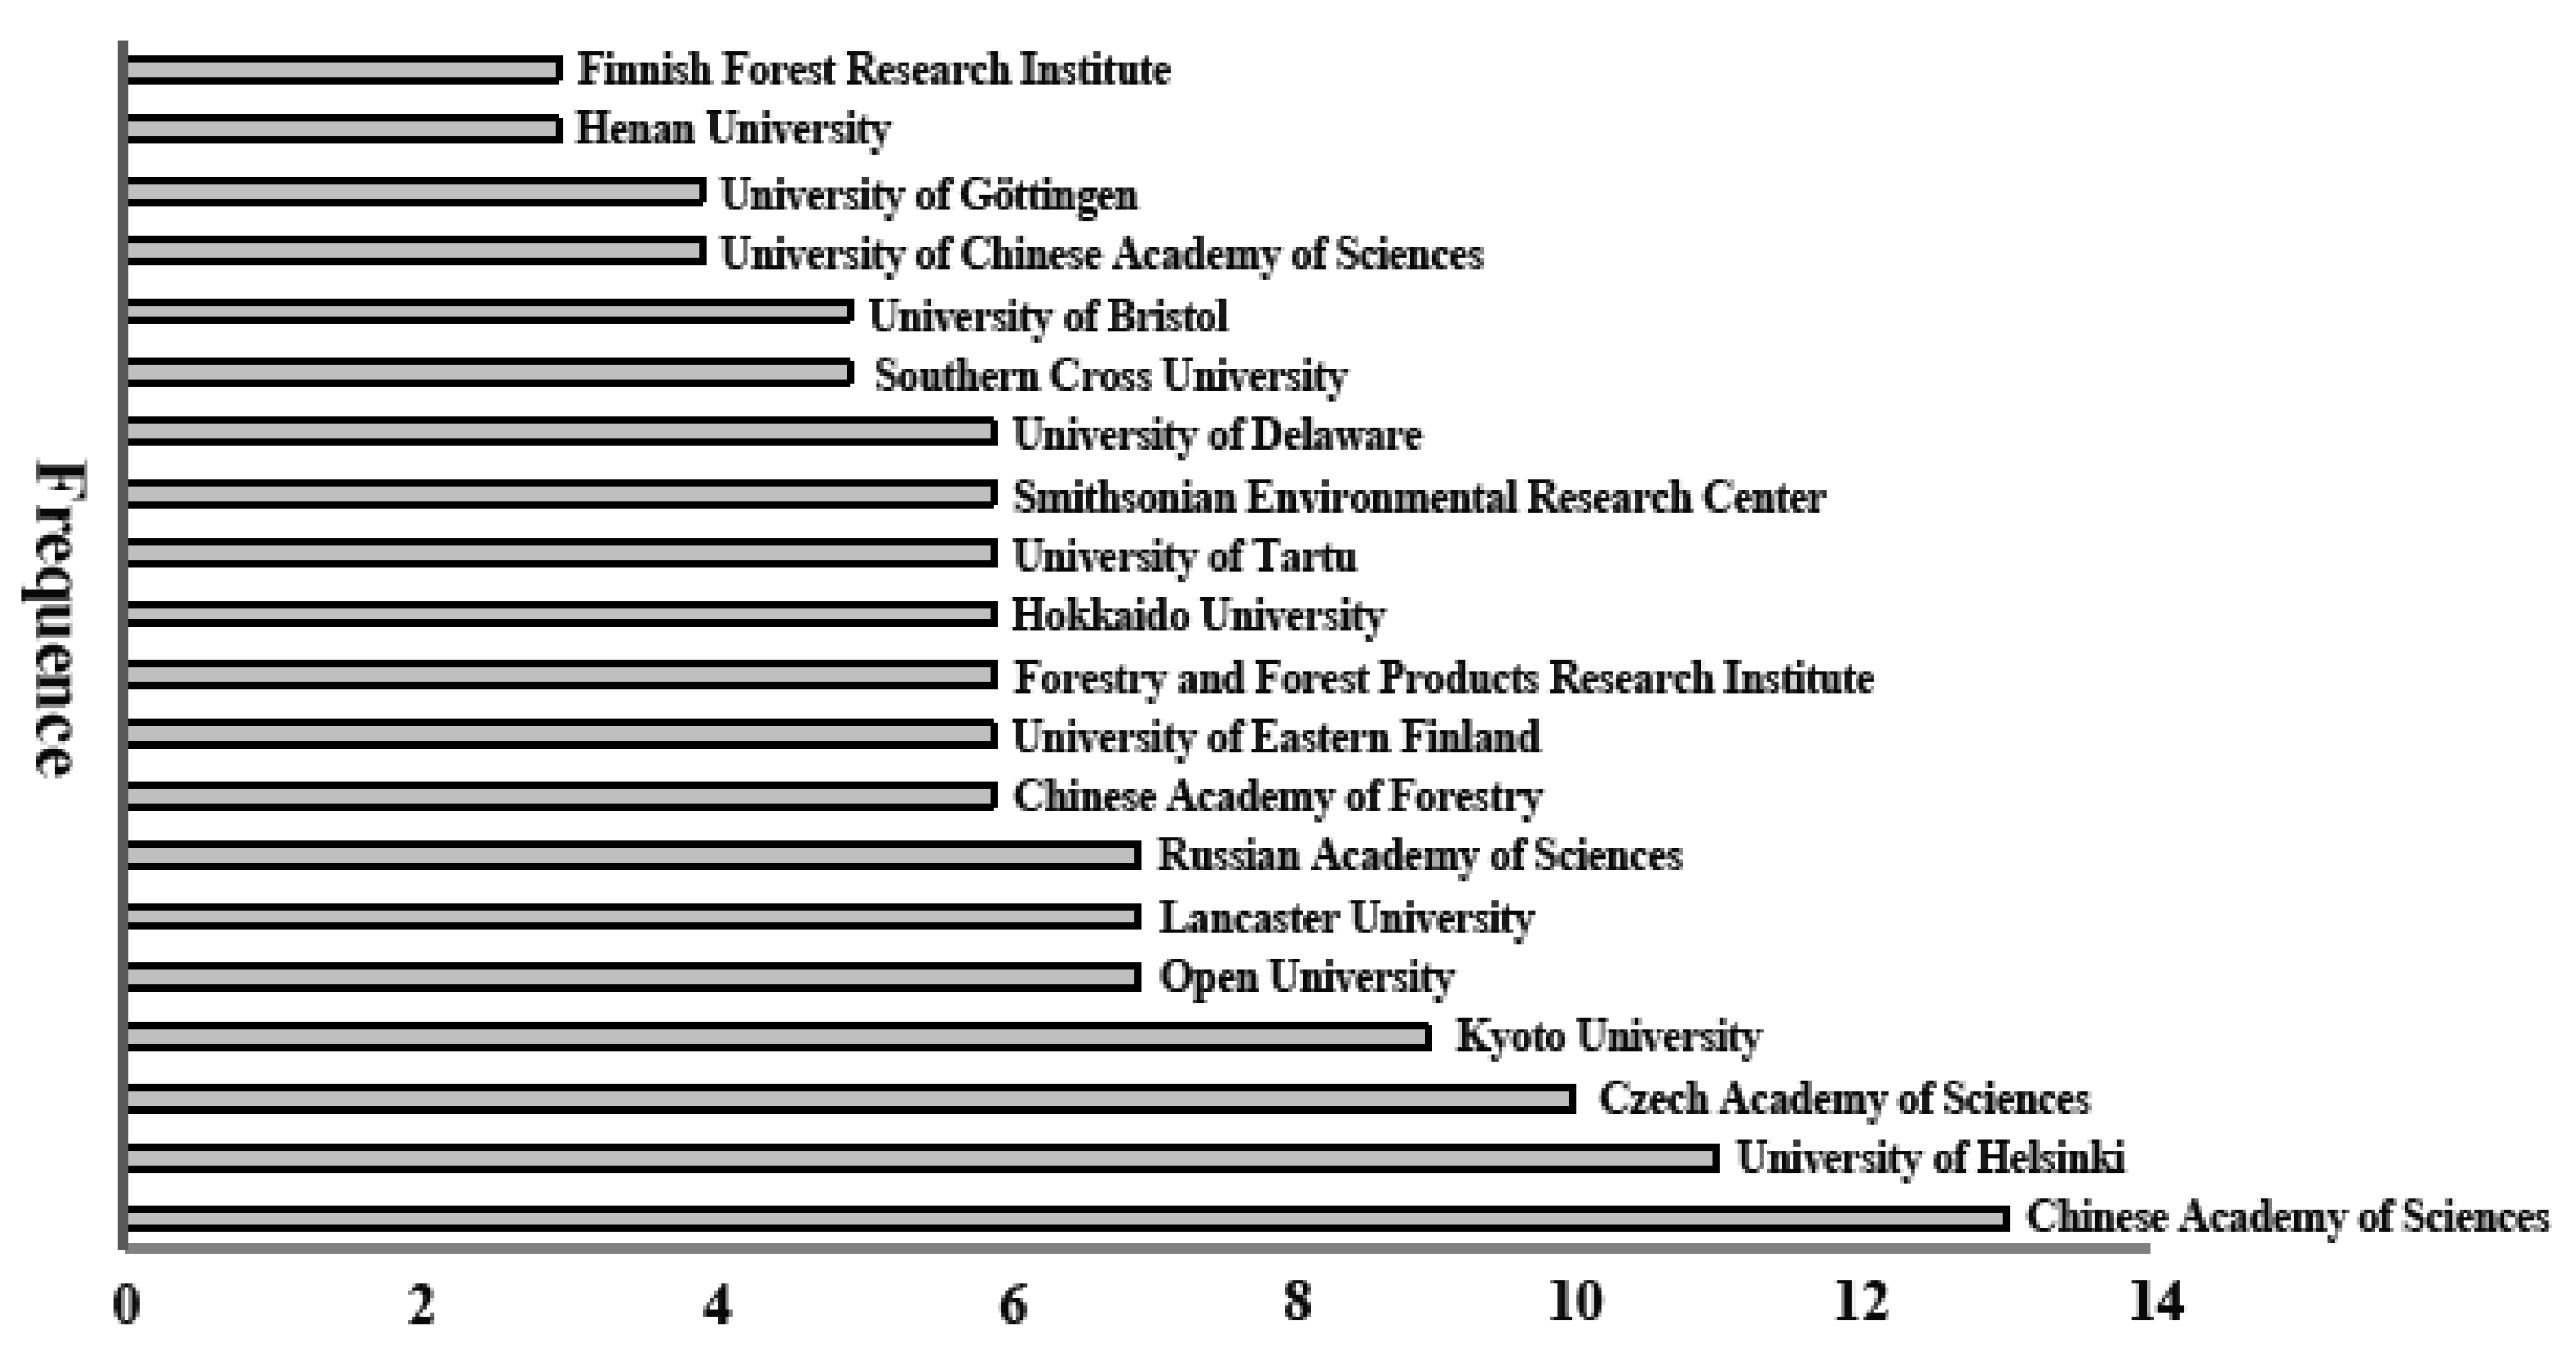
3.2. Active Institutions and Authors

Between 2006 and 2022, articles came from 260 institutions. Eight of these institutions were in the USA and accounted for 23% of the top 20 institutions. Other institutions were mainly in China, Japan, Finland, and the United Kingdom. Among the top five institutions, the Chinese Academy of Sciences had the largest number of publications, followed by the University of Helsinki, the Czech Academy of Sciences, Kyoto University, and the Russian Academy of Sciences (Figure 3). The co-occurrence network showed which were significant institutions in the research of tree stem methane emissions. For instance, the Chinese Academy of Sciences had a higher co-occurrence with the University of the Chinese Academy of Sciences, the Beijing Forestry University, and the Chinese Academy of Forestry. Kyoto University had a higher co-occurrence with the Chinese Academy of Sciences and the Forestry & Forest Product Research Institute. As well as cooperation between institutions in a given country, there was also collaboration between the institutions of different countries.
Most authors published one paper (84%), 14% published two, three or four papers, and 2% published five or more. The most prolific authors were Vincent Gauci (9), Katerina Machacova (7), Ayaka Sakabe (6), Edward Hornibrook (5), Shigehiro Ishizuka (5), Mari Pihlatie (5), Thomas Schindler (5), and Rodrigo Vargas (5). Sunitha R. Pangala had the highest co-citation, followed by Kristofer R. Covey, Zhi-Ping Wang, Katerina Machacova, and Kazuhiko Terazawa. The top 10 co-cited authors mainly came from developed countries: the United Kingdom (Open University), the USA (Skidmore College, University of Birmingham, and Johns Hopkins University), Czech Republic (Global Change Research Institute CAS), Japan (Tokyo University), and Germany (University of Heidelberg). Only Zhi-Ping Wang came from a developing country (China). A total of 60% of the top 10 authors are authors of co-cited published articles (Table 1).

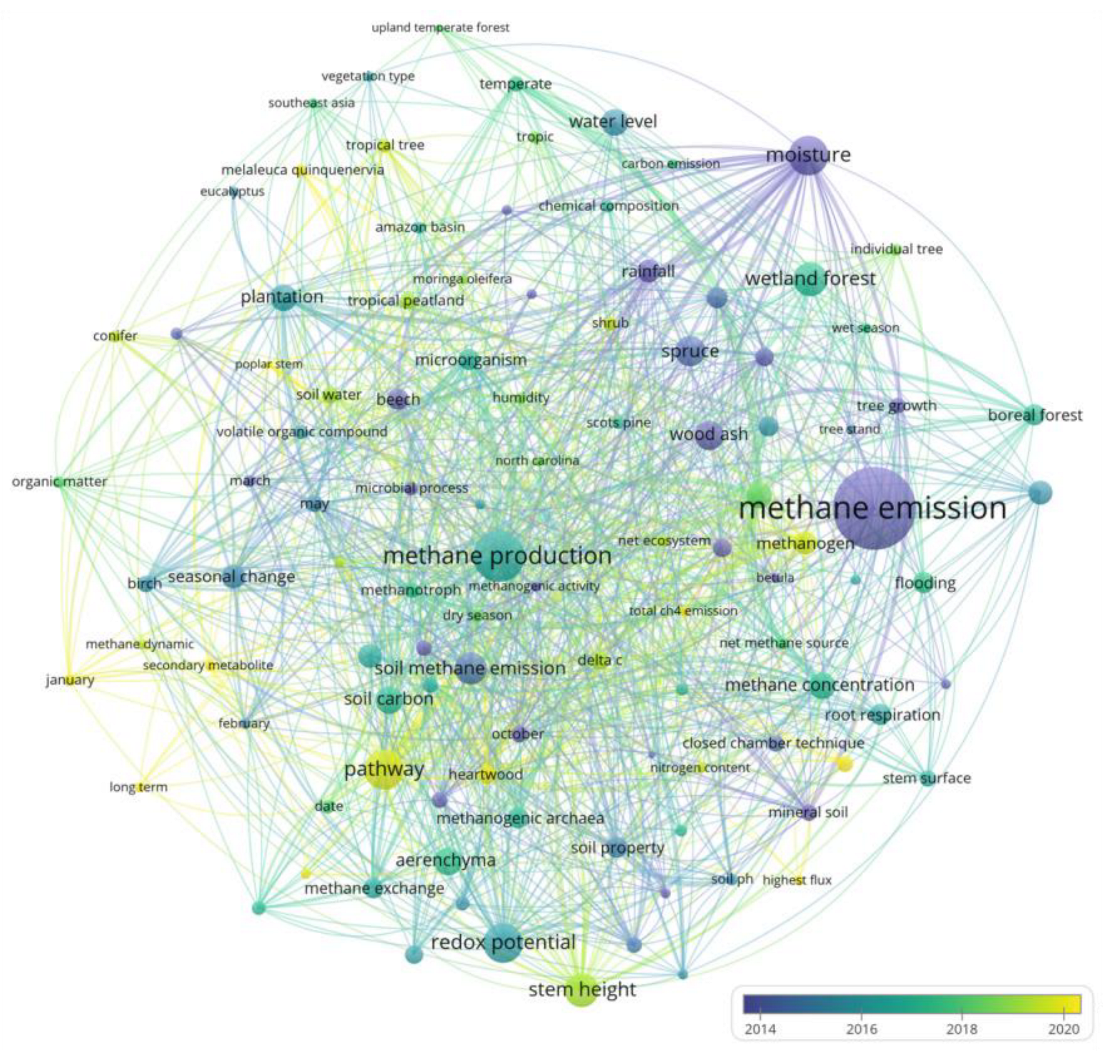
3.3. Keyword Co-Occurrence Analysis

Keyword co-occurrence analysis can reflect research topics and the core content of papers in different years, which in turn reflect the main interests in the research field. The visualization of mainly keyword co-occurrence and the keywords with a minimum occurrence number of 10 are summarized and shown in Figure 4. The “methane emission” and “methane production” were the most frequent, indicating that these were the two search subject words in the research field. Moreover, “soil methane emission”, “methanogen”, “methanotroph”, and “methane production” reflected the methane sources. The “wetland forest” and “boreal forest” had a high frequency, which confirmed that these forests were the main research sites. Some words that indicated research methods included “methanotroph,” “correlation analysis”, and “closed chamber technique”. The keywords around influencing factors for tree stem methane emissions mainly included “stem height”, “stem height”, “seasonal change”, “moisture”, “water level”, “pore water”, “depth”, “spatial variation”, “rainfall”, “organic matter”, “temperate”, “redox potential”, “soil carbon”, and “soil water content”. Among these, water-related factors are the highest frequency and quantity, followed by “redox potential” and “soil carbon,” which also exhibited a high frequency of occurrence.
The periods of keyword occurrences reveal the origins and development of the research topic as well as the research timeline (Figure 4). Research on stem methane emissions can be categorized into three hot topics during different periods. Topic 1 focused on the stem methane emission characteristics of different tree species in various forest types, such as “poplar”, “eucalyptus”, “birch”, and “betula”, as well as their relationship with soil methane emissions during the period of 2006–2010. The research hot topic 2 shifted to the impact of environmental factors on stem methane emissions from 2011 to 2015, with a particular emphasis on moisture conditions and seasonal variations. From 2016 to 2022, the research hot topic 3 was the microbial processes and methane emission mechanisms, exploring how microorganisms influence the production and emission of methane. The research hotspots of tree stem methane emissions are discussed in depth in Section 4.

4. Fluxes, Mechanisms, and Influencing Factors of Stem Methane Emissions

4.1. Measurement Methods of Stem Methane Emissions

Quantifying stem methane in forest ecosystems is crucial for comprehending their impact on the global carbon cycle. There are two principal methods for measuring stem CH4 in forest ecosystems: the chamber-gas chromatography (C-GC) method and the bore-gas chromatography (B-GC) method. The C-GC method primarily serves to ascertain the gas flux between tree stems and the atmosphere, while the B-GC method is used to measure methane concentration from the heartwood of trees. The stem annual methane emissions from a forest were estimated based on stem methane flux and heartwood methane concentration [32].

4.1.1. Chamber-Gas Chromatography Method

The C-GC method entailed positioning a sealed chamber within a defined stem surface area to gather gas samples from a particular region. The most sampling time occurred between 10:00 A.M. and 2:00 P.M., with gas collection intervals ranging from 5 to 60 min [33,34]. Gas samples were subsequently analyzed using gas chromatography to determine methane concentrations. The flux rates of CH4 from stems were calculated by linear least square fits of time series of CH4 concentrations as follows:
F = M V d c d t V 1 2 π r h ( 273 273 + T )
where F is the CH4 flux in terms of per unit plot of tree bark per unit time (μg/m2/h), and a positive value indicates the transfer of carbon from tree trunks to the atmosphere, while a negative value signifies the oxidation and removal of atmospheric carbon within the tree trunks. “M” represents the molar mass of CH4, which is approximately 44 g per mole (g/mol). “V” stands for the molar volume of a gas at standard conditions, which is approximately 22.4 L per mole (L·mol−1). “dc/dt” denotes the rate of change in gas concentration within the tree trunk per unit time. “T” represents the average temperature inside a static chamber during the sampling period. “V1” corresponds to the partial volume of gas within the sampling chamber (measured in cubic meters, m³). “r” signifies the radius of the tree trunk at the sampling location (measured in meters, m). “h” stands for the height of the static chamber used for the measurements (measured in meters, m). Fluxes were calculated using a linear approach to the changes in CH4 concentrations in the chamber headspace over time at ambient temperature. The fluxes data with R2 ≥ 0.7 were accepted, while those with R2 values lower than 0.7 were removed. The zero flux was assigned by the expelled of the horizontal gas concentrations regression line.

4.1.2. Bore-Gas Chromatography Method

The bore-gas chromatography (B-GC) method was originally used to ascertain the presence of methane gas in tree stems. An increment borer was inserted in tree stems and horizontally drilled into the center of the heartwood. Moreover, the newly created hole was immediately blocked by a stopper, followed by a disposable plastic syringe to extract gas from the hole. Gas samples collected were analyzed using gas chromatography to determine methane concentrations, thereby indicating the presence of methane gas within the tree stem.

4.1.3. Annual Methane Emissions from Stems

The stem CH4 emission from trees was estimated as follows:
T = N × P × A × F
where “T” is annual methane emission; “N” is the stem number of trees; “P” is the proportion of stems with substantial methane concentration in heartwood; A is stem surface area; and F is stem methane flux.

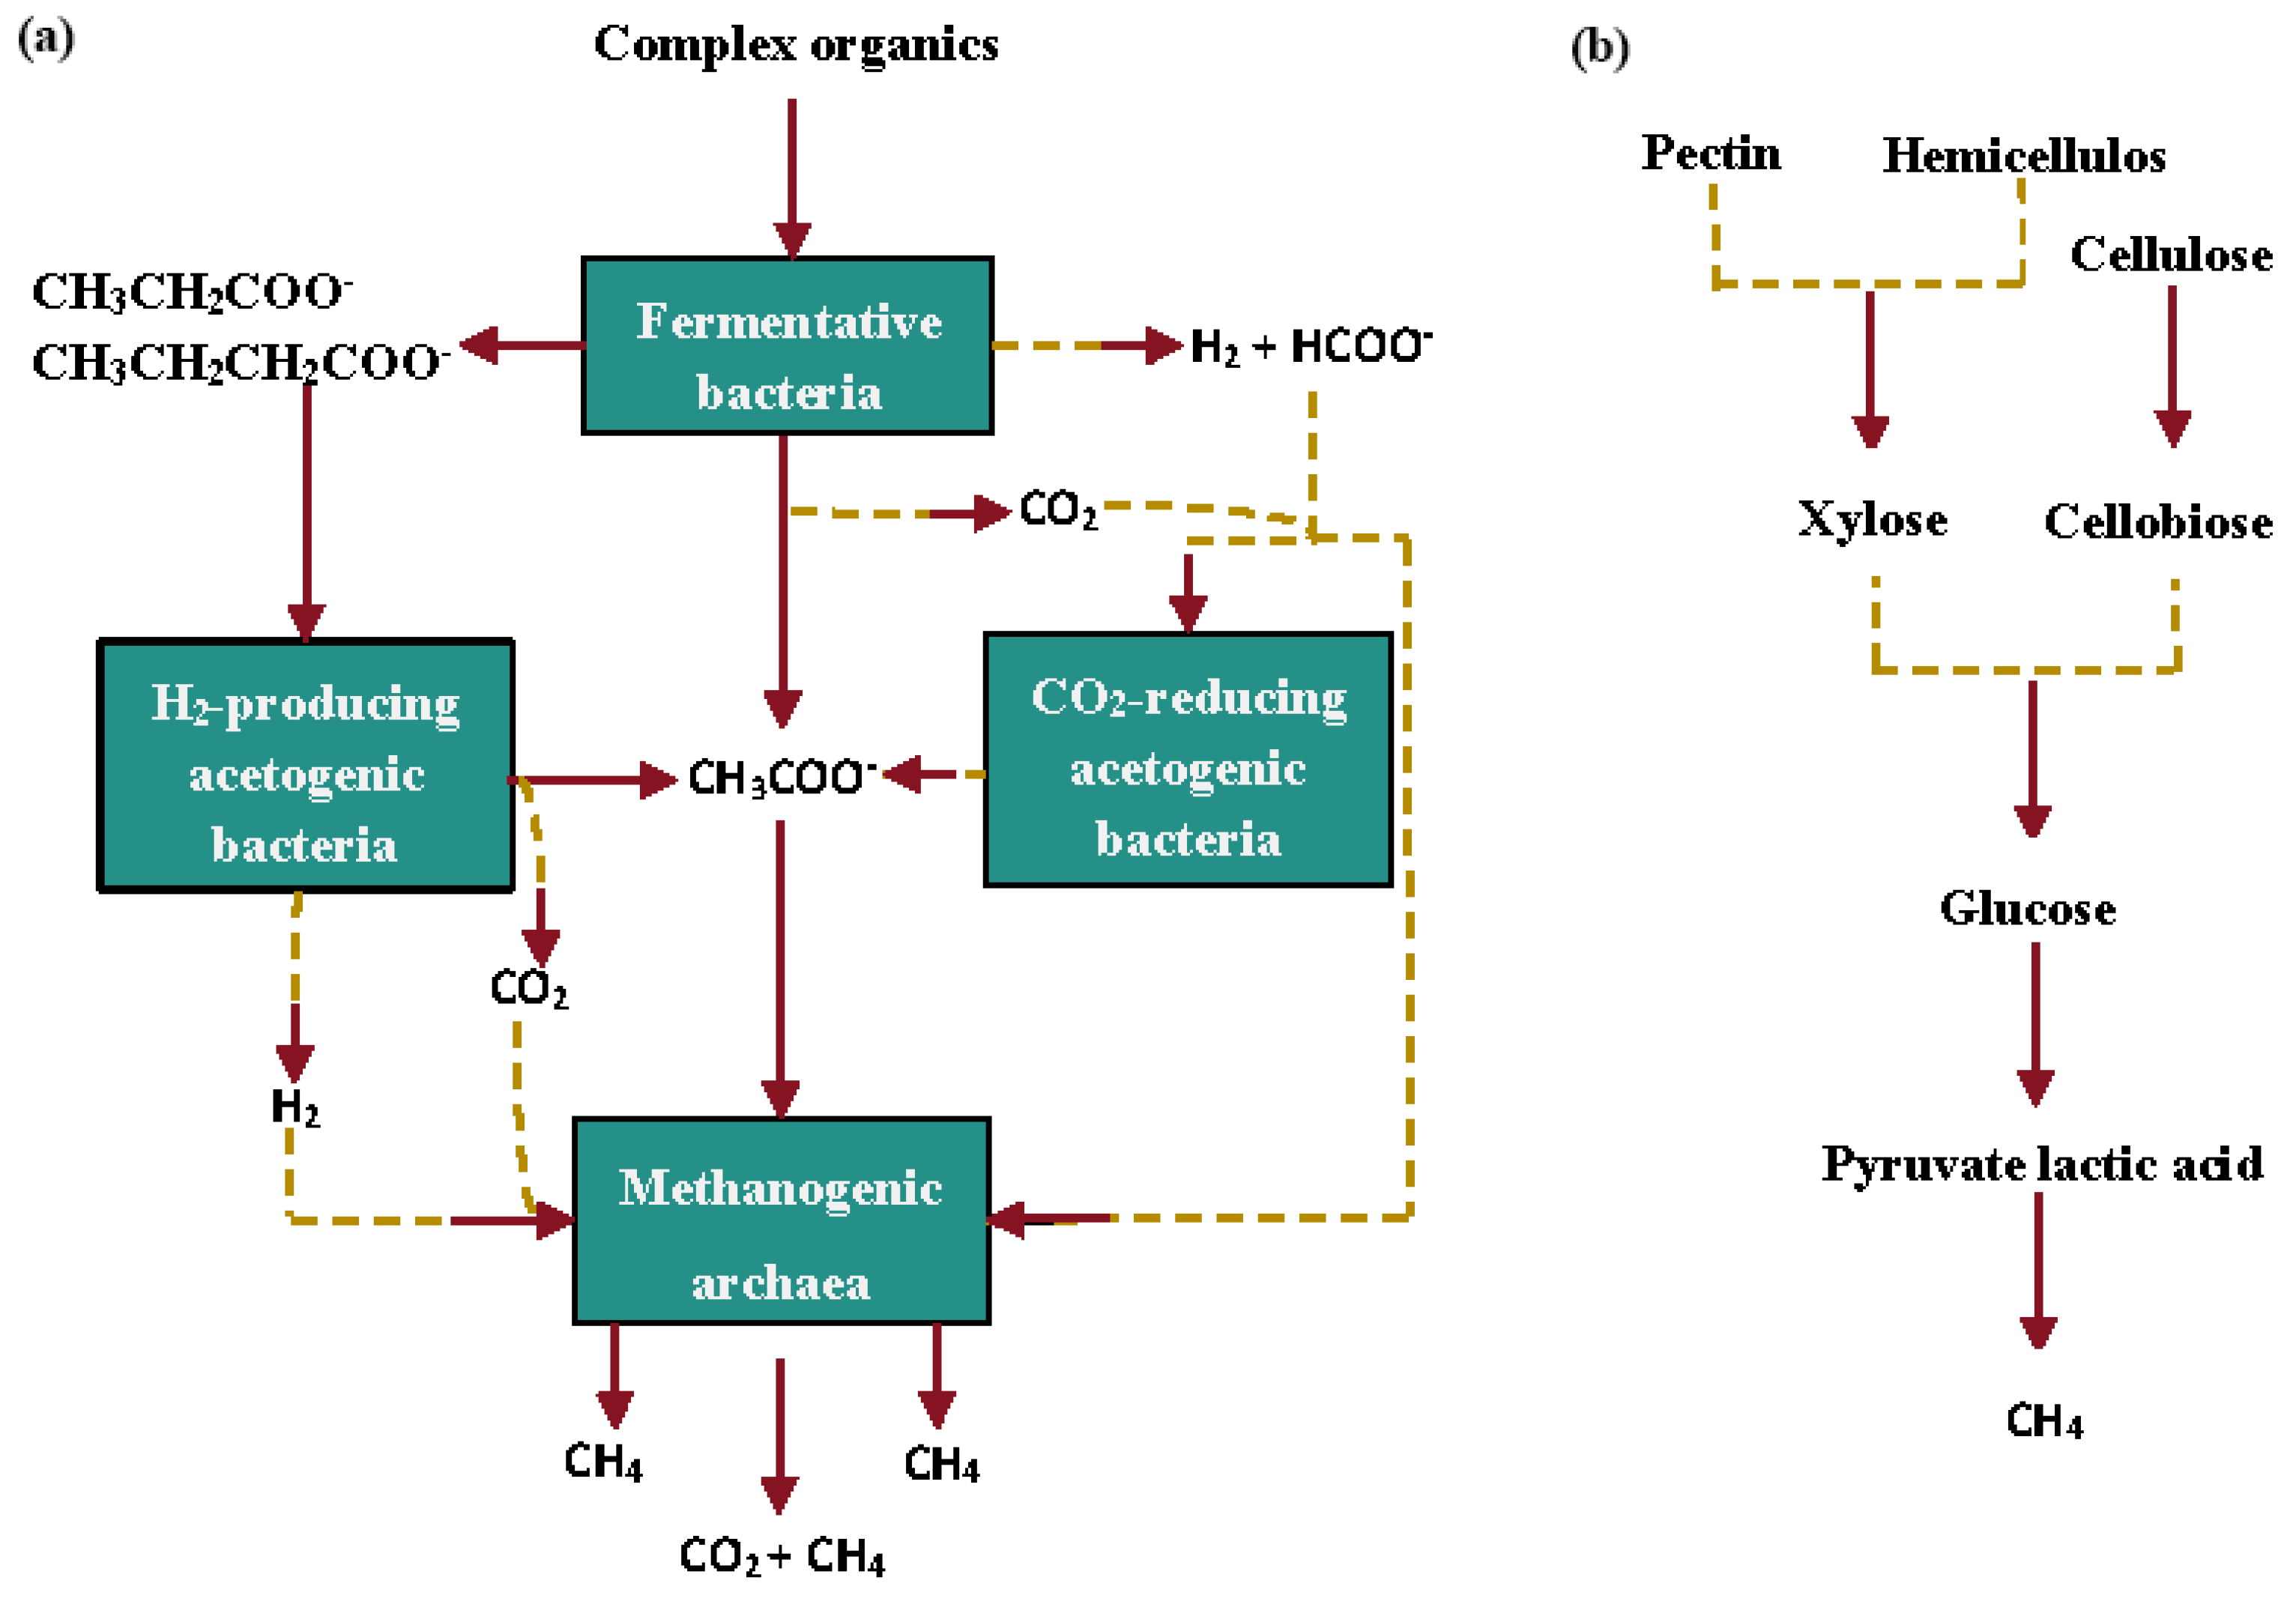
4.2. Stem Methane Emissions and Sources

There is growing evidence that CH4 fluxes from stems are one of the vital contributors to greenhouse gas emissions in forest ecosystems (Table 2). There might be more research on stem CH4 fluxes in temperate forests than in tropical forests, and extremely few studies on stem CH4 fluxes from subtropical forests have been reported. In forest ecosystems, there are obvious differences in stem CH4 fluxes from different tree species. Stem CH4 from Melaleuca quinquenervia may have largest CH4 emission rates, following by Fraxinus mandshurica (97,000–176,000 µg/m2/h), Amazon floodplain trees (16,700–103,000 µg/m2/h), Alnus (142.6–101,000 µg/m2/h), and Melaleuca quinquenervia (−55–225,916.2 µg/m2/h). Moreover, the majority of plants that emit methane are broad-leaved species, and only Chamaecyparis obtusa, Pinus sylvestris, and Taxodium distichum are known as needle-leaved species that emit methane through their stems. There are significant variations in stem methane fluxes of plants within the same genus but different species, exemplified by species Alnus glutinosa and Alnus japonica, Populus davidiana and Populus canadensis, Betula pubescens, and Betula pendula. There are also significant differences in methane fluxes from different stem heights, mainly showing that the methane flux gradually decreases as the height of the stem increases from the soil surface. It should be noted that stem CH4 fluxes from dead trees (1963.7 ± 385.7 µg/m2/h) are higher than living trees (177.5 ± 50.8 µg/m2/h).
Plant-mediated gas transport through the internal airspace of plant bodies makes the greatest contribution to the total CH4 flux from soil to the atmosphere [35]. The mechanism of “soil-stem-atmosphere” methane transport may be divided into “molecular diffusion” and “convective transport”. Molecular diffusion depends on the difference in methane gas concentration between the plant roots and the ground and between the plant body and the atmosphere. Methane gas migrates from a more concentrated area to a smaller one until the concentration of each part reaches equilibrium by molecular diffusion. Convective transport is driven by the pressure difference in the gas (mainly water vapor), and methane is transported with the flow of the gas. The methane transport efficiency of trees with a convective methane transport mechanism may be higher than that of trees with molecular diffusion. Meanwhile, the anaerobic environment in the heartwood of trees may contribute to the growth of methanogens and produce methane. It has been reported that methanogens are in the mature stem of poplar trees, and the dominant microbial community is mainly methanobacteriales [36]. Wang (2017) found that methanobacteria in poplar heartwood mainly produced CH4 by consuming CO2 using H2 as an electron donor through the 13CH4 isotope tracer method (hydrogenotrophic pathway, Figure 5a) [37]. In addition to the hydrogenotrophic pathway, methanogens also produce methane through the methylotrophic pathway and the aceticlastic methanogenesis pathway. The methylated substrates, such as methanol and methylated amine, may be used to produce CH4 by methanogens through the methylotrophic pathway. The aceticlastic methanogenesis pathway, which produces CH4 from acetate as a substrate, accounts for two-thirds of the total methane production and is the largest pathway of methane production [38].
In forest ecosystems, basidiomycetes other than methanogens in dead wood also produce and release methane during the process of decomposing wood, so the fluxes of methane produced and released by dead plants are more obvious than those of living trees. Furthermore, trees may produce CH4 through abiotic photochemical processes [39]. Some researchers have shown that pectin and cellulose released large amounts of methane when exposed to UV rays or temperatures above 80 °C [40]. However, other researchers have not found significant methane release from plants under aerobic conditions [41,42]. Therefore, different plant species may have different mechanisms of methane production. However, it is unclear how to isolate the methane-producing pathways and quantify the methane fluxes of these pathways.
Table 2. Tree stem methane emissions in different ecosystems.
Forest TypesStudy SitesSpeciesSurface (cm)Stem CH4 Fluxes (µg/m2/h)Citation
Temperate forest43°22′ N, 141°36′ EFraxinus mandshurica15–7097,000–17,6000[43]
Temperate forest34°58′ N, 136°0′ EChamaecyparis obtusa150−0.32–0.48[44]
Temperate forest61°51′ N, 24°17′ EPinus sylvestris15–200.013–0.100[20]
Tropical forest2°86′ S, 70°6′ WAmazon floodplain trees20–14016,700–103,000[8]
Temperate forest48.02°N, 7.96°EBeech trees40–20082.4–145.7[45]
Temperate forest35°54′ N, 76°9′ ETaxodium distichum30–80400 ± 100[46]
Subtropical forest17°27′ S, 140°48′ EAvicennia marina101963.7 ± 385 (dead tree)[47]
177.5 ± 50 (living tree)
Tropical forest9°06′ N, 79°54′ WHeisteria concinna30−156–598[48]
Tropical forest31°49′ S, 152°38′ EMelaleuca quinquenervia10–100−55–225,916.2[49]
Temperate forest39.41°N, 76.52°WCarya cordiformis50–150269.3–1504.8[50]
Subtropical forest23°55′ N, 117°25′EKandelia obovata10–115309.8 ± 174.2[51]
Temperate forest2° 35′ S, 113° 40′ EFagus sylvatica40−4.37–173.97[52]
Temperate forest52°0′ N, 00°28′ WAlnus glutinosa2–301940–101,000[53]
Temperate forest34°58′ N, 136°00′ EAlnus japonica10–45142.6–1963.7[54]
Temperate forest115°26′ E, 39°58′ NPopulus davidiana115–145202.1–331.6[55]
Temperate forest118°18′ E, 33°9′ NPopulus canadensis50–15067.0 ± 5.64[56]
Temperate forest61°51′ N, 24°17′ EBetula pubescens30−1.30–430[57]
Temperate forest52°27′ N, 1°54′ WBetula pendula30–15012.8 ± 34.5[58]

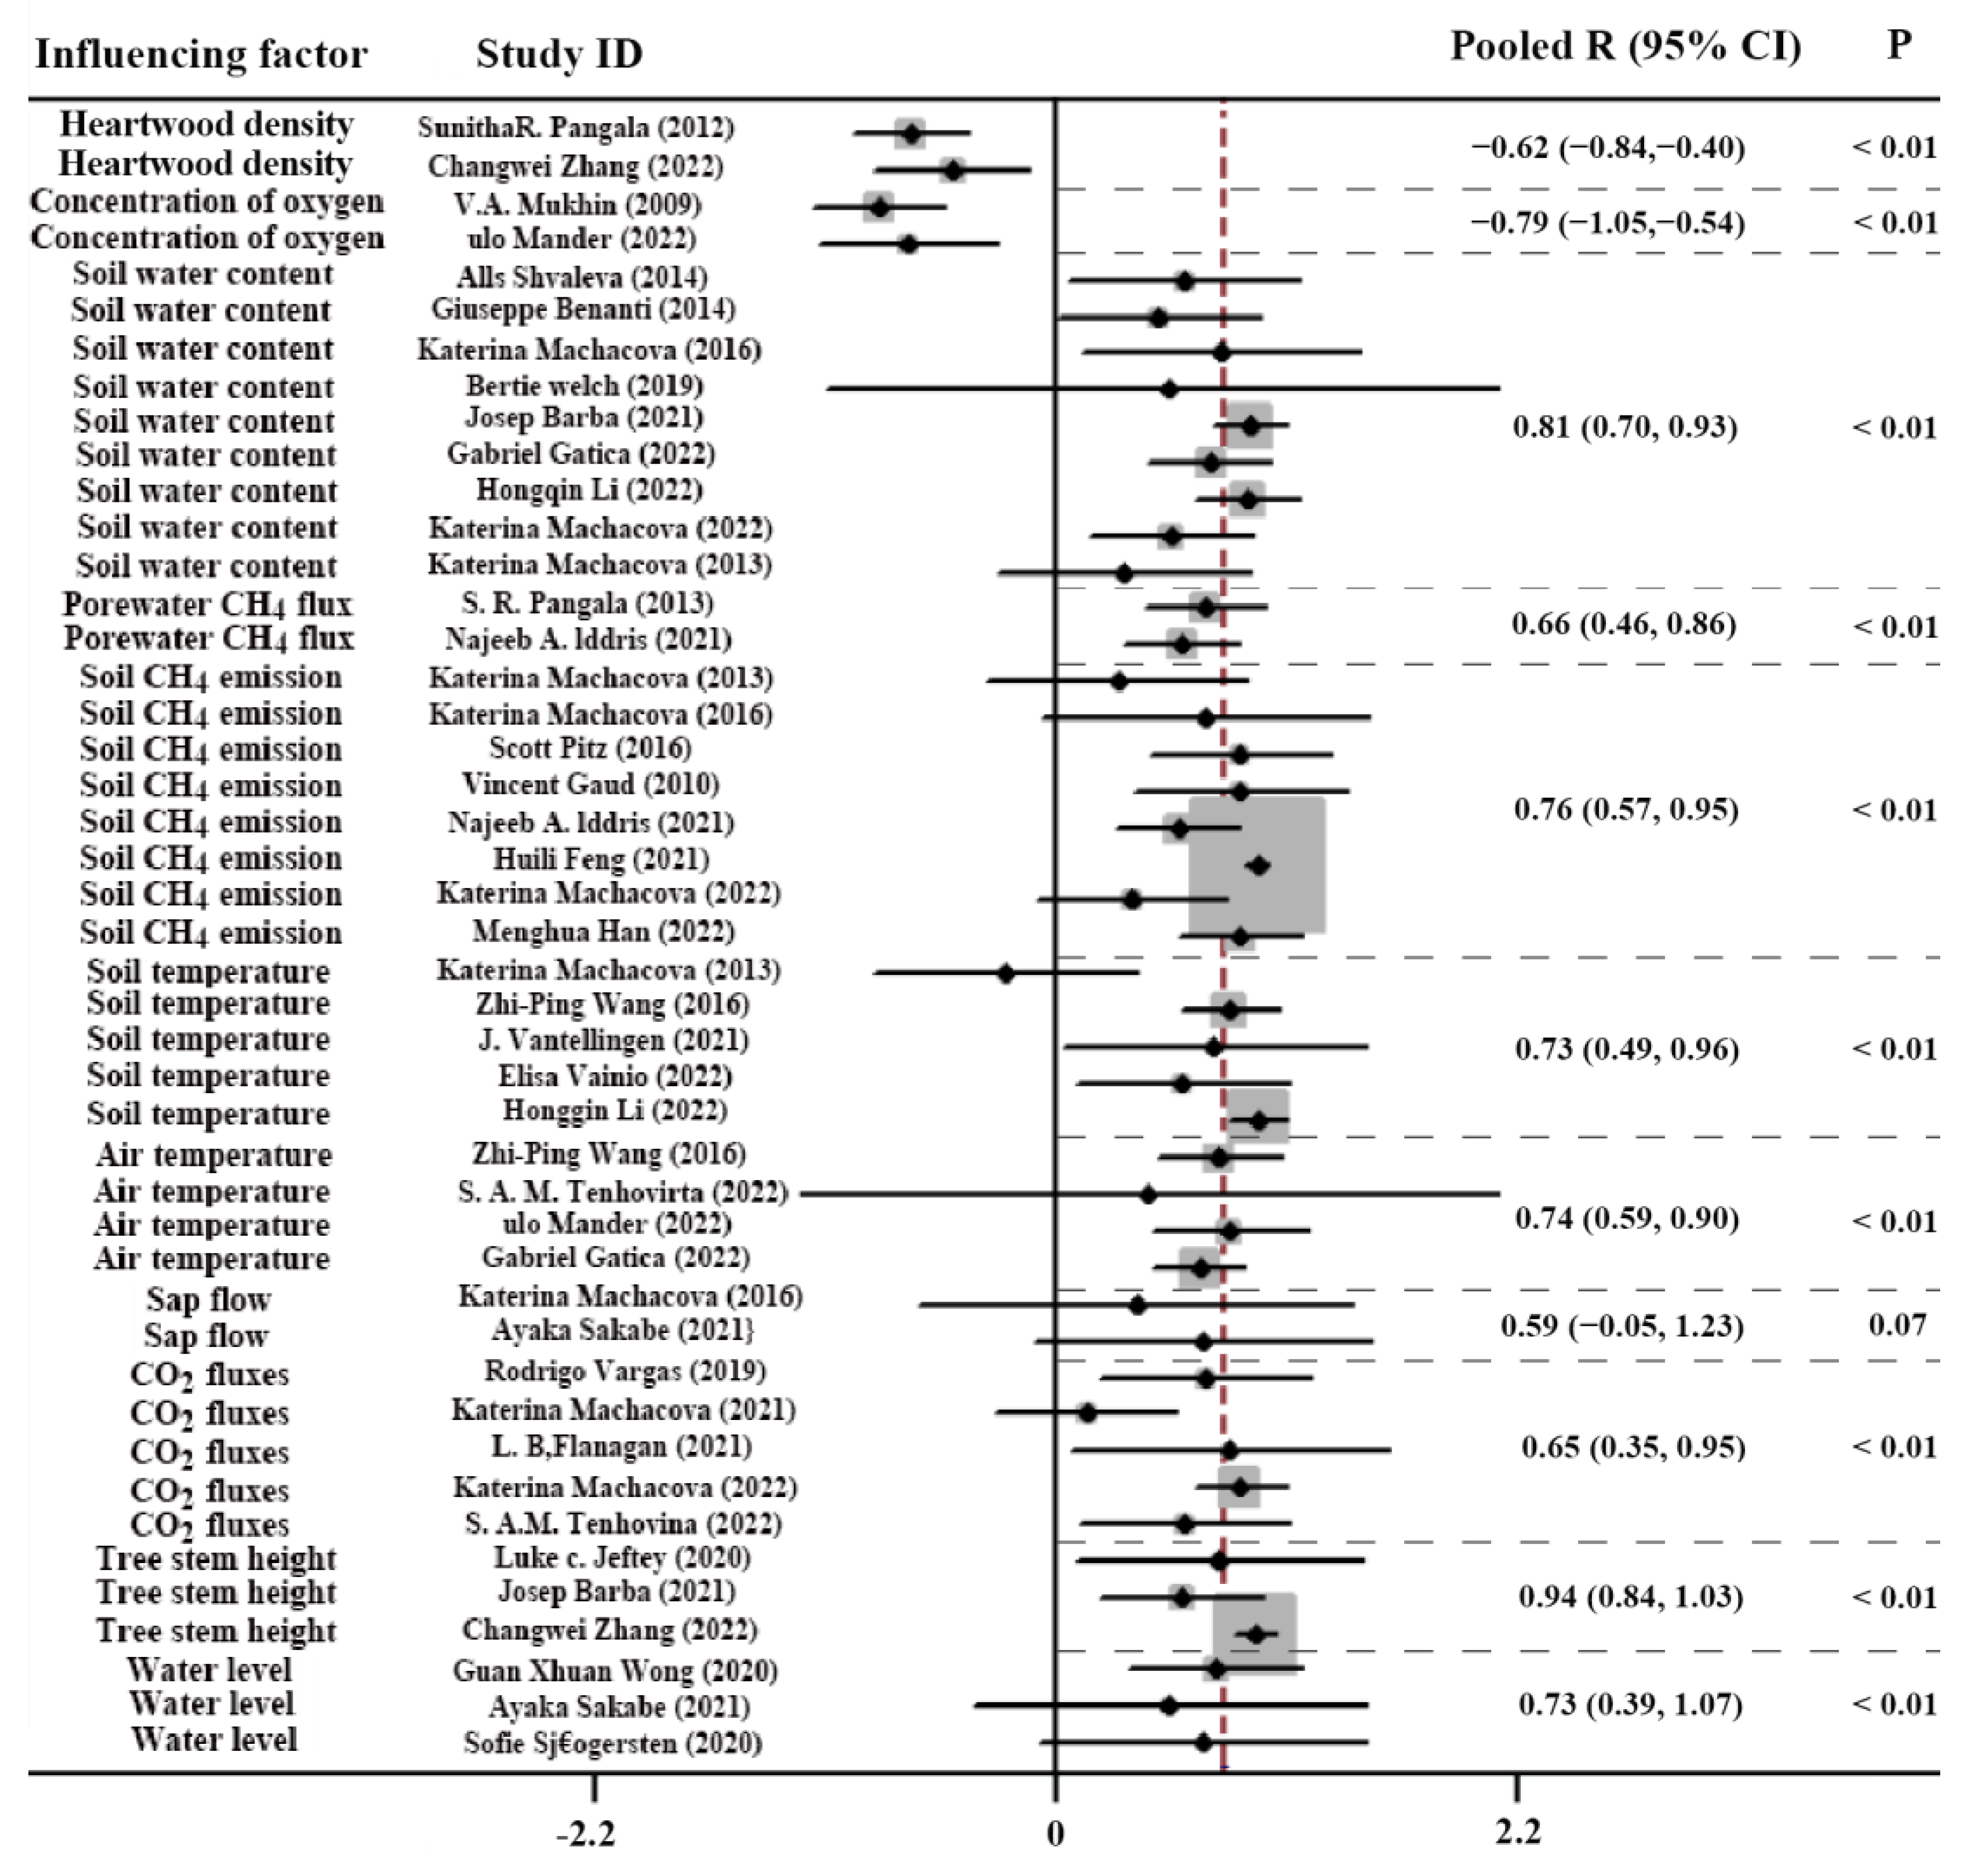
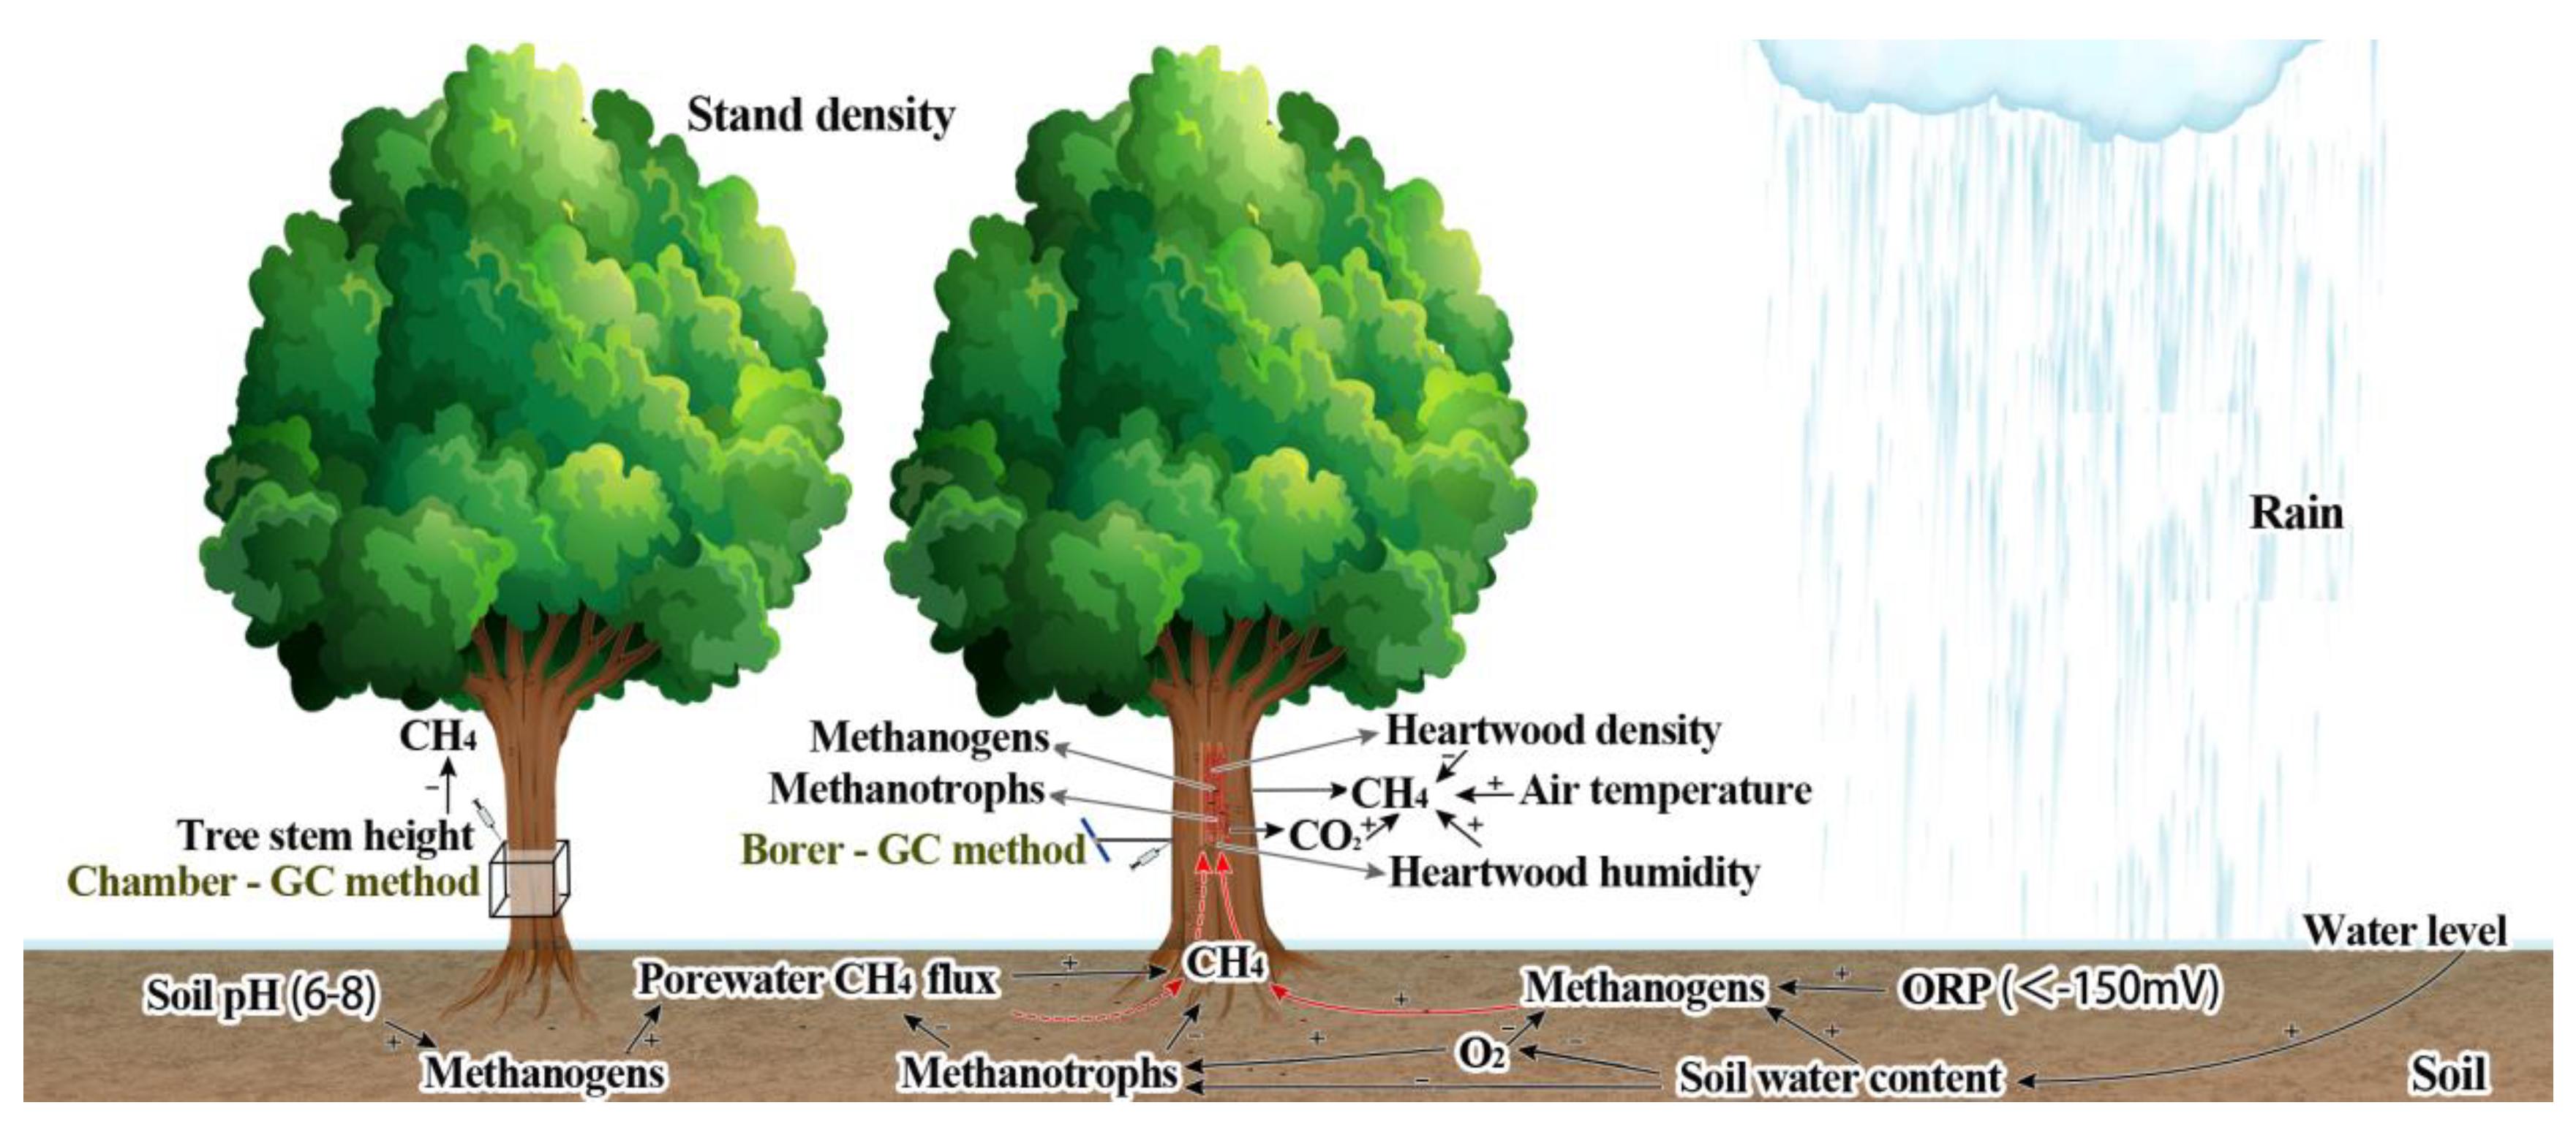
4.3. Driving Factors of Influencing Stem CH4 Emission

Based on established criteria for inclusion and exclusion, 45 studies were incorporated into the correlation coefficient “R” study by meta-analysis (Figure 6). The results showed that heartwood density, the concentration of oxygen, soil water content, porewater CH4 flux, soil CH4 emission, soil temperature, air temperatures, CO2 fluxes, tree stem height, and water level have a significant influence on tree stem methane emission (p < 0.01). In contrast, the impact of sap flow on tree methane emission was not statistically significant (p > 0.05).

4.3.1. Heartwood Density and Oxygen Concentration

Notably, heartwood density is a well-known indicator of wood functional traits and characteristics. Variations in heartwood density exist both within individual trees and among different trees, often influenced by ecophysiological factors such as flooding [74]. Lower/higher heartwood density may provide more/less effective pore space for CH4 diffusion [75]; thus, heartwood density has a significant negative effect on stem methane flux (Figure 7). However, the capacity for gas exchange between the interior of the stem and the atmosphere is reflected by stem lenticel density, and a high stem lenticel density will facilitate intense methane emissions from the stem. The influence of oxygen on stem methane emission is primarily due to exposure to O2, which directly suppresses methane production through O2 toxicity [76]. Meanwhile, methanotrophs grow through CH4 oxidation and O2 reduction, so the oxidation of methane may be promoted by oxygen, thereby reducing methane levels. The oxygen concentration can be influenced by water level, resulting in decreased oxygen flux or concentration, affecting anaerobic conditions favorable for methanogens.

4.3.2. Water Level, Soil Water Content, Soil CH4 Emission, and Porewater CH4 Flux

Water level can also affect methane production and oxidation by influencing other environmental factors such as temperature, soil moisture content, and heartwood humidity. Water level is the main controlling variable for soil CH4 and porewater CH4 consumption rate, which also makes stem methane emissions sensitive to changes in water depth [77]. Higher soil moisture content caused by the water level increases soil respiration and transpiration, leading to higher soil and porewater CH4 flux and, thereby, higher stem methane emissions. However, the soil diffusion rates may be decreased with height, resulting in decreased soil CH4 diffusion into the atmosphere, leading to more soil methane emissions through plant aeration tissues [78]. Moreover, the impact of soil moisture content on stem methane emissions is influenced by stand density; higher rainfall interception and transpiration under higher stand density lead to lower soil moisture content [79]. Therefore, stem methane emissions may be lower under higher stand density. Variations in soil moisture content directly cause changes in stem methane emissions, but the ultimate drivers are related to seasonal fluctuations in precipitation and evapotranspiration rates. During seasons with higher precipitation, methane production is favored while methane conversion is inhibited [80]. This is primarily because high precipitation maintains soil anaerobic conditions with a daily moisture content of around 0.33 cm³ cm³, which may promote the growth of methanogens, greatly exceeding the optimal soil moisture content for methane oxidation activity [64].

4.3.3. Temperatures, CO2 Fluxes, and Others

Seasonal changes in atmospheric and soil temperatures significantly affect methane production, oxidation, and transport. Lower temperatures decrease the microbial activity of methanogens and other microorganisms involved in methane fermentation, thus reducing methane emissions. Generally, microbial activity increases by a relative value of 1.3 to 28 for every 10 °C rise in temperature, with the optimal temperature for methane production by methanogens about 30 °C [81]. Furthermore, researchers also demonstrated a correlation between CH4 emissions and CO2 uptake. The carbon sources in methane primarily originate from carbon dioxide, particularly through the hydrogenotrophic pathway employed by methanogens, which might be highly sensitive to CO2 flux and concentration [82]. Plants primarily fix carbon sources through photosynthesis. The process of CH4 emissions may be partly associated with other light-driven physiological processes in trees, such as interactions with the photosynthesis-related serine cycle and carbon metabolism. In addition to the influencing factors analyzed in the meta-analysis, factors such as pH, the reduction–oxidation potential (ORP), and soil organic matter are also major determinants of the activity of methanogens and methanotrophs. For instance, the pH for the activity of methanogens generally ranges from 6 to 8, while for methanotrophs, it typically ranges from 5.5 to 6.5. The ORP is generally below −150 mV for methane production by methanogens [83]. In conclusion, stem methane emissions represent a complex biological or abiotic process, and there are significant spatial variations in stem methane emissions in different environments.

5. Conclusions and Perspectives

For the first time, the research progress and hot topics of stem methane emission have been described using bibliometric methods. Although many articles have reported the characteristics, influencing factors, and sources of stem methane emissions from certain tree species, the research in this field is still in its infancy due to the complexity of ecosystems. During 2006 and 2022, the United States was the most active country in this research area. However, the Chinese Academy of Sciences published the largest number of articles. In recent years, the research on stem methane emission by Vincent Gauci, Katerina Machacova, Zhi-Ping Wang, Kazuhiko Terazawa, Kristofer R. Covey, and Sunitha R. Pangala has had a significant impact and is worthy of attention from scholars. The hotspots mainly include the stem methane emission characteristics of different tree species in various forest types, the impact of environmental factors on stem methane emissions, and the methane sources. To accurately characterize the dynamics of CH4 in forest ecosystems, more effective monitoring and precise calculations of tree stem CH4 fluxes are required. However, there are knowledge gaps in the study of stem methane emissions that need to be filled.
Firstly, there is a need to develop and refine methods to distinguish and measure emissions from various sources (such as methane produced in the heartwood and soil methane fluxes), which is significant for devising strategies to reduce methane emissions and for forest management. Secondly, hydrological conditions influence the production and emission of stem methane. With climate change leading to altered rainfall patterns and volumes, accurately assessing the impact of floods on methane emissions is key to understanding the dynamics of stem methane emissions. Thirdly, microbial processes play a crucial role in stem methane emission, yet there is limited understanding of the microbial mechanisms of methane production in different tree species. Investigating how microbial communities affect the production and emission of methane is vital for understanding the complexities of methane cycling in forest soils and plant tissues. The resolution of these challenges will contribute to a better understanding of the global carbon cycle process and provide a scientific basis for the sustainable management of forest ecosystems.

Funding

This research was funded by the National Natural Science Foundation of China (No. 31100354 and No. 41571047), and Capacity Building Program of Local Colleges and Universities in Shanghai (No. 21010503300).

Conflicts of Interest

The authors declare that they have no known competing financial interests or personal relationships that could have appeared to influence the work reported in this paper.

References

  1. Insam, H.; Wett, B. Control of Ghg Emission at the Microbial Community Level. Waste Manag. 2008, 28, 699–706. [Google Scholar] [CrossRef] [PubMed]
  2. IPCC; Stocker, T.F.; Qin, D.; Plattner, G.K.; Midgley, P.M. The physical science basis. In Contribution of Working Group I to the Fifth Assessment Report of the Intergovernmental Panel on Climate Change; Cambridge University Press: Cambridge, UK; New York, NY, USA, 2013. [Google Scholar]
  3. Saunois, M.; Stavert, A.R.; Poulter, B.; Bousquet, P.; Zhuang, Q. The Global Methane Budget 2000–2017. Earth Syst. Sci. Data 2020, 12, 1561–1623. [Google Scholar] [CrossRef]
  4. Mer, J.L.; Roger, P. Production, oxidation, emission and consumption of methane by soils: A review. Eur. J. Soil. Biol. 2010, 37, 25–50. [Google Scholar] [CrossRef]
  5. Dlugokencky, E.J.; Nisbet, E.G.; Fisher, R.; Lowry, D. Global atmospheric methane: Budget, changes and dangers. Philos. Trans. R. Soc. A Math. Phys. Eng. Sci. 2011, 369, 2058–2072. [Google Scholar] [CrossRef] [PubMed]
  6. Jeffrey, L.C.; Maher, D.T.; Tait, D.R.; Euler, S.; Johnston, S.G. Tree stem methane emissions from subtropical lowland forest (Melaleuca quinquenervia) regulated by local and seasonal hydrology. Biogeochemistry 2020, 151, 273–290. [Google Scholar] [CrossRef]
  7. Barba, J.; Curiel Yuste, J.; Poyatos, R.; Janssens, I.A.; Lloret, F. Strong resilience of soil respiration components to drought-induced die-off resulting in forest secondary succession. Oecologia 2016, 182, 27–41. [Google Scholar] [CrossRef] [PubMed]
  8. Pangala, S.R.; Enrich-Prast, A.; Basso, L.S.; Peixoto, R.B.; Bastviken, D.; Hornibrook, E.R.C.; Gatti, L.V.; Marotta, H.; Calazans LS, B.; Sakuragui, C.M.; et al. Large emissions from floodplain trees close the Amazon methane budget. Nature 2017, 552, 230–234. [Google Scholar] [CrossRef] [PubMed]
  9. Plain, C.; Epron, D. Pulse labelling of deep soil layers in forest with 13CH4: Testing a new method for tracing methane in the upper horizons, understorey vegetation and tree stems using laser-based spectrometry. Biogeochemistry 2021, 153, 215–222. [Google Scholar] [CrossRef]
  10. Smits, K.M.; Grant, D.S.; Johnston, S.E.; Bogard, M.J.; Rood, S.B.; Selinger, L.B.; Flanagan, L.B. Riparian Cottonwood Trees and Adjacent River Sediments have Different Microbial Communities and Produce Methane with Contrasting Carbon Isotope Compositions. J. Geophys. Res.-Biogeosci. 2022, 127, e2021JG006699. [Google Scholar] [CrossRef]
  11. Keppler, F.; Hamilton, J.T.G.; Braß, M.; Röckmann, T. Methane emissions from terrestrial plants under aerobic conditions. Nature 2006, 439, 187–191. [Google Scholar] [CrossRef]
  12. Barba, J.; Bradford, M.A.; Brewer, P.E.; Bruhn, D.; Covey, K.; Haren, J.; Megonigal, J.P.; Mikkelsen, T.N.; Pangala, S.R.; Pihlatie, M.; et al. Methane emissions from tree stems: A new frontier in the global carbon cycle. New Phytol. 2019, 222, 18–28. [Google Scholar] [CrossRef] [PubMed]
  13. Bao, T.; Jia, G.; Xu, X. Wetland Heterogeneity Determines Methane Emissions: A Pan-Arctic Synthesis. Environ. Sci. Technol. 2021, 55, 10152–10163. [Google Scholar] [CrossRef]
  14. Carmichael, M.J.; Bernhardt, E.S.; Bräuer, S.L.; Smith, W.K. The role of vegetation in methane flux to the atmosphere: Should vegetation be included as a distinct category in the global methane budget? Biogeochemistry 2014, 119, 1–24. [Google Scholar] [CrossRef]
  15. Davidson, E.A.; Nepstad, D.C.; Ishida, F.Y.; Brando, P.M. Effects of an experimental drought and recovery on soil emissions of carbon dioxide, methane, nitrous oxide, and nitric oxide in a moist tropical forest. Glob. Chang. Biol. 2008, 14, 2582–2590. [Google Scholar] [CrossRef]
  16. Gatica, G.; Fernandez, M.E.; Juliarena, M.P.; Gyenge, J. Does forest management affect the magnitude and direction of the afforestation effect on soil methane fluxes? A meta-analysis. For. Ecol. Manag. 2022, 507, 120009. [Google Scholar] [CrossRef]
  17. Gauci, V.; Figueiredo, V.; Gedney, N.; Pangala, S.R.; Stauffer, T.; Weedon, G.P.; Enrich-Prast, A. Non-flooded riparian Amazon trees are a regionally significant methane source. Philos. Trans. R. Soc. A-Math. Phys. Eng. Sci. 2022, 380, 20200446. [Google Scholar] [CrossRef] [PubMed]
  18. Jeffrey, L.C.; Maher, D.T.; Tait, D.R.; Reading, M.J.; Chiri, E.; Greening, C.; Johnston, S.G. Isotopic evidence for axial tree stem methane oxidation within subtropical lowland forests. New Phytol. 2021, 230, 2200–2212. [Google Scholar] [CrossRef] [PubMed]
  19. Norwood, M.J.; Ward, N.D.; McDowell, N.G.; Myers-Pigg, A.N.; Bond-Lamberty, B.; Indivero, J.; Pennington, S.; Wang, W.Z.; Kirwan, M.; Hopple, A.M.; et al. Coastal Forest Seawater Exposure Increases Stem Methane Concentration. J. Geophys. Res.-Biogeosci. 2021, 126, e2020JG005915. [Google Scholar] [CrossRef]
  20. Machacova, K.; Back, J.; Vanhatalo, A.; Halmeenmaki, E.; Kolari, P.; Mammarella, I.; Pumpanen, J.; Acosta, M.; Urban, O.; Pihlatie, M. Pinus sylvestris as a missing source of nitrous oxide and methane in boreal forest. Sci. Rep. 2016, 6, 23410. [Google Scholar] [CrossRef]
  21. Rusch, H.F.F.A.; Rennenberg, H. Black Alder (Alnus Glutinosa (L.) Gaertn.) Trees Mediate Methane and Nitrous Oxide Emission from the Soil to the Atmosphere. Plant Soil 1998, 201, 1–7. [Google Scholar] [CrossRef]
  22. Zhi, W.; Yuan, L.; Ji, G.; Liu, Y.; Cai, Z.; Chen, X. A bibliometric review on carbon cycling research during 1993–2013. Environ. Earth Sci. 2015, 74, 6065–6075. [Google Scholar] [CrossRef]
  23. Pritchard, A. Statistical bibliography or bibliometrics? J. Doc. 1969, 25, 348–349. [Google Scholar]
  24. Zhu, E.; Qi, Q.; Sha, M. Identify the effects of urbanization on carbon emissions (EUCE): A global scientometric visualization analysis from 1992 to 2018. Environ. Sci. Pollut. Res. 2021, 28, 31358–31369. [Google Scholar] [CrossRef] [PubMed]
  25. Borgman, C.L.; Furner, J. Scholarly communication and bibliometrics. Annu. Rev. Inf. Sci. Technol. 2002, 36, 1–53. [Google Scholar] [CrossRef]
  26. Zhang, C.; Xu, T.; Feng, H.; Chen, S. Greenhouse Gas Emissions from Landfills: A Review and Bibliometric Analysis. Sustainability 2019, 11, 2282. [Google Scholar] [CrossRef]
  27. Yılmaz, Y.; Seyis, S. Mapping the scientific research of the life cycle assessment in the construction industry: A scientometric analysis. Build. Environ. 2021, 204, 108086. [Google Scholar] [CrossRef]
  28. Wei, F.; Grubesic, T.H.; Bishop, B.W. Exploring the GIS Knowledge Domain Using CiteSpace. Prof. Geogr. 2015, 67, 374–384. [Google Scholar] [CrossRef]
  29. Jarvis, P. Environmental technology for the sustainable development goals (SDGs). Environ. Technol. 2020, 41, 2155–2156. [Google Scholar] [CrossRef] [PubMed]
  30. Niu, L.; Zhao, X.; Wu, F.; Tang, Z.; Lv, H.; Wang, J.; Fang, M.; Giesy, J.P. Hotpots and trends of covalent organic frameworks (COFs) in the environmental and energy field: Bibliometric analysis. Sci. Total Environ. 2021, 783, 146838. [Google Scholar] [CrossRef]
  31. de Castilhos Ghisi, N.; Zuanazzi, N.R.; Fabrin TM, C.; Oliveira, E.C. Glyphosate and its toxicology: A scientometric review. Sci. Total Environ. 2020, 733, 139359. [Google Scholar] [CrossRef]
  32. Wang, Z.; Li, H.; Wu, H.; Han, S.; Huang, J.; Zhang, X.; Han, X. Methane Concentration in the Heartwood of Living Trees and Estimated Methane Emission on Stems in Upland Forests. Ecosystems 2021, 24, 1485–1499. [Google Scholar] [CrossRef]
  33. Pitz, S.; Megonigal, J.P. Temperate forest methane sink diminished by tree emissions. New Phytol. 2017, 214, 1432–1439. [Google Scholar] [CrossRef] [PubMed]
  34. Soosaar, K.; Schindler, T.; Machacova, K.; Pärn, J.; Fachín-Malaverri, L.M.; Rengifo-Marin, J.E.; Alegría-Muñoz, W.; Jibaja-Aspajo, J.L.; Negron-Juarez, R.; Zárate-Gómez, R.; et al. High Methane Emission from Palm Stems and Nitrous Oxide Emission from the Soil in a Peruvian Amazon Peat Swamp Forest. Front. For. Glob. Chang. 2022, 5, 849186. [Google Scholar] [CrossRef]
  35. Terazawa, K.; Yamada, K.; Ohno, Y.; Sakata, T.; Ishizuka, S. Spatial and temporal variability in methane emissions from tree stems of Fraxinus mandshurica in a cool-temperate floodplain forest. Biogeochemistry 2015, 123, 349–362. [Google Scholar] [CrossRef]
  36. Yip, D.Z.; Veach, A.M.; Yang, Z.K.; Cregger, M.A.; Schadt, C.W. Methanogenic Archaea dominate mature heartwood habitats of Eastern Cottonwood (Populus deltoides). New Phytol. 2019, 222, 115–121. [Google Scholar] [CrossRef] [PubMed]
  37. Wang, Z.P.; Han, S.J.; Li, H.L.; Deng, F.D.; Zheng, Y.H.; Liu, H.F.; Han, X.G. Methane Production Explained Largely by Water Content in the Heartwood of Living Trees in Upland Forests. J. Geophys. Res. Biogeosci. 2017, 122, 2479–2489. [Google Scholar] [CrossRef]
  38. Feng, H.; Guo, J.; Han, M.; Wang, W.; Peng, C.; Jin, J.; Song, X.; Yu, S. A review of the mechanisms and controlling factors of methane dynamics in forest ecosystems. For. Ecol. Manag. 2020, 455, 117702. [Google Scholar] [CrossRef]
  39. Crutzen, P.J.; Sanhueza, E.; Brenninkmeijer, C. Methane production from mixed tropical savanna and forest vegetation in Venezuela. Atmos. Chem. Phys. Discuss. 2006, 6, 3093–3097. [Google Scholar]
  40. McLeod, A.R.; Fry, S.C.; Loake, G.J.; Messenger, D.J.; Reay, D.S.; Smith, K.A.; Yun, B.W. Ultraviolet radiation drives methane emissions from terrestrial plant pectins. New Phytol. 2008, 180, 124–132. [Google Scholar] [CrossRef]
  41. Kirschbaum MU, F.; Walcroft, A. No detectable aerobic methane efflux from plant material, nor from adsorption/desorption processes. Biogeosciences 2008, 5, 1551–1558. [Google Scholar] [CrossRef]
  42. Dueck, T.A.; De Visser, R.; Poorter, H.; Persijn, S.; Gorissen, A.; De Visser, W.; Schapendonk, A.; Verhagen, J.; Snel, J.; Harren FJ, M.; et al. No evidence for substantial aerobic methane emission by terrestrial plants: A 13C-labelling approach. New Phytol. 2007, 175, 29–35. [Google Scholar] [CrossRef] [PubMed]
  43. Terazawa, K.; Ishizuka, S.; Sakata, T.; Yamada, K.; Takahashi, M. Methane emissions from stems of Fraxinus mandshurica var. japonica trees in a floodplain forest. Soil. Biol. Biochem. 2007, 39, 2689–2692. [Google Scholar] [CrossRef]
  44. Takahashi, K.; Kosugi, Y.; Kanazawa, A.; Sakabe, A. Automated closed-chamber measurements of methane fluxes from intact leaves and trunk of Japanese cypress. Atmos. Environ. 2012, 51, 329–332. [Google Scholar] [CrossRef]
  45. Maier, M.; Machacova, K.; Lang, F.; Svobodova, K.; Urban, O. Combining soil and tree-stem flux measurements and soil gas profiles to understand CH4 pathways in Fagus sylvatica forests. J. Plant Nutr. Soil. Sci. 2018, 181, 31–35. [Google Scholar] [CrossRef]
  46. Mary, J.C.; Joseph, C.W.; William, K.S. Water Source Utilization in Taxodium distichum (L.) Rich. (baldcypress) over the Course of a Growing Season in a Restored Coastal Freshwater Wetland Vulnerable to Saltwater Incursion. Castanea 2018, 83, 272–287. [Google Scholar]
  47. Jeffrey, L.C.; Reithmaier, G.; Sippo, J.Z.; Johnston, S.G.; Tait, D.R.; Harada, Y.; Maher, D.T. Are methane emissions from mangrove stems a cryptic carbon loss pathway? Insights from a catastrophic forest mortality. New Phytol. 2019, 224, 146–154. [Google Scholar] [CrossRef] [PubMed]
  48. Welch, B.; Gauci, V.; Sayer, E.J. Tree stem bases are sources of CH4 and N2O in a tropical forest on upland soil during the dry to wet season transition. Glob. Chang. Biol. 2018, 25, 361–372. [Google Scholar] [CrossRef] [PubMed]
  49. Jeffrey, L.C.; Maher, D.T.; Tait, D.R.; Johnston, S.G. A Small Nimble In Situ Fine-Scale Flux Method for Measuring Tree Stem Greenhouse Gas Emissions and Processes (S.N.I.F.F). Ecosystems 2020, 23, 1676–1689. [Google Scholar] [CrossRef]
  50. Hill, A.C.; Barba, J.; Hom, J.; Vargas, R. Patterns and drivers of multi-annual CO2 emissions within a temperate suburban neighborhood. Biogeochemistry 2021, 152, 35–50. [Google Scholar]
  51. Zhang, Q.; Tang, J.; Angel, R.; Wang, D.; Hu, X.Y.; Gao, S.H.; Zhang, L.; Tang, Y.X.; Zhang, X.D.; Koide, R.T.; et al. Soil Properties Interacting with Microbial Metagenome in Decreasing CH4 Emission from Seasonally Flooded Marshland following Different Stages of Afforestation. Front. Microbiol. 2022, 13, 830019. [Google Scholar] [CrossRef]
  52. Pangala, S.R.; Moore, S.; Hornibrook, E.R.C.; Gauci, V. Trees are major conduits for methane egress from tropical forested wetlands. New Phytol. 2013, 197, 524–531. [Google Scholar] [CrossRef] [PubMed]
  53. Gauci, V.; Gowing, D.J.G.; Hornibrook, E.R.C.; Davis, J.M.; Dise, N.B. Woody stem methane emission in mature wetland alder trees. Atmos. Environ. 2010, 44, 2157–2160. [Google Scholar] [CrossRef]
  54. Sakabe, A.; Takahashi, K.; Azuma, W.; Itoh, M.; Tateishi, M.; Kosugi, Y. Controlling Factors of Seasonal Variation of Stem Methane Emissions from Alnus japonica in a Riparian Wetland of a Temperate Forest. J. Geophys. Res. Biogeosci. 2021, 126, e2021JG006326. [Google Scholar] [CrossRef]
  55. Wang, Z.P.; Gu, Q.; Deng, F.D.; Huang, J.H.; Megonigal, J.P.; Yu, Q.; Lu, X.T.; Li, L.H.; Chang, S.; Zhang, Y.H.; et al. Methane emissions from the trunks of living trees on upland soils. New Phytol. 2016, 211, 429–439. [Google Scholar] [CrossRef] [PubMed]
  56. Han, M.; Feng, H.; Peng, C.; Lei, X.; Xue, J.; Malghani, S.; Ma, X.; Song, X.; Wang, W.; Sevanto, S. Spatiotemporal patterns and drivers of stem methane flux from two poplar forests with different soil textures. Tree Physiol. 2022, 42, 2454. [Google Scholar] [CrossRef] [PubMed]
  57. Vainio, E.; Haikarainen, I.P.; Machacova, K.; Putkinen, A.; Santalahti, M.; Koskinen, M.; Fritze, H.; Tuomivirta, T.; Pihlatie, M. Soil-tree-atmosphere CH4 flux dynamics of boreal birch and spruce trees during spring leaf-out. Plant Soil 2022, 478, 391–407. [Google Scholar] [CrossRef]
  58. Fraser-McDonald, A.; Boardman, C.; Gladding, T.; Burnley, S.; Gauci, V. Methane emissions from forested closed landfill sites: Variations between tree species and landfill management practices. Sci. Total Environ. 2022, 838, 156019. [Google Scholar] [CrossRef] [PubMed]
  59. Mukhin, V.A.; Voronin, P.Y. Methanogenic Activity of Woody Debris. Russ. J. Ecol. 2009, 40, 149–153. [Google Scholar] [CrossRef]
  60. Mander, Ü.; Krasnova, A.; Schindler, T.; Megonigal, J.P.; Escuer-Gatius, J.; Espenberg, M.; Machacova, K.; Maddison, M.; Pärn, J.; Ranniku, R.; et al. Long-Term Dynamics of Soil, Tree Stem and Ecosystem Methane Fluxes in a Riparian Forest. Sci. Total Environ. 2022, 809, 151723. [Google Scholar] [CrossRef]
  61. Shvaleva, A.; Siljanen, H.M.P.; Correia, A.; Costa Esilva, F.; Lamprecht, R.E.; Lobo-do-Vale, R.; Bicho, C.; Fangueiro, D.; Anderson, M.; Pereira, J.S.; et al. Environmental and Microbial Factors Influencing Methane and Nitrous Oxide Fluxes in Mediterranean Cork Oak Woodlands: Trees Make a Difference. Front. Microbiol. 2015, 6, 1104. [Google Scholar] [CrossRef]
  62. Benanti, G.; Saunders, M.; Tobin, B.; Osborne, B. Contrasting Impacts of Afforestation on Nitrous Oxide and Methane Emissions. Agric. For. Meteorol. 2014, 198–199, 82–93. [Google Scholar] [CrossRef]
  63. Barba, J.; Poyatos, R.; Capooci, M.; Vargas, R. Spatiotemporal Variability and Origin of CO2 and CH4 Tree Stem Fluxes in an Upland Forest. Glob. Change Biol. 2021, 27, 4879–4893. [Google Scholar] [CrossRef]
  64. Li, H.; Zhu, J.; Zhang, F.; Qin, G.; Yang, Y.; Li, Y.; Wang, J.; Cao, G.; Li, Y.; Zhou, H.; et al. The Predominance of Nongrowing Season Emissions to the Annual Methane Budget of a Semiarid Alpine Meadow on the Northeastern Qinghai-Tibetan Plateau. Ecosystems 2022, 25, 526–536. [Google Scholar] [CrossRef]
  65. Machacova, K.; Warlo, H.; Svobodová, K.; Agyei, T.; Uchytilová, T.; Horáček, P.; Lang, F. Methane Emission from Stems of European Beech (Fagus Sylvatica) Offsets as Much as Half of Methane Oxidation in Soil. New Phytol. 2022, 238, 584–597. [Google Scholar] [CrossRef]
  66. Katerina, M.; Hans, P.; Jürgen, K.; Heinz, R. Inundation Strongly Stimulates Nitrous Oxide Emissions from Stems of the Upland Tree Fagus Sylvatica and the Riparian Tree Alnus Glutinosa. Plant Soil. 2013, 364, 287–301. [Google Scholar]
  67. Iddris, N.A.; Corre, M.D.; van Straaten, O.; Tchiofo Lontsi, R.; Veldkamp, E. Substantial Stem Methane Emissions from Rainforest and Cacao Agroforest Partly Negate Soil Uptake in the Congo Basin. J. Geophys. Res. Biogeosci. 2021, 126, e2021JG006312. [Google Scholar] [CrossRef]
  68. Feng, H.; Guo, J.; Ma, X.; Han, M.; Kneeshaw, D.; Sun, H.; Malghani, S.; Chen, H.; Wang, W. Methane Emissions May be Driven by Hydrogenotrophic Methanogens Inhabiting the Stem Tissues of Poplar. New Phytol. 2022, 233, 182–193. [Google Scholar] [CrossRef]
  69. Vantellingen, J.; Thomas, S.C. Log Landings are Methane Emission Hotspots in Managed Forests. Can. J. For. Res. 2021, 51, 1916–1925. [Google Scholar] [CrossRef]
  70. Tenhovirta, S.A.M.; Kohl, L.; Koskinen, M.; Patama, M.; Lintunen, A.; Zanetti, A.; Lilja, R.; Pihlatie, M. Solar Radiation Drives Methane Emissions from the Shoots of Scots Pine. New Phytol. 2022, 235, 66–77. [Google Scholar] [CrossRef] [PubMed]
  71. Flanagan, L.B.; Nikkel, D.J.; Scherloski, L.M.; Tkach, R.E.; Smits, K.M.; Selinger, L.B.; Rood, S.B. Multiple Processes Contribute to Methane Emission in a Riparian Cottonwood Forest Ecosystem. New Phytol. 2021, 229, 1970–1982. [Google Scholar] [CrossRef]
  72. Wong, G.X.; Hirata, R.; Hirano, T.; Kiew, F.; Aeries, E.B.; Musin, K.K.; Waili, J.W.; Lo, K.S.; Melling, L. How Do Land Use Practices Affect Methane Emissions from Tropical Peat Ecosystems? Agric. For. Meteorol. 2020, 282–283, 107869. [Google Scholar] [CrossRef]
  73. Sjögersten, S.; Siegenthaler, A.; Lopez, O.R.; Aplin, P.; Turner, B.; Gauci, V. Methane Emissions from Tree Stems in Neotropical Peatlands. New Phytol. 2020, 225, 769–781. [Google Scholar] [CrossRef] [PubMed]
  74. Schindler, T.; Mander, Ü.; Machacova, K.; Espenberg, M.; Krasnov, D.; Escuer-Gatius, J.; Veber, G.; Pärn, J.; Soosaar, K. Short-term flooding increases CH4 and N2O emissions from trees in a riparian forest soil-stem continuum. Sci. Rep. 2020, 10, 3204. [Google Scholar] [CrossRef] [PubMed]
  75. Li, H.; Zhang, X.; Deng, F.; Han, X.; Xiao, C.; Han, S.; Wang, Z. Microbial methane production is affected by secondary metabolites in the heartwood of living trees in upland forests. Trees 2020, 34, 243–254. [Google Scholar] [CrossRef]
  76. Megonigal, J.P.; Guenther, A.B. Methane emissions from upland forest soils and vegetation. Tree Physiol. 2008, 28, 491–498. [Google Scholar] [CrossRef] [PubMed]
  77. Moldaschl, E.; Kitzler, B.; Machacova, K.; Schindler, T.; Schindlbacher, A. Stem Ch4 and N2O Fluxes of Fraxinus Excelsior and Populus Alba Trees Along a Flooding Gradient. Plant Soil 2021, 461, 407–420. [Google Scholar] [CrossRef]
  78. von Fischer, J.C.; Butters, G.; Duchateau, P.C.; Thelwell, R.J.; Siller, R. In situ measures of methanotroph activity in upland soils: A reaction-diffusion model and field observation of water stress. J. Geophys. Res. Biogeosci. 2009, 114, G01015. [Google Scholar] [CrossRef]
  79. Hakamada, R.E.; Hubbard, R.M.; Moreira, G.G.; Stape, J.L.; Campoe, O.; Ferraz, S.F.D.B. Influence of Stand Density on Growth and Water Use Efficiency in Eucalyptus Clones. For. Ecol. Manag. 2020, 466, 118125. [Google Scholar] [CrossRef]
  80. Konda, R.; Ohta, S.; Ishizuka, S.; Heriyanto, J.; Wicaksono, A. Seasonal Changes in the Spatial Structures of N2O, Co2, and Ch4 Fluxes from Acacia Mangium Plantation Soils in Indonesia. Soil. Biol. Biochem. 2010, 42, 1512–1522. [Google Scholar] [CrossRef]
  81. Zhang, H.; Tuittila, E.S.; Korrensalo, A.; Laine, A.M.; Uljas, S.; Welti, N.; Kerttula, J.; Maljanen, M.; Elliott, D.; Vesala, T.; et al. Methane Production and Oxidation Potentials Along a Fen-Bog Gradient from Southern Boreal to Subarctic Peatlands in Finland. Glob. Change Biol. 2021, 27, 4449–4464. [Google Scholar] [CrossRef]
  82. Quebbeman, A.W.; Menge, D.N.L.; Arellano, G.; Hall, J.; Wood, T.E.; Zimmerman, J.K.; Uriarte, M. A Severe Hurricane Increases Carbon Dioxide and Methane Fluxes and Triples Nitrous Oxide Emissions in a Tropical Forest. Ecosystems 2022, 25, 1754–1766. [Google Scholar] [CrossRef]
  83. Masscheleyn, P.H.; DeLaune, R.D.; Patrick, W.H. Methane and nitrous oxide emissions from laboratory measurements of rice soil suspension: Effect of soil oxidation-reduction status. Chemosphere 1993, 26, 251–260. [Google Scholar] [CrossRef]
Figure 1. Selection for inclusion in this study.
Forests 15 01214 g001
Figure 2. Number of articles from 2006 to 2022 (a) and visual co-occurrence analysis of countries (b).
Forests 15 01214 g002aForests 15 01214 g002b
Figure 3. Top 10 institutions with frequency.
Forests 15 01214 g003
Figure 4. Mapping periods of keyword occurrences and the node colors from blue to yellow represent the years.
Forests 15 01214 g004
Figure 5. The process of methanogenesis by methanogens (a) and pectin or cellulose (b).
Forests 15 01214 g005
Figure 6. The forest plot illustrates the pooled correlation coefficients (R) with 95% confidence intervals (CIs) for various factors influencing stem methane (CH4) emissions. Each row represents an individual study’s result, while the diamond-shaped markers and horizontal lines indicate the effect size and CI (n = 45), respectively. The results with p ≤ 0.05 were regarded as statistically significant for the influence of environmental factors on stem methane emission [59,60,61,62,63,64,65,66,67,68,69,70,71,72,73].
Forests 15 01214 g006
Figure 7. Driving factors influencing stem CH4 emissions. Solid red lines represent the methane emissions through tree ventilation tissue. The dotted red lines represent methane emissions through the sap flow. The solid black lines and arrows point to the dependent variable. “+” represents the positive effect, and “” represents the negative effect.
Forests 15 01214 g007
Table 1. The top 10 authors and co-cited authors.
AuthorInstitutionCountryCountCo-Cited AuthorInstitution CountryCount
Vincent GauciUniversity of BirminghamUnited Kingdom9Sunitha R. PangalaOpen UniversityUnited Kingdom68
Katerina MachacovaGlobal Change Research Institute CASCzech Republic7Kristofer R. CoveySkidmore College USA62
Ayaka SakabeKyoto UniversityJapan6Zhi-Ping WangChinese Academy of SciencesChina53
Edward HornibrookUniversity of British ColumbiaUnited Kingdom5Katerina MachacovaGlobal Change Research Institute CASCzech Republic45
Shigehiro IshizukaForestry & Forest Products Research InstituteJapan5Kazuhiko TerazawaTokyo UniversityJapan44
Mari PihlatieUniversity of HelsinkiFinland5Josep BarbaUniversity of BirminghamUSA43
Thomas SchindlerUniversity of AmsterdamEstonia5Frank KepplerUniversity of HeidelbergGermany42
Rodrigo VargasUniversity of DelawareUSA5Vincent GauciUniversity of BirminghamUnited Kingdom40
Kaido SoosaarUniversity of TartuEstonia4Scott PitzJohns Hopkins University USA37
Scott G. JohnstonSouthern Cross UniversityAustralia4Marielle SaunoisUniversité de Versailles Saint QuentinFrance36
Disclaimer/Publisher’s Note: The statements, opinions and data contained in all publications are solely those of the individual author(s) and contributor(s) and not of MDPI and/or the editor(s). MDPI and/or the editor(s) disclaim responsibility for any injury to people or property resulting from any ideas, methods, instructions or products referred to in the content.

