Article

Disentangling the Spatiotemporal Dynamics, Drivers, and Recovery of NPP in Co-Seismic Landslides: A Case Study of the 2017 Jiuzhaigou Earthquake, China

1
State Key Laboratory of Geohazard Prevention and Geoenvironment Protection, Chengdu University of Technology, Chengdu 610059, China
2
School of Earth Sciences and Spatial Information Engineering, Hunan University of Science and Technology, Xiangtan 411201, China
*
Authors to whom correspondence should be addressed.
Forests 2024, 15(8), 1381; https://doi.org/10.3390/f15081381
Submission received: 4 July 2024 / Revised: 26 July 2024 / Accepted: 6 August 2024 / Published: 7 August 2024
(This article belongs to the Section Natural Hazards and Risk Management)

Abstract

:
The 2017 Jiuzhaigou earthquake, registering a magnitude of 7.0, triggered a series of devastating geohazards, including landslides, collapses, and mudslides within the Jiuzhaigou World Natural Heritage Site. These destructive events obliterated extensive tracts of vegetation, severely compromising carbon storage in the terrestrial ecosystems. Net Primary Productivity (NPP) reflects the capacity of vegetation to absorb carbon dioxide. Accurately assessing changes in NPP is crucial for unveiling the recovery of terrestrial ecosystem carbon storage after the earthquake. To this end, we designed this study using the Moderate Resolution Imaging Spectroradiometer (MODIS) Net Primary Productivity datasets. The findings are as follows. NPP in the co-seismic landslide areas remained stable between 525 and 575 g C/m2 before the earthquake and decreased to 533 g C/m2 after the earthquake. This decline continued, reaching 483 g C/m2 due to extreme rainfall events in 2018, 2019, and 2020. Recovery commenced in 2021, and by 2022, NPP had rebounded to 544 g C/m2. The study of NPP recovery rate revealed that, five years after the earthquake, only 18.88% of the co-seismic landslide areas exhibited an NPP exceeding the pre-earthquake state. However, 17.14% of these areas had an NPP recovery rate of less than 10%, indicating that recovery has barely begun in most areas. The factor detector revealed that temperature, precipitation, and elevation significantly influenced NPP recovery. Meanwhile, the interaction detector highlighted that lithology, slope, and aspect also played crucial roles when interacting with other factors. Therefore, the recovery of NPP is not determined by a single factor, but rather by the interactions among various factors. The ecosystem resilience study demonstrated that the current recovery of NPP primarily stems from the restoration of grassland ecosystems. Overall, while the potential for NPP recovery in co-seismic landslide areas is optimistic, it will require a considerable amount of time to return to the pre-earthquake state.

1. Introduction

Net primary productivity (NPP) represents the difference between the carbon fixed by plants through photosynthesis and the carbon released via autotrophic respiration, thus reflecting the vegetation’s capacity to absorb carbon dioxide [1]. NPP is a crucial element of the carbon cycle within terrestrial ecosystems [2,3] and serves as a primary metric for understanding ecosystem productivity, vigor, and carbon storage capacity [4,5,6]. Recognized by initiatives such as the International Biosphere Program, the World Climate Research Program, the International Geosphere-Biosphere Program, and the Kyoto Protocol, the accurate assessment of NPP emerges as crucial for understanding the capacity of vegetation to sequester carbon and the global carbon cycle [7,8].
In mountainous regions, earthquakes can trigger devastating geohazards such as landslides, collapses, and mudslides. These catastrophic events often obliterate vast expanses of vegetation, severely impacting the vegetation productivity [9,10,11]. Monitoring changes in post-earthquake vegetation productivity is crucial for assessing the recovery of carbon storage in co-seismic landslide areas. Previous studies have primarily relied on Gross Primary Productivity and the Normalized Difference Vegetation Index to analyze vegetation regeneration in landslide areas [12,13]; these indicators are not sufficient to directly reflect the carbon sequestration capacity of vegetation.
Currently, there are very few research cases on vegetation NPP in co-seismic landslide areas, and there are two typical research cases. The first study centered on the 2008 Wenchuan earthquake [14], and examined the spatial and temporal changes in vegetation NPP within co-seismic landslide areas and analyzed the trends and sustainability of NPP recovery. Despite its insightful findings, this study was limited by a lack of field surveys and failed to address why some areas remained unrecovered. The second case study investigated the 2017 Jiuzhaigou earthquake [15], utilizing the CASA model to estimate post-earthquake vegetation NPP in the Jiuzhaigou Valley and exploring the response of vegetation NPP to various types of geohazards. However, this study did not delve into the recovery process of vegetation NPP within the geohazard-affected areas following the earthquake.
Jiuzhaigou Valley, designated as a World Natural Heritage Site in 1992, is one of China’s premier national parks, renowned for its stunning lakes, waterfalls, and limestone terraces [16]. Unfortunately, on 8 August 2017, a magnitude 7.0 earthquake with a shallow focal depth of 20 km struck Jiuzhaigou Valley [17]. The strong earthquake and geohazards induced by it, such as landslides, debris flows, and collapses, seriously damaged the ecosystem and affected over 30% of vegetation [18]. The substantial reduction in vegetation cover, coupled with the abrupt release of significant quantities of carbon dioxide, has profoundly disrupted the carbon storage within the terrestrial ecosystem of Jiuzhaigou Valley [19]. However, following the 2017 Jiuzhaigou earthquake, the dynamics of vegetation NPP in the co-seismic landslide areas remain insufficiently explored. Key questions persist, such as how the vegetation NPP changed in the aftermath of the earthquake, whether it was effectively restored, and which factors played a decisive role in the recovery process. These critical aspects have yet to be thoroughly investigated and understood.
Therefore, we designed this study to firstly extract the spatial and temporal characteristics of vegetation NPP pre- and post-earthquake in the co-seismic landslide areas, and secondly, to assess the recovery of NPP following the earthquake. Unlike previous research, our study employs the Geographical Detector method to analyze the interactions of various factors influencing vegetation NPP recovery, rather than limiting the analysis to the impact of single factors on recovery rates. Additionally, leveraging field survey data, we will explore the persistence of vegetation NPP recovery within the co-seismic landslide areas from the perspective of ecosystem resilience. This approach allows us to not only identify the reasons behind successful recovery in some areas but also understand why other areas remain unrecovered. We anticipate that this study will provide a robust scientific foundation for researching vegetation carbon sequestration recovery in post-earthquake co-seismic landslide areas and will significantly contribute to the ecosystem reconstruction efforts at the Jiuzhaigou World Natural Heritage Site.
The primary aims of this study are as follows: (1) to meticulously scrutinize the spatial and temporal variations in NPP within the co-seismic landslide areas; (2) to analyze the recovery rate of NPP over time; (3) to identify the key factors influencing the recovery of NPP; and (4) to explore the potential for NPP recovery in co-seismic landslide areas to reach pre-seismic conditions.

2. Materials and Methods
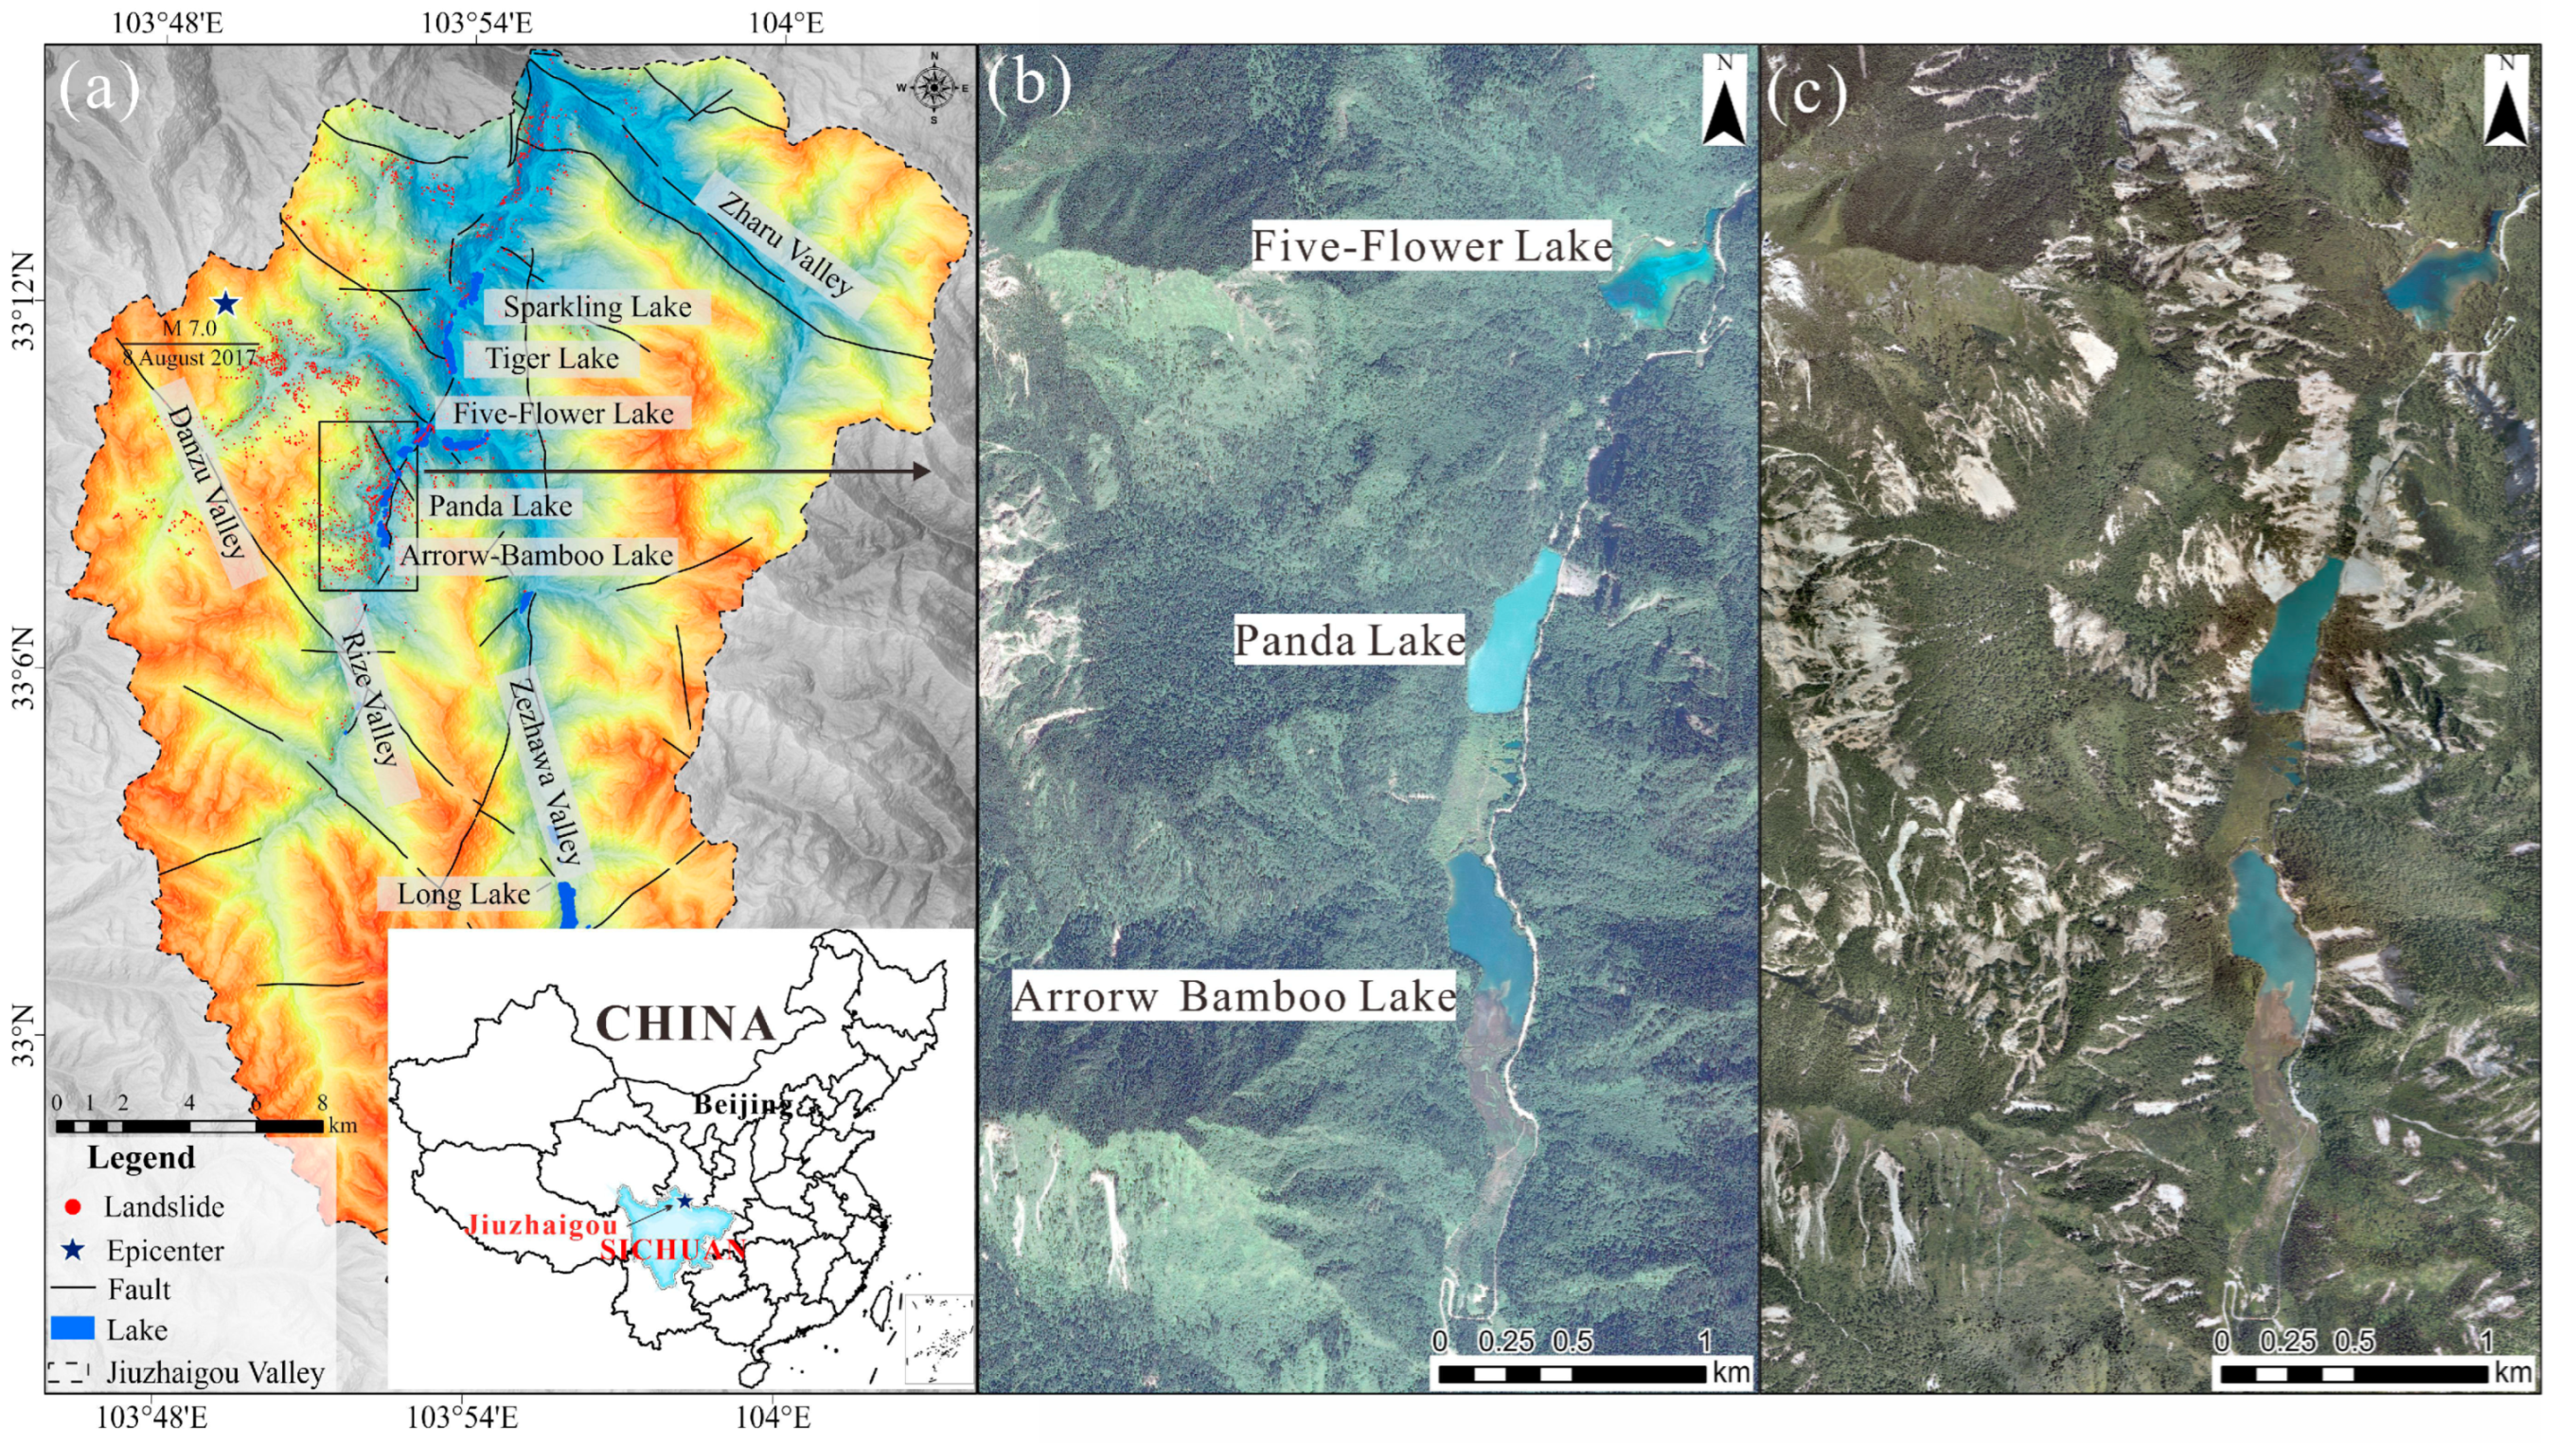
Figure 1 shows the technical process of this study.

2.1. Study Area

On 8 August 2017, at 21:19 Beijing Standard Time, an earthquake with Ms7.0 struck Jiuzhaigou Valley, which is situated in Sichuan province, southwestern China. The epicenter is located at 33.20° N, 103.82° E (Figure 2a). This event is noteworthy as another significant earthquake that occurred on the eastern periphery of the Tibetan Plateau, following the 2008 Ms 8.0 Wenchuan earthquake and the 2013 Ms 7.0 Lushan earthquake [20]. Furthermore, it is the largest earthquake ever recorded within a World Natural Heritage site, reaching a magnitude of up to 7.0. The earthquake triggered more than 1400 landslides and collapses within Jiuzhaigou Valley, resulting in the destruction of large areas of natural landscapes and ecosystems (Figure 2b,c). The co-seismic landslide inventory used in this study is from Tian et al. [21].

2.2. Data

2.2.1. NPP Datasets

At present, the Terra/Moderate Resolution Imaging Spectroradiometer (MODIS) Net Primary Productivity (MOD17A3HGF v006) dataset stands as the preeminent resource for researchers studying NPP [22,23]. The dataset can be acquired from the NASA Land Processes Distributed Active Archive Center (https://lpdaacsvc.cr.usgs.gov/appeears/ (accessed on 17 July 2023)). It provides data on the annual value of NPP in kg C/m2/a, starting from the year 2000. The data have a temporal resolution of 1 year, with a spatial resolution of 500 m. The dataset reflects the annual average of NPP. The Level 4 dataset has undergone meticulous processing, involving atmospheric correction, radiation correction, geometric correction, and cloud removal. In this study, we employed the MODIS Reprojection Tools and QGIS 3.32 for various tasks, including subset extraction, format conversion, projection transformation, image mosaicking, and cropping of the research area. Finally, we obtained NPP datasets from 2001 to 2022 of the study areas.

2.2.2. Meteorological Data

The meteorological dataset utilized spans from 2001 to 2022 and was sourced from Peng et al. [24]. It includes monthly minimum, maximum, and mean temperatures, as well as monthly total precipitation from 1901 to 2022. The temperature values and precipitation values are expressed to a precision of 0.1 °C and 0.1 mm, respectively, at a spatial resolution of 1 km. This dataset was evaluated by 496 national weather stations across China. Additionally, this dataset has been widely utilized in diverse scientific domains, including climate change research, ecosystem service evaluation, and landslide risk assessment [25,26,27]. In this study, we accessed the monthly mean temperature and monthly rainfall datasets from the Loess Plateau Scientific Data Center (http://loess.geodata.cn/ (accessed on 17 July 2023)).

2.2.3. Topographic and Geological Data

The Digital Elevation Model (DEM) utilized was obtained from the Advanced Land Observing Satellite (ALOS) and has a spatial resolution of 12.5 m. Using this DEM, raster maps representing aspect and slope were generated. Additionally, the geological data at a scale of 1:50,000 compiled by the Jiuzhaigou Valley Authority were used.
Due to the varying resolutions of the collected datasets, it is imperative to integrate them into a uniform spatial resolution. This standardization ensures that the study’s results are not compromised by the scale effect inherent in disparate data resolutions. To achieve this, we meticulously resampled all data to a consistent 12.5 m resolution, utilizing the ALOS DEM as our benchmark.

2.3. Methods

2.3.1. Vegetation Productivity Capability

Accurately assessing the recovery rate of N P P in co-seismic landslide areas is crucial for understanding the trend of vegetation productivity recovery. To this end, we introduced the Vegetation Productivity Capability ( V P C ) indicator. The V P C is defined as the state of productivity of vegetation following restoration [13,14], effectively serving as a measure of the N P P recovery rate. In this study, we evaluated the recovery rate of vegetation productivity by examining the variations in N P P across three key stages: pre-earthquake, post-earthquake decline, and the recovery phase. The formula is expressed as follows:
V P C = N P P 3 N P P 2 N P P 1 N P P 2 × 100   ( % )
We combined the results of Liu et al. [13] and Yang et al. [14] to revise the V P C formula by setting the critical value for assessing productivity recovery to zero, making the physical meaning of V P C clearer.
In the formula, N P P 1 signifies the average N P P prior to the earthquake, N P P 2 represents the average N P P during the post-seismic decline phase, and N P P 3 denotes the average N P P during the post-seismic recovery phase. A V P C value greater than 0 indicates that the vegetation’s productivity state has surpassed its pre-earthquake state, showcasing a remarkable N P P recovery. Conversely, a V P C less than 0 signifies that the vegetation’s productivity state remains below its pre-earthquake state, suggesting ongoing challenges in N P P recovery.

2.3.2. Geographical Detector

The Geographical Detector (GD) model, which is based on the theory of spatially stratified heterogeneity, was proposed by Wang et al. [28]. The application of this model presupposes the presence of spatial heterogeneity in the dependent variable. The fundamental assumption is that if an independent variable significantly impacts a dependent variable, their spatial distributions should exhibit similarity [19,28,29]. We opted for the GD over other statistical methods, such as least squares regression, because the GD is uniquely capable of detecting causation between independent and dependent variables by examining the similarity in their spatial distributions. In contrast, data-driven statistical methods typically only reveal correlations between variables, without establishing causation.
The GD comprises four models: the factor detector, interaction detector, ecological detector, and risk detector. The GD requires the independent variables to be categorical; therefore, continuous variables must be discretized into categorical variables before using the GD. To streamline and enhance this process, Song et al. [30] optimized the GD model and developed the Optimal Parameter-based Geographical Detector (OPGD) model. The OPGD model enhances the GD model by refining the discretization process of continuous variables, thereby offering optimal parameters for this discretization [29,31]. In this study, the OPGD model was employed to analyze the key drivers of VPC recovery in the co-seismic landslide area, primarily using parameter optimization, the factor detector, and the interaction detector.
(1).
Factor detector
As the core part of the OPGD, the factor detector reveals the relative importance of explanatory variables with a Q -statistic. The Q -statistic compares the dispersion variances between observations in the whole study area and strata of variables [19,28]. The Q value is computed by the following formula:
Q = 1 h = 1 L N h σ h 2 N σ 2
where h (1… L) is the number of classifications of the independent factor; Nh represents the number of samples in subregion h; N represents the total number of spatial units across the overall study area; and σ and σh represent the total variance and variance in the samples in subregion h, respectively. A large Q value means a relatively high importance of the explanatory variable, due to a small variance within sub-regions and a large variance between sub-regions.
(2).
Parameter optimization
The OPGD model selects the best combination of discretization method and break number as the optimal discretization parameters. A set of combinations of discretization methods and break numbers are provided for each continuous variable to compute respective Q values. The best combination is the one with the highest Q value. The optional discretization methods can be a list of supervised and unsupervised discretization methods, and optional break numbers can be an integer sequence in terms of observations and practical requirements. As such, the optional combinations can cover almost all available choices.
(3).
Interaction detector
Another unique advantage of the OPGD is its exceptional ability to detect the result of the interaction between two factors on the dependent variable, facilitated by the interaction detector. Traditionally, identifying interactions has involved adding a product term of the two factors to a regression model and testing for statistical significance. However, interactions between two factors are not necessarily limited to a multiplicative relationship. Two-factor superposition includes both multiplicative and other relationships, and as long as there is a relationship, the interaction detector can detect it. The interaction detector determines not only the presence of an interaction but also its strength, directionality, and whether it is linear or nonlinear. Five results are identified: Nonlinear weaken, Uni-variable weaken, Bi-variable enhance, Independent, and Nonlinear enhance (Table 1).

2.3.3. Ecosystem Resilience

Ecosystem resilience is delineated by the capacity of regional ecosystem structures and functions to recover to their original state following disturbances caused by both natural and anthropogenic factors [32,33,34]. It has two key two aspects: resistance and resilience [35]. Resistance denotes the capability to withstand external disturbances without suffering damage by self-adjusting to maintain a stable structure and function [36]. Resilience signifies the capability to restore the original state after experiencing severe disruption [37]. Resistance and resilience can be quantitatively assessed through the resistance coefficient and resilience coefficient, respectively. Based on previous studies, we obtained the resistance and resilience coefficients for different land cover types in Sichuan Province, China [38] (Table 2). Regarding the weighting configuration, the weights were established by evaluating whether the ecosystem’s self-regulation capacity surpasses external interference. When external disturbances are less impactful than the ecosystem’s self-adjustment ability, resistance carries more weight. Conversely, if external disturbances pose a more significant threat, resilience is prioritized. Given that the Jiuzhaigou Valley endured a powerful earthquake, with a magnitude of up to 7.0 that caused substantial damage, the focus should be on resilience. Therefore, the final equation for calculating ecosystem resilience was as follows:
R = 0.4 × C r e s i s t a n + 0.6 × C r e s i l i e n
where R means ecosystem resilience; Cresistan and Cresilien refer to the ecosystem resistance coefficient and resilience coefficient of land cover types, respectively.

3. Results

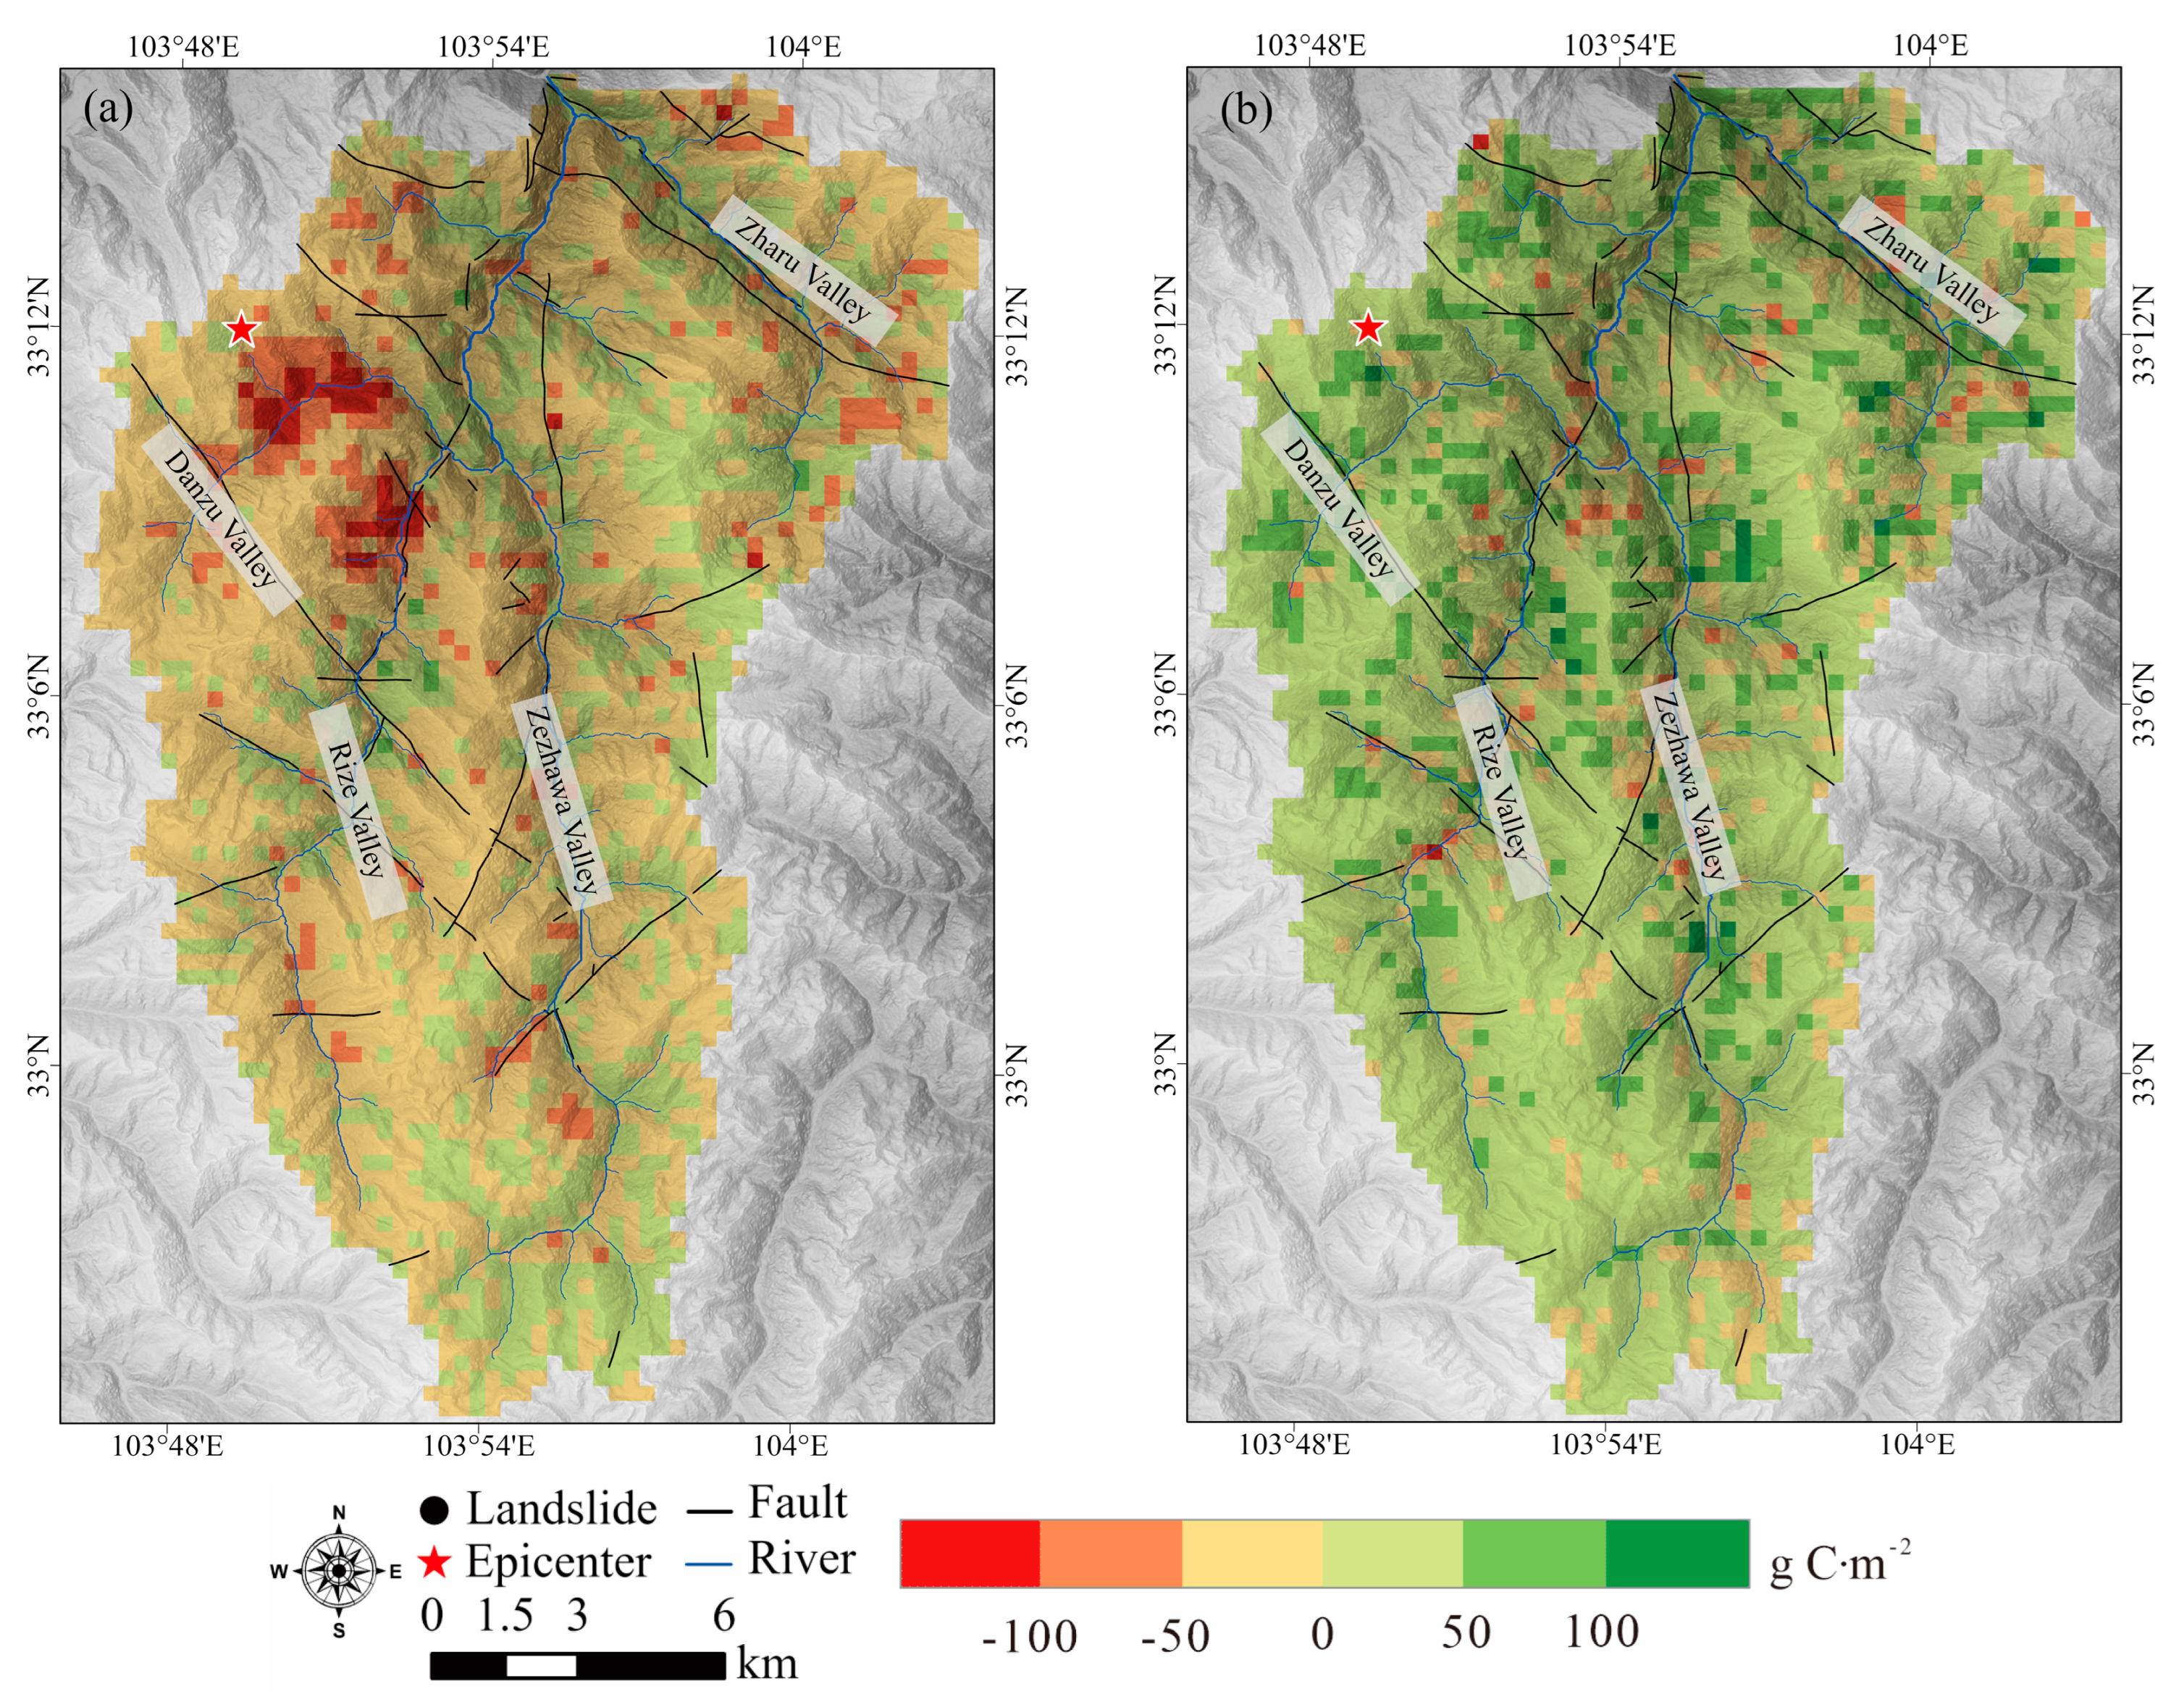
3.1. NPP Spatiotemporal Dynamics in Co-Seismic Landslides

We extracted the annual mean NPP for each co-seismic landslide area spanning from 2001 to 2022. Subsequently, we conducted a statistical analysis to determine the mean and standard deviation of the annual mean NPP for all landslide areas each year (Figure 3). It is important to highlight two peculiarities observed in the results. Firstly, the data for 2012 appear to exhibit an anomaly within the MOD17A3HGF v006 dataset. Given our extensive knowledge of the study area, no significant events occurred in 2012 that could plausibly explain a drastic drop in NPP. Consequently, we excluded the 2012 NPP from subsequent analyses to avoid skewing the results. Secondly, the spatial resolution of the MOD17A3HGF v006 dataset is 500 m, whereas the largest landslide in our inventory covers an area of 236,000 m2. This disparity in scale may introduce errors, including background fluctuations, into our findings. Nonetheless, our primary focus is on analyzing long-term trends in the annual average NPP changes within landslide areas. Therefore, we contend that despite the resolution differences, our approach remains robust for detecting and analyzing these changes over time.
The results reveal that from 2000 to 2016, the annual mean NPP in the co-seismic landslide area remained relatively stable, fluctuating between 525 and 575 g C/m2. Following the earthquake, this value decreased to 533 g C/m2. However, since the earthquake occurred on 8 August 2017, the annual NPP for 2017 already includes data from before the seismic event. Thus, the 2017 NPP does not fully capture the impact of the earthquake. Nevertheless, when compared to 2016, the 2017 NPP shows a decreasing trend, suggesting the 2017 data are still valuable for analysis. In 2018, the NPP further decreased to 481 g C/m2, indicating a significant decline. It showed signs of recovery in 2019, increasing to 495 g C/m2, but then dropped again to 483 g C/m2 in 2020. Notably, from 2021 to 2022, there was a continuous recovery trend, with the NPP rebounding to 544 g C/m2 by 2022, surpassing the 2017 value.
Notably, Jiuzhaigou Valley experienced significant heavy rainfall events following 8 August 2017, and in the subsequent years of 2018, 2019, and 2020. During these periods, the maximum daily rainfall reached remarkable values of 34.25 mm, 35.6 mm, 23.5 mm, and 45.23 mm, respectively. According to the Rainstorm Flood Calculation Manual for Small and Medium Watersheds in Sichuan Province, China, the recurrence intervals for these rainfall events were 50, 50, 20, and 100 years, respectively. The rainfall caused the NPP in the landslide areas to decrease by up to 52 g C/m2. This indicated that the large-scale loose debris deposits were activated and transformed into new landslides or debris flows due to rainfall, leading to secondary disasters that inhibited vegetation growth and negatively impacted NPP recovery. The negative effect of this process outweighed the positive effect of rainfall promoting vegetation growth, resulting in a consistently low NPP.
To analyze the spatial dynamics of pre- and post- earthquake changes in NPP, we segmented the time series into three distinct periods, 2001–2016, 2017–2020, and 2021–2022, based on the annual average NPP trends. We separately calculated the average NPP for each period and then determined the differences between these periods. This approach allowed us to examine the spatial characteristics of NPP decreases following the earthquake and extreme rainfall, as well as NPP increases during the recovery period (Figure 4). The calculation results were categorized into six distinct grades. To further analyze the distribution of NPP within each grade, we visualized the graded statistics of NPP (Figure 5). Positive values indicate pixels where NPP has increased, while negative values indicate pixels with reduced NPP.
The results indicated two regions with the most severe NPP impacts (Figure 4a). One is the Danzu Valley where the epicenter was located, while the other is the Rize Valley. These two areas exhibit the highest density of landslides, with NPP plummeting by as much as 178.61 g C/m2 (Figure 5a). Notably, in most parts of Jiuzhaigou Valley, NPP ranged from −50 to 0 g C/m2 during this period, except in the severely damaged regions. This contrasts with the expectation that NPP in areas unaffected by landslides would remain stable. We attribute this discrepancy to background fluctuations, which fall outside the scope of this study. Figure 4b and Figure 5b illustrate that after two years of restoration, NPP in most areas reached a state of 0–50 g C/m2. The maximum NPP value during this period was 133.93 g C/m2, significantly higher than the 68.46 g C/m2 recorded in the previous period. Overall, the NPP in the co-seismic landslide areas has shown initial signs of recovery.

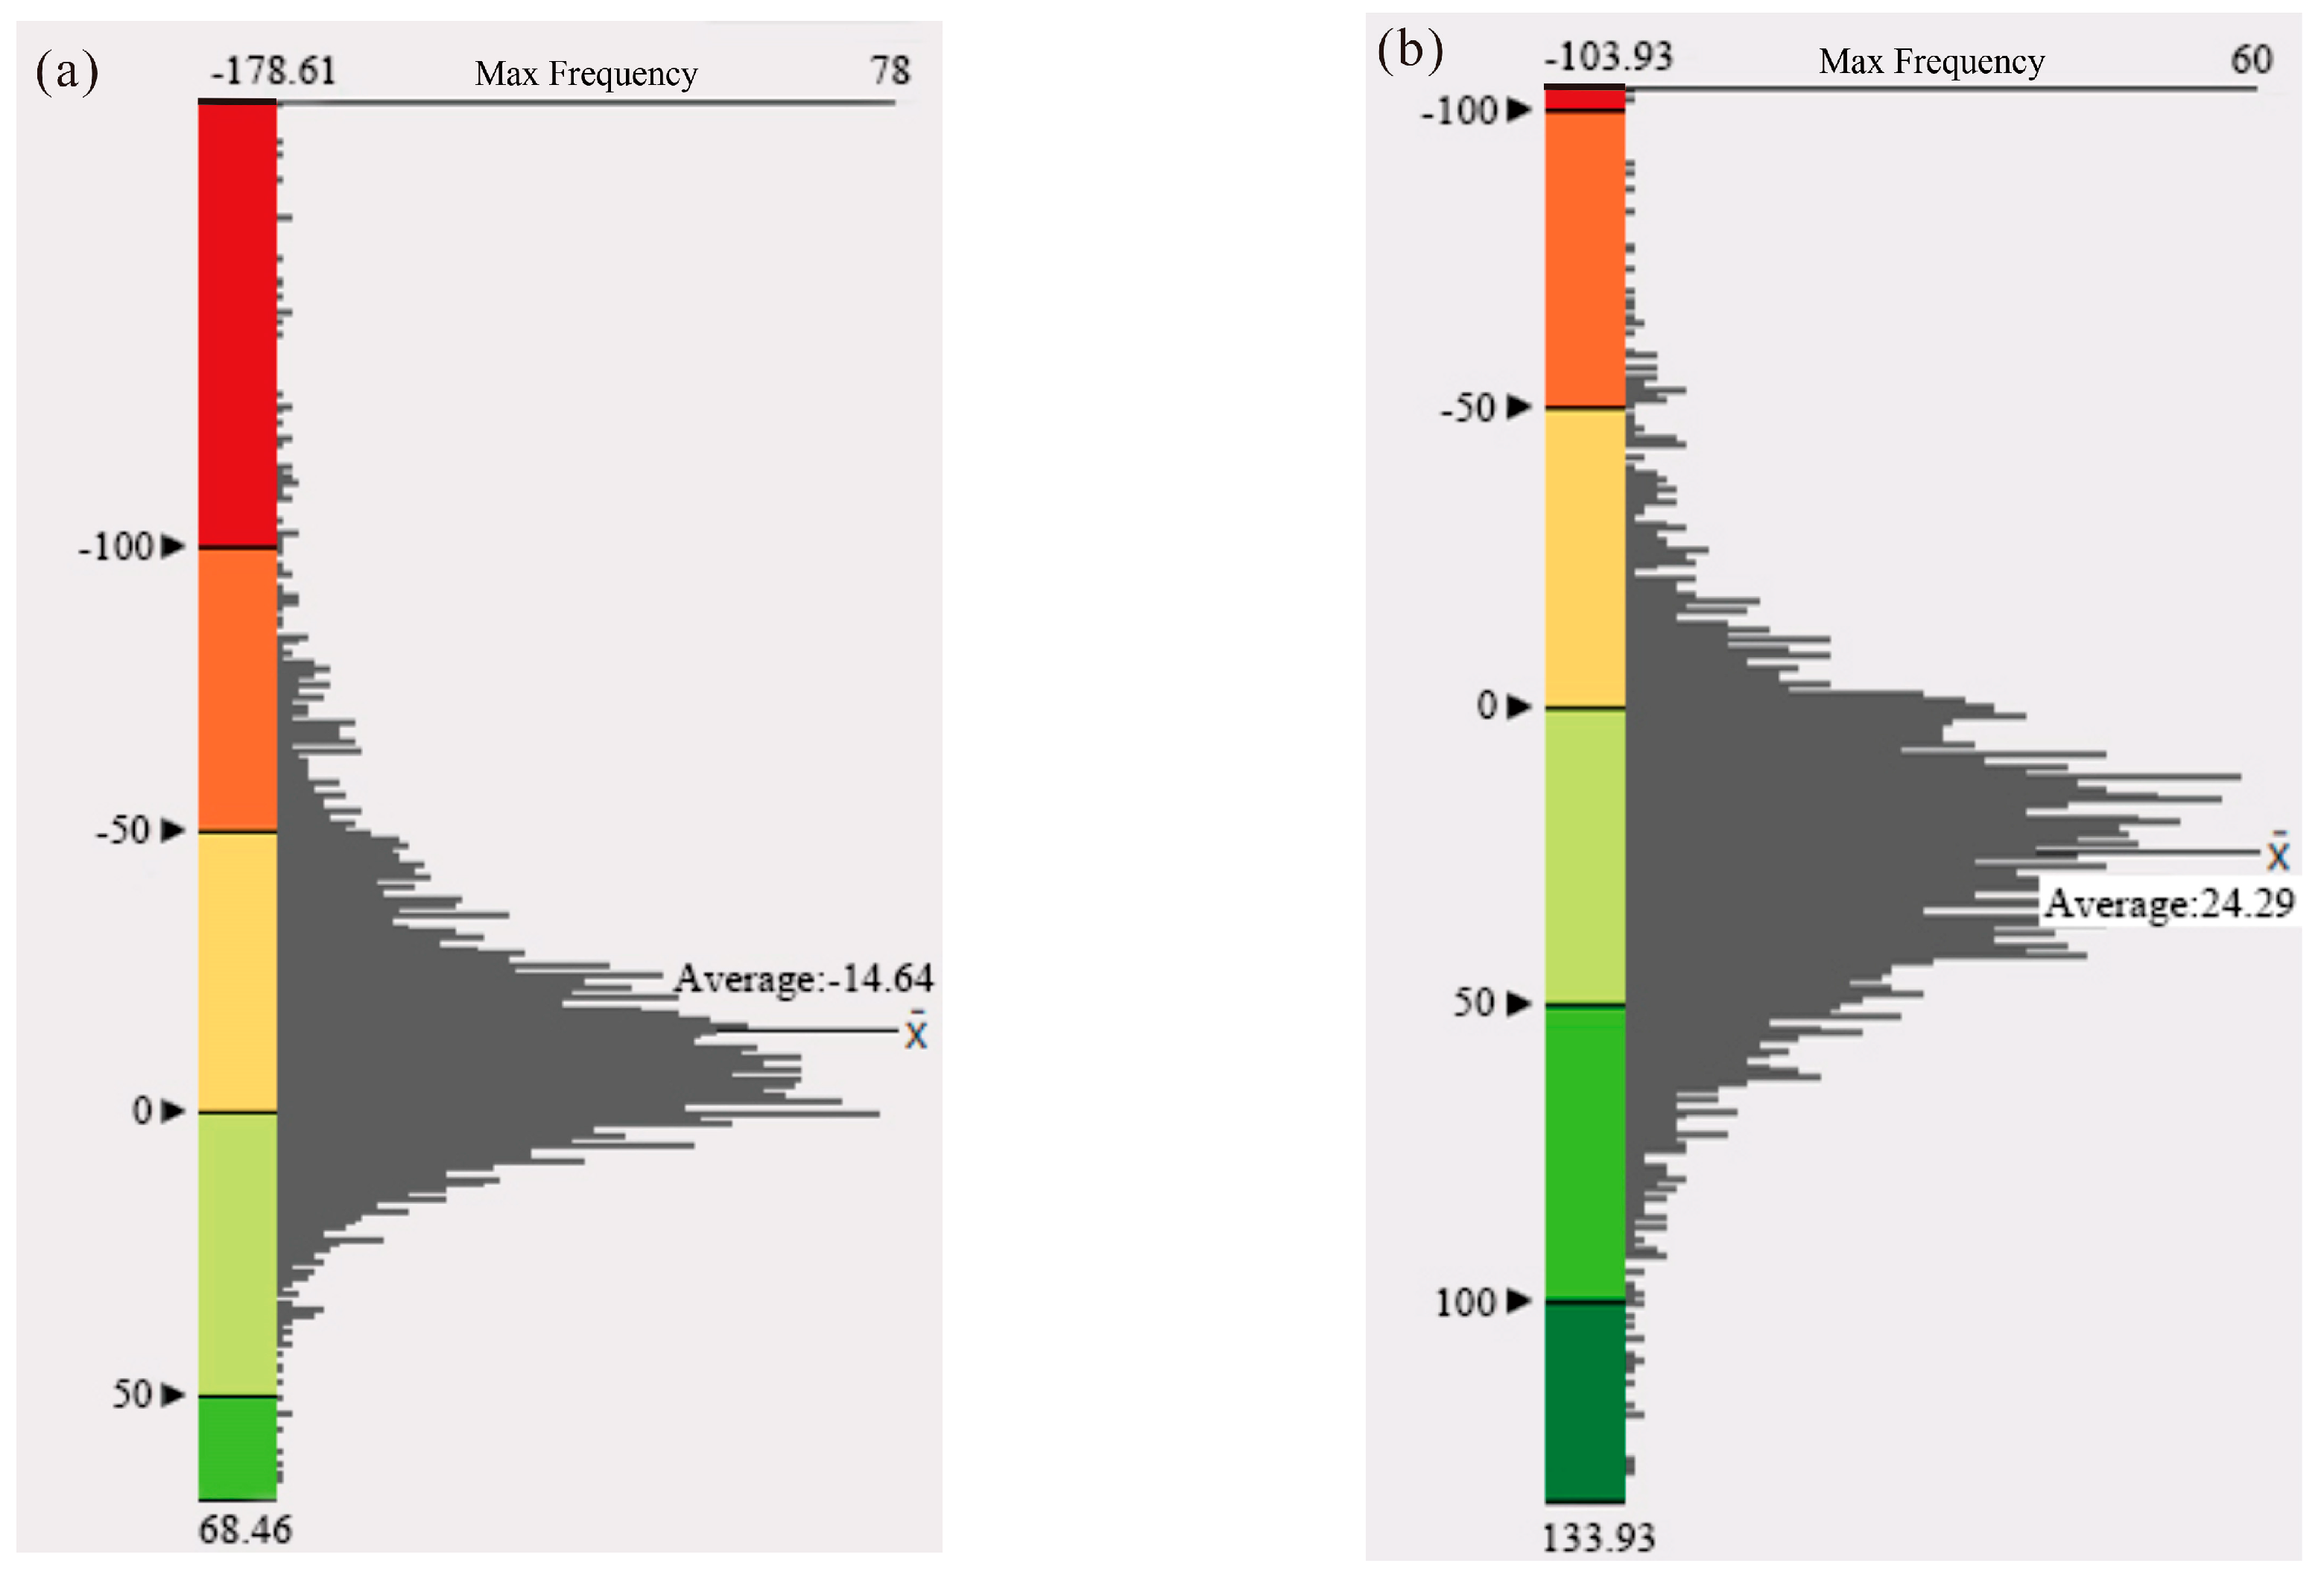
3.2. NPP Recovery Rate in Co-Seismic Landslides

Building on the function of the VPC, we analyzed the recovery rate of NPP. To capture the time-varying characteristics of NPP, we consider three distinct periods: NPP1 is the average NPP from 2001 to 2016, NPP2 is the average NPP from 2017 to 2020, and NPP3 is the average NPP from 2021 to 2022. The obtained VPC were classified into six distinct categories, and the percentage of landslide area within each category was meticulously calculated.
The results showed that within five years post-earthquake, 18.88% of the co-seismic landslide areas had a vegetation productivity state that exceeded that of the pre-earthquake state. However, 17.14% of these areas had a VPC increase of less than 10%, suggesting that the vast majority are only just beginning to recover. A significant 81.82% of the areas have not yet recovered, with 24.39% nearing the pre-earthquake state (−10 ≤ VPC ≤ 0), while 57.43% remain in a suboptimal state. To provide a clearer spatial representation of VPC in the co-seismic landslide areas, we highlight the Danzu Valley and Rize Valley, where NPP was most severely affected (Figure 6). The regions with the poorest recovery (VPC ≤ −30%) are predominantly located in Danzu Valley, the closest area to the earthquake’s epicenter. Although Rize Valley shows a relatively better recovery status than Danzu Valley, its VPC values remain below zero. Overall, even after five years since the earthquake, the NPP recovery rate in the co-seismic landslide areas remains notably low.

3.3. Driving Factors of NPP Recovery in Co-Seismic Landslides

3.3.1. Optimal Discretization of Continuous Variables

In this study, we selected five widely used discretization methods: equal interval, natural break, quantile, standard deviation, and geometric. Additionally, we established five breakpoint schemes with intervals of three, four, five, six, and seven. Figure 7 shows the discretization process. Table 3 summarizes the optimal combination for each variable. In this case, aspect and lithology are categorical variables not subject to discretization. The optimal parameters were as follows: (1) natural breaks with seven intervals for precipitation; (2) equal breaks with seven intervals for temperature; and (3) natural breaks with six intervals for both elevation and slope.

3.3.2. Effect of Single Variables on NPP Recovery

The factor detector revealed that temperature, precipitation, and elevation were the three most crucial drivers influencing NPP recovery in co-seismic landslide areas (Figure 8). Among them, temperature exhibits the most significant impact, as indicated by a Q value of 0.308, followed by precipitation (Q value of 0.273), and elevation (Q value of 0.25). In summary, climatic conditions play a critical role during the initial period of post-earthquake NPP recovery. On the one hand, climate directly influences vegetation growth, and on the other hand, it regulates metabolic processes such as photosynthesis and respiration in plants. However, the low Q values for slope, aspect, and lithology suggest that these factors play a minor role in the initial recovery of NPP.

3.3.3. Effects of Variable Interactions on NPP Recovery

As shown in Figure 9, the recovery of NPP after the interaction of all factors exhibited a pronounced enhancement effect. Most notably, lithology, slope, and aspect, which initially had small Q values in the factor detector, demonstrated significant enhancement when interacting with other factors. These interactions resulted in the most powerful non-linear enhancement observed. Specifically, lithology had the highest Q value of approximately 0.49 when interacting with both precipitation and temperature, and the second highest Q value of around 0.41 when interacting with elevation. Slope and aspect displayed Q values between 0.2 and 0.4 when interacting with precipitation, temperature, and elevation. Elevation showed bi-variate enhancement when interacting with precipitation and temperature, with Q values in the 0.2–0.4 range. Similarly, temperature also exhibited bi-variate enhancement when interacting with precipitation, with Q values from 0.2 to 0.4. Collectively, these findings indicated that the recovery of NPP after the earthquake is not determined by a single factor, but rather by the complex interactions among multiple factors.

4. Discussion

To thoroughly evaluate the potential for recovery of NPP in co-seismic landslide areas to the pre-seismic state, we introduced the crucial indicator of ecosystem resilience. Ecosystem resilience is defined as the capacity of a regional ecosystem’s structure and function to revert to its original state after being disturbed by natural or anthropogenic factors [32]. Central to the calculation of ecosystem resilience is land cover type, which reflects trends in ecosystem resilience through changes in land cover patterns, thereby revealing the potential for ecosystem restoration [33,34,39]. The numerous landslides and collapses induced by earthquakes have significantly altered the land cover patterns in the region, consequently transforming the ecosystem structure and impacting its resilience. Hence, to comprehensively analyze the recovery of NPP, it is imperative not only to examine the NPP recovery rate but also to evaluate the potential for NPP recovery in co-seismic landslide areas to the pre-seismic state from the perspective of ecosystem resilience.
We focused our study on the most severely affected areas, Danzu Valley and Rize Valley, to discuss earthquake impacts on Jiuzhaigou Valley’s ecosystem resilience. We analyzed the changes in the ecosystem resilience and restoration state of different ecosystem types post-earthquake. Initially, we extracted land cover types from remote sensing imageries detailed in Table 4. The outcomes, along with their percentages, are shown in Figure 10. We excluded building sites with minimal footprints and categorized the land cover types into four groups: forest land, grassland, water body, and bare land. Ecosystem resilience was calculated using the area of each land cover type as weights (Table 5).
The findings revealed a notable 11.11% decline in ecosystem resilience directly attributable to the earthquake, followed by a subsequent restoration of 6.25% over five post-earthquake years. Grassland exhibited the highest ecosystem resilience at 0.76, followed by water bodies at 0.74, forest land at 0.7, and bare land at 0.14 (Table 2). As illustrated in Figure 10d, the grassland ecosystem exhibited the most substantial recovery following the earthquake. The proportion of grassland area initially decreased from 9.98% to 9.28% before the earthquake but subsequently surged to 13.64% after five years, marking an impressive 4.36% increase post-recovery. Conversely, the forest ecosystem experienced the poorest restoration outcome. The forested area diminished significantly from 60.14% pre-earthquake to 50.58%, and further declined to 50.44% after five years, indicating that the forest land not only failed to recover but continued to suffer from secondary disasters. The area of bare land saw an increase from 29.41% to 39.81% immediately following the earthquake, and then a reduction to 35.51% after five years, showing a 4.3% decrease. This transition primarily involved bare ground being converted into grassland, particularly fine-grained soils in landslide and collapse regions, as depicted in Figure 10a–c. Additionally, the area of water bodies remains 0.05% below its pre-earthquake level. Despite the inherent high resilience of forest ecosystems, the severe damage inflicted by the earthquake, including uprooting and complete destruction of vegetation, suggests that forest areas will require a significantly longer period to fully recover.
The transformation in land cover patterns before and after the earthquake significantly impacted the ecosystem resilience of the study area. Initially, the ecosystem resilience decreased from 0.54 to 0.48, but it showed signs of recovery, reaching 0.51 after five years. This resurgence in resilience can be primarily attributed to the restoration of the grassland ecosystem. As herbaceous plants began to reestablish themselves on the co-seismic landslides, the NPP in these areas also started to rebound. However, the earthquake triggered numerous rocky landslides and collapses (Figure 11), presenting significant challenges to the natural regeneration of vegetation. Overall, while the potential for recovery of NPP in co-seismic landslide areas to the pre-seismic state is optimistic, achieving the pre-earthquake state will necessitate a prolonged period of time.
This study delves into the response of vegetation NPP within the Jiuzhaigou World Natural Heritage Site ecosystem to the 2017 Jiuzhaigou earthquake, providing a thorough analysis of the post-earthquake NPP recovery rate, limiting factors, and potential for recovery in the co-seismic landslide areas. Nevertheless, several limitations were identified. Primarily, we utilized the MOD17A3HGF v006 dataset, characterized by an annual temporal resolution and a spatial resolution of 500 m, to extract vegetation NPP in the co-seismic landslide areas. The lower temporal resolution prevented us from accurately capturing the direct impacts of the earthquake and its triggered geohazards on vegetation NPP. Furthermore, due to the relatively small scale of the co-seismic landslides triggered by this earthquake, the dataset’s spatial resolution was inadequate, failing to correspond effectively with the landslide scale and resulting in lower accuracy of the extracted vegetation NPP data.
To address these limitations, our future research will involve continuous observations within the study area, focusing on collecting crucial parameters for vegetation NPP estimation, including surface temperature, precipitation, and solar radiation. By incorporating these more refined parameters, we aim to develop an enhanced NPP dataset specifically tailored for vegetation productivity studies in earthquake-prone mountainous regions. This refined dataset will enable us to quantitatively elucidate the intricate relationship between earthquake-triggered geohazards and NPP, offering deeper insights into ecosystem resilience and recovery processes.

5. Conclusions

Currently, a comprehensive understanding of the dynamic process of vegetation productivity recovery in co-seismic landslide areas following earthquakes remains elusive. Focusing on the 2017 earthquake in the Jiuzhaigou World Natural Heritage Site, this study unraveled the spatial and temporal characteristics of NPP in the co-seismic landslide area, elucidated the NPP recovery rate post-earthquake, identified the key drivers behind this recovery, and assessed the potential for the NPP to return to its pre-earthquake state. The main conclusions are as follows:
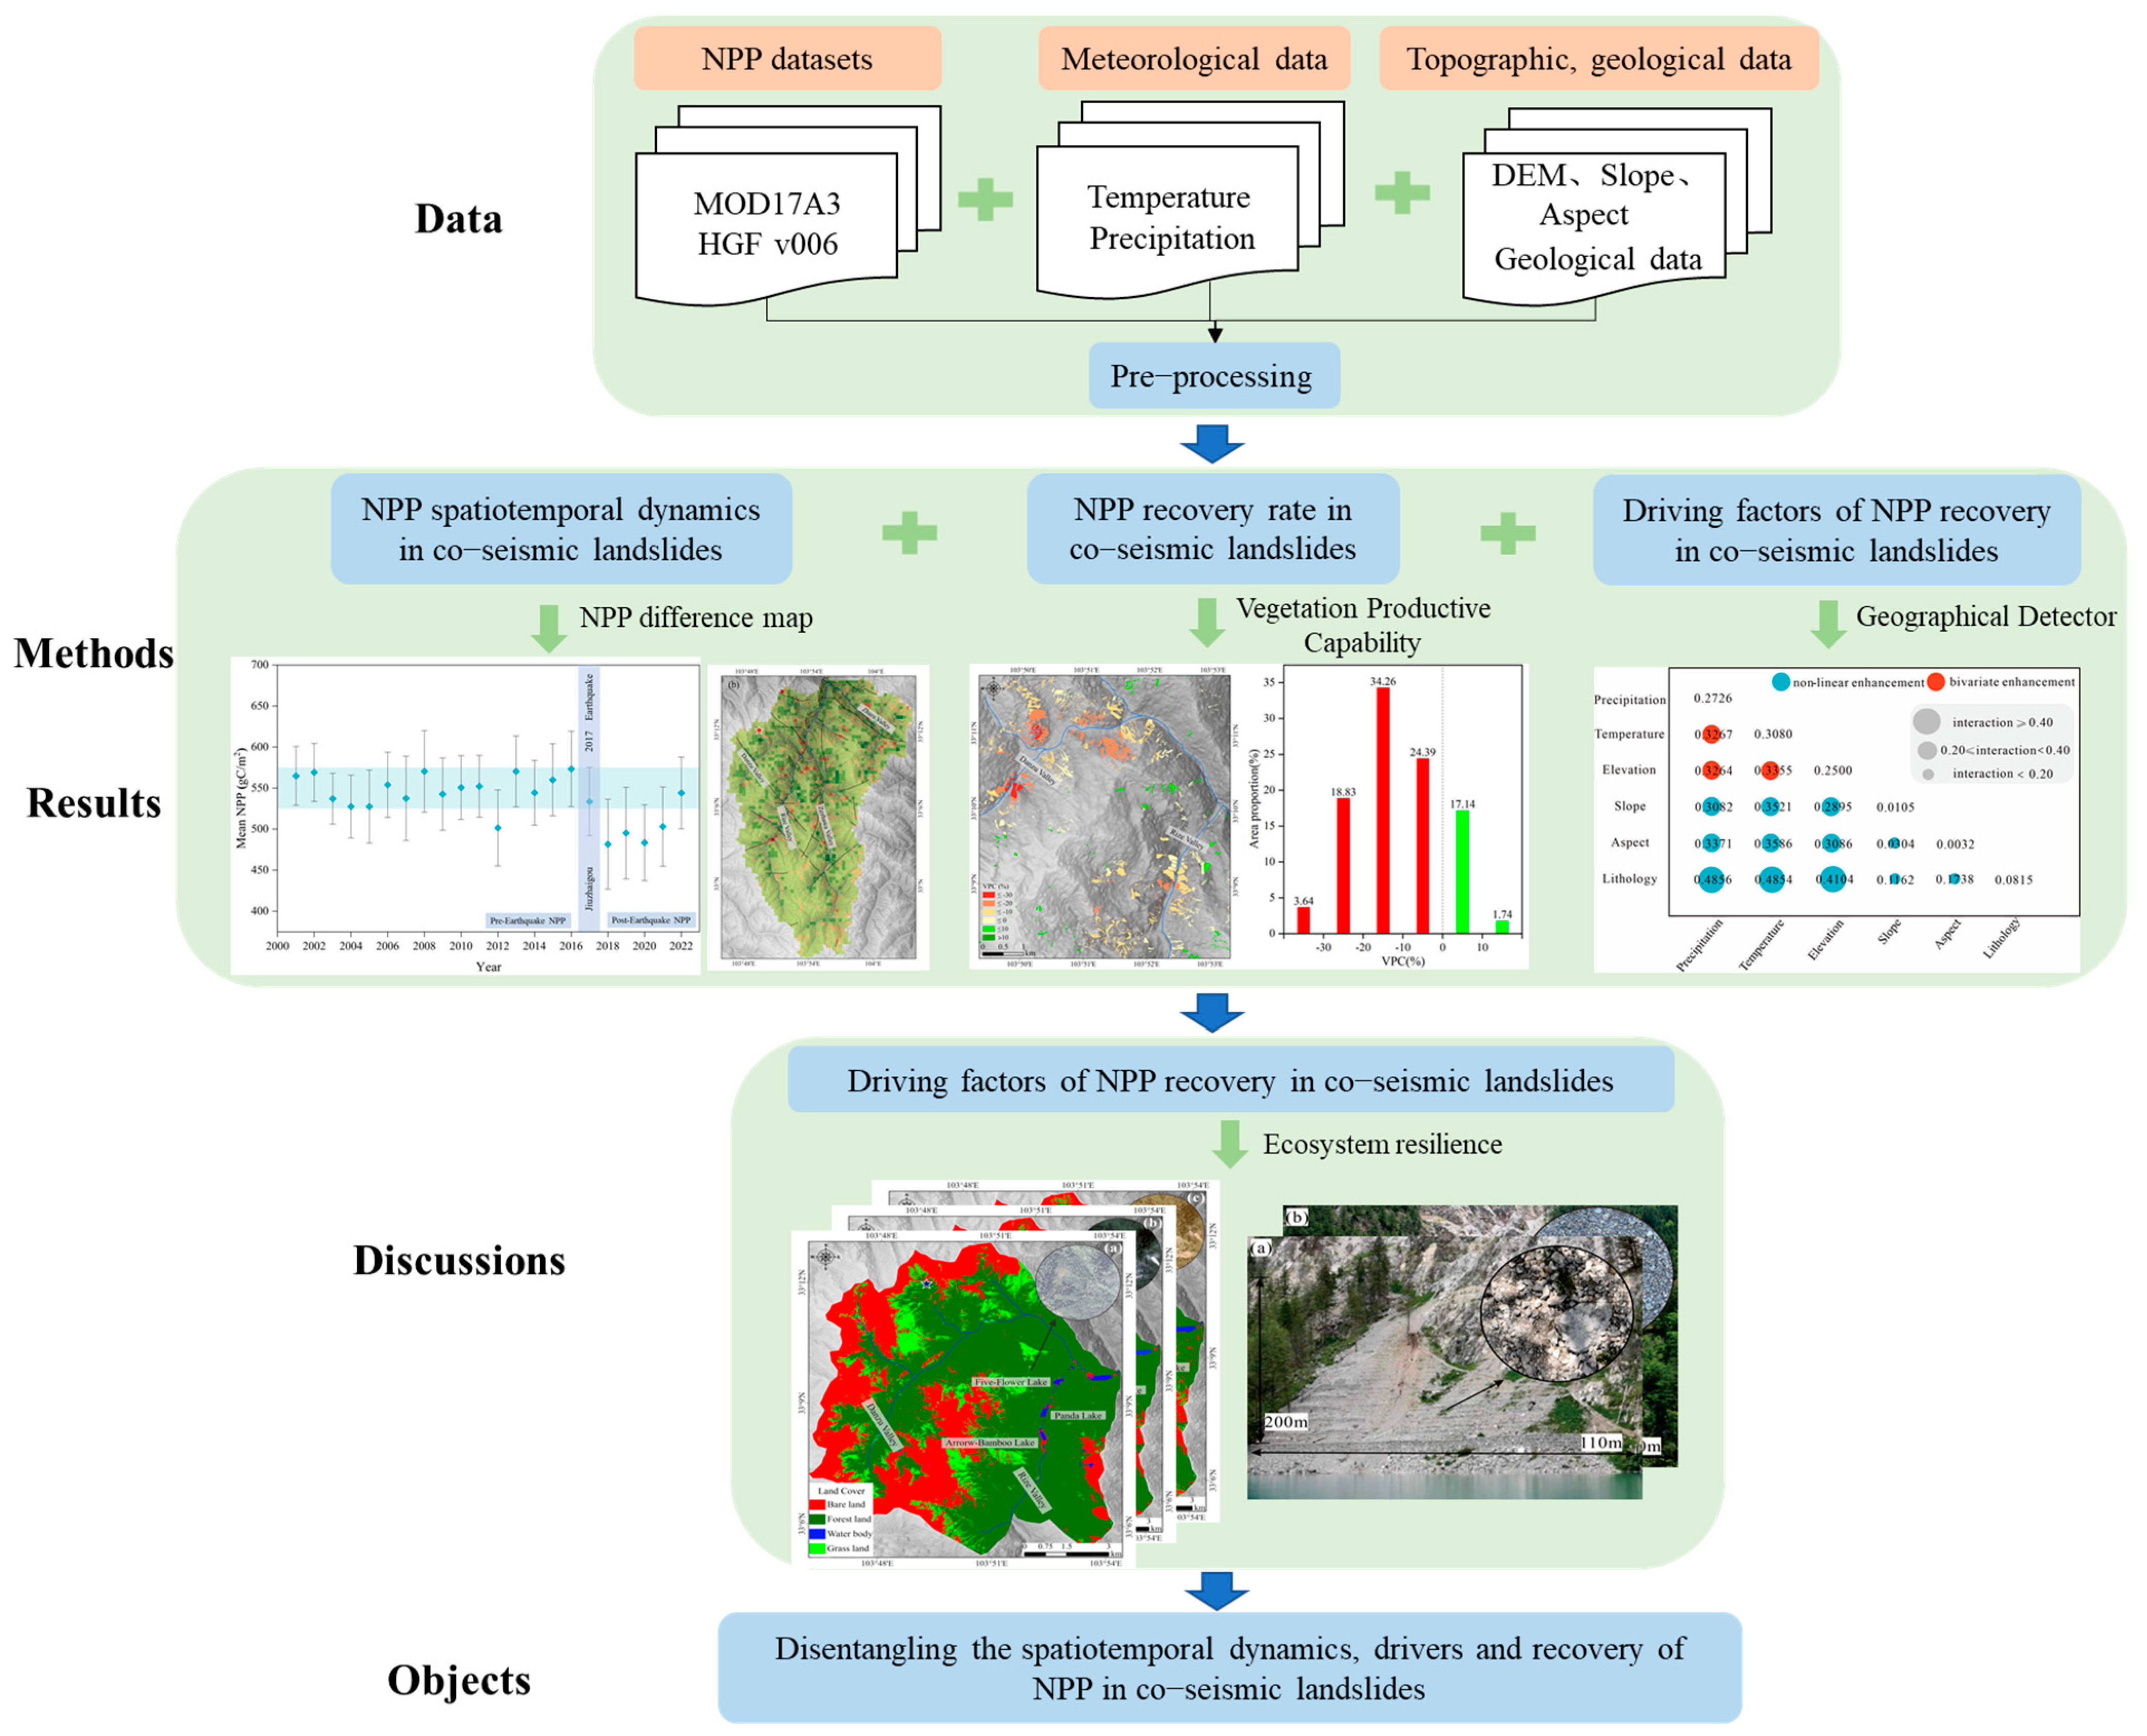
  • Before the earthquake, the NPP in the co-seismic landslide area remained stable, fluctuating between 525 and 575 g C/m2. However, following the earthquake, it dropped to 533 g C/m2. This decline was exacerbated by extreme rainfall events in 2018, 2019, and 2020, causing the NPP to further decrease to 483 g C/m2. Recovery commenced in 2021, and by 2022, the NPP had rebounded to 544 g C/m2.
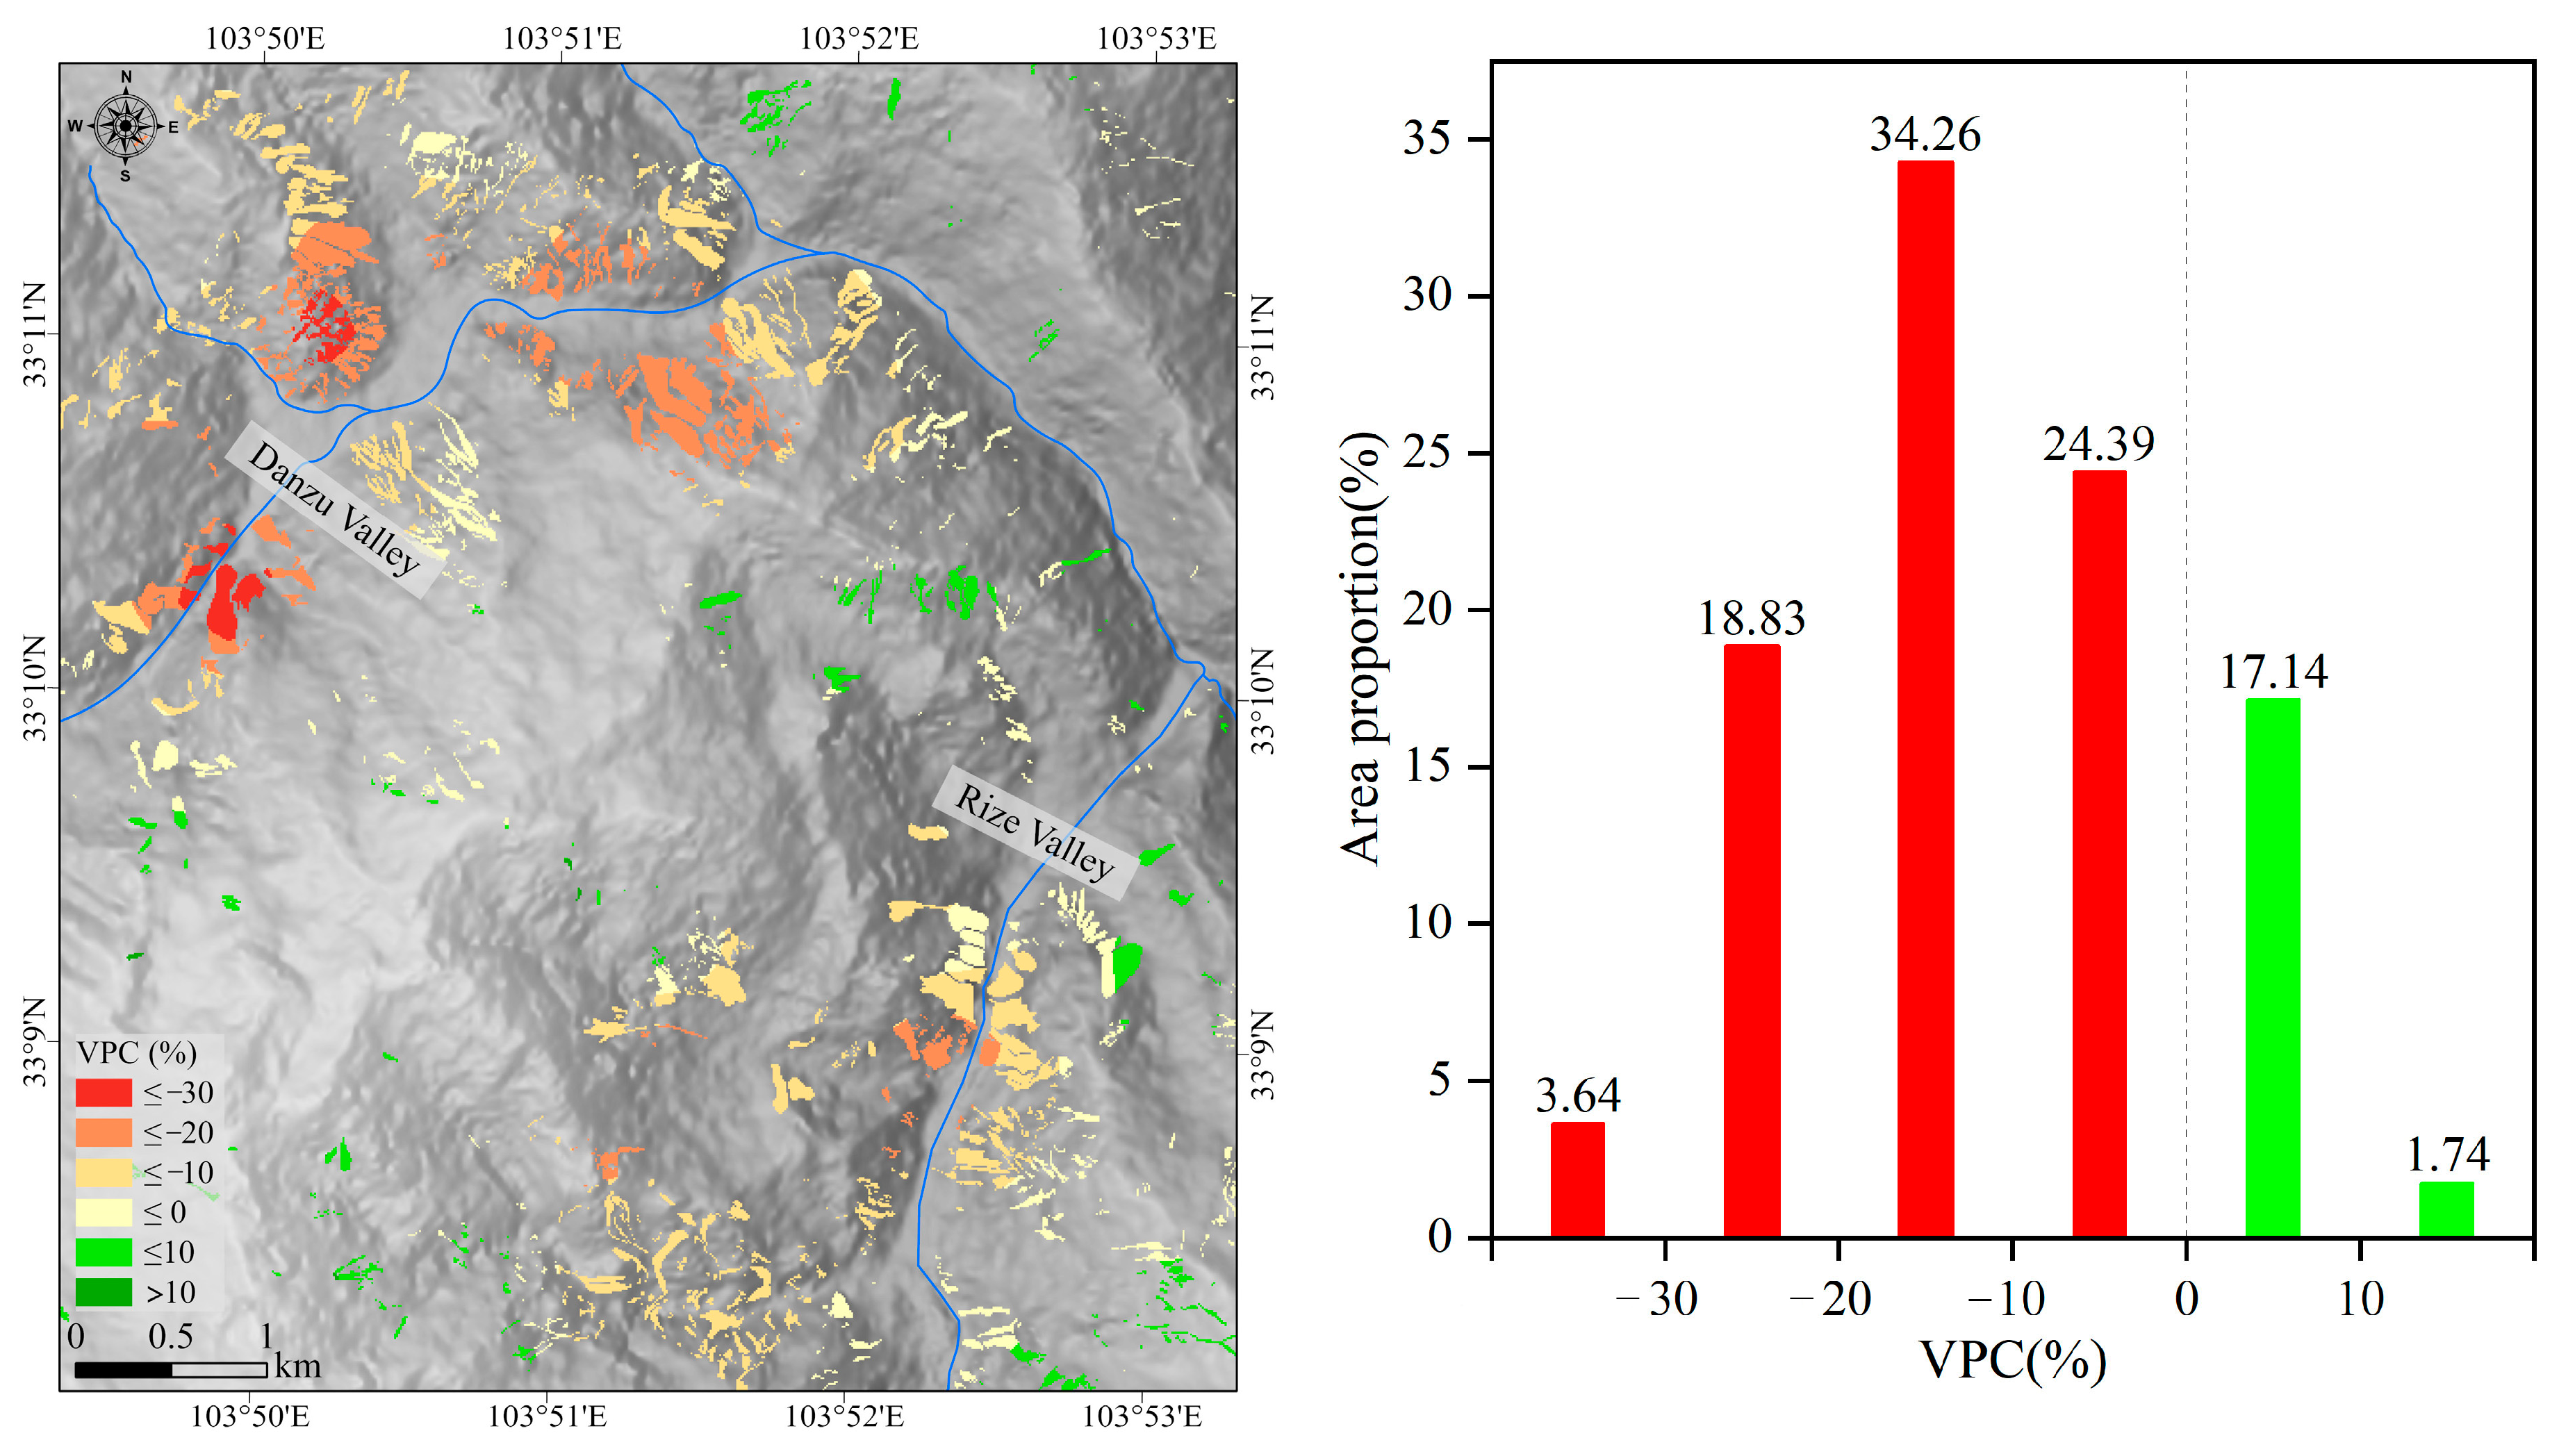
  • Five years after the earthquake, 18.88% of the co-seismic landslide areas exhibited an NPP exceeding pre-earthquake state. However, 17.14% of these areas had an NPP recovery rate of less than 10%, indicating that recovery has barely begun in most areas. Notably, 81.82% of the area remains completely unrecovered. Within this, 24.39% is nearing the pre-earthquake state, while a significant 57.43% remains in a suboptimal state.
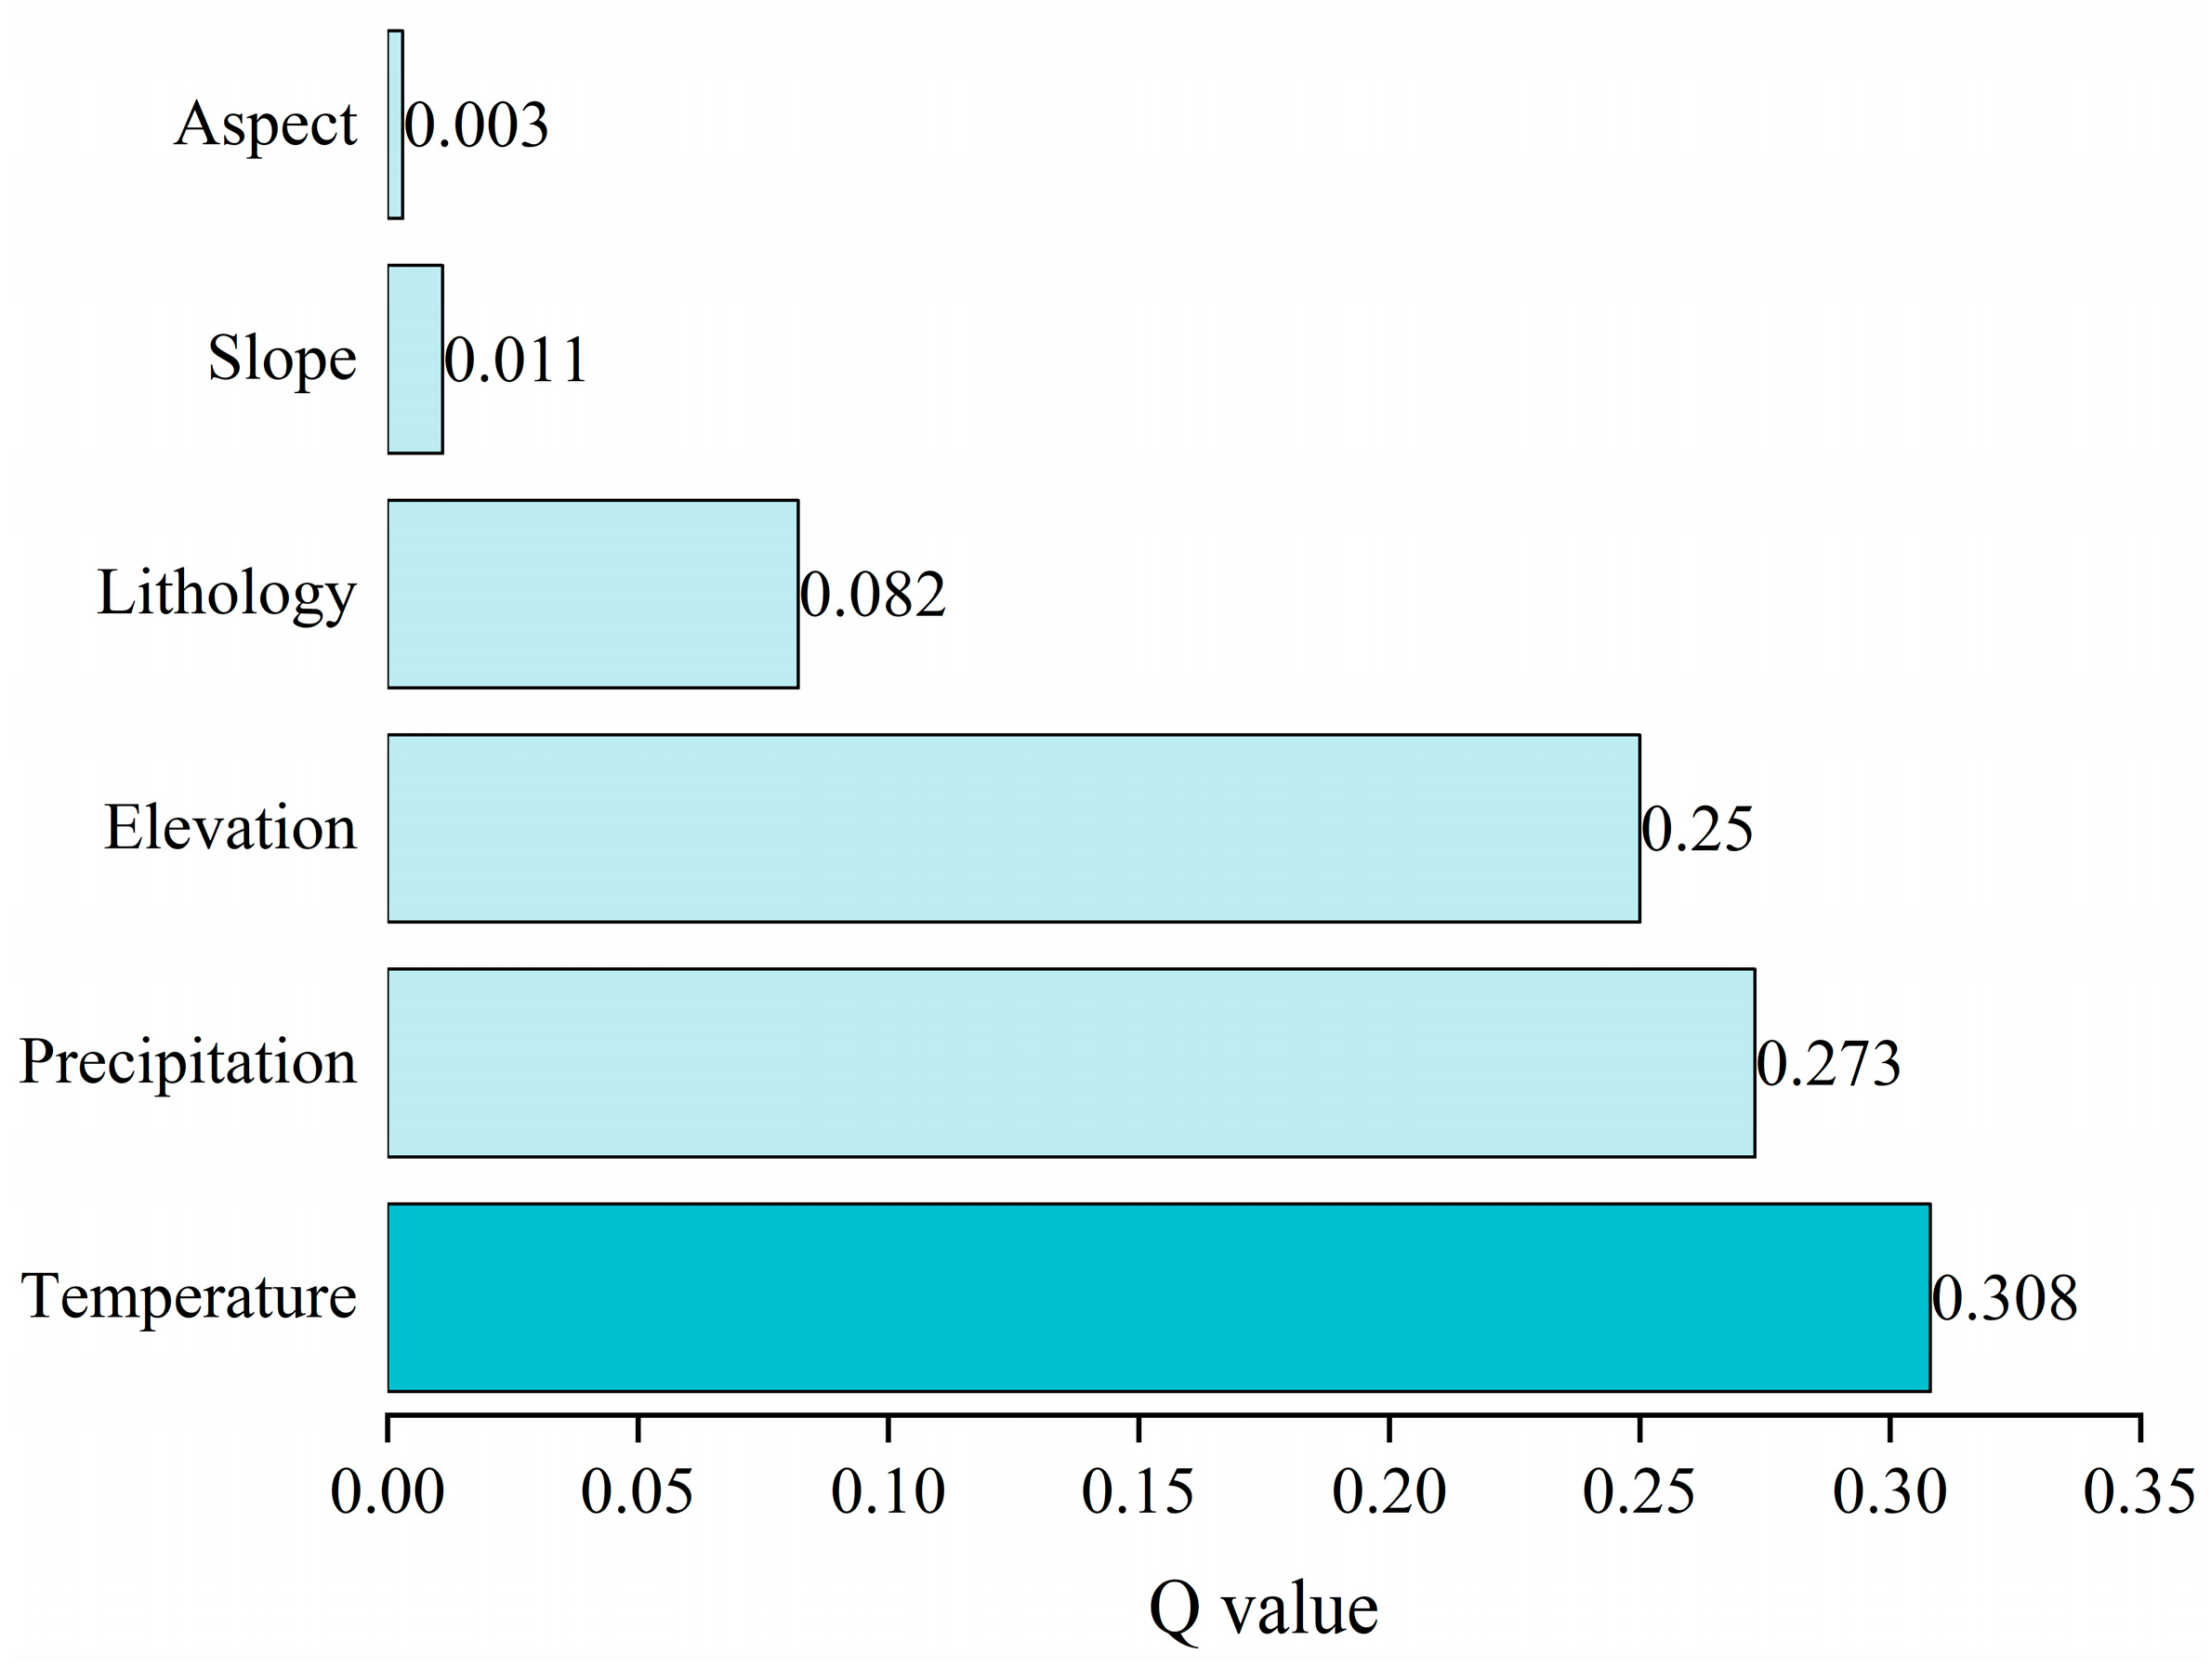
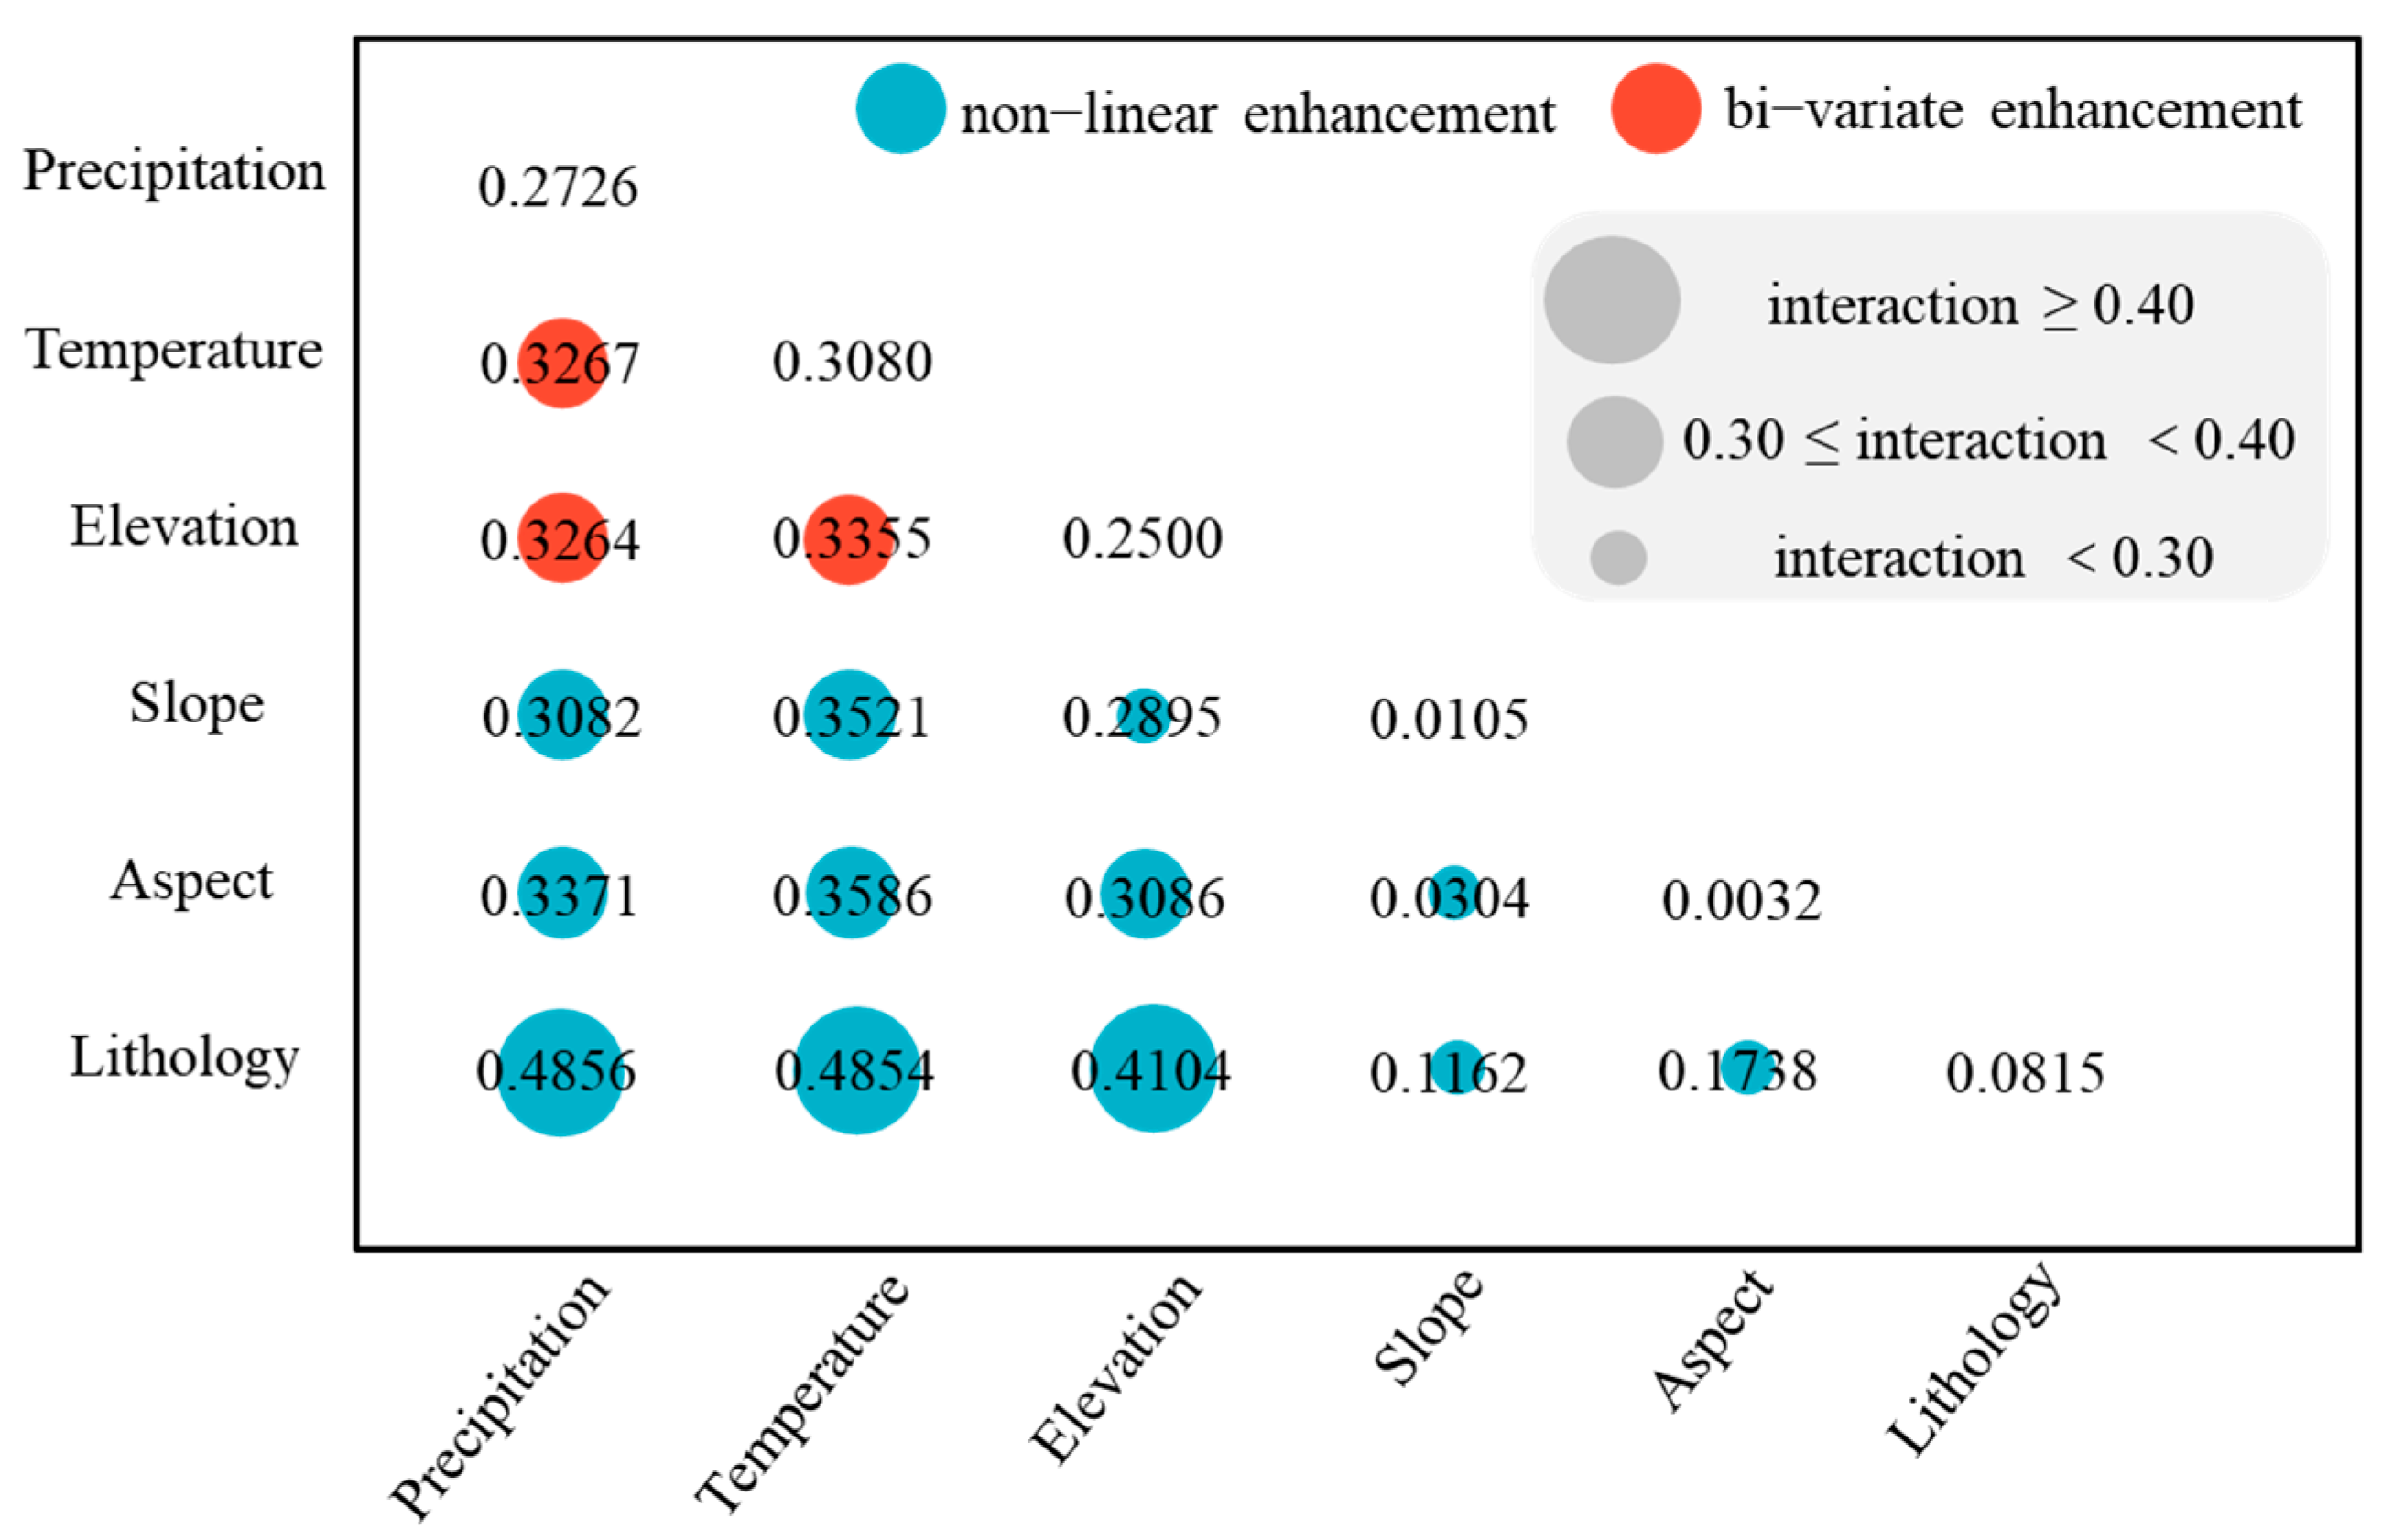
  • The factor detector indicated that temperature, precipitation, and elevation significantly influence the recovery of NPP in co-seismic landslide areas, while the interaction detector revealed that lithology, slope, and aspect, when interacting with other factors, also play a crucial role in the recovery. Therefore, the recovery of NPP is not determined by a single factor, but rather by the interactions among various factors.
  • The current recovery of NPP is predominantly driven by the restoration of grassland ecosystems. In stark contrast, forested areas have not only failed to recover in the five years following the earthquake but have continued to decline. While the potential for recovery of NPP in co-seismic landslide areas to the pre-seismic state is optimistic, achieving the pre-earthquake state will be a protracted process, requiring considerable time.

Author Contributions

Y.D.: data curation, formal analysis, methodology, software, validation, writing—original draft, writing—review and editing. X.P.: supervision, resources, funding acquisition. J.L.: conceptualization, funding acquisition, project administration, supervision, writing—review and editing. X.Z.: data curation. L.L.: data curation. All authors have read and agreed to the published version of the manuscript.

Funding

This research was funded by the National Key R&D Program of China (No. 2023YFC3007101) and the National Natural Science Foundation of China (No. 42107212). We sincerely acknowledge the invaluable support provided by the Jiuzhaigou Management Bureau for conducting the field survey.

Data Availability Statement

The original contributions presented in the study are included in the article; further inquiries can be directed to the corresponding author.

Acknowledgments

We thank reviewers for their insightful suggestions and comments.

Conflicts of Interest

The authors declare no conflicts of interest.

References

  1. Liu, Y.F.; Xu, M.; Guo, B.; Yang, G.; Li, J.L.; Yu, Y. Changes in the Vegetation NPP of Mainland China under the Combined Actions of Climatic-Socioeconomic Factors. Forests 2023, 14, 2341. [Google Scholar] [CrossRef]
  2. Quan, Y.Y.; Hutjes, R.W.A.; Biemans, H.; Zhang, F.S.; Chen, X.P.; Chen, X.J. Patterns and drivers of carbon stock change in ecological restoration regions: A case study of upper Yangtze River Basin, China. J. Environ. Manag. 2023, 348, 119376. [Google Scholar] [CrossRef]
  3. Yadav, V.S.; Yadav, S.S.; Gupta, S.R.; Meena, R.S.; Lal, R.; Sheoran, N.S.; Jhariya, M.K. Carbon sequestration potential and CO2 fluxes in a tropical forest ecosystem. Ecol. Eng. 2022, 176, 106541. [Google Scholar] [CrossRef]
  4. Prăvălie, R.; Piticar, A.; Roșca, B.; Sfîcă, L.; Bandoc, G.; Tiscovschi, A.; Patriche, C. Spatio-temporal changes of the climatic water balance in Romania as a response to precipitation and reference evapotranspiration trends during 1961–2013. Catena 2019, 172, 295–312. [Google Scholar] [CrossRef]
  5. Sun, H.Z.; Chen, Y.B.; Xiong, J.N.; Ye, C.Q.; Yong, Z.W.; Wang, Y.; Xu, S.C. Relationships between climate change, phenology, edaphic factors, and net primary productivity across the Tibetan Plateau. Int. J. Appl. Earth Obs. Geoinf. 2022, 107, 102708. [Google Scholar] [CrossRef]
  6. Xu, J.Y.; Zhang, Y.Y.; Huang, C.B.; Zeng, L.X.; Teng, M.J.; Wang, P.C.; Xiao, W.F. Forest restoration shows uneven impacts on soil erosion, net primary productivity and livelihoods of local households. Ecol. Indic. 2022, 134, 108462. [Google Scholar] [CrossRef]
  7. Li, P.; Peng, C.H.; Wang, M.; Li, W.Z.; Zhao, P.X.; Wang, K.F.; Zhu, Q. Quantification of the response of global terrestrial net primary production to multifactor global change. Ecol. Indic. 2017, 76, 245–255. [Google Scholar] [CrossRef]
  8. Zhou, T.J.; Chen, X.L.; Wu, B. Frontier issues on climate change science for supporting Future Earth. Chin. Sci. Bull. 2019, 64, 1967–1974. [Google Scholar] [CrossRef]
  9. Allen, R.B.; Bellingham, P.J.; Wiser, S.K. Immediate damage by an earthquake to a temperate montane forest. Ecology 1999, 80, 708–714. [Google Scholar] [CrossRef]
  10. Garwood, N.C.; Janos, D.P.; Brokaw, N. Earthquake-caused landslides: A major disturbance to tropical forests. Science 1979, 205, 997–999. [Google Scholar] [CrossRef]
  11. Hilton, R.G.; Meunier, P.; Hovius, N.; Bellingham, P.J.; Galy, A. Landslide impact on organic carbon cycling in a temperate montane forest. Earth Surf. Process. Landf. 2011, 36, 1670–1679. [Google Scholar] [CrossRef]
  12. Gan, B.R.; Yang, X.G.; Zhang, W.; Zhou, J.W. Temporal and spatial evolution of vegetation coverage in the mianyuan river basin influenced by strong earthquake disturbance. Sci. Rep. 2019, 9, 16762. [Google Scholar] [CrossRef] [PubMed]
  13. Liu, Y.; Liu, R.G.; Ge, Q.S. Evaluating the vegetation destruction and recovery of Wenchuan earthquake using MODIS data. Nat. Hazards 2010, 54, 851–862. [Google Scholar] [CrossRef]
  14. Yang, Y.S.; Fan, X.M.; Wang, X.; Lv, L.Y.; Zou, C.B.; Feng, Z.T. Net primary productivity changes associated with landslides induced by the 2008 Wenchuan Earthquake. Land Degrad. Dev. 2023, 34, 1035–1050. [Google Scholar] [CrossRef]
  15. Wang, C.Y.; Hu, X.D.; Hu, K.H.; Liu, S.; Zhong, W. Impact Assessment of the Ms7. 0 Earthquake on Jiuzhaigou Valley from the Perspective of Vegetation Net Primary Productivity. Sensors 2022, 22, 8875. [Google Scholar] [CrossRef]
  16. Liu, J.; Wang, J.; Wang, S.D.; Wang, J.F.; Deng, G.P. Analysis and simulation of the spatiotemporal evolution pattern of tourism lands at the Natural World Heritage Site Jiuzhaigou, China. Habitat Int. 2018, 79, 74–88. [Google Scholar] [CrossRef]
  17. Hu, X.D.; Hu, K.H.; Zhang, X.P.; Wei, L.; Tang, J.B. Quantitative assessment of the impact of earthquake-induced geohazards on natural landscapes in Jiuzhaigou Valley. J. Mt. Sci. 2019, 16, 441–452. [Google Scholar] [CrossRef]
  18. Sun, J.B.; Yue, H.; Shen, Z.K.; Fang, L.H.; Zhan, Y.; Sun, X.Y. The 2017 Jiuzhaigou earthquake: A complicated event occurred in a young fault system. Geophys. Res. Lett. 2018, 45, 2230–2240. [Google Scholar] [CrossRef]
  19. Wang, J.F.; Zhang, T.L.; Fu, B.J. A measure of spatial stratified heterogeneity. Ecol. Indic. 2016, 67, 250–256. [Google Scholar] [CrossRef]
  20. Fan, X.M.; Scaringi, G.; Xu, Q.; Zhan, W.W.; Dai, L.X.; Li, Y.S.; Huang, R.Q. Coseismic landslides triggered by the 8th August 2017 M s 7.0 Jiuzhaigou earthquake (Sichuan, China): Factors controlling their spatial distribution and implications for the seismogenic blind fault identification. Landslides 2018, 15, 967–983. [Google Scholar] [CrossRef]
  21. Tian, Y.Y.; Xu, C.; Ma, S.Y.; Xu, X.W.; Wang, S.Y.; Zhang, H. Inventory and spatial distribution of landslides triggered by the 8th August 2017 MW 6.5 Jiuzhaigou earthquake, China. J. Earth Sci. 2019, 30, 206–217. [Google Scholar] [CrossRef]
  22. Robinson, N.P.; Allred, B.W.; Smith, W.K.; Jones, M.O.; Moreno, A.; Erickson, T.A.; Running, S.W. Terrestrial primary production for the conterminous United States derived from Landsat 30 m and MODIS 250 m. Remote Sens. Ecol. Conserv. 2018, 4, 264–280. [Google Scholar] [CrossRef]
  23. Turner, D.P.; Ritts, W.D.; Cohen, W.B.; Gower, S.T.; Running, S.W.; Zhao, M.; Saleska, S.R. Evaluation of MODIS NPP and GPP products across multiple biomes. Remote Sens. Environ. 2006, 102, 282–292. [Google Scholar] [CrossRef]
  24. Peng, S.Z.; Ding, Y.X.; Liu, W.Z.; Li, Z. 1 km monthly temperature and precipitation dataset for China from 1901 to 2017. Earth Syst. Sci. Data 2019, 11, 1931–1946. [Google Scholar] [CrossRef]
  25. Peng, K.F.; Jiang, W.G.; Ling, Z.Y.; Hou, P.; Deng, Y.W. Evaluating the potential impacts of land use changes on ecosystem service value under multiple scenarios in support of SDG reporting: A case study of the Wuhan urban agglomeration. J. Clean. Prod. 2021, 307, 127321. [Google Scholar] [CrossRef]
  26. Zhang, S.R.; Bai, X.Y.; Zhao, C.W.; Tan, Q.; Luo, G.J.; Wu, L.H.; Song, F.J. China’s carbon budget inventory from 1997 to 2017 and its challenges to achieving carbon neutral strategies. J. Clean. Prod. 2022, 347, 130966. [Google Scholar] [CrossRef]
  27. Zhao, J.Y.; Li, J.J.; Zuo, L.L.; Liu, G.H.; Su, X.K. Interaction dynamics of multiple ecosystem services and abrupt changes of landscape patterns linked with watershed ecosystem regime shifts. Ecol. Indic. 2023, 150, 110263. [Google Scholar] [CrossRef]
  28. Wang, J.F.; Li, X.H.; Christakos, G.; Liao, Y.L.; Zhang, T.; Gu, X.; Zheng, X.Y. Geographical detectors-based health risk assessment and its application in the neural tube defects study of the Heshun Region. China. Int. J. Geogr. Inf. Sci. 2010, 24, 107–127. [Google Scholar] [CrossRef]
  29. Guo, J.G.; Wang, J.F.; Xu, C.D.; Song, Y.Z. Modeling of spatial stratified heterogeneity. GISci. Remote Sens. 2022, 59, 1660–1677. [Google Scholar] [CrossRef]
  30. Song, Y.Z.; Wang, J.F.; Ge, Y.; Xu, C.D. An optimal parameters-based geographical detector model enhances geographic characteristics of explanatory variables for spatial heterogeneity analysis: Cases with different types of spatial data. GISci. Remote Sens. 2020, 57, 593–610. [Google Scholar] [CrossRef]
  31. Li, L.D.; Liu, L.; Peng, Y.P.; Su, Y.Y.; Hu, Y.M.; Zou, R.Y. Integration of multimodal data for large-scale rapid agricultural land evaluation using machine learning and deep learning approaches. Geoderma 2023, 439, 116696. [Google Scholar] [CrossRef]
  32. Gunderson, L.H. Ecological resilience-in theory and application. Annu. Rev. Ecol. Syst. 2000, 31, 425–439. [Google Scholar] [CrossRef]
  33. Ponce-Campos, G.E.; Moran, M.S.; Huete, A.; Zhang, Y.; Bresloff, C.; Huxman, T.E.; Gunter, S.A. Ecosystem resilience despite large-scale altered hydroclimatic conditions. Nature 2013, 494, 349–352. [Google Scholar] [CrossRef] [PubMed]
  34. Sasaki, T.; Furukawa, T.; Iwasaki, Y.; Seto, M.; Mori, A.S. Perspectives for ecosystem management based on ecosystem resilience and ecological thresholds against multiple and stochastic disturbances. Ecol. Indic. 2015, 57, 395–408. [Google Scholar] [CrossRef]
  35. Zhou, Y.Y.; Yue, D.X.; Li, S.Y.; Liang, G.; Chao, Z.Z.; Zhao, Y.; Meng, X.M. Ecosystem health assessment in debris flow-prone areas: A case study of Bailong River Basin in China. J. Clean. Prod. 2022, 357, 131887. [Google Scholar] [CrossRef]
  36. Pan, Z.Z.; He, J.H.; Liu, D.F.; Wang, J.W.; Guo, X.N. Ecosystem health assessment based on ecological integrity and ecosystem services demand in the Middle Reaches of the Yangtze River Economic Belt, China. Sci. Total Environ. 2021, 774, 144837. [Google Scholar] [CrossRef]
  37. Komugabe-Dixson, A.F.; de Ville, N.S.; Trundle, A.; McEvoy, D. Environmental change, urbanisation, and socio-ecological resilience in the Pacific: Community narratives from Port Vila, Vanuatu. Ecosyst. Serv. 2019, 39, 100973. [Google Scholar] [CrossRef]
  38. Lei, J.J.; Li, C.S.; Yang, W.N. Ecosystem health assessment and approaches to improve Sichuan Province based on an improved vigor organization resilience model. Ecol. Indic. 2023, 155, 110925. [Google Scholar] [CrossRef]
  39. Lin, N.; Li, J.X.; Jiang, R.Z.; Li, X.; Liu, S. Quantifying the Spatiotemporal Variation of NPP of Different Land Cover Types and the Contribution of Its Associated Factors in the Songnen Plain. Forests 2023, 14, 1841. [Google Scholar] [CrossRef]
Figure 1. Datasets and technical procedures used in the study.
Forests 15 01381 g001
Figure 2. (a) Geographic location of the study area; (b,c) comparison of the landscape pre- and post-earthquake in Rize Valley.
Forests 15 01381 g002
Figure 3. Temporal variation in annual average NPP from 2001 to 2022 in co-seismic landslide areas triggered by the 2017 Jiuzhaigou earthquake.
Forests 15 01381 g003
Figure 4. Temporal and spatial variations in NPP: (a) NPP difference map between 2001−2016 and 2017−2020 and (b) NPP difference map between 2017−2020 and 2021−2022.
Forests 15 01381 g004
Figure 5. Pixel classification statistics for NPP difference maps: (a) NPP difference between 2001−2016 and 2017−2020 and (b) NPP difference between 2017−2020 and 2021−2022.
Forests 15 01381 g005
Figure 6. Spatial distribution of NPP recovery rate (left); NPP recovery rate proportion statistics (red means VPC is less than 0, green means VPC is more than 0) (right).
Forests 15 01381 g006
Figure 7. Processes of parameter optimization for continuous variable discretization: (a) rrecipitation, (b) yemperature, (c) elevation, and (d) slope.
Forests 15 01381 g007
Figure 8. OPGD-based explanatory variable exploration of NPP recovery: contributions of single variables on NPP recovery investigated by the factor detector.
Forests 15 01381 g008
Figure 9. OPGD-based explanatory variable exploration of NPP recovery: contributions of variable interactions on NPP recovery investigated by the interaction detector.
Forests 15 01381 g009
Figure 10. Spatial and temporal changes in land cover: (a) 5 August 2017, (b) 6 September 2017, and (c) 8 July 2022; (d) land cover percentage.
Forests 15 01381 g010
Figure 11. Vegetation recovery on co-seismic landslides over four years post-earthquake: (a) Panda Sea landslide photo taken 15 June 2021; (b) Red Sea landslide, photo taken 15 August 2021.
Forests 15 01381 g011
Table 1. Interactions between two explanatory variables and their interactive impacts.
Interaction RelationshipInteraction
Qa∩b < min (Qa, Qb)Nonlinear weaken: Impacts of single variables are nonlinearly weakened by the interaction of two variables.
min (Qa, Qb) ≤ Qa∩b ≤ max (Qa, Qb)Uni-variable weaken: Impacts of single variables are univariably weakened by the interaction.
max (Qa, Qb) < Qa∩b < (Qa + Qb)Bi-variable enhance: Impact of single variables are bi-variably enhanced by the interaction.
Qa∩b = (Qa + Qb)Independent: Impacts of variables are independent.
Qa∩b > (Qa + Qb)Nonlinear enhance: Impacts of variables are nonlinearly enhanced.
Qa is the Q value of variable a, Qb is the Q value of variable b, and Qa∩b is the Q value of the interaction between variables a and b.
Table 2. Ecosystem resilience of land cover types.
Forest LandGrasslandWater BodyBare Land
Resilience coefficient0.50.80.70.1
Resistance coefficient10.70.80.2
Ecosystem resilience0.70.760.740.14
Table 3. Discretization results for explanatory variables.
VariableMinMaxDiscretization MethodNo. of Intervals
Precipitation (mm)60.6173.85Natural7
Temperature (°C)−2.348.03Equal7
Elevation (m)2069.314320.80Natural6
Slope (°)3.6772.90Natural6
AspectCategorical variables, including Flat, North, Northeast, East, Southeast, South, Southwest, West, and Northwest9
LithologyCategorical variable, including Pds1, Pds2, Cpd1, Cpd2, Cm1, Cm2, Q, T2zg, Dcy, T1h, T2q, and T1l12
Table 4. Remote sensing image information.
5 August 20176 September 20178 July 2022
SensorPlanetPlanetGF-2
Resolution3 m3 m1 m
Table 5. Ecological resilience for each year.
5 August 20176 September 20178 July 2022
Ecosystem resilience0.540.480.51
Disclaimer/Publisher’s Note: The statements, opinions and data contained in all publications are solely those of the individual author(s) and contributor(s) and not of MDPI and/or the editor(s). MDPI and/or the editor(s) disclaim responsibility for any injury to people or property resulting from any ideas, methods, instructions or products referred to in the content.

