Article

Response of Fuel Characteristics, Potential Fire Behavior, and Understory Vegetation Diversity to Thinning in Platycladus orientalis Forest in Beijing, China

1
Beijing Key Laboratory for Forest Resources and Ecosystem Processes, Beijing Forestry University, Beijing 100083, China
2
Emergency Management Department Key Laboratory of Forest and Grassland Fire Risk Prevention and Control, Beijing 102202, China
*
Author to whom correspondence should be addressed.
Forests 2024, 15(9), 1667; https://doi.org/10.3390/f15091667
Submission received: 5 August 2024 / Revised: 30 August 2024 / Accepted: 18 September 2024 / Published: 22 September 2024
(This article belongs to the Special Issue Fire Ecology and Management in Forest—2nd Edition)

Abstract

:
Objective: Active fuel management operations, such as thinning, can minimize extreme wildfire conditions while preserving ecosystem services, including maintaining understory vegetation diversity. However, the appropriate thinning intensity for balancing the above two objectives has not been sufficiently studied. Methods: This study was conducted to assess the impact of various thinning intensities (light thinning, LT, 15%; moderate thinning, MT, 35%; heavy thinning, HT, 50%; and control treatment, CK) on fuel characteristics, potential fire behavior, and understory vegetation biodiversity in Platycladus orientalis forest in Beijing using a combination of field measurements and fire behavior simulations (BehavePlus 6.0.0). Results: A significant reduction in surface and canopy fuel loads with increasing thinning intensity, notably reducing CBD to below 0.1 kg/m3 under moderate thinning, effectively prevented the occurrence of active crown fires, even under extreme weather conditions. Additionally, moderate thinning enhanced understory species diversity, yielding the highest species diversity index compared to other treatments. Conclusions: These findings suggest that moderate thinning (35%) offers an optimal balance, substantially reducing the occurrence of active crown fires while promoting biodiversity. Therefore, it is recommended to carry out moderate thinning in the study area. Forest managers can leverage this information to devise technical strategies that simultaneously meet fire prevention objectives and enhance understory vegetation species diversity in areas suitable for thinning-only treatments.

1. Introduction

Wildfires are expected to become more frequent as a result of climate change, posing a growing threat to ecosystems [1]. China is one of the regions in the world with large wildfire activity and a high frequency of wildfires [2,3]. From 2021 to 2050, the forest fire danger index will increase in most parts of China, including North China [4]. Therefore, this area is the key area for forest fire prevention, and it is necessary to carry out targeted forest fire management measures to reduce forest fire hazards. Platycladus orientalis forest, one of the most widespread coniferous species in China, is a typical coniferous forest in North China and an important ecological barrier in the Beijing area [5,6,7]. However, the vertical continuity and horizontal continuity of P. orientalis are very high; if a forest fire occurs, the crown fire is likely to occur, burning the entire forest [8]. In summary, a scientific and effective fuel regulation program is critical to reducing wildfire potential and slowing intense fire behavior in P. orientalis [9,10]. Fuel management treatments, including forest thinning, pruning, prescribed fire, and creating fire breaks, can inhibit the rapid spread of forest fires and the occurrence and development of high-intensity crown fires by changing the characteristics of fuels and maintaining them [11]. Many studies advocate that a synergistic approach combining thinning and prescribed burning more effectively mitigates forest fire risk [12,13]. Nevertheless, thinning becomes particularly vital in regions where prescribed burns are not feasible due to legislative restrictions or risks of fire escape, such as in the mountainous areas of Beijing, dense forest ecosystems with ladder fuels [14,15,16,17,18,19]. Hence, determining the effectiveness of thinning alone in mitigating fire risks is essential for fire and fuel management in these regions. Forest fuel is a fundamental component underlying the occurrence of forest fires. Previous studies have observed variable responses of surface fuel load to different thinning densities [11,20,21,22]. This may be related to stand type and stand structure that was thinned [23,24]. Canopy fuel load (CFL), canopy bulk density (CBD), and canopy base height (CBH) are essential parameters to describe canopy fuel characteristics and simulate canopy potential fire behavior. Destructive sampling is more accurate, but it is too destructive to trees [25,26,27]. Therefore, this paper intends to use the standard branch method to estimate the characteristics of forest canopy fuels without destroying the forest as much as possible [28]. The impact of thinning on the value of canopy fuel characteristics is consistent; that is, thinning usually reduces canopy fuel characteristics [11,29,30,31,32,33]. Previous studies have evaluated the response of various types of surface and canopy fuels to thinning across different regions. However, the intensity of thinning treatments in those studies was often not precisely defined. Therefore, this study incorporates three distinct thinning intensities—low, moderate, and high—to address this gap.
The reduction in fuel hazards is becoming an integral part of the P. orientalis management in Beijing. The effectiveness of thinning in mitigating fire hazards has been well demonstrated by using model-simulated experimental fires and real wildfire case studies [34,35]. To be specific, thinning could reduce the surface fire fireline intensity, flame length, and spread rate [36,37,38]. In addition, thinning may lead to a decrease in the active crown fire spread rate, fireline intensity, flame length, and other indicators of canopy potential fire behavior [21,32,39]. However, the longevity of these effects varies with tree species, regions, and other factors [21,32,35]. Previous studies have separately investigated potential surface fire behavior and crown fire behavior, but few have integrated these aspects or provided detailed analyses of canopy fire behavior indicators. Additionally, there are few studies on the quantification of fuel load and potential fire behavior of P. orientalis after thinning in the Beijing mountainous area, and there is a lack of research on the mid-term response of canopy fuel characteristics and canopy potential fire behavior to thinning [16].
Assessing the efficiency of fuel reduction practices is of great importance to determine appropriate fuel regulation programs. In regions where fire experiments are unfeasible, simulation tools for predicting fire behavior, such as BehavePlus 6.0.0, NEXUS 2.1, FARSITE 4.0, and FlamMap 6.2, are commonly used [40]. Among these, BehavePlus software is the most extensively employed across various forest regions in China, including the Daxing’anling Mountains [41], Liaoheyuan Nature Reserve [42], Beijing Jiufeng National Forest Park [43], mountainous area of Shandong Province [44], southwest forest area of Sichuan Province [45], Kunming National Forest Park [46], etc. These regions span the four natural geographical divisions of Northeast China, North China, East China, and Southwest China.
However, increasing fuel reduction levels to mitigate wildfire risks may conflict with the objective of preserving forest biodiversity. Biodiversity is an important feature of forest ecosystems, serving as a key indicator of forest quality. Greater biodiversity is beneficial for maintaining ecosystem stability and enhancing ecosystem function [47]. The alpha diversity index is a frequently employed metric in ecological research, mainly including species richness, species diversity, species evenness, and so on [48]. Thinning has been shown to be a valid method of managing tree biodiversity [49]. The effects of different thinning intensities are mostly different, and the results are also restricted by region, stand type, initial density, and thinning method [50,51,52,53]. For example, Deng et al. [54] proposed that the optimal thinning intensity to improve the species diversity of understory vegetation in Pinus massoniana forests is 50%–60%; however, the results of Bao et al. [55] showed that the diversity index of forest plants was the highest after moderate thinning, and the diversity index decreased after high thinning. Therefore, the effects of thinning measures on understory plant diversity differ across regions and forest types, and targeted management measures should be developed through research.
Research on the effects of thinning on the main stands of Xishan Forest Farm in Beijing has primarily concentrated on the impacts of thinning intensity (0%, 15%, 35%, 50%) on the carbon storage, surface fuel, and surface fire behavior in Pinus tabulaeformis forest and Robinia pseudoacacia forest [18,56,57]. However, little research has been conducted on how the P. orientalis forest responds to different thinning intensities in fuel properties, canopy potential fire behavior, and understory vegetation biodiversity. Furthermore, it is less certain whether the appropriate fuel treatment intensity has achieved ecological goals such as enhancing the understory vegetation diversity of the P. orientalis forest. Quantifying the impact of thinning on fuel load, potential fire behavior, and understory vegetation diversity will address the key knowledge gaps of forest managers in North China and other regions with similar forest management objectives in China. Therefore, we used field data to ask: (1) How do different thinning intensities influence the fuel characteristics, potential fire behavior, and understory vegetation biodiversity in P. orientalis forest? (2) Which thinning intensity best balances the reduction in active crown fire risk with the enhancement of understory vegetation biodiversity in P. orientalis forests?

2. Materials and Methods

2.1. Study Areas

The study site is located in the Beijing Xishan Experimental Forestry Farm (115°22′–117°30′ E, 39°12′–40°05′ N) (Figure 1). The forest farm’s total area is 5949 hm2. The forest average elevation ranges from 300 to 400 m, and its slopes range from 10 to 40 degrees [57]. The soil is mountain brown soil. The study area is in a mild temperate continental monsoon zone, which means that spring and winter, when forest fires typically occur, are also dry and windy. The mean annual temperature is 11.6 °C. The mean annual precipitation is 630 mm, 75% of which occurs between July and August. The region contains rich natural resources. Warm temperate deciduous broadleaved forest is the predominant vegetation type, with Pinus tabuliformis and P. orientalis dominating the coniferous forests. P. orientalis, as a typical artificial coniferous forest, is widely distributed in this area. The results of the forest resource inventory showed that the P. orientalis forest area accounted for 20.17% of the city arbor forest area, ranking first in the city by tree species area. According to historical data from 1985 to 2023, there were 247 forest fires in Xishan Forest Farm.

2.2. Experimental Design

The Xishan Forestry Farm has been thinning since the 1980s. Our study involved a meticulous site selection process, focusing on P. orientalis plantations with similar geographical and soil characteristics, as well as similar plant community compositions. Subsequently, plots subjected to varying intensities of thinning across different years were identified. The treatments were light thinning (LT, 15%), moderate thinning (MT, 35%), heavy thinning (HT, 50%), and control (CK, unthinned). Thinning was completed in 2014, 2016, and 2018. All thinned residues (i.e., stems, leaves, branches, bark, twigs) were removed from the stands. Importantly, none of the plots had undergone other treatments before the study.
In 2021, three experimental plots (20 m × 20 m) were set up for each treatment, leading to a total of 36 plots. To avoid potential edge effects, adjacent plots have more than 10 m buffer. In this study, the intensity of thinning, which is the ratio of the number of trees cut to the number of trees before thinning, was divided into the following grades: 10–25% for light thinning, 26–35% for moderate thinning, and 36–50% for heavy thinning [58,59].
Within each standardized plot, comprehensive assessments were conducted on environmental and stand factors, including parameters such as tree density (N, number of stems per hectare), mean diameter at breast height (DBH), mean stand height ( H ¯ ), and other relevant variables. Specifically, all trees with a DBH exceeding 5 cm were included in the analysis. A basic plot profile is outlined in Table 1.

2.3. Fuel Investigation and Sampling

2.3.1. Surface Fuel Investigation

Surface fuel was categorized into three main types: litter (including downed and dead woody debris and litter leaves), herbs, and shrubs (Table 2). Specifically, downed and dead woody fuel were distinguished based on time-lag size classes: 1 h (0–0.64 cm), 10 h (0.64–2.54 cm), 100 h (2.54–7.62 cm), and 1000 h (>7.62 cm) [60]. Litter leaves were divided into upper and lower layers based on their decomposition stage. The five-point sampling method was used to estimate the fuel load of all treatments [42]. The representative subplots (five shrub subplots (5 × 5 m) and five herb subplots (1 × 1 m)) were selected in the plots to investigate the shrubs and herbs. Then, the downed and dead woody debris and litter leaves were investigated on the herb subplots. Samples were collected using whole plant sampling techniques, and prior to sampling, litter depth and fuel bed depth were measured in each subplot. Samples were weighed, with 200 g of material taken from each subplot. The surface area to volume ratio was determined according to previous research in the mountainous regions of Beijing [8].

2.3.2. Crown Fuel Investigation

Three canopy fuel variables were evaluated for each plot: CBH, CFL, and CBD. CBH represents the mean height to the base of the crown in each plot; CFL quantifies the needles and branch biomass from all trees in the plot, serving as fuel susceptible to consumption in crown fires. CBD is computed by dividing CFL by the crown length, where crown length equals the mean stand height minus CBH [11].
CFL was determined using the standard branch method (Figure 2), and three standard trees were chosen per plot for this purpose. According to the canopy height of the standard tree, it was divided into three layers: upper, middle, and lower layers. Within each layer, measurements were taken for the number of branches, basal diameter, and branch length (including live and dead branches). Additionally, one living branch (with good growth and medium leaf volume) and one representative dead branch (with moderate size and length) were selected as standard branches in each layer, totaling 432 standard branches investigated across all plots. For living standard branches, the fresh mass of branches with diameters greater than 1 cm, less than 1 cm, and all needles were recorded. Dead standard branches were assessed for fresh mass across different time-lag size classes [8].
The relationship between standard branch weight and basal diameter and length was fitted by the allometric growth equation model [28]. In order to eliminate the heteroscedasticity, the logarithmic transformation was applied, and the correction coefficient (CF) was calculated to eliminate the deviation caused by the logarithmic transformation. The adjusted coefficient of determination (R2adj), the Akaike information index (AIC), and mean squared error (MSE) were used to select the optimal model.
The optimal statistical model was as follows:
W i = n   e x p α 0 + α 1 l n H + α 2 l n D + α 3 H + α 4 D + α 5 H D
where Wi is the dry mass of the live or dead fuel in layer i (kg); H is the mean branch length of live or dead fuel branches (m); D is the mean basal diameter of live or dead fuel branches (cm); n is the number of live or dead fuel branches; and α is the estimated parameter. The canopy fuel mass regression model is shown in Table 3.
W s = i = 1 m W i l + W i d
where Ws is the total fuel dry mass in a single canopy layer (kg); Wil is the dry mass of live fuel (kg); Wid is the dry mass of dead fuel (kg); and m is the total number of layers in a single canopy.
W r = k = 1 N W s S
where Wr is the sample plot CFL (kg.m−2); Ws is the individual canopy fuel dry mass (kg); N is the number of trees in the sample plot; and S is the sample plot area (m2).
C z = k = 1 N W s S ( H H c )
where Cz is the sample plot CBD (kg.m−3); H ¯ is the average height of trees in the sample plot (m); and Hc is the average canopy base height in the sample plot (m).

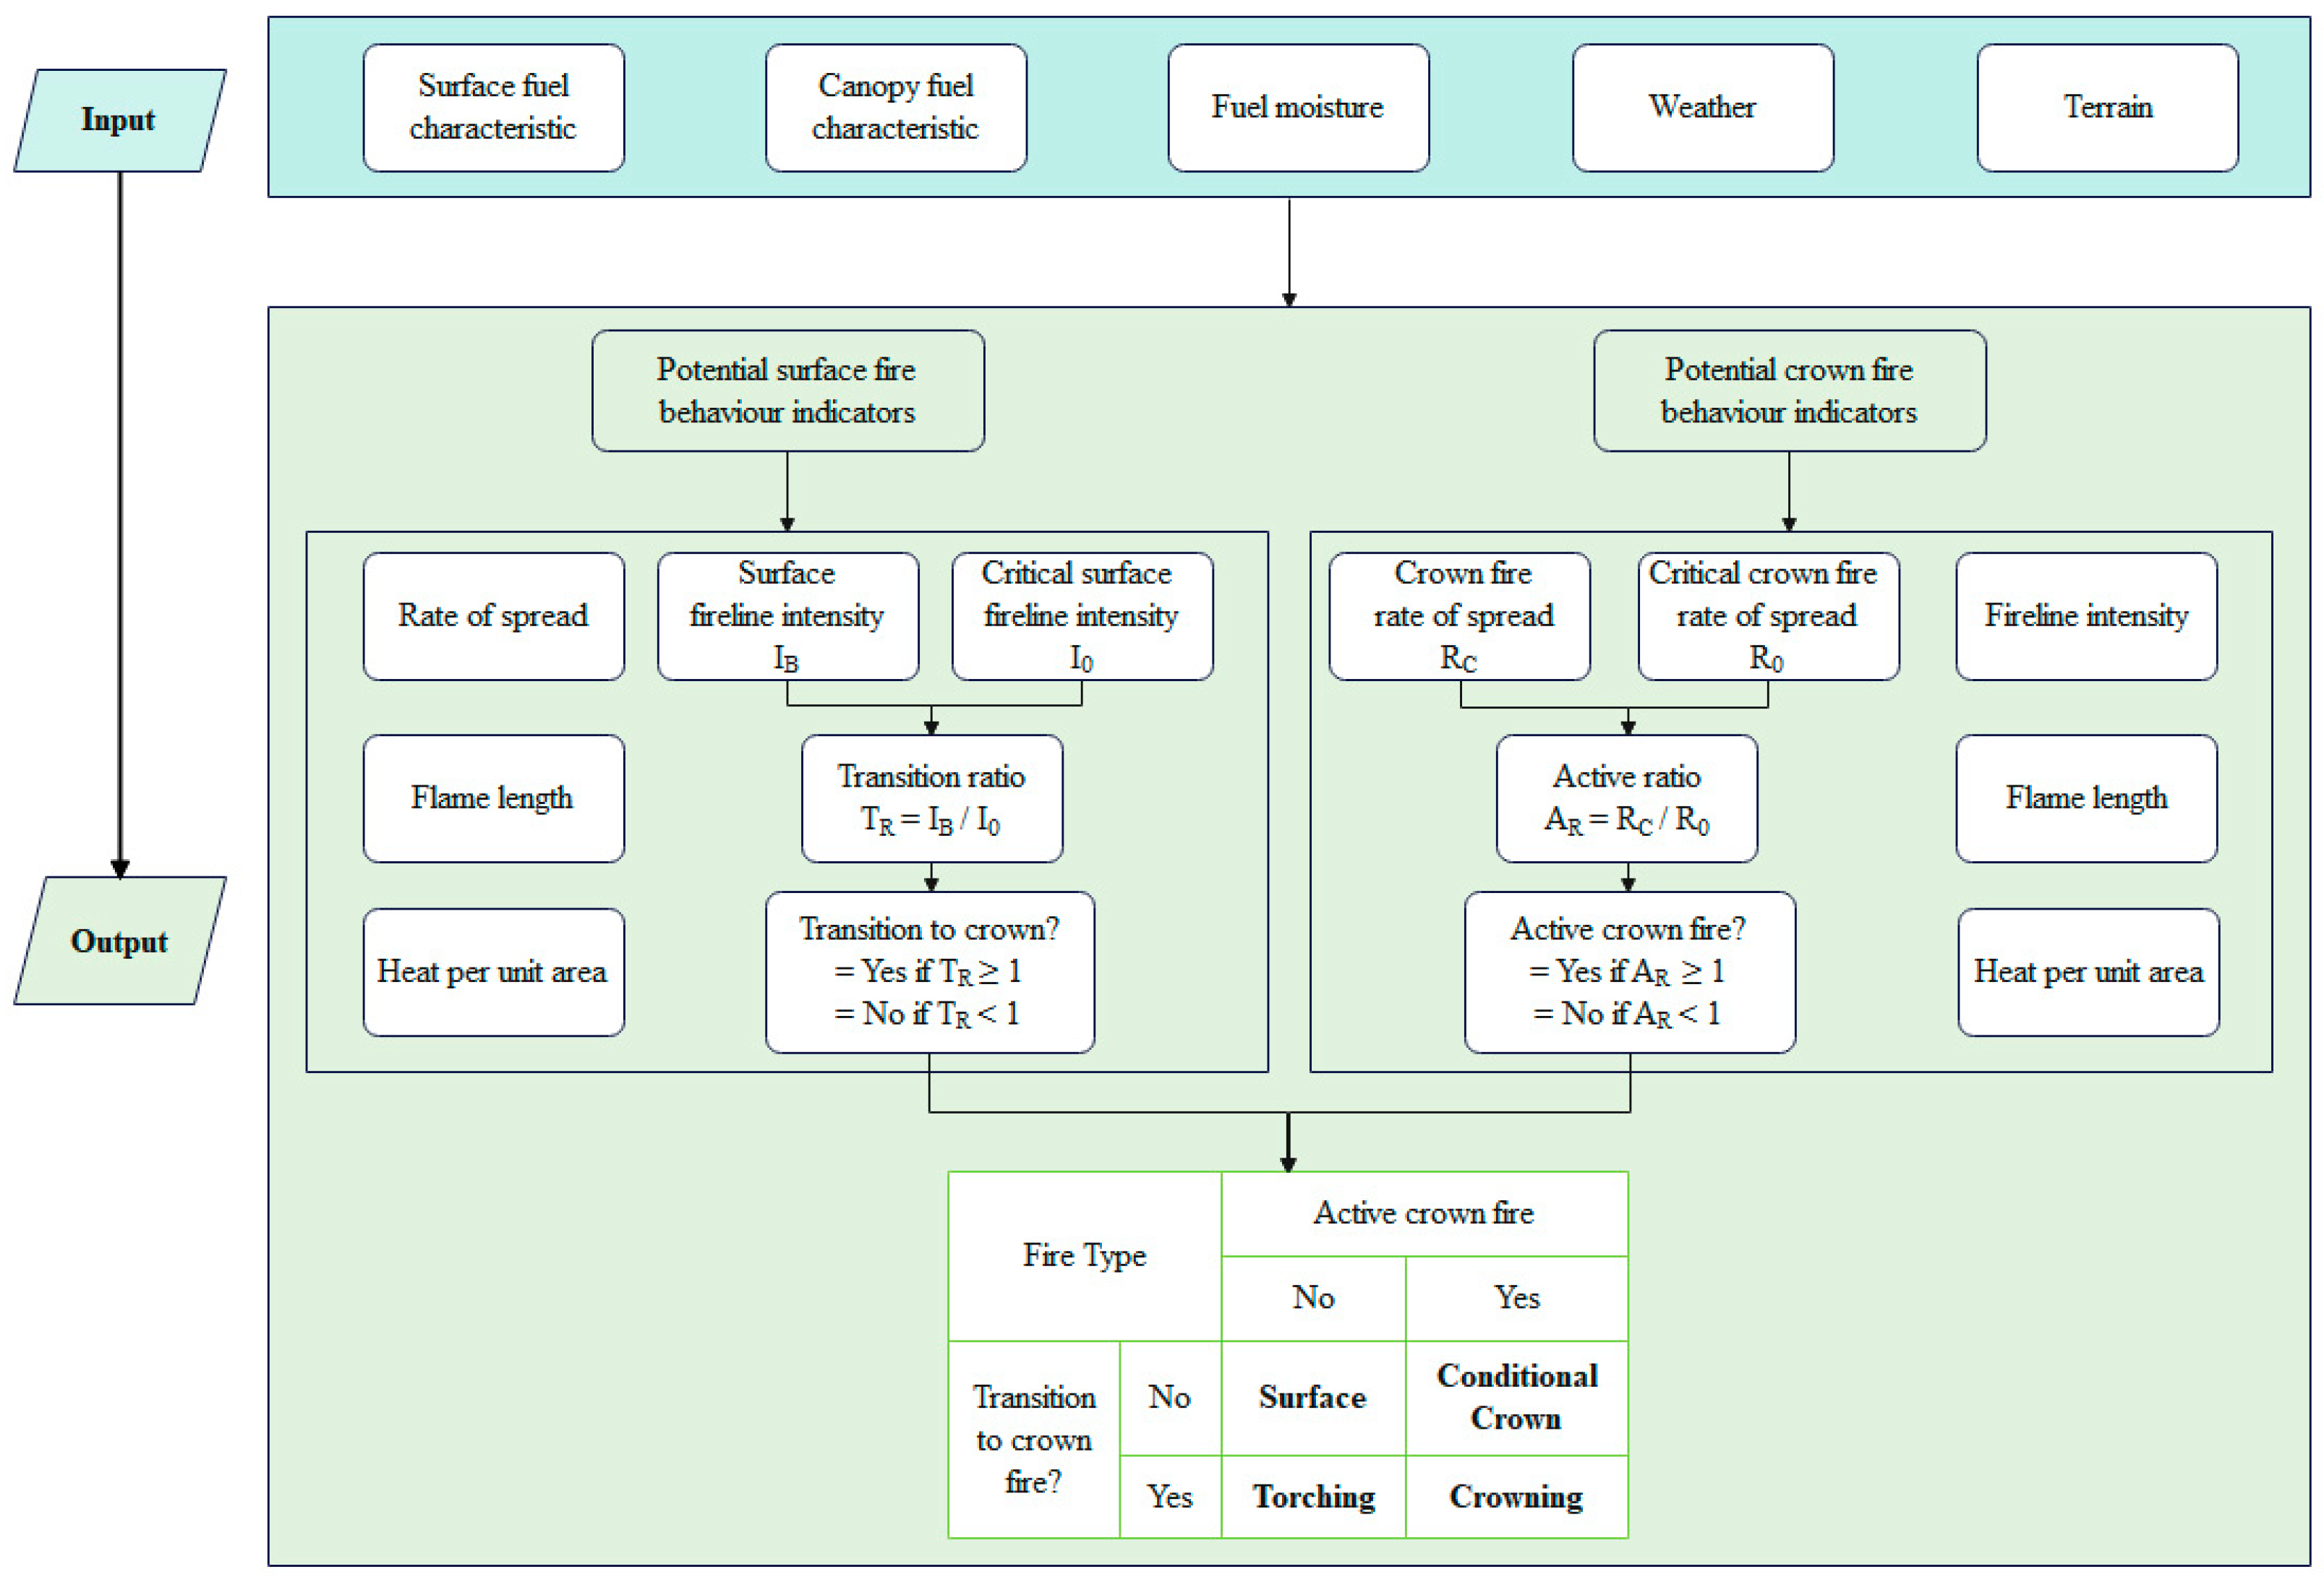
2.4. Potential Fire Behavior Modelling

Potential surface and canopy fire behavior parameters can be simulated using BehavePlus 6.0.0 software [61], which requires the input of fuel data including 1 h fuel load, 10 h fuel load, 100 h fuel load, live herb fuel load, live woody fuel load, surface area to volume ratio, fuel bed depth, CFL, CBD, CBH, and so on. These variables, among others, as depicted in Table S1, are crucial inputs for the software to model and predict fire behavior under various conditions. Two factors are closely related to potential fire behavior: 10-m wind speed and moisture content of fuels. Based on the observation data (including extreme weather and wind gusts) from the Beijing 54511 meteorological observation station since 1991, the 10-m wind speed range was set to 0–14 m/s [62]. According to the investigation, BehavePlus software was utilized to select low moisture conditions. Consequently, in this study, extreme forest fire conditions are defined as those characterized by low moisture content and a 10-m wind speed of 14 m/s.
The following fire behavior parameters were calculated: surface fire spread rate, surface fireline intensity, critical fireline intensity, surface flame length, heat per unit area of the surface fire, trans ratio, crown fire rate of spread, critical crown fire rate of spread, crown fireline intensity, crown fire flame length, and heat per unit area, active ratio. These indicators are important indicators reflecting the characteristics of potential fire behavior and can determine the type of forest fire. As shown in Figure 3, the transition ratio is the surface fireline intensity divided by the critical surface fireline intensity. A transition to crown fire is indicated if the transition ratio is greater than or equal to one. The active ratio, on the other hand, is the crown fire spread rate divided by the critical crown fire spread rate. If the active ratio equals or exceeds one, it suggests the fire may be an active crown fire.

2.5. Understory Vegetation Diversity Investigation and Analysis

In each plot, five 5 m × 5 m shrub quadrats were set up in the four corners and the center by diagonal method to investigate the species, coverage, and height of shrubs and small trees (DBH < 3.0 cm). At the same time, within each shrub quadrat, small 1 m × 1 m quadrats were established to investigate and record the species, abundance, height, and coverage of herbs.
The species richness index is represented by the Gleason index (D′), the diversity index is represented by the Shannon–Wiener index (H), the dominance index is represented by the Simpson index (D), and the evenness index is represented by the Pielou evenness index (J) [63,64,65]:
D = S / ln A
where S is the number of plant species, and A is the unit area of vegetation quadrat.
H = i = 1 n P i ln P i
P i = N i / N
where Pi is the proportion of a species in the plot, Ni is the number of individuals of a species, and N is the total number of individuals.
D = 1 i = 1 n P i 2
where Pi is the proportion of the i-th individual in the plot.
J = ( i = 1 n P i ln P i ) / ln S
where Pi is the relative importance value of a species.

2.6. Statistical Analysis

The subsequent fuel load and other variables, including downed and dead woody fuel loads (1 h, 10 h, 100 h), litter leaves fuel loads, live fuel loads (herb and shrub), fuel bed depth, canopy characteristics (CFL and CBD), and understory vegetation diversity, were tested using ANOVA to determine the impact of thinning intensity. A Tukey honest significant difference (HSD) test was performed to confirm particular differences if disagreements were found. SPSS 26.0 was used for data analysis. Origin 2024 was used for visualization.

3. Results

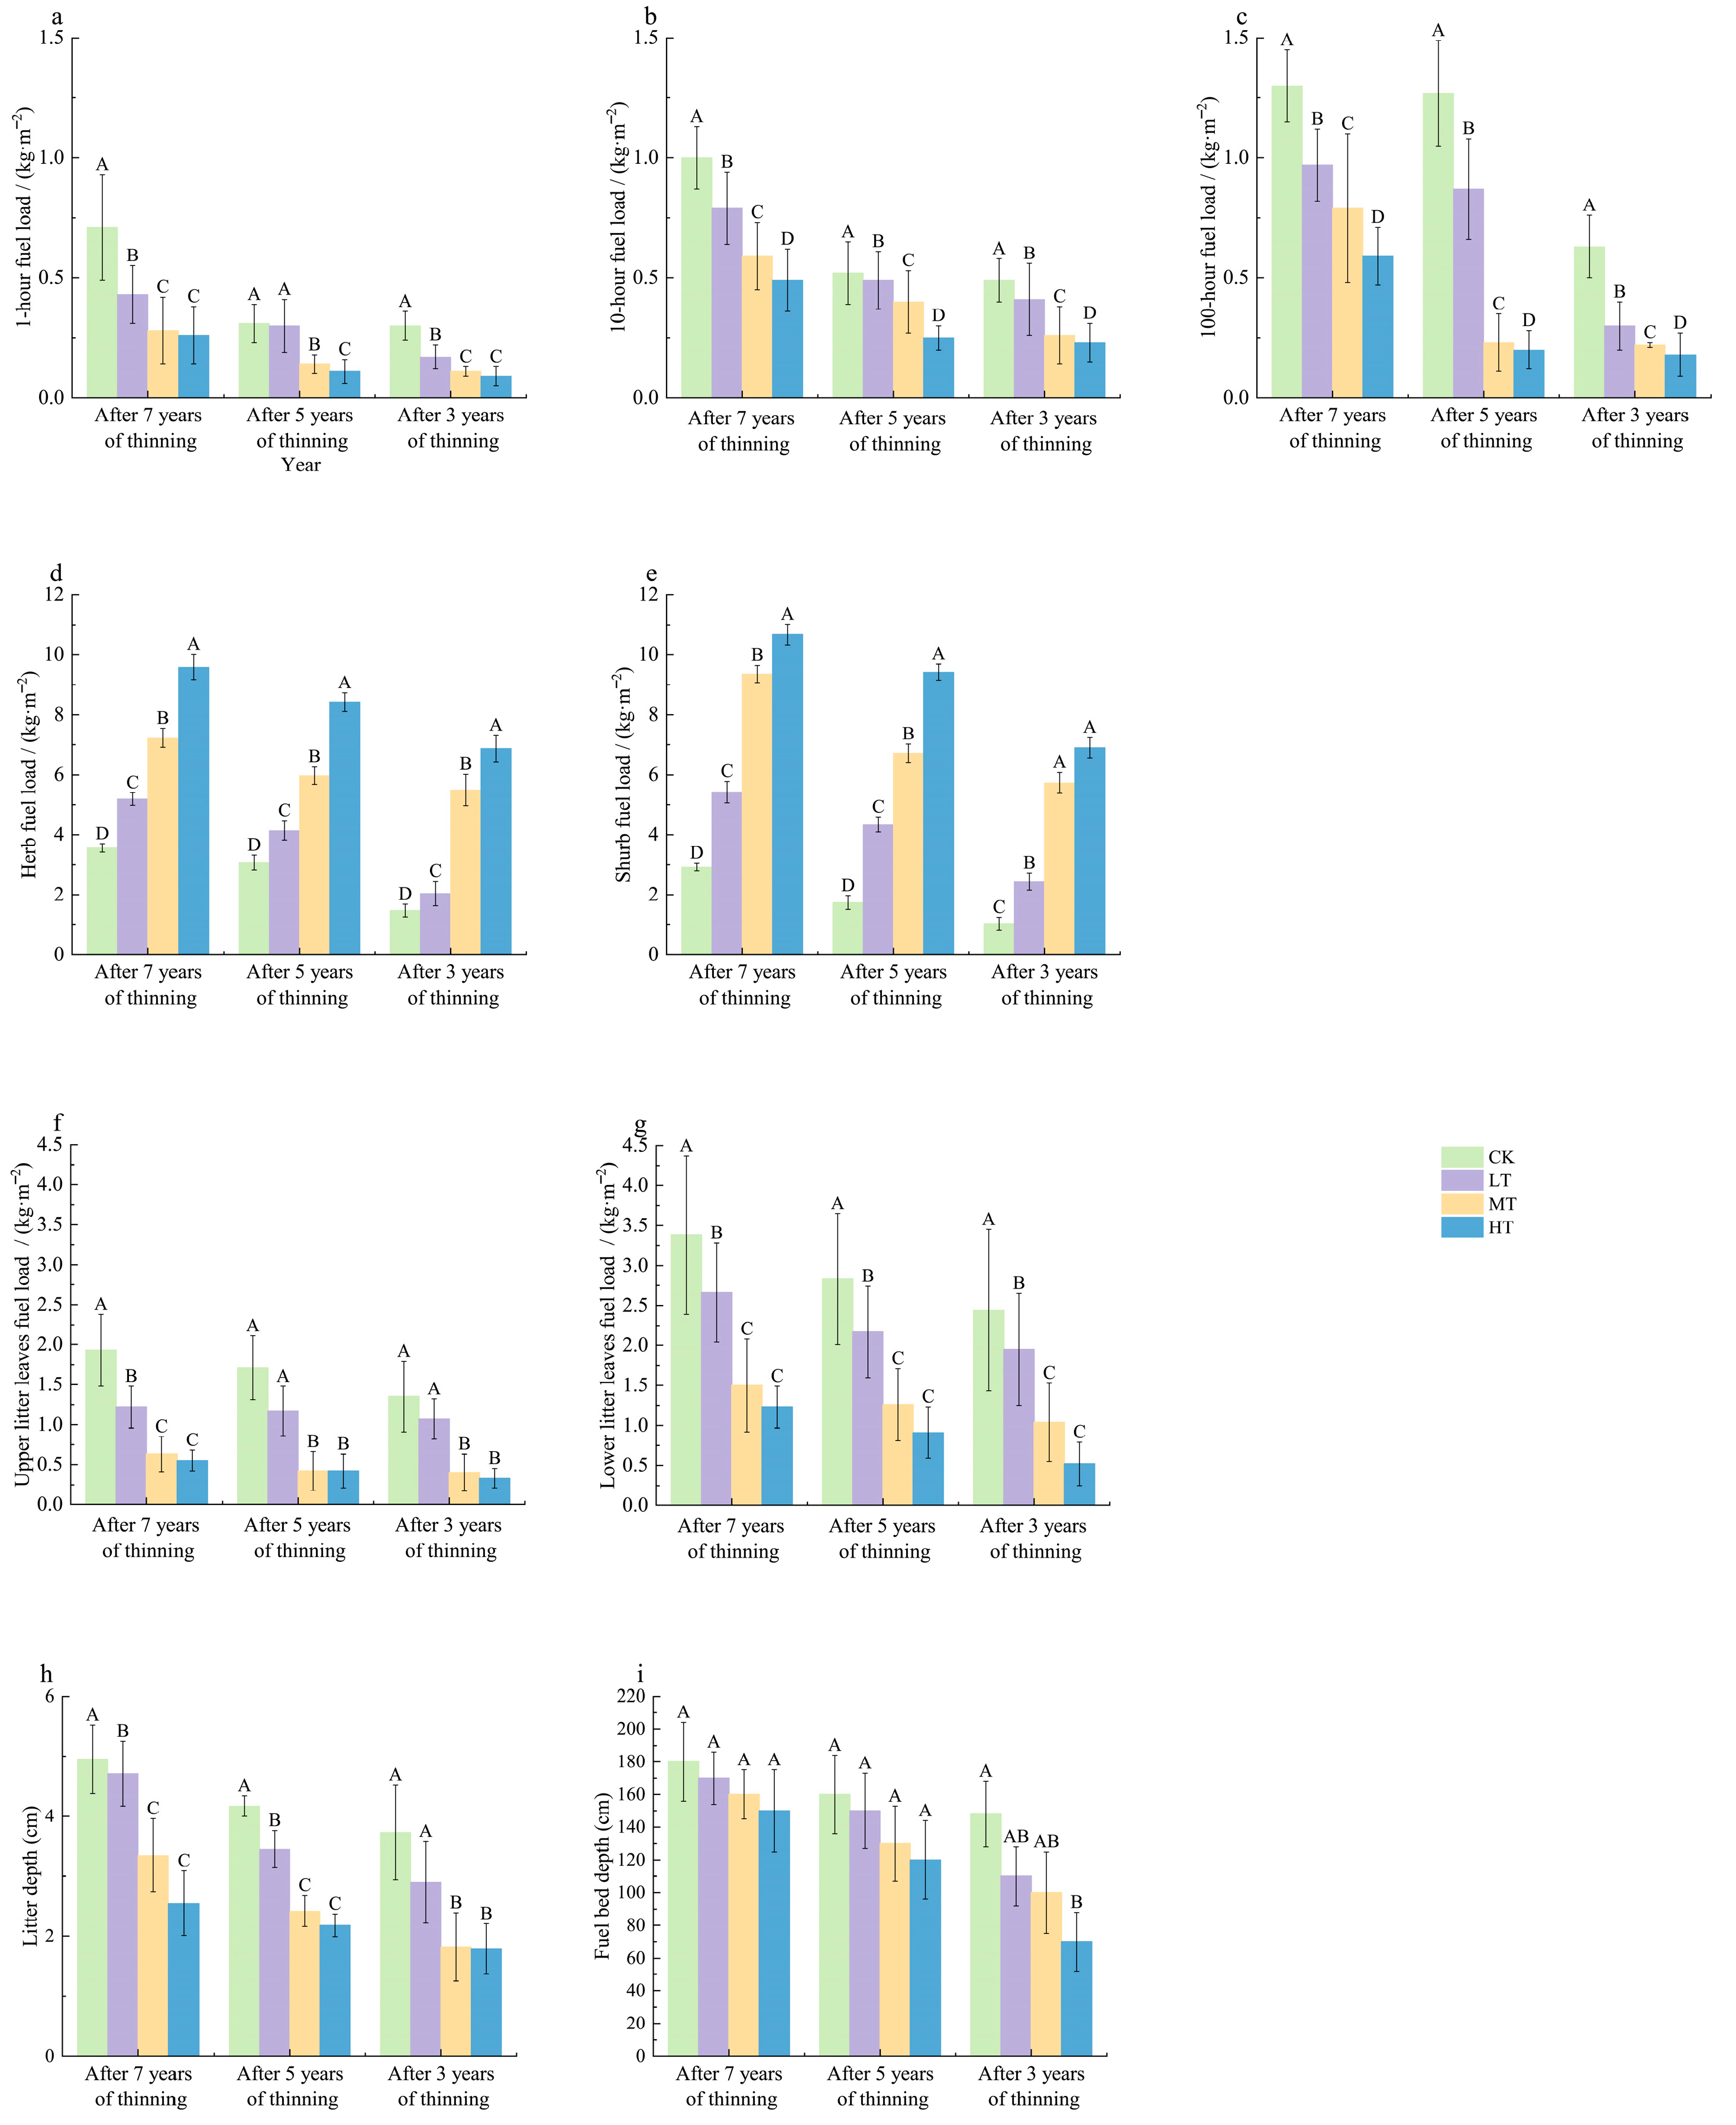
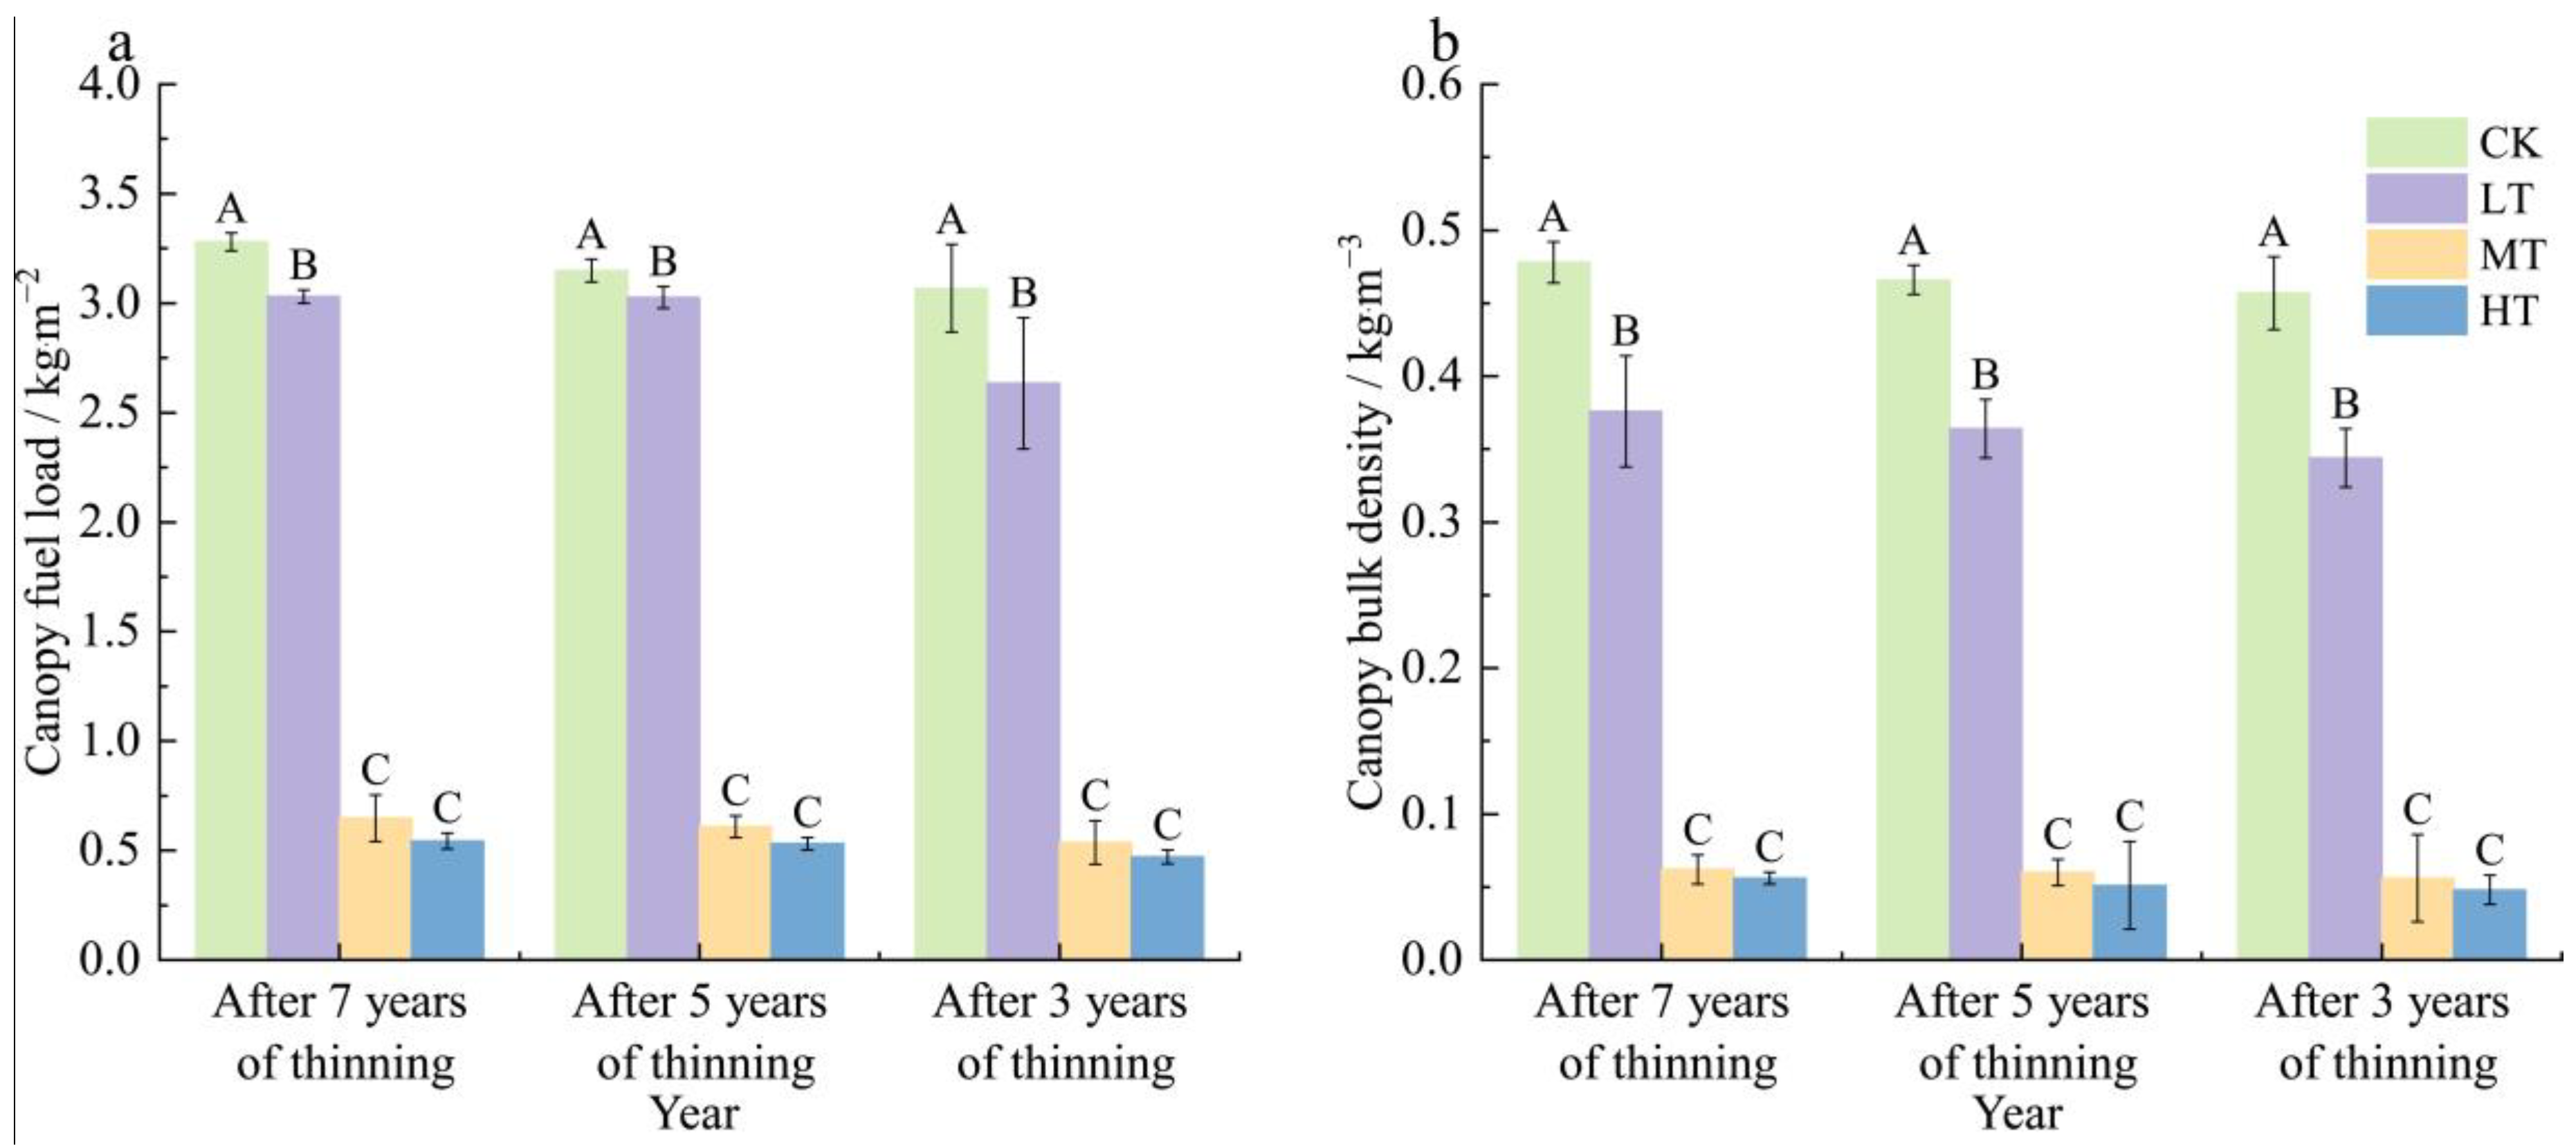
3.1. Variations in Surface Fuel and Canopy Fuel Characteristics under Different Thinning Intensities

The surface fuel loading at different thinning intensities varied with fuel type. As thinning intensity increased, significant reductions were observed in downed and dead woody fuel loads and litter leaf fuel loads; conversely, the live fuel loads increased notably (Figure 4). Additionally, both litter depth and fuel bed depth showed significant decreases with increasing thinning intensity (Figure 4). Seven years after thinning, compared to the control, the downed and dead woody fuel loads decreased by an average of 0.82 kg.m−2, 1.35 kg.m−2, and 1.67 kg.m−2 under the LT, MT, and HT treatment, respectively, while live fuel loads increased by 4.13 kg.m−2, 10.11 kg.m−2, and 13.78 kg.m−2, respectively (Figure 4). The upper litter leaves and lower litter leaves were reduced by 67.36% and 55.62% relative to those under CK (Figure 4). The litter depth under MT reduced by 32.32% relative to this under CK (Figure 4).
Thinning treatments also significantly reduced canopy bulk density (CBD) and canopy fuel load (CFL) compared to the control (Figure 5). For instance, CFL decreased by 7.62%, 80.18%, and 83.45% under LT, MT, and HT, respectively, seven years after thinning. CBD was reduced below 0.10 kg.m−3 after MT and HT treatments. However, CBD and CFL did not differ significantly between the MT and HT treatments (Figure 5).

3.2. Variations in Potential Fire Behavior under Different Thinning Intensities

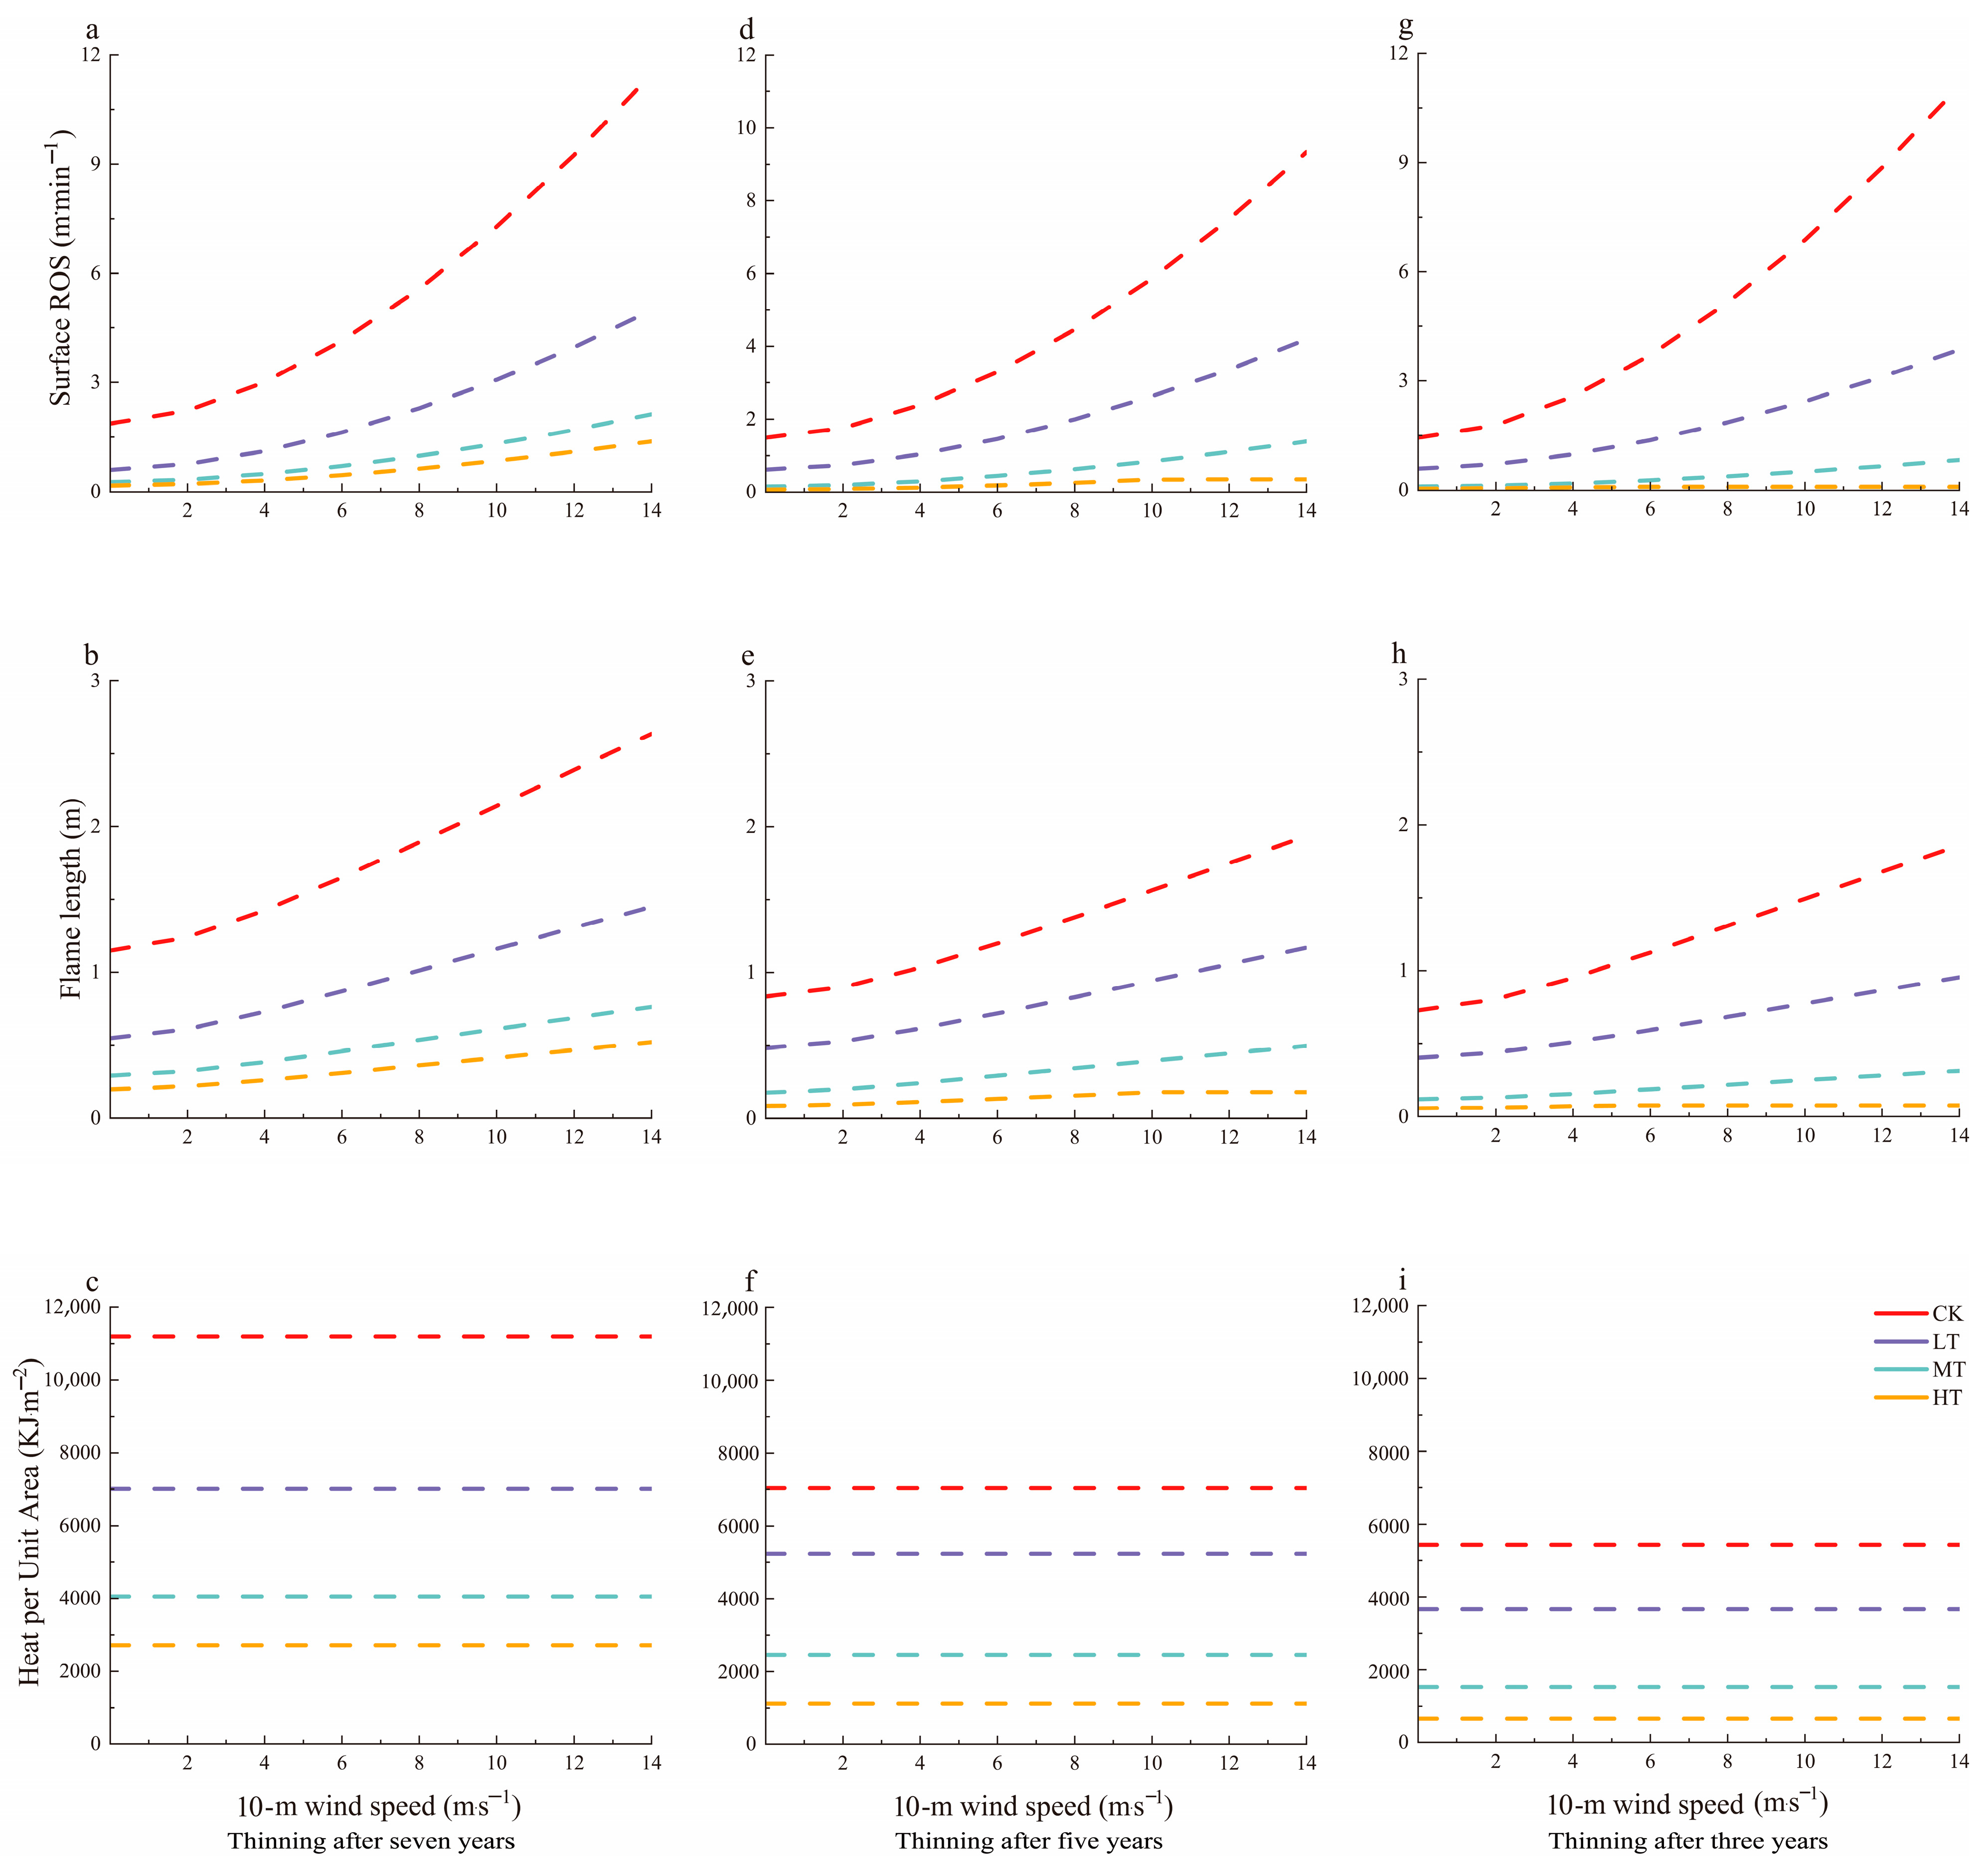
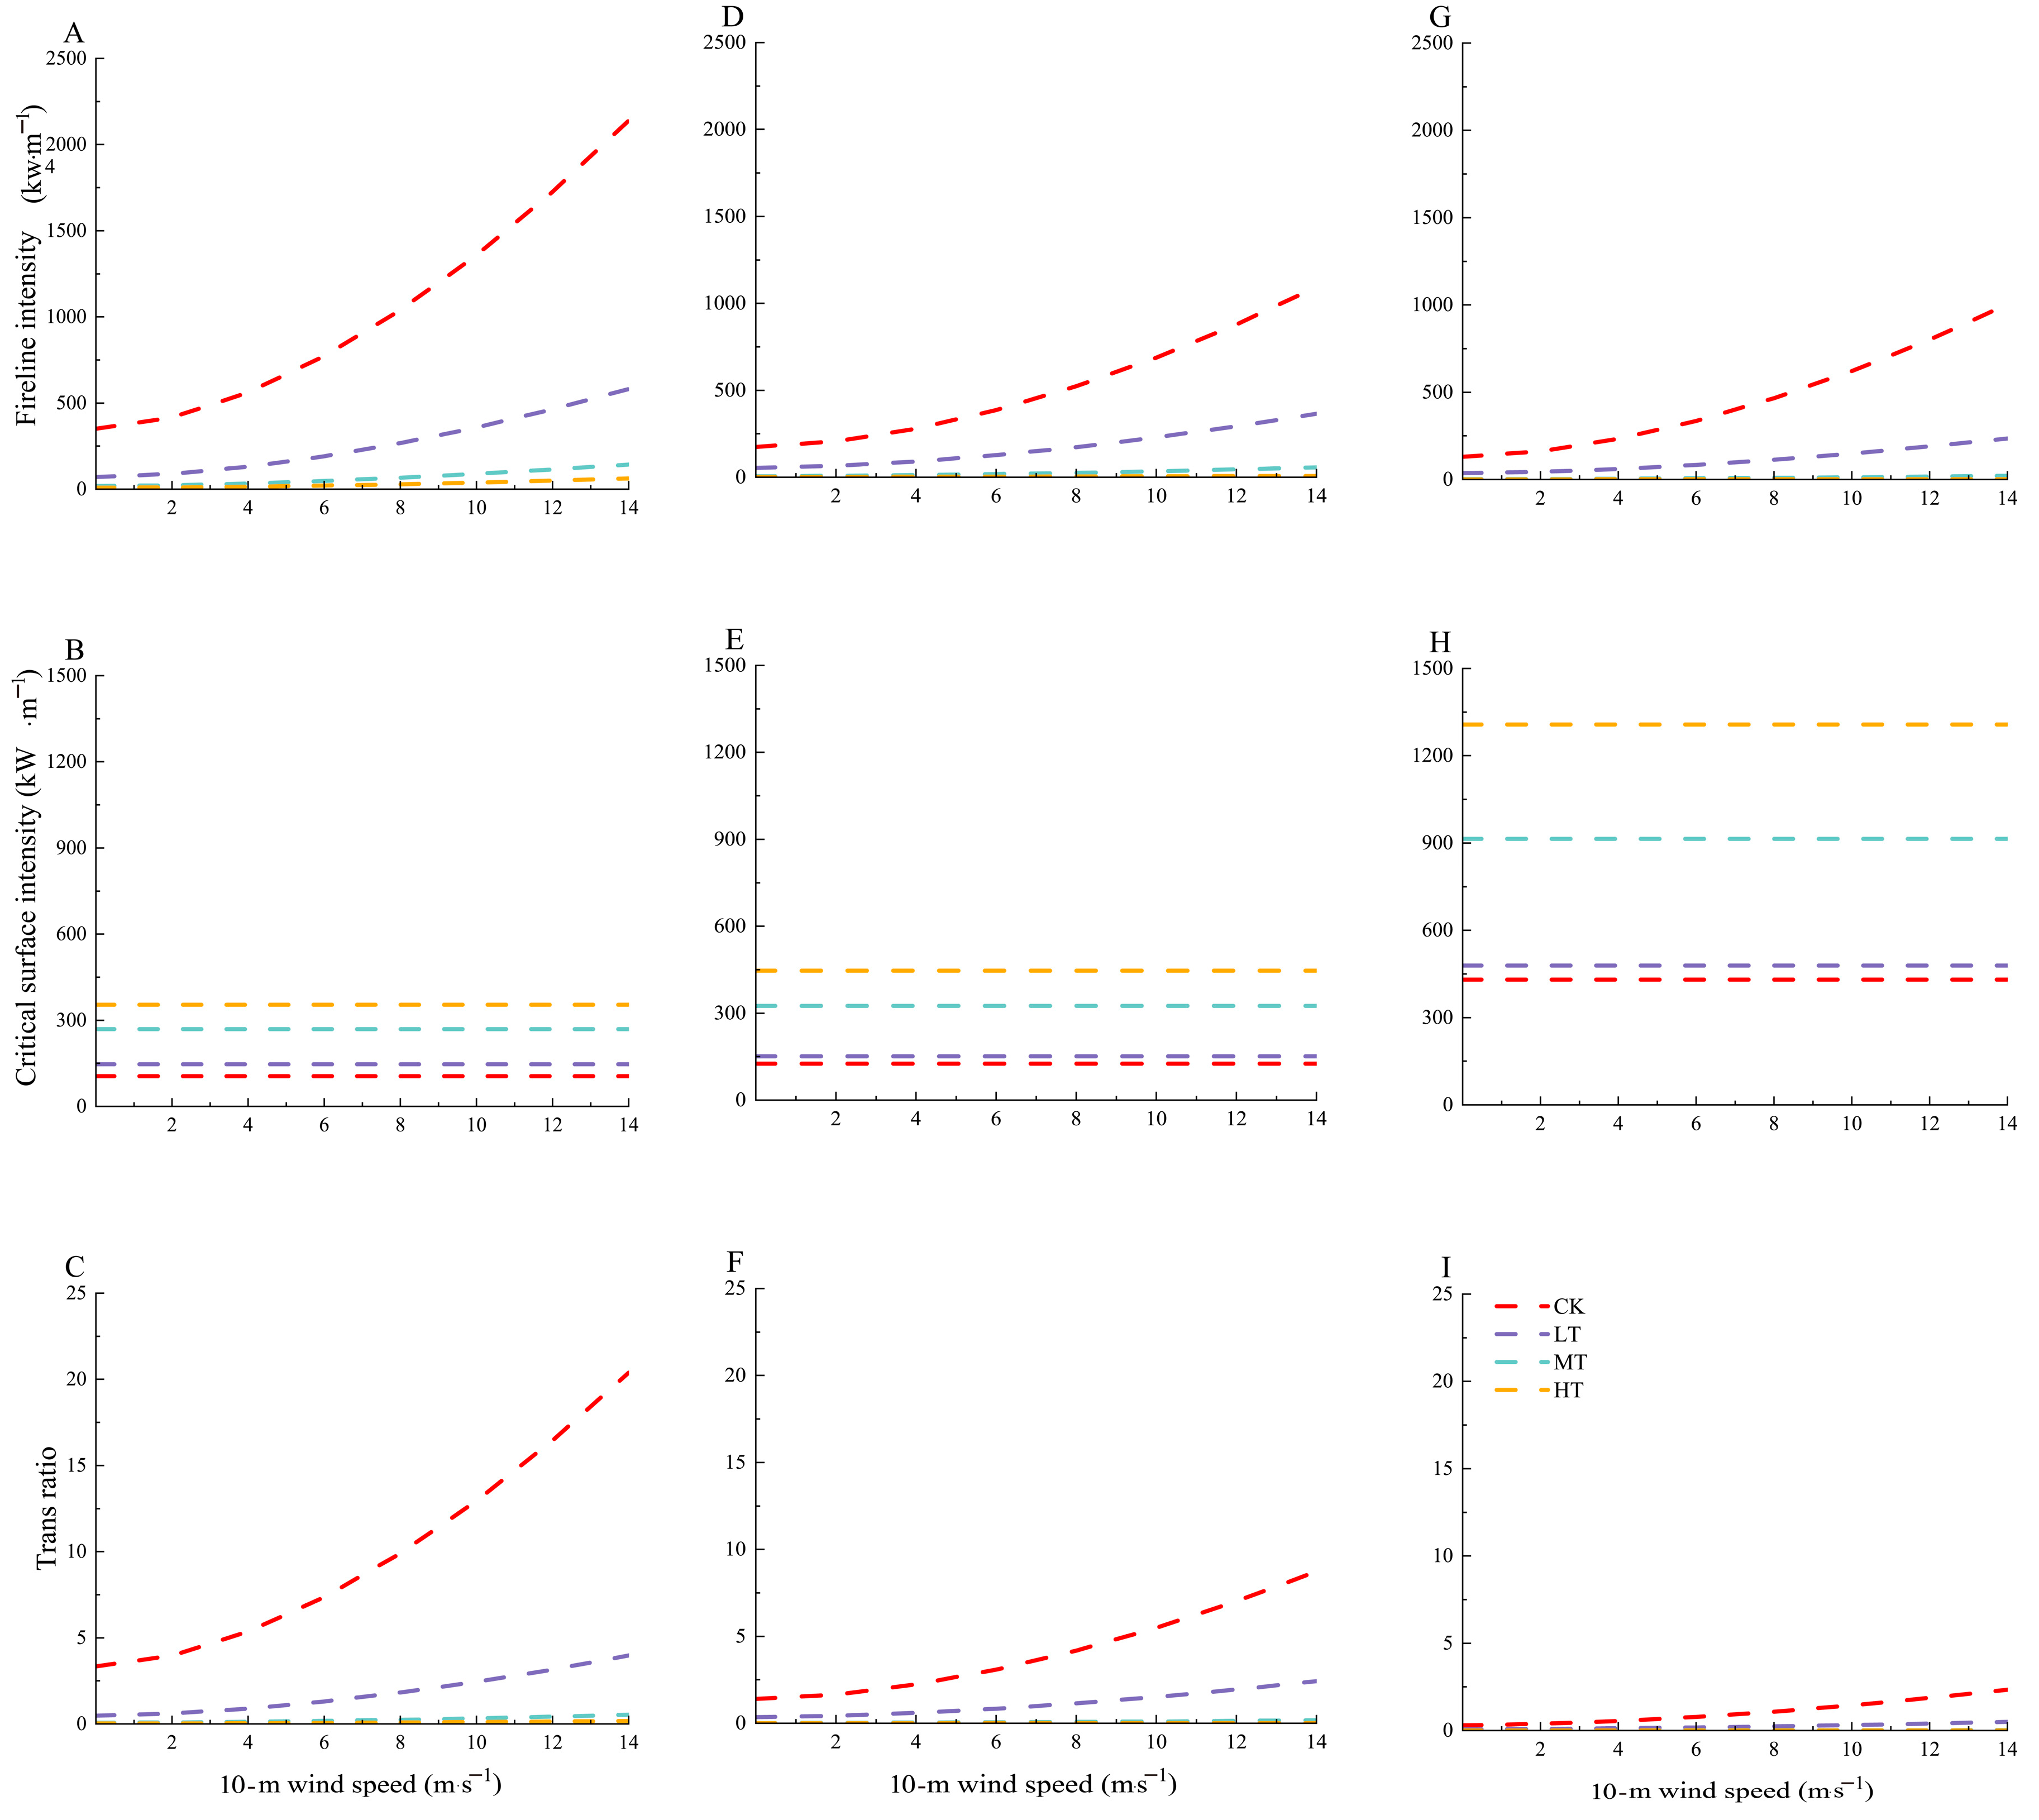
3.2.1. Variations in Potential Surface Fire Behavior under Different Thinning Intensities

As thinning intensity increased, surface fire spread rate, flame length, and heat per unit area all showed reductions. Additionally, surface fire spread rate and flame length increased with higher wind speeds, whereas the heat value per unit area remained unchanged (Figure 6).
The control unit exhibited susceptibility to relatively higher-intensity fire behavior. For example, seven years after thinning, the fire spread rate ranged from 1.88 to 11.46 m/min, the flame length ranged from 1.15 to 2.64 m, and the heat per unit area was 11,199.62 kJ.m−2 (Figure 6). At a wind speed of 6 m/s, the surface fire spread rate, flame length, and heat per unit area under light thinning were reduced by 60.58%, 47.45%, and 37.39%, respectively (Figure 6). In addition, the surface fire spread rate, flame length, and heat per unit area under moderate thinning were reduced by 89.92%, 63.82%, and 72.24%, respectively (Figure 6).

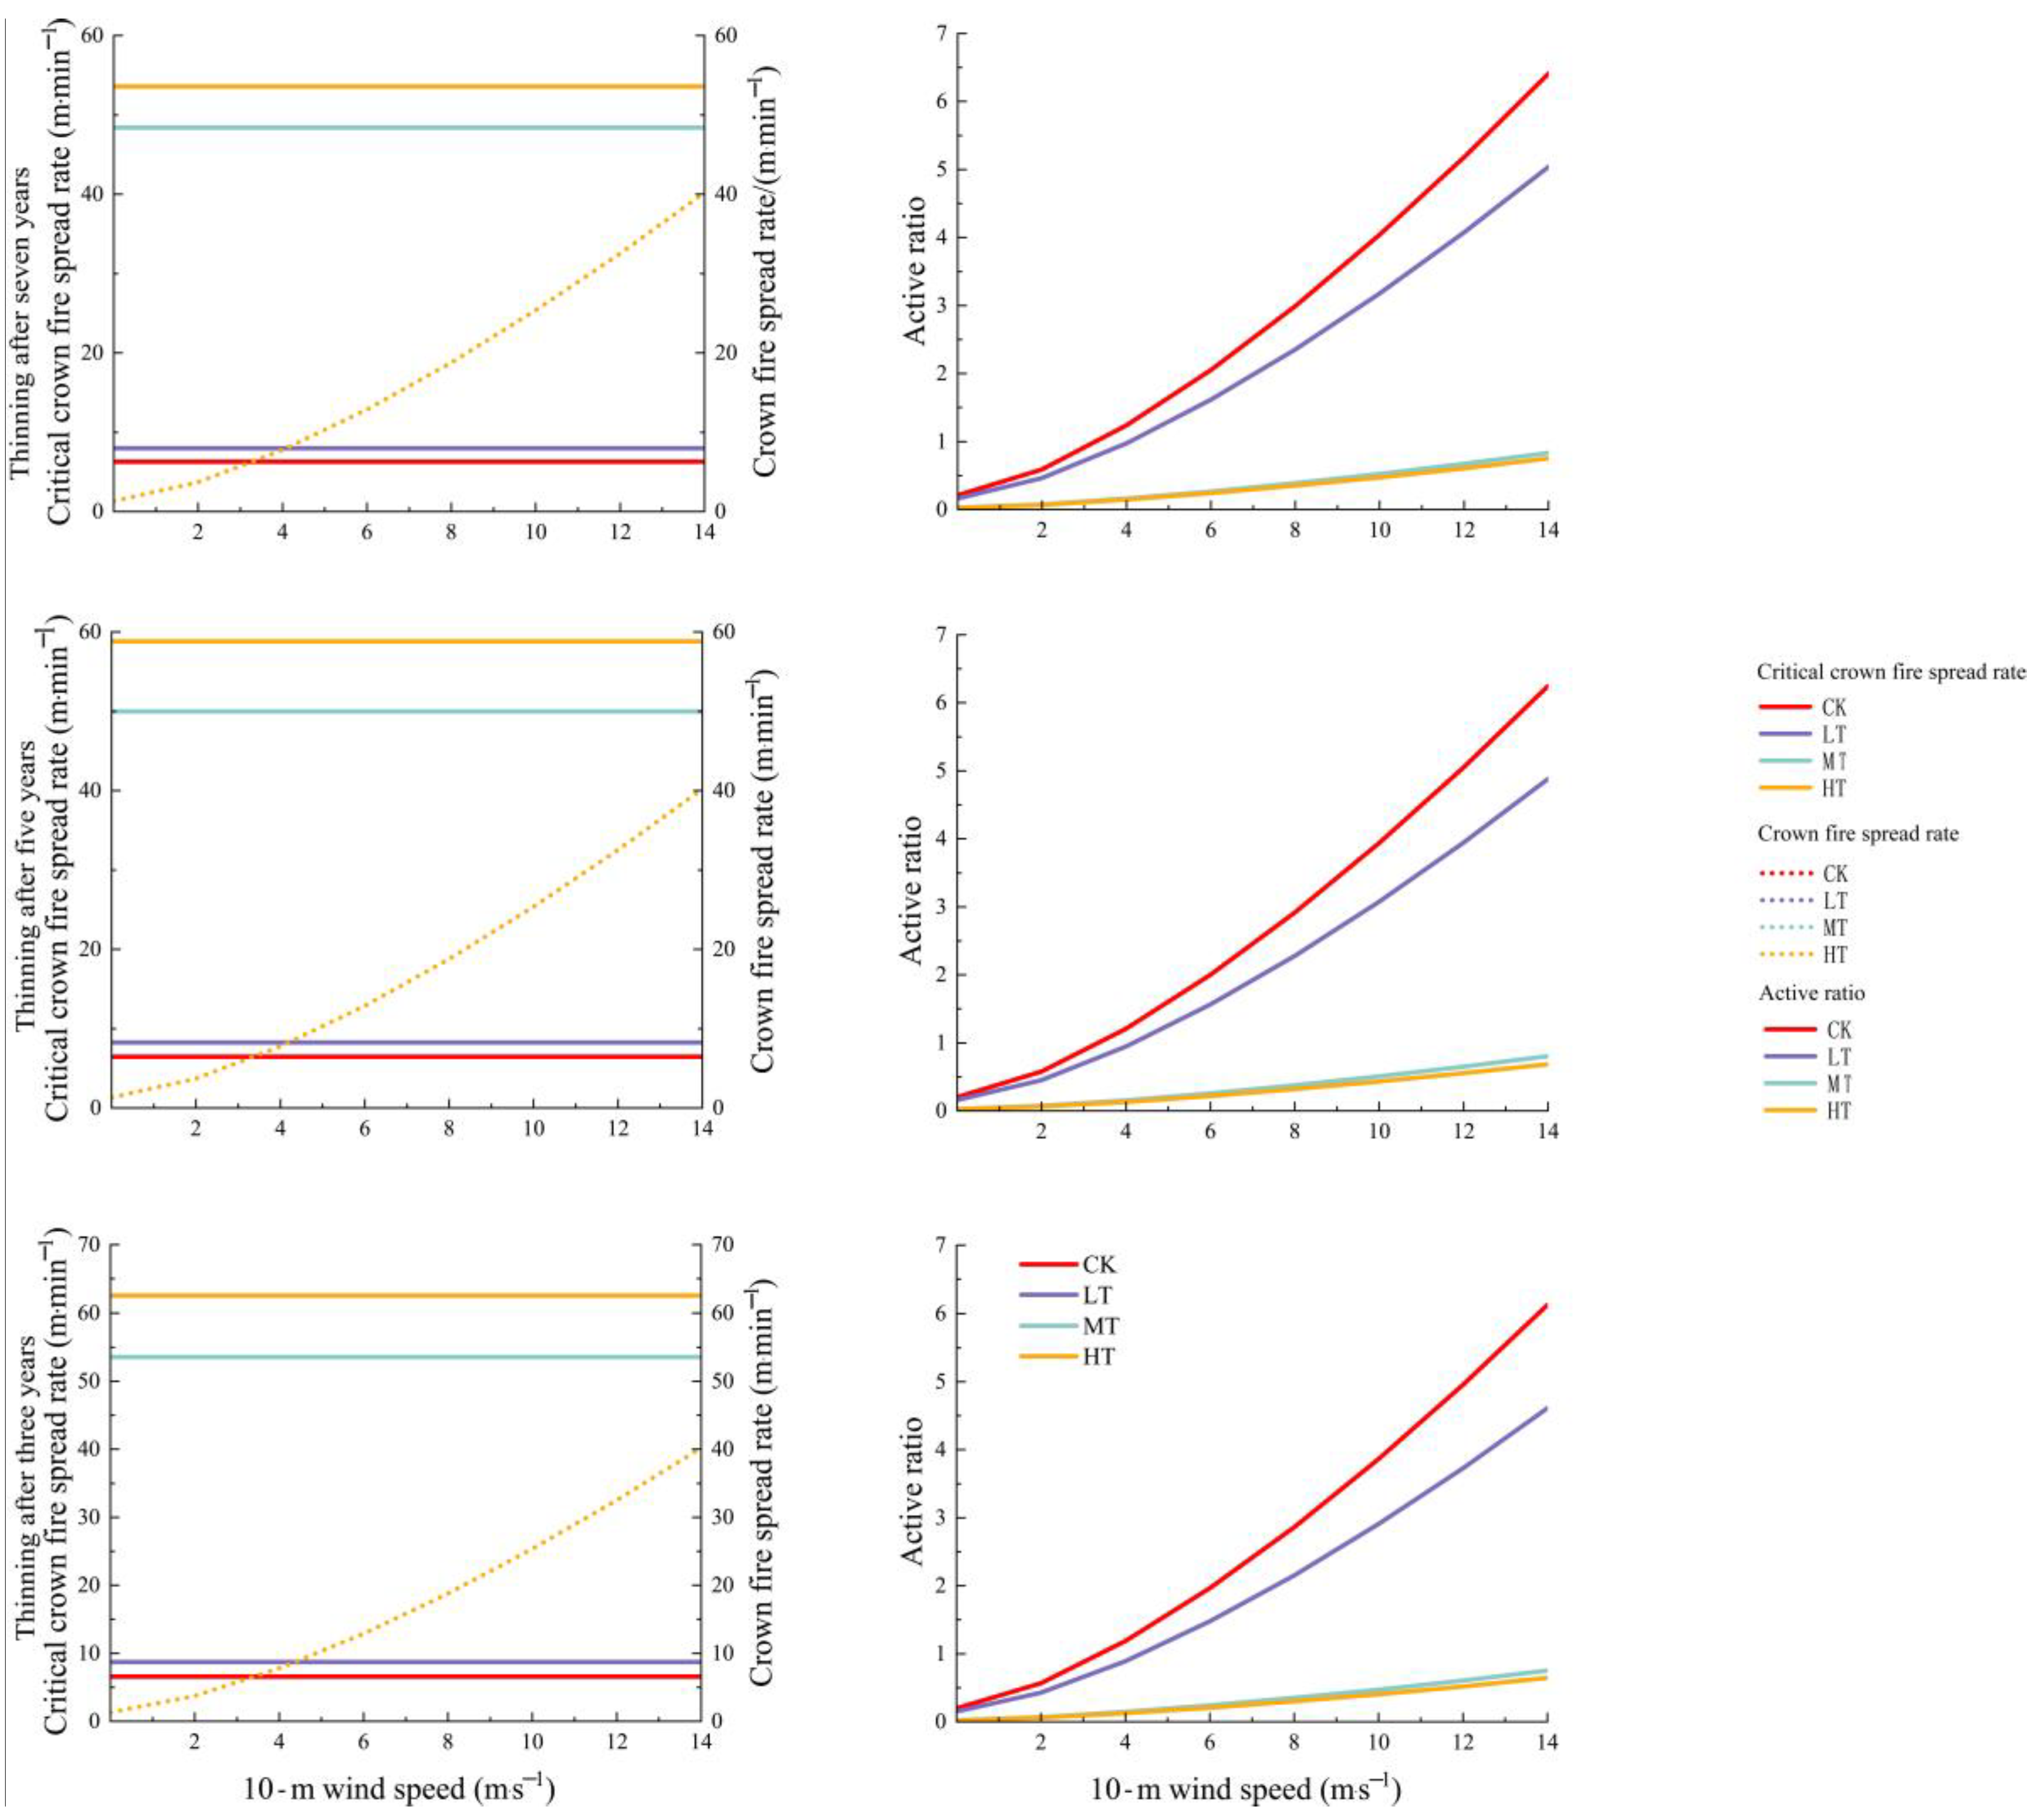
3.2.2. Variations in Potential Canopy Fire Behavior under Different Thinning Intensities

The crown fireline intensity and flame length decreased with increasing thinning intensity but increased with increasing wind speed. The heat per unit area decreased when the thinning intensity increased but did not change with wind speed. In addition, these parameters significantly differed between MT and LT but showed little difference between MT and HT. For instance, compared to LT, when the 10-m wind speed was 6 m/s, the flame length, fireline intensity, and heat per unit area under MT were reduced by 66.99%, 81.03%, and 81.03%, respectively, whereas those indices under HT were only reduced by 17.50%, 25.05%, and 25.05% relative to MT at 7 years after thinning (Figure 7).

3.2.3. Fire Type under Different Thinning Intensities

With the rise in thinning intensity, the critical surface fireline intensity gradually increased, surpassing that of the control plot, and remained unaffected by wind speed. For instance, seven years after thinning, compared to the CK treatment, the critical surface fireline intensity increased by 39.76% under light thinning, 156.74% under moderate thinning, and 237.50% under heavy thinning (Figure 8). Conversely, surface fireline intensity decreased with increasing thinning intensity but increased with higher wind speeds (Figure 8). Figure 9 shows that because the same fuel moisture scenario is set in the software, the crown fire spread rate is the same under different thinning intensities. The critical crown fire spread rate gradually increases with the rise in thinning intensity and becomes greater than that of the control plot. For example, at 7 years after thinning, the critical crown fire spread rates were 7.98 m/min, 48.39 m/min, and 53.57 m/min under the light, moderate, and heavy thinning intensities, which increased by 27.07%, 67.05%, and 75.30%, respectively, compared with the control plots. The above results led to TR and AR less than 1 in moderate and severe thinning plots, even in extreme weather.
Table 4 further illustrates that, for moderate and heavy thinning plots, a 10-m wind speed exceeding 14 m/s is required to trigger active crown fires at three thinning intervals. Under different thinning intensities and 10-m wind speed conditions, there will be four types of forest fires: surface fire, passive crown fire, conditional active crown fire, and active crown fire. After seven years of thinning, unthinned plots exhibit active crown fires at wind speeds as low as 4 m/s, with passive crown fires occurring below this threshold. In contrast, light thinning raises the wind speed requirement for active crown fires to 6 m/s, with surface fires prevailing at lower speeds. At five years post-thinning, the wind speed threshold for active crown fires in unthinned plots remains at 4 m/s. However, in light-thinning plots, this threshold increases to 8 m/s, with surface fires occurring below 6 m/s. Three years post-thinning, unthinned plots require wind speeds of 8 m/s to initiate active crown fires, while light-thinning plots only reach conditional active crown fires at speeds above 6 m/s.

3.3. Understory Vegetation Biodiversity under Different Thinning Intensities

The Gleason index for both the herb layer and shrub layer increased significantly after thinning compared to the non-thinned plots, with the highest index observed in the moderate thinning plots (Table 5). For example, after 5 years of thinning, the Shannon–Wiener index, Simpson index, and Pielou index of the herbaceous layer in the moderate thinning plots increased by 125.20%, 106.37%, and 92.93%, respectively, compared to the non-thinned plots. There were no significant differences in these indices between the non-thinned and lightly thinned plots. Additionally, the Gleason and Simpson indices showed no significant difference between the moderate and heavily thinned plots. The Gleason, Shannon–Wiener, and Pielou indices of the shrub layer in the moderate thinning plots were also significantly higher compared to the non-thinned shrub layer.

4. Discussion

4.1. Fuel Variable Response

Incremental thinning intensity led to a decrease in litter fuel loads. Our result supports our hypothesis and is consistent with medium-term thinning findings [11]. The reason may be due to the decrease in stand density and litter fuel load after thinning, resulting in a decrease in the source of downed and dead woody fuel. In addition, thinning increased forest solar radiation, leading to changes in surface water and heat conditions, which in turn accelerated litter decomposition [66,67].
The live fuel loads increased with increasing thinning intensity. This may be because forest gaps were generated following thinning, which increased the light transmittance and rainfall in the forest and further increased the utilization rates of light, nutrients, and water in the forest, which was conducive to the growth of herbs and shrubs [22,68]. A similar result was found in a P. orientalis plantation, which showed that shrubs’ fuel load and herbs’ fuel load increased with increasing thinning intensity [19].
The results indicated that moderate thinning significantly reduced CFL and CBD, consistent with previous studies [27,69]. This is likely due to the reduction in stand density or basal area after thinning [70]. Under MT, CBD was reduced to below 0.1 kg.m−3, which was the threshold value for the spread of crown fires in continuous coniferous forests [71]. Consequently, active crown fires are unlikely to occur in P. orientalis forest after MT and HT.

4.2. Potential Surface Fire Behavior Response

The comparison between thinning and non-thinning stands showed that thinning-only treatment could moderate fire behavior, especially moderate thinning. The response of surface fireline intensity to thinning in the P. orientalis forest is consistent with the study of Cruz [72]. Huang et al. [73] also found that thinning effectively reduces surface fireline intensity and the probability of surface fires transforming into crown fires. Thinning is likely to alter fire behavior by modifying the mass, connectivity, and continuity of fuels. Through the modification of fuel loads and connectivity, thinning might alter fire behavior [74]. Litter fuel, predominantly consisting of P. orientalis leaves and down and dead woods, exhibits high flammability and significantly contributes to fire propagation. The reduction in the litter fuel load may lead to a decrease in surface fire spread rate. However, Agee and Lolley discovered that thinning increased surface fire flame lengths, potentially due to lower fuel moisture content and greater flammability or wind speed beneath the forest canopy [70].

4.3. Potential Crown Fire Behavior Response

After 3–7 years of thinning, simulated fire behavior indexes, except for the critical crown spread rate and critical surface intensity, showed a significant reduction in stands subjected to moderate thinning but remained high in CK stands. The reason may be that thinning led to a significant decrease in downed and dead woody fuel loads and reduced the vertical continuity of fuel. Moreover, MT led to a significant reduction in CBD, which is the key driver of potential crown fire behavior. The significant reduction in CBD led to a higher 10-m wind speed threshold for initiating active crown fire in the moderately thinned plots. The reduction in CBD suggested a lower crown fire spread rate in thinned plots compared to the control plots, which affected AR, a critical indicator of the potential transition from passive to active crown fire.
Under MT and HT, the 10-m wind speed required for an active crown fire was considerably higher than 14 m/s. This indicates that following moderate and heavy thinning, active crown fires may not occur even under extreme weather conditions. This finding suggested that moderate thinning alleviated the severity and crown fire spread rate in non-thinned plots and even effectively reduced the losses caused by mass fires under the same weather and terrain conditions. Given the high destructiveness of active crown fires, our research underscores the significant value of moderate thinning in forest management and fire prevention.
The above results are consistent with a previous study indicating that thinning is of great significance in reducing the occurrence and spread of active crown fires [11,75]. Variations in stand structure, composition, and thinning practices ruled out direct comparisons, yet the outcomes of this research provide valuable insights into artificial forests in North China that share similar stand characteristics and thinning treatments as those in Xishan Experimental Forest Farm. These results underscore the applicability of thinning as a forest management strategy in mitigating fire risks in similar ecological contexts.
Although there have been numerous studies on the effects of fuel reduction measures on potential fire behavior, there are gaps in studies based on the mid-term effects of only thinning on P. orientalis. With the decomposition, the observed significant decrease in litter fuel loads and the significant slowdown in simulated fire behavior are likely to continue for several years. In this study, thinning may be valid for up to 7 years. Similar to the results of Waldrop et al. [76], they also observed that the thinning medium-term impact was still impactful in fire behavior characteristics. This study focused solely on the impact of thinning intensity on fire behavior. However, the effectiveness of thinning on fire behavior is influenced by a variety of specific stand and environmental factors, including initial stand structure (e.g., stand age and density), understory vegetation conditions, elevation, and slope aspects. Future research should incorporate these variables to comprehensively assess their influence on the effectiveness of thinning treatments.

4.4. Understory Vegetation Biodiversity Response

The findings reveal that the species diversity index of understory vegetation in thinned plots, especially moderate thinning plots, was higher compared to non-thinned plots, consistent with findings from previous research [77,78]. The moderate disturbance hypothesis can explain the result; that is, the species richness is the highest under moderate disturbance (i.e., moderate intensity thinning) [79]. Thinning has direct and indirect effects on understory vegetation. Changes in environmental conditions and resources, as well as species composition and functional traits antecedent to thinning, will determine how understory vegetation responds to thinning. The observed increase in species diversity index can be attributed to enhanced light penetration, improved temperature, humidity conditions, and soil nutrient content in the forest, which facilitate the growth and expansion of light-demanding vegetation, enhance plant photosynthesis, and consequently promote greater species diversity [80,81]. To investigate the effects of thinning intensity on biodiversity, this study was conducted on plots with uniform topography and soil conditions. Future experiments should explore whether variations in topography and soil conditions influence the response of understory vegetation biodiversity to different thinning intensities.

4.5. Fuel Management Implications

Based on our findings, it is evident that moderate thinning alone effectively meets the objectives of fuel reduction and fire risk management in P. orientalis forests within our study area. Our observations over 3 years, 5 years, and 7 years post-thinning suggest that moderate thinning can maintain its effectiveness for up to 7 years.
It becomes imperative to implement another round of thinning once the previously declining trend in surface fuel loading is reversed, leading to surface fuel levels surpassing the desired thresholds. To maintain optimal surface fuel loads and mitigate fire risk, it will be necessary to re-implement thinning practices in the future when surface fuel loads exceed the required threshold. Therefore, further research should prioritize the understory vegetation evolution, the litter loading dynamics, changes in fuel vertical continuity, and the potential impacts of thinning on tree regrowth [82]. Integrating these more comprehensive investigations with other ecological assessments of the treatments will equip forest managers with the necessary tools to select the most effective strategies to meet their ultimate management objectives.

5. Conclusions

The findings indicate that thinning interventions significantly reduced fuel characteristics indicators, such as dead fuel load, litter thickness, and fuel bed depth, compared to the control. Notably, the differences between MT and LT treatments were most pronounced, while the distinctions between MT and HT treatments were minimal. Fire behavior models suggested that thinning substantially decreased key potential fire indicators relative to the control, with the greatest reduction observed under HT, followed by MT and LT treatments. Therefore, active crown fires are unlikely to occur with MT and LT treatments, even under extreme weather conditions. However, the predicted fire behavior metrics did not significantly differ between MT and HT treatments. Additionally, thinning had a positive effect on understory vegetation biodiversity, with MT treatments demonstrating the most substantial improvement, resulting in a 166.47% increase in the Gleason index for shrubs and a 149.85% increase for herbaceous plants. Considering these ecological benefits alongside the objectives of fuel management and fire risk reduction, moderate thinning (35%) emerges as the recommended approach for the Xishan Experimental Forestry Farm. This approach supports forest managers in implementing thinning practices sustainably and efficiently, balancing fire prevention efforts with biodiversity conservation goals.
The results are likely to apply to other middle-aged P. orientalis in North China. We do not assume that thinning will moderate the active crown fire behavior of P. orientalis forests for many years following thinning in other regions of China. Therefore, the research on P. orientalis with different stand structures in different regions of China should be strengthened in the future. In addition, we advocate for sustained long-term monitoring of the study area and additional sites across China to promote the application of thinning in areas where prescribed fire measures are restricted, thereby ensuring that the risk of P. orientalis active crown fires across the country can be effectively reduced with a positive impact on ecological functions such as forest biodiversity.

Supplementary Materials

The following supporting information can be downloaded at: https://www.mdpi.com/article/10.3390/f15091667/s1, Table S1: BehavePlus 6.0.0 input for the unthinning plots in 2014 year. The parameters with the same value are as follows: the surface area to volume ratio, fuel heat content, fuel moisture, 10-m wind speed, wind adjustment, slope steepness. Other parameters varied with different treatments to compare the fire behavior indicators.

Author Contributions

Conceptualization, X.L.; methodology, M.G.; software, M.G.; formal analysis, M.G.; investigation, M.G., S.C. and A.S.; resources, X.L.; writing—original draft preparation, M.G.; writing—review and editing, X.L. and F.C.; supervision, X.L.; project administration, X.L.; funding acquisition, X.L. All authors have read and agreed to the published version of the manuscript.

Funding

This research was funded by the National Natural Science Foundation of China [31770696] and the National Key Research and Development Program of China [2020YFC1511601].

Data Availability Statement

All data are available on reasonable request to the corresponding authors.

Acknowledgments

The authors would like to thank the Beijing Municipal Forestry and Parks Bureau for providing a variety of resource support.

Conflicts of Interest

The authors declare no conflicts of interest.

Abbreviations

CBDcanopy bulk density
CFLcanopy fuel load
DBHdiameter at breast height
CKcontrol treatment
LTlight thinning
MTmoderate thinning
HTheavy thinning
CFthe correction coefficient
AICAkaike information index
MSEmean squared error
TRtransition ratio
ARactive ratio

References

  1. Tang, X.; Machimura, T.; Li, J.; Yu, H.; Liu, W. Evaluating seasonal wildfire susceptibility and wildfire threats to local ecosystems in the largest forested area of China. Earth’s Future 2022, 10, e2021EF002199. [Google Scholar] [CrossRef]
  2. Zhao, F.; Liu, Y. Important meteorological predictors for long-range wildfires in China. For. Ecol. Manag. 2021, 499, 119638. [Google Scholar] [CrossRef]
  3. Xie, L.; Zhang, R.; Zhan, J.; Li, S.; Shama, A.; Zhan, R.; Wu, R. Wildfire risk assessment in Liangshan Prefecture, China based on an integration machine learning algorithm. Remote Sens. 2022, 14, 4592. [Google Scholar] [CrossRef]
  4. Tian, X.; Shu, L.; Zhao, F.; Wang, M. Impacts of climate change on forest fire danger in China. Sci. Silvae Sin. 2017, 53, 159–169. [Google Scholar]
  5. Jin, Y.; Zhao, W.; Nie, S.; Liu, S.S.; El-Kassaby, Y.A.; Wang, X.R.; Mao, J.F. Genome-wide variant identification and high-density genetic map construction using RADseq for Platycladus orientalis (Cupressaceae). G3: Genes Genomes Genet. 2019, 9, 3663–3672. [Google Scholar] [CrossRef] [PubMed]
  6. He, L.L.; Zhang, X.; Wang, X.X.; Ullah, H.; Liu, Y.D.; Duan, J. Tree Crown Affects Biomass Allocation and Its Response to Site Conditions and the Density of Platycladus orientalis Linnaeus Plantation. Forests 2023, 14, 2433. [Google Scholar] [CrossRef]
  7. Zhang, L.; Qi, S.; Li, P.; Zhou, P. Influence of stand and environmental factors on forest productivity of Platycladus orientalis plantations in Beijing’s mountainous areas. Ecol. Indic. 2024, 158, 111385. [Google Scholar] [CrossRef]
  8. Niu, S.K. Fire Behavior and Fuel Spatial Continuity of Major Forest Types in the Mountainous Area, Beijing. Ph.D. Thesis, Beijing Forestry University, Beijing, China, 2012. [Google Scholar]
  9. Burton, J.E.; Cawson, J.G.; Filkov, A.I.; Penman, T.D. Fine fuel changes due to timber harvesting and frequent prescribed burning in eucalypt forests of southeastern Australia. For. Ecol. Manag. 2022, 520, 120353. [Google Scholar] [CrossRef]
  10. Vilà-Vilardell, L.; De Cáceres, M.; Piqué, M.; Casals, P. Prescribed fire after thinning increased resistance of sub-Mediterranean pine forests to drought events and wildfires. For. Ecol. Manag. 2023, 527, 120602. [Google Scholar] [CrossRef]
  11. Arellano-Pérez, S.; Castedo-Dorado, F.; álvarez-González, J.G.; Alonso-Rego, C.; Vega, J.A.; Ruiz-González, A.D. Mid-term effects of a thin-only treatment on fuel complex, potential fire behaviour and severity and post-fire soil erosion protection in fast-growing pine plantations. For. Ecol. Manag. 2020, 460, 117895. [Google Scholar] [CrossRef]
  12. Weston, C.J.; Di Stefano, J.; Hislop, S.; Volkova, L. Effect of recent fuel reduction treatments on wildfire severity in southeast Australian Eucalyptus sieberi forests. For. Ecol. Manag. 2022, 505, 119924. [Google Scholar] [CrossRef]
  13. Prichard, S.J.; Hessburg, P.F.; Hagmann, R.K.; Povak, N.A.; Dobrowski, S.Z.; Hurteau, M.D.; Khatri-Chhetri, P. Adapting western North American forests to climate change and wildfires: Ten common questions. Ecol. Appl. 2021, 31, e02433. [Google Scholar] [CrossRef] [PubMed]
  14. Alcasena, F.J.; Ager, A.A.; Salis, M.; Day, M.A.; Vega-Garcia, C. Optimizing prescribed fire allocation for managing fire risk in central Catalonia. Sci. Total Environ. 2018, 621, 872–885. [Google Scholar] [CrossRef]
  15. Gao, M.; Ren, Y.M.; Zhou, X.D.; Chen, S.F.; Gao, Y.; Wang, H.Y.; Gu, Z.; Liu, X.D. Effects of thinning on canopy characteristics and potential crown fire behavior of Platycladus orientalis in Xishan Forest Farm. J. Beijing For. Univ. 2022, 44, 56–65. [Google Scholar] [CrossRef]
  16. Li, W.K.; Zhang, C.; Gu, X.H.; Niu, S.K.; Yin, J.Y.; Liu, X.D. Impact assessment of fuel regulation measures in Platycladus orientalis forest in Western Hills of Beijing. J. Zhejiang Agric. For. Univ. 2020, 37, 8. [Google Scholar] [CrossRef]
  17. Han, M. Impact of Forest Tending on Platycladus orientalis Surface Fuel Load and Potential Fire Behavior in Beijing Area. Master’s Thesis, Beijing Forestry University, Beijing, China, 2019. [Google Scholar] [CrossRef]
  18. Zhu, M.; Liu, X.D.; Li, X.H.; Han, X.; Ren, Y.M.; Wang, Q.F. Evaluation on the effect of fuel regulation on Pinus tabulaeformis forest in Xishan Mountain of Beijing. Acta Ecol. Sinica. 2015, 35, 4483–4491. [Google Scholar] [CrossRef]
  19. Duan, Z.; Ma, L.Y.; Jia, L.M.; Jia, Z.K.; Gong, N.N.; Che, W.R. Effects of thinning on growth of Platycladus orientalis plantation and understory vegetation. Acta Ecol. Sin. 2010, 30, 1431–1441. [Google Scholar]
  20. Schmidt, D.A.; Taylor, A.H.; Skinner, C.N. The influence of fuels treatment and landscape ar-rangement on simulated fire behavior, Southern Cascade range, California. For. Ecol. Manag. 2008, 255, 3170–3184. [Google Scholar] [CrossRef]
  21. Johnston, J.D.; Olszewski, J.H.; Miller, B.A.; Schmidt, M.R.; Vernon, M.J.; Ellsworth, L.M. Mechanical thinning without prescribed fire moderates wildfire behavior in an Eastern Oregon, USA ponderosa pine forest. For. Ecol. Manag. 2021, 501, 119674. [Google Scholar] [CrossRef]
  22. Castedo-Dorado, F.; Gómez-Vázquez, I.; Fernandes, P.M.; Crecente-Campo, F. Shrub fuel characteristics estimated from overstory variables in NW Spain pine stands. For. Ecol. Manag. 2012, 275, 130–141. [Google Scholar] [CrossRef]
  23. Martorano, C.A.; Kane, J.M.; Engber, E.A.; Gibson, J. Long-term fuel and understorey vegetation response to fuel treatments in oak and chaparral stands of northern California. Appl. Veg. Sci. 2020, 24, e12551. [Google Scholar] [CrossRef]
  24. Taylor, C.; Blanchard, W.; Lindenmayer, D.B. Does forest thinning reduce fire severity in Australian eucalypt forests? Conserv. Lett. 2020, 12, e12766. [Google Scholar] [CrossRef]
  25. Andreu, A.G.; Blake, J.I.; Zarnoch, S.J. Estimating canopy fuel characteristics for predicting crown fire potential in common forest types of the Atlantic Coastal Plain, USA. Int. J. Wildland Fire 2018, 27, 742. [Google Scholar] [CrossRef]
  26. Cruz, M.G.; Alexander, M.E.; Wakimoto, R.H. Assessing canopy fuel stratum characteristics in crown fire prone fuel types of western North America. Int. J. Wildland Fire 2010, 12, 39–50. [Google Scholar] [CrossRef]
  27. Fernández-Alonso María, J.; Alberdi, I.; álvarez-González, J.G.; Vega, J.A.; Cañellas, I.; Ruiz-González, A.D. Canopy fuel characteristics in relation to crown fire potential in pine stands: Analysis, modelling and classification. Eur. J. For. Res. 2013, 132, 363–377. [Google Scholar] [CrossRef]
  28. Tao, C.S.; Niu, S.K.; Chen, L.; Li, L.Q. Canopy characteristics and potential fire behavior of main coniferous forests in Miaofengshan Forest Farm. Beijing For. Univ. J. 2018, 40, 82–89. [Google Scholar] [CrossRef]
  29. Radcliffe, D.C.; Bakker, J.D.; Churchill, D.J.; Alvarado, E.C.; Peterson, D.W.; Laughlin, M.M.; Harvey, B.J. How are long-term stand structure, fuel profiles, and potential fire behavior affected by fuel treatment type and intensity in Interior Pacific Northwest forests? For. Ecol. Manag. 2024, 553, 121594. [Google Scholar] [CrossRef]
  30. Allen, I.; Pawlikowski, N.; Chhin, S.; Premer, M.; Zhang, J.W. Modeling Juvenile Stand Development and Fire Risk of Post-Fire Planted Forests under Variations in Thinning and Fuel Treatments Using FVS-FFE. Forests. 2023, 14, 1223. [Google Scholar] [CrossRef]
  31. Hood, S.M.; Keyes, C.R.; Bowen, K.J.; Lutes, D.C.; Seielstad, C. Fuel treatment longevity in Ponderosa Pine- dominated forest 24 years after cutting and prescribed burning. Front. For. Glob. Change 2020, 3, 78. [Google Scholar] [CrossRef]
  32. Jiménez, E.; Vega-Nieva, D.; Rey, E.; Fernández, C.; Vega, J.A. Midterm fuel structure recovery and potential fire behaviour in a Pinus pinaster Ait. forest in northern central Spain after thinning and mastication. Eur. J. For. Res. 2016, 135, 675–686. [Google Scholar] [CrossRef]
  33. Cruz, M.G.; Alexander, M.E. Evaluating regression model estimates of canopy fuel stratum characteristics in four crown fire-prone fuel types in western North America. Int. J. Wildland Fire 2012, 21, 168–179. [Google Scholar] [CrossRef]
  34. Boyd, M.A.; Walker, X.J.; Barnes, J.; Celis, G.; Goetz, S.J.; Johnstone, J.F.; Mack, M.C. Decadal impacts of wildfire fuel reduction treatments on ecosystem characteristics and fire behavior in alaskan boreal forests. For. Ecol. Manag. 2023, 546, 121347. [Google Scholar] [CrossRef]
  35. Seth, A.E.; Justin, P.Z.; Wade, T.T.; Chad, M.H. Long-Term impacts of fuel treatment placement with respect to forest cover type on potential fire behavior across a mountainous landscape. Forests 2019, 10, 438. [Google Scholar] [CrossRef]
  36. Rabin, S.S.; FN Gérard Arneth, A. The influence of thinning and prescribed burning on future forest fires in fire-prone regions of Europe. Environ. Res. Lett. 2022, 17, 055010. [Google Scholar] [CrossRef]
  37. Ottmar, R.D.; Prichard, S.J. Fuel treatment effectiveness in forests of the upper Atlantic Coa-stal Plain—An evaluation at two spatial scales. For. Ecol. Manag. 2012, 273, 17–28. [Google Scholar] [CrossRef]
  38. Jahdi, R.; Salis, M.; Alcasena, F.; Del Giudice, L. Assessing the effectiveness of silvicultural treatments on fire behavior in the Hyrcanian Temperate Forests of northern Iran. Environ. Manag. 2023, 72, 682–697. [Google Scholar] [CrossRef]
  39. Furlaud, J.M.; Williamson, G.J.; Bowman, D.M.J.S. Mechanical treatments and prescribed burning can reintroduce low-severity fire in southern Australian temperate sclerophyll forests. J. Environ. Manag. 2023, 344, 118301. [Google Scholar] [CrossRef] [PubMed]
  40. Varner, J.M.; Keyes, C. Fuels treatments and fire models Errors and corrections. Fire Manag. Today 2009, 3, 47–50. [Google Scholar]
  41. Lü, F.T.; Zhou, X.; Ding, J.X.; Shan, Y.L.; Yin, S.N.; Liu, H.Y.; Han, X.Y. Influence factors of potential surface fire behavior in Larix gmelinii plantation. J. Northeast. For. Univercity 2021, 49, 83–90. [Google Scholar]
  42. Wang, B.; Han, S.W.; Gu, Z.; Chen, F.; Bai, Y.; Liu, X.D. Effect of wildfire of different severities on potential fire behavior of Pinus tabuliformis forest. Acta Ecol. Sin. 2023, 43, 1812–1821. [Google Scholar] [CrossRef]
  43. Wang, K. The Spatial Distuibution of Different Fuel Types and Their Potential Behavior Researchon Behavior Researth on Beijing Xishan Forst Farm. Master’s Thesis, Beijing Forestry University, Beijing, China, 2016. [Google Scholar]
  44. Xie, G.; Ma, B.; Ma, H.; Du, Z.; Liu, F.; Tun, X. Vertical distribution of the main forest types and influence factors in hilly region of Shandong. J. Northwest For. Univ. 2021, 36, 153–158. [Google Scholar] [CrossRef]
  45. Wang, S.; Niu, S.; Li, D.; Wang, J.; Chen, F.; Sun, W. Vertical distribution of fuels in Pinus yunnanensis forest and related affecting factors. Chin. J. Appl. Ecology 2013, 24, 7. [Google Scholar] [CrossRef]
  46. Wang, Q.; Xiao, H.; Li, S.; Ruan, D.; Liu, S. Study on potential fire behaviors of Xishan National Forest Park in Kunming using BehavePlus model. J. Zhejiang For. Sci. Technol. 2013, 33, 6. [Google Scholar] [CrossRef]
  47. Tilman, D.; Downing, J.A. Biodiversity and stability in grasslands. Nature 1994, 367, 363–365. [Google Scholar] [CrossRef]
  48. Peng, Y.; Fan, M.; Song, J.; Cui, T.; Li, R. Assessment of plant species diversity based on hyperspectral indices at a fine scale. Sci. Rep. 2018, 8, 4776. [Google Scholar] [CrossRef] [PubMed]
  49. Latterini, F.; Mederski, P.S.; Jaeger, D.; Venanzi, R.; Tavankar, F.; Picchio, R. The Influence of various silvicultural treatments and forest operations on tree species biodiversity. Curr. For. Rep. 2023, 9, 59–71. [Google Scholar] [CrossRef]
  50. Yu, L.Z.; Zhu, J.J.; Kong, X.W.; Hu, W.L.; Tan, X.R. The effects of anthropogenic disturbances (thinning) on plant species diversity of Pinus koreansis plantations. Acta Ecol. Sin. 2006, 26, 8. [Google Scholar] [CrossRef]
  51. Li, C.Y.; Ma, L.Y.; Wang, X.Q.; Xin, X. Short-term effects of tending on the undergrowth diversity of Platycladus orientalis plantation. J. Beijing For. Univ. 2007, 29, 60–66. [Google Scholar] [CrossRef]
  52. Gong, G.T.; Niu, M.; Mu, C.L.; Chen, J.H.; Li, Y.Q.; Zhu, Z.F.; Zheng, S.W. Impacts of different thinning intensities on growth of cupressus funebris plantation and understory plants. Sci. Vaesinicae 2015, 51, 8–15. [Google Scholar]
  53. Bai, G.X.; Zhang, M.J. Effect of thinning intensity on diversity of undergrowth plants in a hardwood forest in Changbai Mountains. J. Northeast. For. Univ. 2011, 39, 27–29. [Google Scholar] [CrossRef]
  54. Deng, C.; Zhang, S.; Lu, Y.; Froese, R.E.; Xu, X.; Zeng, J.; Ming, A.; Liu, X.; Xie, Y.; Li, Q. Thinning effects on forest evolution in Masson pine (Pinus massoniana Lamb.) conversion from pure plantations into mixed forests. For. Ecol. Manag. 2020, 477, 118503. [Google Scholar] [CrossRef]
  55. Bao, B.; Ding, G.J. Effects of thinning on growth and vegetation diversity of Pinus massoniana plantation. J. Cent. South Univ. For. Technol. 2013, 5, 30–34. [Google Scholar]
  56. Song, J.; Zhu, M.; Liu, X.D.; Ren, Y.M.; Wang, Q.F.; Jin, Y.S. Effects of thinning on fuel charact-eristics and potential fire behavior of Pinus tabulaeformis forest in Beijing. Beijing For. Univ. J. 2017, 39, 41–47. [Google Scholar] [CrossRef]
  57. Yang, S.Q.; Zhu, M.; Liu, X.D. Effects of Thinning on Fuel Characteristics and Carbon Storage of Black Locust Forest in Beijing Xishan Forest Farm. Ecol. Sci. 2018, 37, 94–100. [Google Scholar]
  58. Jiang, Z.L.; Ye, J.Z.; Zhou, B.L. Thinning of Chinese Fir Forest; Chinese Forestry Publishing House: Beijing, China, 1982. [Google Scholar]
  59. Cohen, J.D.; Deeming, J.E. The National Fire-Danger Rating System: Basic Equations; Pacific Southwest Forest and Range Experiment Station: Davis, CA, USA, 1985. [CrossRef]
  60. Liu, G.H. Study on Surface Fire and Spreading Mechanism to Canopy Fire of Typical Forest Stands in Beijing. Master’s Thesis, Beijing Forestry University, Beijing, China, 2019. [Google Scholar] [CrossRef]
  61. Andrews, P.L. Current status and future needs of the BehavePlus Fire Modeling System. Int. J. Wildland Fire 2014, 23, 21–33. [Google Scholar] [CrossRef]
  62. Liao, J.; Shi, Y.; Chen, J.; Zhao, Y. Dataset of surface climate normals from 219 Chinese international exchange stations (1991–2020). Digit. J. Glob. Change Data Repos. 2022, 9. [Google Scholar] [CrossRef]
  63. Zheng, W.Y.; Zeng, W.H.; Tang, Y.S.; Shi, W.; Cao, K.F. Analysis of species diversity and biogeographic pattern of Lauraceae and Fagaceae in the northern tropical and subtropical regions of mainland China. Acta Ecol. Sin. 2018, 38, 8676–8687. [Google Scholar] [CrossRef]
  64. Ma, K.P. The measurement method of biological community diversity I: The measurement method of α diversity (Volumes 1). Biodivers. Sci. 1994, 2, 162–168. [Google Scholar] [CrossRef]
  65. Ma, K.P. The measurement method of biological community diversity I: The measurement method of α diversity (Volumes 2). Biodivers. Sci. 1994, 2, 231–239. [Google Scholar] [CrossRef]
  66. Xiao, W.Y.; Diao, J.J.; Fei, F.; Guan, Q.W. Effects of different intensity thinning on litter decomposition in Chinese fir plantations. Ecol. Environ. Sci. 2016, 25, 1291–1299. [Google Scholar] [CrossRef]
  67. Zhang, H.; Song, X.; Ai, J.; Jiang, H.; Yu, S. A review of UV-B radiation and its influence on litter decomposition. J. Zhejiang For. Coll. 2010, 27, 134–142. [Google Scholar]
  68. Zhou, L.; Cai, L.; He, Z.; Wang, R.; Wu, P.; Ma, X. Thinning increases understory diversity and biomass, and improves soil properties without decreasing growth of Chinese fir in southern China. Environ. Sci. Pollut. Res. 2016, 23, 24135–24150. [Google Scholar] [CrossRef] [PubMed]
  69. Gómez-Vázquez, I.; Crecente-Campo, F.; Diéguez-Aranda, U.; Castedo-Dorado, F. Modelling canopy fuel variables in Pinus pinaster Ait. and Pinus radiata D. Don stands in northwestern Spain. Ann. For. Sci. 2013, 70, 161–172. [Google Scholar] [CrossRef]
  70. Agee, J.K.; Lolley, M.R. Thinning and prescribed fire effects on fuels and potential fire behaviour in an eastern Cascades Forest, Washington. Fire Ecol. 2006, 2, 3–19. [Google Scholar] [CrossRef]
  71. Cruz, M.G.; Alexander, M.E.; Wakimoto, R.H. Development and testing of models for predicting crown fire rate of spread in conifer forest stands. Can. J. For. Res. 2005, 35, 1626–1639. [Google Scholar] [CrossRef]
  72. Cruz, M.G.; Alexander, M.E.; Plucinski, M.P. The effect of silvicultural treatments on fire behaviour potential in radiata pine plantations of South Australia. For. Ecol. Manag. 2017, 397, 27–38. [Google Scholar] [CrossRef]
  73. Huang, X.R.; Hou, Y.R.; Pang, S.L.; Shen, W. Fire behavior of Pinus massoniana forest before and after thinning in Laohuling, Nanning. J. Northeast. For. Univ. 2015, 43, 5. [Google Scholar] [CrossRef]
  74. Hevia, A.; Crabiffosse, A.; Álvarez-González, J.G.; Ruiz-González, A.D.; Majada, J. Assessing the effect of pruning and thinning on crown fire hazard in young Atlantic maritime pine forests. J. Environ. Manag. 2018, 205, 9–17. [Google Scholar] [CrossRef]
  75. Fulé, P.Z.; Crouse, J.E.; Roccaforte, J.P.; Kalies, E.L. Do thinning and/or burning treatments in western USA ponderosa or Jeffrey pine-dominated forests help restore natural fire behavior? For. Ecol. Manag. 2012, 269, 68–81. [Google Scholar] [CrossRef]
  76. Waldrop, T.; Phillips, R.A.; Simon, D.A. Fuels and predicted fire behavior in the southern Appalachian Mountains after fire and fire surrogate treatments. For. Sci. 2010, 56, 32–45. [Google Scholar] [CrossRef]
  77. Yang, Y.L. Effect of thinning on support function with inefficient cypress plantation; Sichuan Agricultural University: Yaan, China, 2015. [Google Scholar]
  78. Lindgren, P.M.; Ransome, D.B.; Sullivan, D.S.; Sullivan, T.P. Plant community attributes 12 to 14 years following precommercial thinning in a young lodgepole pine forest. Can. J. For. Res. 2006, 36, 48–61. [Google Scholar] [CrossRef]
  79. Connell, J.H. Diversity in tropical rain forests and coral reefs. Science 1978, 199, 1302–1310. [Google Scholar] [CrossRef] [PubMed]
  80. Trentini, C.P.; Campanello, P.I.; Villagra, M.; Ritter, L.; Ares, A.; Goldstein, G. Thinning of loblolly pine plantations in subtropical Argentina: Impact on microclimate and understory vegetation. For. Ecol. Manag. 2017, 384, 236–247. [Google Scholar] [CrossRef]
  81. Zhang, L.; Ning, C.; Qi, S.; Hu, Y.; Li, P.; Wei, X.; Wang, X. Understory specific species appearances indicate the soil improvement of low-function Platycladus orientalis forest in Beijing’s mountainous areas. Ecol. Indic. 2024, 162, 111996. [Google Scholar] [CrossRef]
  82. Piqué, M.; Domènech, R. Effectiveness of mechanical thinning and prescribed burning on fire behavior in Pinus nigra forests in NE Spain. Sci. Total Environ. 2018, 618, 1539–1546. [Google Scholar] [CrossRef]
Figure 1. Location of the study site in Haidian District, Beijing, China.
Forests 15 01667 g001
Figure 2. Standard branch diagram of P. orientalis canopy. Note: H = tree height, CL = crown length, Hbase = canopy base height, d= branch basal diameter.
Forests 15 01667 g002
Figure 3. The process and result of fire type generation in BehavePlus 6.0.0. Note: Surface = surface fire; Torching = passive crown fire; Conditional Crown = active crown fire possible if the fire transitions to the overstory; Crowning = active crown fire.
Forests 15 01667 g003
Figure 4. Mean surface fuel loads and depth under the four thinning intensity treatments at different times after thinning. Note: (ac): downed and dead woody fuel loads; (d,e): live fuel loads; (f,g): litter leaves fuel load; (h): litter depth; (i): fuel bed depth. Different uppercase letters represent significant differences among thinning intensities (p < 0.05).
Forests 15 01667 g004
Figure 5. Mean canopy fuel load (a) and canopy bulk density (b) under different thinning intensities at three time points after thinning. Different uppercase letters represent significant differences among thinning intensities (p < 0.05).
Forests 15 01667 g005
Figure 6. Potential surface fire behavior indicators of P. orientalis stand under four thinning intensities. Note: (a,d,g): surface fire spread rate under three thinning years; (b,e,h): surface flame length under three thinning years; (c,f,i): heat per unit area under three thinning years.
Forests 15 01667 g006
Figure 7. Potential crown fire behavior indicators of P. orientalis stand under four thinning intensities. Note: (a,d,g): crown flame length under three thinning years; (b,e,h): crown fireline intensity under three thinning years; (c,f,i): heat per unit area under three thinning years.
Forests 15 01667 g007
Figure 8. Potential surface fire behavior indicators of P. orientalis stand under four thinning intensities. Note: (A,D,G): surface fireline intensity; (B,E,H): critical surface fireline intensity; (C,F,I): heat per unit area.
Forests 15 01667 g008
Figure 9. Critical crown fire spread rate, crown fire spread rate, and the active ratio of P. orientalis.
Forests 15 01667 g009
Table 1. Characteristics of the P. orientalis stands and trees after thinning interventions in the study plots (values are means).
Time after ThinningThinning TreatmentDensity
(Tree ha−1)
Canopy CoverDBH
(cm)
H ¯ (m)Tree Age (yr)Elevation
(m)
Slope
(°)
7 yearsCK18630.7513.8010.15343925
LT15650.7014.3711.815326820
MT11950.6213.7110.705324721
HT6000.5017.8511.495317720
5 yearsCK17950.6814.4710.345832325
LT15260.6019.1310.415839023
MT11670.5517.7210.825839018
HT8980.4022.1011.045837420
3 yearsCK18000.7014.979.254839122
LT15270.6013.7110.214837624
MT11800.5817.4512.304838720
HT8150.5021.7511.954837422
Table 2. Classification of surface fuels.
TypeCategoryFeature
Dead fuel1 hd < 0.64 cm
10 h0.64 cm < d < 2.54 cm
100 h2.54 cm < d < 7.62 cm
1000 hd < 7.62 cm
Upper layer leavesDeciduous leaves within 1 year
Lower layer leavesSemi-decomposed fallen leaves
Live fuelShrubVarious sizes depending on species
HerbVarious sizes depending on species
Table 3. Regression model of canopy fuel mass. Note: R2adj= Adjusted R-Squared, AIC= Akaike information criterion, MSE= mean-square error, SEE= standard error of estimate, CF= correction coefficient.
Time after ThinningBranch TypeEstimation ParameterR2adjAICMSESEECF
α0α1α2α3α4α5
7 yearsLive branch−0.578−0.5670.950−0.8372.5110.1680.839197.3740.2000.4481.105
Dead branch−4.6080.9380.4730.8721.347−0.9320.932228.6270.1320.3641.068
5 yearsLive branch−1.1411.738−0.011−0.1590.043−0.0590.667824.5320.5460.7391.314
Dead branch−3.7670.6181.6330.5140.618−0.1400.945173.2800.1370.3701.071
3 yearsLive branch−4.3900.5801.3550.8160.7630.3580.774640.3980.3440.5861.187
Dead branch−1.6101.1190.6910.168−0.029−0.0570.94698.3570.1170.3421.060
Samples weighing approximately 120 g were carefully weighed using a precision electronic balance (accuracy: 0.01 g) (Sartorius, Göttingen, Germany), then placed in standard kraft paper envelopes and sealed securely with staples. Each envelope was labeled with the date, fresh weight, sample number, fuel type, and relevant details. Subsequently, the samples were transported to the laboratory for analysis, including the determination of calorific value, moisture content, dry weight, and other pertinent fuel characteristics.
Table 4. Fire type division matrix of P. orientalis forest stands under four thinning intensities. Note: ACF: active crown fire, fire spreading through the overstory crowns; CACF: conditional active crown fire, active crown fire possible if the fire transitions to the overstory; PCF: passive crown fire, surface fire with occasional torching trees; SF: surface fire, understory fire.
Fire Type7 Years after Thinning5 Years after Thinning3 Years after Thinning
CKLTMTHTCKLTMTHTCKLTMTHT
10-m Wind Speed m/s0PCFSFSFSFPCFSFSFSFSFSFSFSF
2PCFSFSFSFPCFSFSFSFSFSFSFSF
4ACFSFSFSFACFSFSFSFCACFSFSFSF
6ACFACFSFSFACFCACFSFSFCACFCACFSFSF
8ACFACFSFSFACFACFSFSFACFCACFSFSF
10ACFACFSFSFACFACFSFSFACFCACFSFSF
12ACFACFSFSFACFACFSFSFACFCACFSFSF
14ACFACFSFSFACFACFSFSFACFCACFSFSF
Table 5. Species diversity of P. orientalis stands under different thinning intensities. D’ = Gleason index, H = Shannon–Wiener index, D = Simpson index, J = Pielou index. Different uppercase letters represent significant differences among thinning intensities (p < 0.05). *** = p < 0.001, ns = p > 0.05.
Time after ThinningThinning IntensitiesHerbsShrubs
D’HDJD’HDJ
7 yearsCK1.669 ± 0.524 A0.741 ± 0.204 A0.438 ± 0.035 B0.273 ± 0.053 B0.835 ± 0.132 B0.972 ± 0.147 B0.523 ± 0.034 B0.409 ± 0.051 B
LT1.836 ± 0.472 A0.966 ± 0.027 A0.597 ± 0.074 B0.338 ± 0.037 B1.168 ± 0.178 AB1.241 ± 0.725 B0.586 ± 0.074 B0.415 ± 0.061 B
MT2.170 ± 0.158 A1.347 ± 0.872 A2.153 ± 0.025 A0.440 ± 0.027 A2.003 ± 0.628 A2.078 ± 0.148 A0.640 ± 0.046 A0.736 ± 0.042 A
HT2.003 ± 0.367 A1.173 ± 0.026 A0.655 ± 0.537 B0.425 ± 0.052 B1.335 ± 0.257 AB1.285 ± 0.039 B0.550 ± 0.043 B0.465 ± 0.073 B
5 yearsCK1.335 ± 0.246 A0.492 ± 0.073 C0.267 ± 0.032 B0.198 ± 0.015 C0.668 ± 0.126 C0.886 ± 0.064 B0.487 ± 0.056 A0.230 ± 0.029 B
LT1.502 ± 0.312 A0.542 ± 0.193 C0.350 ± 0.036 B0.273 ± 0.061 C0.835 ± 0.172 BC0.895 ± 0.062 B0.528 ± 0.074 A0.236 ± 0.083 B
MT1.836 ± 0.831 A1.108 ± 0.323 A0.551 ± 0.038 A0.382 ± 0.046 A1.335 ± 0.346 A1.075 ± 0.025 A0.550 ± 0.042 A0.428 ± 0.027 A
HT1.168 ± 0.528 A0.884 ± 0.026 B0.513 ± 0.075 A0.336 ± 0.043 B1.001 ± 0.203 B1.002 ± 0.125 B0.539 ± 0.022 A0.310 ± 0.035 B
3 yearsCK0.668 ± 0.126 B0.434 ± 0.031 B0.224 ± 0.043 C0.196 ± 0.037 C0.501 ± 0.083 C0.729 ± 0.062 A0.415 ± 0.043 A0.359 ± 0.028 A
LT1.335 ± 0.317 AB0.537 ± 0.022 B0.326 ± 0.028 BC0.240 ± 0.015 BC0.835 ± 0.254 BC0.822 ± 0.325 A0.510 ± 0.027 B0.369 ± 0.022 A
MT1.669 ± 0.621 B0.673 ± 0.089 A0.549 ± 0.151 A0.346 ± 0.076 A1.335 ± 0.125 A1.008 ± 0.375 A0.710 ± 0.068 B0.401 ± 0.069 A
HT1.168 ± 0.725 A0.583 ± 0.105 A0.448 ± 0.024 AB0.294 ± 0.025 AB1.001 ± 0.324 AB0.977 ± 0.056 A1.225 ± 0.219 B0.384 ± 0.059 A
Thinning intensitiesns*********************
Disclaimer/Publisher’s Note: The statements, opinions and data contained in all publications are solely those of the individual author(s) and contributor(s) and not of MDPI and/or the editor(s). MDPI and/or the editor(s) disclaim responsibility for any injury to people or property resulting from any ideas, methods, instructions or products referred to in the content.

