1. Introduction
Poplars belong to the genus
Populus which, like
Eucalyptus and
Salix, grows rapidly and is widely used in intensive wood production systems. Poplar could easily be agamic propagated. Genetic selection and improvement of growth capacity and healthy individuals have been very efficient. They can be grown for biomass production, as carbon sinks to mitigate carbon dioxide production and for buffering against nutrient leakage. At the beginning of the 1900s the first industrial poplar plantations were established in Italy [
1]. Natural hybrids of native and North American species were the most commonly planted trees. Plantations are usually established on fertile soils with rotation periods of 10–15 years and a spacing of 4 × 4 m [
2]. The rotation period of poplar plantations, however, is dependent on the initial plant density and growth rate [
3].
In Sweden, fast-growing tree species, especially broadleaves (
Salix clones, hybrid aspen and hybrid poplar) have been planted on former farmland [
4]. Various studies of the above ground biomass produced by different species have been undertaken. Promising species for short rotation systems in Sweden include
Salix clones, hybrid aspen and hybrid poplar [
4]. An equation for calculating poplar aboveground biomass production has recently been published [
5].
Poplar stumps are removed after tree felling as a way of avoiding the risk of pathogen attacks on seedlings in the new plantation [
6]. After harvesting a poplar stand there are at least two alternatives for the site:
(1) Utilize the sprouting capacity of the poplar stumps. The sprouts can be harvested in a 5–10 years rotation or thinned leaving only one sprout per stump for later harvest of pulp wood.
(2) Extract the stumps with or without parts of the root system to allow subsequent re-planting of trees or cultivation of cereals.
As there is an increasing interest in poplar plantations for different purposes, more information about among others the stump and root biomass including the root distribution below ground is needed. However, as far as we know, there have, to date, been few studies quantifying poplar stump biomass especially in Nordic countries. After harvest of a poplar stand followed by stump excavation information about stump biomass and root distribution is needed for dimension of excavation efforts.
The aim of the present study was to measure the biomass of poplar stumps and parts of their root system. Biomass estimation functions were determined on the basis of data collected from clear cut poplar plantations on former farmland. We were able to draw some conclusions about the practical implications.
2. Materials and Methods
2.1. Study Site
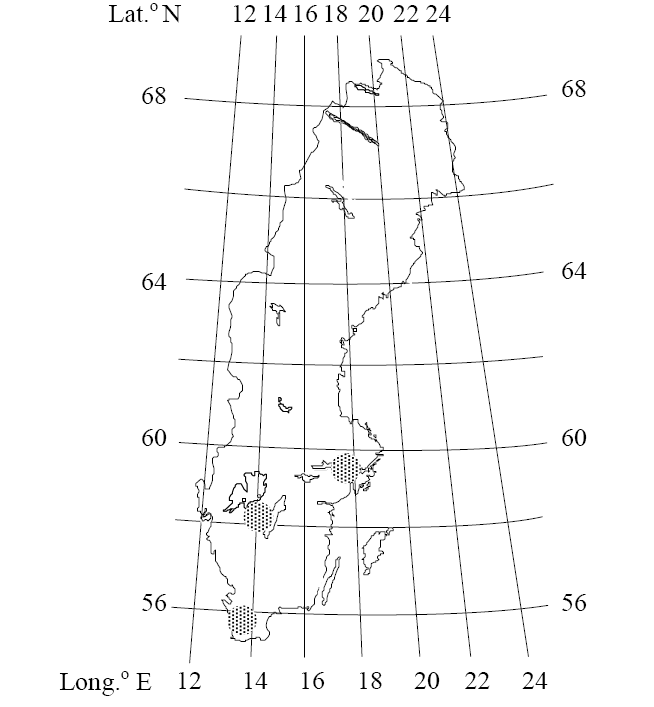
The study evaluated six poplar stands growing on former farmland located between latitudes 56 and 60 N in Sweden (
Figure 1 and
Table 1). These stands are among the first poplar stands in Sweden to be planted in the period when farmland was reforested at the end of the 1980s, and which have been clear cut or thinned. Early growth and damage to the plantations were assessed on the basis of information provided by the forest owner. The age of the stands ranged from 16–23 years. The stands were clear cut (3) or thinned (3) near the beginning of the study period.
Figure 1.
Figure 1. Locations of the study sites, all on abandoned farmland in Sweden.
Figure 1.
Figure 1. Locations of the study sites, all on abandoned farmland in Sweden.
Table 1.
Table 1. Main characteristics of hybrid poplar stands growing at six locations in Sweden.
Table 1.
Table 1. Main characteristics of hybrid poplar stands growing at six locations in Sweden.
| no. | years | Mean ° SD | Mean ° SD | stems ha−1 | m2 ha−1 | Soil type | Variety (1) |
|---|
| (1) Clones of poplar species: 1. P. trichocarpa; 2. OP-42 (P. maximowiszii× P. trichocarpa). |
| 1 | 21 | 353 ° 81 | 29.2 ± 2.0 | 361 | 30.9 | Light clay | – |
| | 119–574 | 21.6–32.9 | | | | |
| 2 | 23 | 210 ° 70 | 22.0 ± 3.3 | 632 | 19.1 | Light clay | 1 |
| | 81–372 | 12.1–25.8 | | | | |
| 3 | 16 | 140 ° 51 | 21.0 ± 1.3 | 3279 | 42.9 | Light clay | 2 |
| | 32–235 | 13.1–22.4 | | | | |
| 4 | 19 | 268 ° 46 | 25.1 ° 1.1 | 1250 | 59.4 | Medium clay | 2 |
| | 68–431 | 19.2–27.0 | | | | |
| 5 | 19 | 281 ± 40 | 24.0 ± 0.7 | 675 | 37.8 | Medium clay tills | 2 |
| | 194–356 | 22.8–25.0 | | | | |
| 6 | 20 | 283 ° 40 | 25.8 ± 1.1 | 707 | 35.0 | Medium clay | 2 |
| | 197–367 | 23.0–27.7 | | | | |
| Mean ± SD | 20 ° 2 | 288 ° 108 | 25.3 ° 4.1 | 1151 ° 1082 | 37.5 ° 13.4 | – | – |
| Range | 16–23 | 81–574 | 12.1–32.9 | 361–3279 | 19.1–59.4 | – | – |
2.2. Characteristics of the Study Stands
The number of stems per hectare was calculated before clear cutting or thinning operations. The stem number calculation was based on the number of stems on the planted area (0.1–1.0 ha). The outer row of trees in the stand was not included in order to avoid edge effects caused by factors such as wind, open areas, ditches and shading by adjacent stands. The diameter at breast height (DBH) of each counted tree was measured by cross callipering (
Table 1), and the arithmetic mean diameter was calculated for each stand. In order to calculate the mean height of the stands, a statistical regression model for each stand was constructed. The height and diameter of nine trees in each of two subsample plots was measured. The location of the two subsample plots (3 trees in 3 rows close to each other) was selected systematically e.g., the first measured tree was the fifth tree in the third row. The other subsample plot was located in the opposite part of the stand, on a diagonal from the first plot. A regression model for each stand, describing the relationship between height and diameter, was produced. Tree mean height in the plots was calculated using the regression models.
2.3. Dry Mass Estimations of Stumps and Roots
The measurements were made in August when the poplars have leaves. There were some restrictions imposed by the owners relating to the maximum number of stumps that could be removed and their location. The main issues were: the risk of the excavator damaging the remaining stems and roots in the thinned stands; and the risk of damaging the stumps in the clear cut, thus reducing future sprouting ability. In each of the six stands 12 trees were evaluated prior to felling and their stumps excavated after felling. Because of the restrictions imposed, the trees had to be sampled in a strip around the stand as close as possible to the edge (within ≈ 5 m). After initial recording of stems and stem diameter in the stands, the trees were divided into four diameter classes, representing the diameter distribution of the stand. Three trees representing each diameter class were selected for harvesting. Trees growing immediately adjacent to the stand edge were avoided to minimize the risk of light and temperature influences on the growth or root distribution pattern. Trees growing close to each other were not selected as their roots might have been affected by competition. The trees selected were healthy, without visible damage or fungal infestation. The presented results refer to restricted selections of samples. As the sampled individuals are representatives of division in diameter classes in the stand the results will be close to a healthy poplar stand in general.
Stump biomass was defined as “the stump proper above the ground and its direct continuation below ground and the root biomass as the side roots or laterals” [
7]. During measurement of the diameter of the sample trees (
Table 2) the stumps were marked in red with a number. Based on stem diameter, total aboveground biomass for individual poplar trees and total stem biomass were estimated using the biomass equation of Johansson and Karačić [
5]. After this, the stands were either thinned or clear cut. Later the stumps (72 in total) were identified and the diameter of the stumps was recorded (
Table 3). An excavator was used to remove the stumps. The excavation was undertaken carefully, with roots exposed manually using spades and the stump lifted out by the excavator. All roots were then removed from the stump, which was cleaned before weighing. The fresh weight of the stump was recorded in the field. The roots were cut and separated into three diameter classes: >20 cm, 10–20 cm and 5–10 cm. The length and fresh weight of the roots in each diameter class were recorded.
Table 2.
Table 2. Characteristics of poplars used in the study.
Table 2.
Table 2. Characteristics of poplars used in the study.
| Location no. | Diameter, mm | Height, m | Biomass, above ground, kg d.w. (1) |
|---|
| Breast height | – | Total (2) | Stem |
|---|
| (1) Estimated by Johansson and Karačić [5]; (2) Total: stem + branches + leaves. |
| 1 | 255–509 | 24.4–29.6 | 292–1270 | 177–970 |
| 2 | 119–327 | 15.6–23.2 | 36–428 | 28–326 |
| 3 | 88–216 | 15.3–21.4 | 17–154 | 13–118 |
| 4 | 79–415 | 19.8–27.5 | 13–769 | 10–587 |
| 5 | 232–306 | 23.3–24.7 | 184–363 | 140–277 |
| 6 | 189–376 | 24.7–29.8 | 111–603 | 85–460 |
| Range | 79–344 | 14.6–32.5 | 13–1270 | 10–970 |
Table 3.
Table 3. Fresh and dry mass production (kg) and mean percentage of total stump and root weight.
Table 3.
Table 3. Fresh and dry mass production (kg) and mean percentage of total stump and root weight.
| Location no. | Stump diameter, mm | Fresh weight, kg | Dry weight, kg |
|---|
| Total | Stump | Roots | Total | Stump | Roots |
|---|
| 1 | 406 ± 91 | 241 ± 117 | 184 ± 83 | 57 ± 44 | 115 ± 49 | 89 ± 36 | 26 ± 17 |
| 2 | 238 ± 75 | 61 ± 57 | 44 ± 37 | 17 ± 22 | 28 ± 25 | 21 ± 17 | 7 ± 8 |
| 3 | 158 ± 44 | 27 ± 20 | 20 ± 14 | 7 ± 6 | 10 ± 7 | 8 ± 6 | 2 ± 2 |
| 4 | 302 ± 121 | 172 ± 168 | 117 ± 115 | 55 ± 57 | 79 ± 73 | 54 ± 51 | 25 ± 24 |
| 5 | 329 ± 22 | 150 ± 38 | 120 ± 27 | 30 ± 18 | 62 ± 15 | 50 ± 10 | 12 ± 7 |
| 6 | 328 ± 92 | 157 ± 91 | 121 ± 71 | 36 ± 24 | 67 ± 31 | 52 ± 24 | 15 ± 8 |
| Mean ± SD | 294 ± 109 | 133 ± 117 | 99 ± 85 | 34 ± 37 | 59 ± 52 | 45 ± 39 | 14 ± 16 |
| Range | 87–587 | 2–621 | 2–420 | 0.4–201 | 1–291 | 1–185 | 0.2–87 |
| | | Percentage of total fresh weight | Percentage of total dry weight |
| Mean ± SD | | – | 76 ± 10 | 24 ± 10 | – | 76 ± 11 | 24 ± 11 |
| Range | | – | 43–95 | 5–57 | – | 40–96 | 4–54 |
2.4. Basic Density Analysis
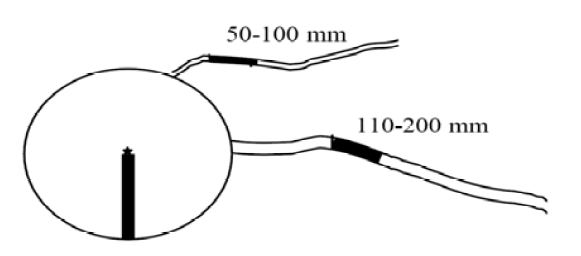
Samples of wood from the trees, stumps and roots were collected to use for estimating basic wood density. A small section of stem surface at 4 m, including the pith was taken. On the stump a small section of the cut surface, including the pith out to the outer part of the stump, was taken. Two samples of disks from the roots were taken: one in the 110–200 mm root class and one in the 50–100 mm class.
![Forests 03 00166 i001]()
The basic density of stumps and roots was estimated using the water-immersion method described by Andersson and Tuimala [
8]. Samples of stumps and roots were saturated in water for 24 h and then weighed and their volume (cm3) determined. The proportion dry matter content of the wood (g) in the samples was determined after drying at 105 °C in an air-ventilated oven for 3–5 days, depending on sample dimensions. Dry weight to fresh volume ratios of the debarked stumps and roots were then calculated as basic density (g cm−3;
Table 4). Using the dry weight of stump and root samples, their dry masses as a percentage of total dry weight of stump + roots were calculated’ (
Table 3). Dry mass as a percentage of fresh weight was also calculated based on the sample data.
2.5. Soil Analysis
Soil samples down to a depth of 30 cm, were taken from two points in each stand, and the mean texture of the sampled layer was determined. Soils were classified as tills or sediments [
9] in the field, following guidelines provided by Ekström [
10] and then according to particle size in the laboratory. The particle size distribution was determined using a mechanical sieving method (English and German standard), and soil types were classified as follows: sediments as gravel (20–2 mm), coarse sand (2–0.2 mm), fine sand (0.2–0.02 mm), silt (0.02–0.002 mm) or clay (
2.6. Data Analyses
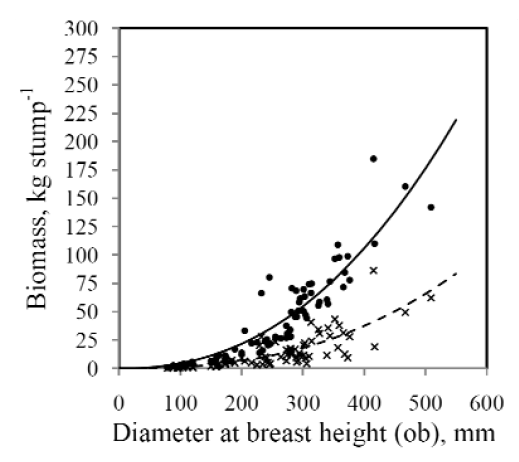
The dry mass production per stump and root system was calculated on the basis of an equation describing the correlation between DBH and dry mass production (kg), derived from data collected from all of the measured stump and root systems.
A power function was tested:
M = β0Dβ1
(1)
where M = dry mass, kg stump−1 or roots−1; D = diameter at breast height, over bark (ob), mm; β0 and β1 are parameters.
The power model is frequently used to describe such relationships [
9,
11,
12,
13,
14].
Based on the mean DBH, the actual dry mass production of each of the poplar stands included in the study was estimated.
Data were analyzed by nonlinear regression using the SAS/STAT system for personal computers [
15]. The fit of the nonlinear regressions was assessed on the basis of the coefficient of determination [
16]:
where
and
The regression was also tested by root mean squared error (RMSE):
,
and
are observed, mean and predicted weights (
).
Throughout the study, means are presented together with their associated standard deviation (SD).
4. Discussion
When harvesting stumps using a conventional excavator, parts of the root system will also be included. In the present study most of the roots thicker than 50 mm came away with the stump when it was lifted. If the cleaning of the stump + roots (≥50 mm) is easy to manage the additional 6.5% of roots that can also be collected may provide extra revenue. However, soil type and soil moisture influence the time it takes to clean the stump and root system. The cleaning of stumps and roots growing in stands with a high percentage clay soil combined with a moist ground could be time-consuming and, hence, costly. These effects were observed during the study, especially in one of the stands. On the site with a moist light clay soil the roots were difficult to clean as the soil was firmly attached to the roots and between them. The percentage root length for 50–100 mm thick roots was 63% of the total. When harvesting the stump including roots > 100 mm, the horizontal extent of roots removed decreased drastically when less attached soil was extracted with the stump. If it is possible to use excavators that only harvest the stumps and the coarsest roots (>100 mm), an additional 4% biomass might be added.
When choosing a suitable species or clone for commercial forestry, the level of basic density is an important factor. The basic density indicates the amount of dry weight solid wood by tree volume. Generally conifer species have higher basic density for stump wood than for stem wood: Young and Chase [
17] found the mean basic density for the stump-root system of poplar was to be 0.336 g cm−3 compared to 0.381 g cm−3 for stems. In a Swedish study of planted poplars on former farmland [
5] the basic density of stems was found to be 0.349 ± 0.009 g cm−3 (0.269–0.470) compared with 0.313 ± 0.044 g cm − 3 (0.218–0.480) for roots in the present study. The sample of coarse roots used in the basic density analysis included two root diameters: 50–100 and 101–200 mm. The means were: 0.311 ± 0.052 and 0.315 ± 0.044 g cm−3 respectively indicating higher values for thicker roots.
The data on stump biomass as a percentage of stem or total tree biomass indicate a promising supply of raw materials for producing bioenergy. The biomass from a poplar stump amounts to about 20% of the stem biomass [
18,
19]. In the present study, stump weight accounted for 21% and 6.5% for roots. Fang
et al. [
20] reported the belowground biomass as a percentage of total tree biomass of two poplar clones in China to be 20%. In a study of an 8-year-old and a 9-year-old stand of Eastern cottonwood in India the belowground biomass was reported to be 18% as a percentage of total tree biomass [
21] or 16% [
22]. The dry weight of stump as a percentage of the stump-root system was 76% (40–96) in the present study. Ajit
et al. [
22] reported 58% for a 9-year-old stand of Eastern cottonwood in India.
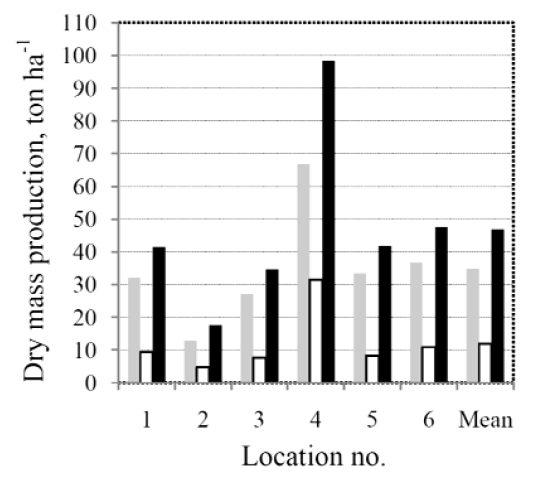
In the present study, the belowground biomass ha−1 (stump + roots) was directly related to the aboveground biomass ha−1. Puri
et al. [
23] reported a similar relationship between root biomass and aboveground biomass for Eastern cottonwood. They also found differences in coarse root (>5 mm) biomass ha−1 depending on spacing (2250, 531 and 208 stems ha−1). The amount of coarse root biomass decreased as spacing increased. However in the present study no such relationship was found for the six stands with densities of 361, 632, 3279, 1250, 675 and 707 stems ha−1, and root biomass values of 9.4, 4.4, 6.6, 31.3, 8.1 and 10.6 tons ha−1 respectively (Figure 4). The number of stems ha−1 has an influence on the area production values and a low biomass per individual in a dense stand might result in a high area biomass compared with a higher individual biomass in a stand with lower numbers of stems (Tables 1 and 3).
Poplar can be planted using a variety of methods: poles (2.0–3.0 m stout poles), stakes or wands (0.75–1.0 m), un-rooted cuttings (0.4–0.5 m) or rooted cuttings (0.8–1.0 m) [
24]. If poplar poles are planted to a depth of 0.8 m, a deep taproot forms [
25]. In Italy these stumps are harvested using a special tool, which removes the stump and taproots without the lateral roots. The shape of a root system is determined by site conditions [
26]. A shallow root system develops even in species that usually produce deep roots if the soil has a high water table. According to Köstler
et al. [
27] the root-system of poplar is shallow with a root length of up to 40 m. In addition, Stokes and Mattheck [
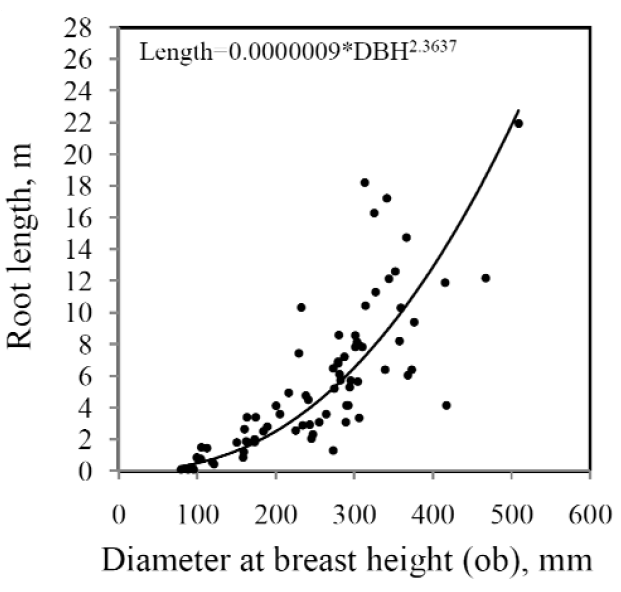
26] reported a shallow root system for poplar. In Sweden only rooted cuttings have been used to establish poplar plantations. Thus, the stumps did not have taproots and most of the lateral roots were found between 5 and 30 cm below ground level. The mean root length of the course (≥50 mm) roots was 6.71 m. In a study of
Populus deltoides (Eastern cottonwood) the coarse root length was found to be 3.4–4.8 m [
23]. They also reported that the maximum coarse root biomass was found in the top 30 cm of the soil profile. In a study by Faulkner [
28] the root system of a Euro-American poplar clone was found between 5 and 20 cm below ground level and in a study of 12-year-old Veronese poplar (
Populus deltoides ×
nigra) stands in New Zealand most of the coarse roots (≥2 mm) were found within the top 40 cm of the soil profile [
29].


