Article

Modeling Young Stand Development towards the Old-Growth Reference Condition in Evergreen Mixed-Conifer Stands at Headwaters Forest Reserve, California

by
John-Pascal Berrill
1,*,
Christopher B. Beal
1,
David H. LaFever
2 and
Christa M. Dagley
1
1
Department of Forestry and Wildland Resources, Humboldt State University, 1 Harpst Street, Arcata, CA 95521, USA
2
Headwaters Forest Reserve, US Bureau of Land Management, 1695 Heindon Road, Arcata, CA 95521, USA
*
Author to whom correspondence should be addressed.
Forests 2013, 4(2), 455-470; https://doi.org/10.3390/f4020455
Submission received: 2 May 2013 / Revised: 8 June 2013 / Accepted: 13 June 2013 / Published: 20 June 2013

Abstract

:
We sought to answer the question: How do we restore characteristics of old-growth evergreen mixed-conifer forests in young even-aged stands on upland terrain at Headwaters Forest Reserve (HFR)? We described the old-growth reference condition for three stands at HFR. In each old-growth stand, trees within a 1-ha plot were inventoried. We found coast Douglas-fir (Pseudotsuga menziesii var. menziesii) and tanoak (Notholithocarpus densiflorus) well represented while coast redwood (Sequoia sempervirens) dominated in terms of size. Numbers of understory and overstory trees ha−1 and average tree sizes were similar among sites, suggesting these were useful goals for restoration. Adjacent to each old-growth stand, we measured recent growth rates of second-growth trees and remnant old trees across a range of tree sizes, stand structures, and densities. The resultant growth models of redwood and Douglas-fir enabled us to project the development of precommercially thinned young stands at HFR forward in time under two silvicultural prescriptions: (i) no further management; and (ii) partial harvesting simulated before trees attained 30 cm dbh. The partial-harvesting prescription reduced stand density and set the young stand on a more rapid trajectory towards the reference condition found at HFR.

1. Introduction

Restoration ecologists frequently use the concept of reference conditions to describe a desired ecosystem state when establishing restoration goals or evaluating restored sites [1]. Reference conditions can vary according to the range of natural variability in species composition, tree size and age distributions, and disturbance regimes in old-growth stands [2,3]. When few contemporary examples of the reference condition exist, these remnants may be rare or unusual forests with composition and structure that is not typical of the forest type across its entire geographic range. Such is the case for coast redwood forests, where researchers have focused on the iconic pure coast redwood stands growing on alluvial flats [4,5]. However, most coast redwood forests in northern California are located on sloping, upland terrain, where an evergreen mixed-conifer composition prevails [6]. Most of these “upland redwood” forests have been harvested, leaving the remaining old-growth in patches dispersed throughout the landscape [7].
A common goal of today’s public land managers is to restore second-growth forest to the old-growth condition. Old-growth redwood forests are known to be structurally diverse, with a range of tree sizes represented. Tree damage and mortality arising from disturbances such as fire, storms, and slope failures creates snags, basal stem cavities, reiterated stems, and coarse woody debris that are important attributes contributing to the overall complexity of these forests [8]. Second-growth redwood forests are developing under a different disturbance regime than the primeval “presettlement” forests, mainly because of fire suppression. While the re-introduction of a natural fire disturbance regime may be ideal, it is not currently feasible for most land managers. On many upland sites, fire has been excluded for longer than is historically typical, and fire-sensitive species may be overrepresented in regenerating young stands and in the remaining old-growth stands serving as the reference condition [9]. In the absence of historical disturbance regimes, partial harvesting can be used to help second-growth stands eventually achieve the structure of old-growth forest [10].
The objectives of this study were to: (i) Establish reference conditions for old-growth upland redwood forests at Headwaters Forest Reserve (HFR); (ii) Analyze and model tree growth over a wide range of tree sizes and conditions in young stands; and (iii) Demonstrate application of the growth models by simulating stand development towards reference conditions in young stands under contrasting silvicultural prescriptions.

2. Methods

2.1. Study Site

We described old-growth reference conditions and measured tree growth at HFR (40°38′12.59″N, 124°04′39.37″W), a 3025-ha property located 9.7 km southeast of Eureka, California (Figure 1). The steep terrain is forested with mixed stands dominated by coast redwood and coast Douglas-fir. Other conifers include grand fir (Abies grandis), Sitka spruce (Picea sitchensis), western redcedar (Thuja plicata), and western hemlock (Tsuga heterophylla) although their numbers are limited. The most common hardwood is tanoak, which is abundant throughout HFR. California bay (Umbellularia californica) also occurs throughout HFR, and bigleaf maple (Acer macrophyllum) and red alder (Alnus rubra) can be found in riparian zones and small openings. Evergreen huckleberry (Vaccinium ovatum) and salal (Gaultheria shallon) frequently form dense patches beneath the canopy of old-growth and older regenerating stands. Common understory plants include redwood sorrel (Oxalis oregano) and western sword fern (Polystichum munitum).
Figure 1. Headwaters Forest Reserve location map with hillshade depicting topography within the 3025-ha property, and locations of three 1-ha plots describing reference conditions within remnant old-growth stands (shown in lighter shade). Inset shows location in California, USA.
Forests 04 00455 g001
Three old-growth stands were systematically selected to represent reference conditions at HFR along a 4-km long east-west gradient covering the broadest range of climatic conditions. Peak elevation was 430 m at Governor’s Grove in the west (hereafter referred to as Governor’s), 500 m at Upper Salmon, and 310 m at Elkhead Springs, the warmest and driest inland location. All three reference stands were free from logging disturbance, and none showed evidence of fire disturbance occurring within the past century.

2.2. Old-Growth Reference Plots

In each of the three old-growth reference stands, a 1-ha (100 × 100 m) plot was established in an area deemed representative of the stand and large enough to accommodate the plot without incorporating atypical topographic or forest features. To mitigate any potential edge effects, each plot was located ≥50 m from roads or cut stumps. Within each 1-ha plot, diameter at breast height (dbh) was measured at 1.37 m above ground on the uphill side of every stem ≥15 cm dbh. For all conifers, total tree height and live crown base height was measured using a laser rangefinder (mounted on monopod; zero pivot offset). Species and crown position were recorded for each tree, using the crown class definition for dominant, codominant, intermediate, and suppressed trees in uneven-aged stands [11]. All snags taller than 3 m were measured for dbh and height. Snags were categorized as “large” if they were ≥60 cm dbh and ≥10 m tall. Additionally, we recorded the presence of a basal stem cavity (a burned-out cavity greater than 30 cm tall at the base of a tree) or reiteration (the development of a second leading apical meristem occurring above breast height).
Tree data from each old-growth plot were grouped into “overstory” (dominant and co-dominant) and “understory” (intermediate and suppressed) tree groups for each species, with density (tree count per hectare), stand density index (SDI), and arithmetic mean dbh and crown ratio calculated for each group. Maximum dbh and maximum tree heights for conifers were reported. While SDI is usually calculated using quadratic mean diameter in even-aged stands [12], we calculated SDI as the hectare sum of individual tree values because the diameter distribution was not normal:
SDI = ∑(0.04DBHi)1.605
where DBHi was the diameter in cm at breast height of the ith tree of each species in the overstory or understory in the 1-ha plot [13].

2.3. Retrospective Growth Analysis in Harvested Stands

Redwood and Douglas-fir tree dbh growth was measured in stands that had been previously harvested 15 to 80 years ago adjacent to the three old-growth reference stands. Our objective was to build a dataset amenable to modeling tree growth across the widest possible range of conditions, for simulation of growth under various restoration prescriptions. We sampled trees in even-aged stands regenerating naturally after clearcutting and in areas where the old-growth forest had been partially harvested. Sample trees were systematically selected to cover a matrix of the following factors, conditions, and locations:
  • Species (redwood or Douglas-fir);
  • Size class (dbh ranges of 10–20 cm, 20–40 cm, 40–60 cm, 60–100 cm, and >100 cm);
  • Competition (basal area ranges of 0–30 m2 ha−1, 30–60 m2 ha−1, and >60 m2 ha−1), and;
  • Adjacent old-growth reference plot (Governor’s, Upper Salmon, and Elkhead Springs).
A minimum of three trees for every combination of these factors was sampled from locations increasingly distant from the adjacent old-growth reference plot. Selected trees showed no sign of ill health or local disturbance that would affect growth over the past five years, and were located a minimum of 10 m from any other sample tree. Sampled trees were measured for dbh, height, and live crown base height. Crown class was recorded for each tree using definitions for uneven-aged stands because these could be applied in even-aged stands and within the irregular structure of sample stands with a history of partial harvesting [11]. One breast height increment core was collected from the uphill side of stems <20 cm dbh, and two cores 90 degrees apart (uphill, cross hill) were collected from stems ≥20 cm dbh. Radial growth over the most recent five years was measured to the nearest 0.01 mm using calipers and averaged for trees cored twice. We limited our growth analysis to the most recent five years in order to strike a balance between accounting for some inter-annual variation and examining growth that reflected current stand conditions [14]. To characterize local stand conditions for each sample tree, we recorded species, crown class, and dbh of neighboring trees. A neighbor tree was selected based on its presence in a variable-radius plot established using a prism with 9.18 m2 ha−1 basal area factor centered on the stem being cored. We used neighbor tree data to estimate stand density and species composition in the vicinity of each sample tree.
Regression analysis of dbh growth data revealed factors significantly correlated with tree growth, and empirical dbh increment models were developed. First, variable-radius plot data were summarized, giving species composition in terms of percent redwood basal area and stand density in terms of SDI. Multiplying the per-hectare conversion factor calculated for each tree in the variable-radius plot by the tree SDI value, and summing these values gave total SDI per hectare in the vicinity of each tree sampled for growth. For comparison, we developed two alternative metrics of stand density that ignored neighbor trees of lower stature than the tree sampled for growth: (i) “Competitive SDI” (cSDI) was calculated as the sum of SDI for trees of equal or superior crown class than the cored stem (i.e., trees of lower crown class were excluded); (ii) A species-specific competition index was developed by applying a sine transformation to cSDI to reflect our hypothesized expectation that the relationship between competition and stand density was sigmoidal. The index for each species was scaled to range between zero and one, where lower values represented less cSDI. An index value of one represented the maximum reported SDI value for each species (2470 for redwood and 1480 for Douglas-fir [12]), where zero and one defined the lower and upper limits of a sine curve with inflexion at 50% of maximum SDI for redwood (cSDIrw) and Douglas-fir (cSDIdf):
Forests 04 00455 i001
In the few cases where Douglas-fir trees had cSDI greater than 1480, we assigned the reported upper limit of SDI for Douglas-fir (SDI = 1480; cSDIdf = 1).
We constructed non-linear inverse polynomial models to examine relationships between average annual dbh increment (DBHI; cm year−1), the dependent variable, and the following explanatory variables: tree size (DBH), crown ratio (CR; crown length/tree height), and competition (SDI, cSDI, cSDIrw or cSDIdf) scaled to range between zero and one. Variables selected for inclusion were based on overall model performance in terms of Akaike information criterion (AIC), for prediction of redwood or Douglas-fir tree dbh growth:
Forests 04 00455 i002
Exponents fitted to crown ratio and competition parameters were retained if model fit improved. Adding the d parameter (DBH + d) to the equation allowed DBHI to exceed zero when DBH = 0, realistically modeling stem growth at the time a young tree attained breast height (DBH = 0). The growth models were used to obtain estimates of expected average growth rate in terms of DBHI for redwood and Douglas-fir across the range of conditions sampled. Expected values were plotted to depict trends in growth and the influence of tree size and stand density.

2.4. Simulating Growth towards the Reference Condition

We used the growth models to obtain estimates of redwood and Douglas-fir dbh development in different cohorts under two contrasting silvicultural prescriptions. Forest stand data from HFR provided starting values for the simulations (Table 1). These data were collected from twelve 0.04-ha circular plots randomly located in regenerating stands. All stems greater than 7 cm dbh were individually tagged; species and dbh were recorded. In addition, we tallied all stems (by species) less than 7 cm dbh. Most young, regenerating even-aged stands at HFR had already received precommercial thinning (PCT). We initiated our simulations after the PCT, and defined this start point as “time zero”, using 2005 density and mean dbh data for each species to represent the so-called “overstory cohort”. The PCT had the unintended consequence of stimulating natural regeneration, hereafter named the “second cohort” and assumed to have a mean dbh of 1 cm at time zero. Tree densities from seedling counts conducted 5–6 years after PCT provided starting values for the second cohort. Stand density was calculated for each species in each cohort, and summed for each cohort. Then cSDI was calculated by adding SDI of older cohorts. As tree growth proceeded, cSDI increased accordingly. Tree growth was projected forward over 300 years, and tree size compared against the reference condition.
Table 1. Summary data from twelve 0.04 ha plots in young stands at Headwaters Forest Reserve, California. Mean dbh and density for all trees >7.62 cm dbh collected in 2005 after precommercial thinning in 2004. Regeneration counted in 2011 did not include trees tallied in 2005.
2005 Mean Dbh (cm)2005 Density (stems ha−1)2011 Regeneration Density (stems ha−1)
Redwood19.6195280
Douglas-fir12.7275480
Hardwood20.680-
After simulating post-PCT tree growth in each cohort, we also simulated a second restoration treatment that further reduced stem densities in the overstory cohort before average tree size reached 30 cm dbh. This was the latest we could schedule the second treatment while complying with the HFR Resource Management Plan which stated that no tree larger than 30 cm dbh would be cut [15]. We assumed this treatment stimulated redwood stump sprout regeneration but would create a thick layer of debris preventing Douglas-fir seedling regeneration [10]. We modeled growth of this “third cohort” of 155 redwood trees ha−1, assuming retention of one sprout per cut stump that attained 1.37 m breast height (0 cm dbh) three years after the second stand entry. The prescribed number of trees retained in the overstory comprised live tree densities specified in the old-growth reference condition and additional trees that might die or be killed later to create snags. The number of these “future snag trees” retained was based on snag densities found in our old-growth reference plots.
Unlike redwood and Douglas-fir, we did not measure and model hardwood growth. The shade-tolerant tanoak trees were assumed to remain in the understory and maintain an average dbh of 20.6 cm, as described in the reference condition. In our simulations of stand development, tanoak SDI was included in cSDI used for redwood and Douglas-fir growth predictions until the conifers reached 30 cm mean dbh. At this size, we assumed conifers overtopped tanoak trees, relegating them to a lower crown class for purposes of cSDI calculation. Density-dependent mortality was simulated by removing Douglas-fir trees whenever cSDI exceeded 1480 (i.e., the maximum reported SDI for Douglas-fir in even-aged stands, applied to the sum of cohort SDIs in a multiaged stand [16]).
Diameter growth forecasted by our non-linear models required inputs for crown ratio (CR) at each time interval. We predicted crown ratio using equations (adapted from [17]) fitted to our cSDI and CR data:
CR = sin(a + bcSDI)2
Simulated partial cutting treatments reduced stand density, which led to unrealistic increases in predicted CR, which in turn affected predictions of DBHI immediately after treatment. Therefore it was necessary to hold live crown base height constant after partial harvesting until stand density had returned to a level where crown rise was predicted to resume. To accomplish this, we fit height-to-diameter models (adapted from [18]) to the natural logarithm of tree height (HT) and diameter (DBH) data, and rearranged the equations to predict tree height from dbh:
HT = 1.37 + e(alnDBH)
We then calculated live crown base height from predicted CR and predicted HT for the average tree of each species in each cohort. Predicted HT was constrained within the range of tree heights measured in our old-growth reference plots. The DBHI, CR, and height-to-diameter models were fitted using R version 2.15.1 and applied in combination to provide estimates of years required to attain average overstory and understory tree sizes specified in the reference condition. In all cases, means were calculated as arithmetic means.

3. Results and Discussion

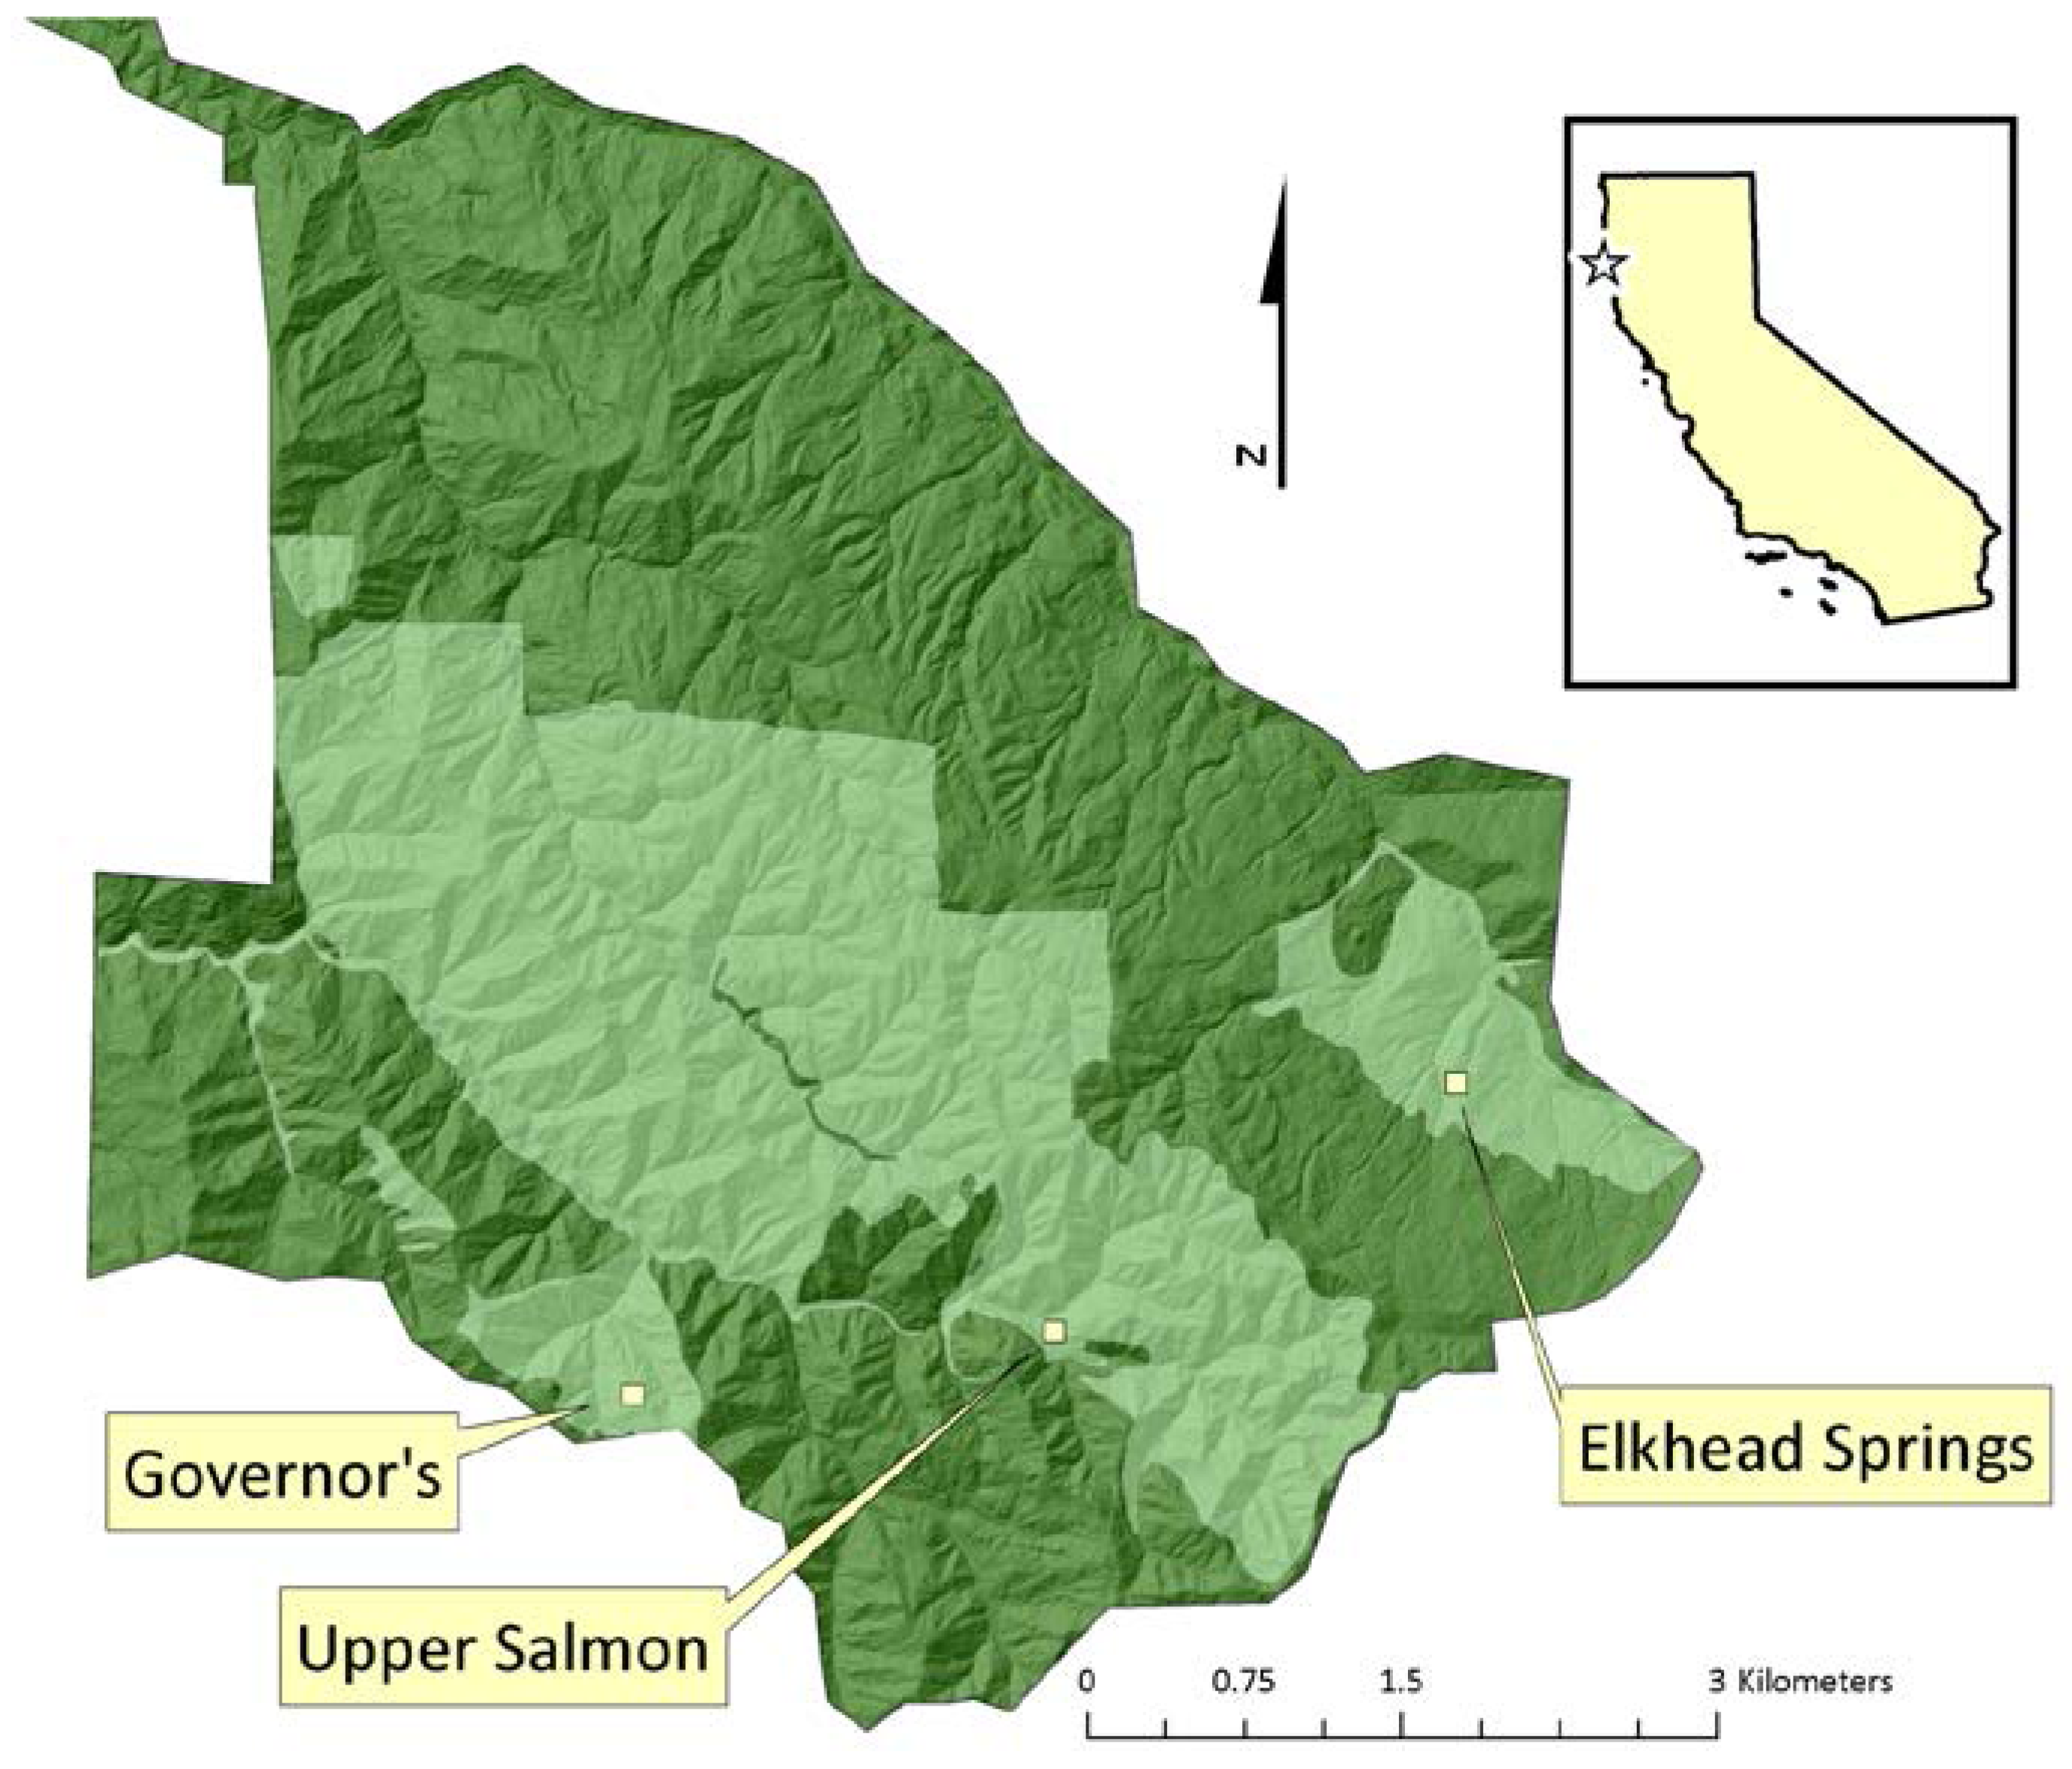
3.1. Old-Growth Reference Conditions

The old-growth reference sites had much larger trees, lower densities, and different species composition than young even-aged second-growth stands that arose after clearcutting at HFR (Table 1, Table 2). Douglas-fir was the most abundant species in young stands, even after PCT to release and favor redwood. Among the three old-growth reference sites, redwood was the most abundant tree species at Governor’s and Elkhead Springs, and nearly rivaled tanoak density at Upper Salmon. Douglas-fir and tanoak were present in all three plots. Grand fir only occurred at Governor’s, and two California bay trees were found in the Upper Salmon plot. Redwood contributed the most towards SDI in all three plots, and was the only species abundant in both the understory and overstory. Mean dbh of conifers in the young stands was approximately one tenth of overstory tree dbh in old-growth reference plots. Young conifer stem densities were approximately 10 times the density of conifers in the old-growth overstory. At the three old-growth reference sites, density of all live stems ≥15 cm dbh ranged from 171 to 216 trees ha−1. Basal area ranged between 146.9 m2 ha−1 at Elkhead Springs and 199.8 m2 ha−1 at Governor’s. Total stand SDI values ranged from 1450 at Elkhead Springs, the driest inland location sampled, to 1907 at Governor’s. The maximum tree height did not exceed 84 m, and the tallest trees in each plot included both redwood and Douglas-fir, approximately 80 m tall in all cases. Diameter distributions for old-growth reference plots indicated that redwoods were present in all size classes (Figure 2). At Elkhead Springs, the density of overstory Douglas-fir was lower than at the other two sites. Only redwood and Douglas-fir trees grew larger than 150 cm dbh. Trees labeled “other species” in the diameter distribution graphs were almost exclusively tanoak at Upper Salmon and Elkhead Springs, and a mix of tanoak and grand fir at Governor’s. These two species were the most abundant of all trees in the smallest size classes. Douglas-fir was poorly represented or nonexistent in the smaller size classes, likely due to high SDI. The thick litter layer and dense understory at HFR may also be impeding Douglas-fir regeneration. Douglas-fir is known to establish well on a seedbed of bare mineral soil and is less tolerant of shade than redwood, grand fir, and tanoak [19].
Table 2. Summary data for trees ≥15 cm dbh in three 1-ha plots in old-growth stands at Headwaters Forest Reserve, California. Data aggregated by crown class into understory (u, suppressed and intermediate) and overstory (o, dominant and codominant) groups. Height recorded for conifers only.
Site and speciesDensity (stems ha−1)SDIMean Dbh (cm)Max. Dbh (cm)Crown RatioMax. Ht. (m)
uouououo
Governor’s Grove
Redwood7436336110855.4207.9305.30.520.5979.7
Douglas-fir4213433688.9138.8192.00.390.4780.0
Grand fir44167929.9101.0101.00.390.5363.7
Tanoak18016022.8-36.0
Total14058453145444.2181.0
Salmon Pass
Redwood513234575071.3172.4350.20.510.5477.1
Douglas-fir16296843857.2134.2191.30.500.5681.0
Tanoak86086024.1-58.6
California bay207052.4-55.3
Total15561504118843.4154.2
Elkhead Springs
Redwood553424892058.7190.6347.50.470.6284.1
Douglas-fir314917149.2116.4192.10.360.5274.8
Tanoak650102031.3-84.6
Total12348359109144.0169.0
Figure 2. Diameter distributions for all trees ≥15 cm dbh in (a) Governor’s (b) Upper Salmon and (c) Elkhead Springs old-growth reference plots at Headwaters Forest Reserve, California.
Forests 04 00455 g002
Basal stem cavities, reiterations, and large snags are features indicative of old-growth forests [20]. The incidence of these features was greatest at Governor’s and least at Elkhead Springs (Table 3). The majority of basal stem cavities and all reiterations were found on redwood trees. Most snags at Governor’s were grand fir. Grand fir was not found in the overstory, suggesting that under the current stand conditions it was able to grow beneath the canopy but did not survive long enough to attain upper canopy status, giving rise to numerous small snags. The ratio of redwood to Douglas-fir snags was ≥1:1, and the ratio of small to large snags (excluding grand fir) was approximately 2:1. Restoration of large snags first requires large trees be grown. In old-growth stands on alluvial flats, larger redwood trees were most likely to have basal stem cavities and reiterations [5]. However, to restore these features, restoration treatments accelerating tree-size development will need to be accompanied by disturbances such as fire and storms or surrogate treatments that damage stems and tree tops.
Table 3. Number of large snags (≥60 cm dbh, ≥10 m tall), small snags, and trees with basal stem cavities and reiterations in three 1-ha old-growth reference plots at Headwaters Forest Reserve, California. Percent redwood indicates how much of each tally was represented by redwood trees.
Governor’sUpper SalmonElkhead Springs
Count% RedwoodCount% RedwoodCount% Redwood
Large snags3100250757
Small snags1817650956
Basal stem cavities1493111003100
Reiterations510041002100
Comparing our reference conditions for redwood forests on upland terrain at HFR against alluvial flat redwood forest data from a similar study [4,5] revealed that SDI on alluvial flats was approximately 26% higher on average than SDI at HFR, and alluvial flat stand basal area was approximately 48% higher on average. The tallest redwoods were 26% taller in alluvial flat reference plots. Our upland redwood plots had many more snags, likely due to the presence of species other than redwood which are not as long lived. Reiterations were five times more frequent at the alluvial flat sites. Total stem density was higher on upland sites while the two forest types had similar overstory densities. At HFR, the overstory trees were smaller in dbh and height than alluvial flat overstory trees, resulting in a more open forest canopy that intercepted less light and presumably allowed for a higher density of understory trees.

3.2. Tree Growth in Harvested Stands

In total, 330 second-growth and remnant old-growth trees were sampled for dbh growth: 174 redwood and 156 Douglas-fir, encompassing a range of tree sizes (Table 4). On average, the two species had similar growth rates. However, Douglas-fir had lower mean values for SDI and cSDI than redwood. The spread of SDI and cSDI data indicated that our sampling covered a wide range of stand densities, including areas with widely-spaced trees and dense, crowded areas.
Table 4. Summary data for trees sampled for recent growth at Headwaters Forest Reserve, California. Growth was average annual diameter increment (DBHI) and basal area increment (BAI) over the most recent five years. Redwood ratio was ratio of number of redwood trees to other trees in plot. Competitive stand density index (cSDI) was sum of per-hectare stand density index (SDI) for trees with crown class above or the same as sampled tree, including SDI of sample tree.
VariableMeanStd. Dev.Min.Max.
Redwood (n = 174)
Dbh (cm)47.1744.2310.20283.10
Height (m)21.9614.294.3972.36
Crown ratio0.590.140.150.88
DBHI (cm year−1)0.780.400.081.64
BAI (cm2 year−1)53.6640.631.47159.91
Redwood ratio (stems per plot)0.760.200.251.00
SDI940.52463.09175.192161.29
cSDI683.57415.32119.352123.17
Douglas-fir (n = 156)
Dbh (cm)47.2634.2111.20177.00
Height (m)26.1814.627.0775.11
Crown ratio0.580.200.120.92
DBHI (cm year−1)0.770.400.081.66
BAI (cm2 year−1)54.1036.301.45134.70
Redwood ratio (stems per plot)0.440.270.000.89
SDI800.00368.72196.361951.47
cSDI568.67323.21123.111951.47
Regression analysis indicated that cSDI was a stronger predictor of tree dbh growth than SDI, and model fit improved further when the sine-transformed cSDI index replaced cSDI (i.e., AIC values improved from 83.7 to 20.4 to 19.9 for redwood, and from 56.0 to 19.1 to 13.5 for Douglas-fir). This suggested that growth of a sampled tree was less affected by trees in subordinate crown classes, consistent with higher growth efficiencies reported for redwood trees of superior crown class and canopy strata [21]. Due to convergence problems, we fitted the DBHI models while iteratively varying the “d” coefficient until AIC was minimized. This gave “d” parameter estimates of 52 for redwood and 200 for Douglas-fir. All other DBHI model coefficients and fit statistics are listed in Table 5.
Table 5. Inverse polynomial diameter increment model coefficients and fit statistics for redwood and Douglas-fir trees sampled for growth at Headwaters Forest Reserve, California.
ParameterEstimateStd. Errort valuePr (>|t|)
Redwood (n = 174)a110.22327.9313.9460.000
b−1.6650.579−2.8740.005
c0.0120.0034.0390.000
e0.6050.1244.8790.000
Douglas-fir (n = 156)a1850.000585.6003.1590.002
b−14.7404.758−3.0980.002
c0.0330.0973.3490.001
e0.3040.1072.8510.005
f0.6500.1066.1230.000
Model predictions indicated that mean dbh increment peaked between 35 and 45 cm dbh for redwood and Douglas-fir (Figure 3). Rate of growth was generally higher for redwood, except for small Douglas-fir trees at low stand densities (cSDI). Douglas-fir dbh growth was more sensitive to competition (in terms of cSDI) than redwood.
Figure 3. Relationship between expected (average) annual dbh increment (cm year−1) and dbh (cm) in redwood and Douglas-fir at Headwaters Forest Reserve, California, as a function of competitive SDI (cSDI) and crown ratio predicted from cSDI.
Forests 04 00455 g003
On average, redwood trees maintained longer live crowns than Douglas-fir at higher cSDI (Figure 4). Presumably this result reflected the greater shade tolerance of redwood. Height-to-diameter relationships indicated that Douglas-fir trees were taller than redwoods of similar dbh.
Figure 4. Relationships between crown ratio and competitive SDI (cSDI) for redwood: CRrw = sin(1.002 − 0.0001823cSDI)2; and Douglas-fir: CRdf = sin(1.121 − 0.0004553cSDI)2 (left panel); and height-dbh relationship for redwood: HT = 1.37 + e(0.7899lnDBH); and Douglas-fir: HT = 1.37 + e(0.8407lnDBH) (right panel); for n = 330 trees sampled for growth at Headwaters Forest Reserve, California.
Forests 04 00455 g004

3.3. Simulating Restoration Prescriptions

Based on the range of values found in our old-growth reference plots, we specified “restoration goals” of attaining:
(i)
Overstory tree size and density: 32–36 redwood trees ha−1 averaging 170 cm dbh minimum, and 14–29 Douglas-fir trees ha−1 averaging 120 cm dbh minimum;
(ii)
Understory tree size and density: 51–74 redwood trees ha−1 with a mean of 56 cm dbh, and 3–16 Douglas-fir trees ha−1 with a mean dbh of 50 cm;
(iii)
Crown ratio: 54%–62% for redwood and 47%–56% for Douglas-fir overstory trees (Table 2); and;
(iv)
Snag densities: 2–7 large snags ha−1 (Table 3).
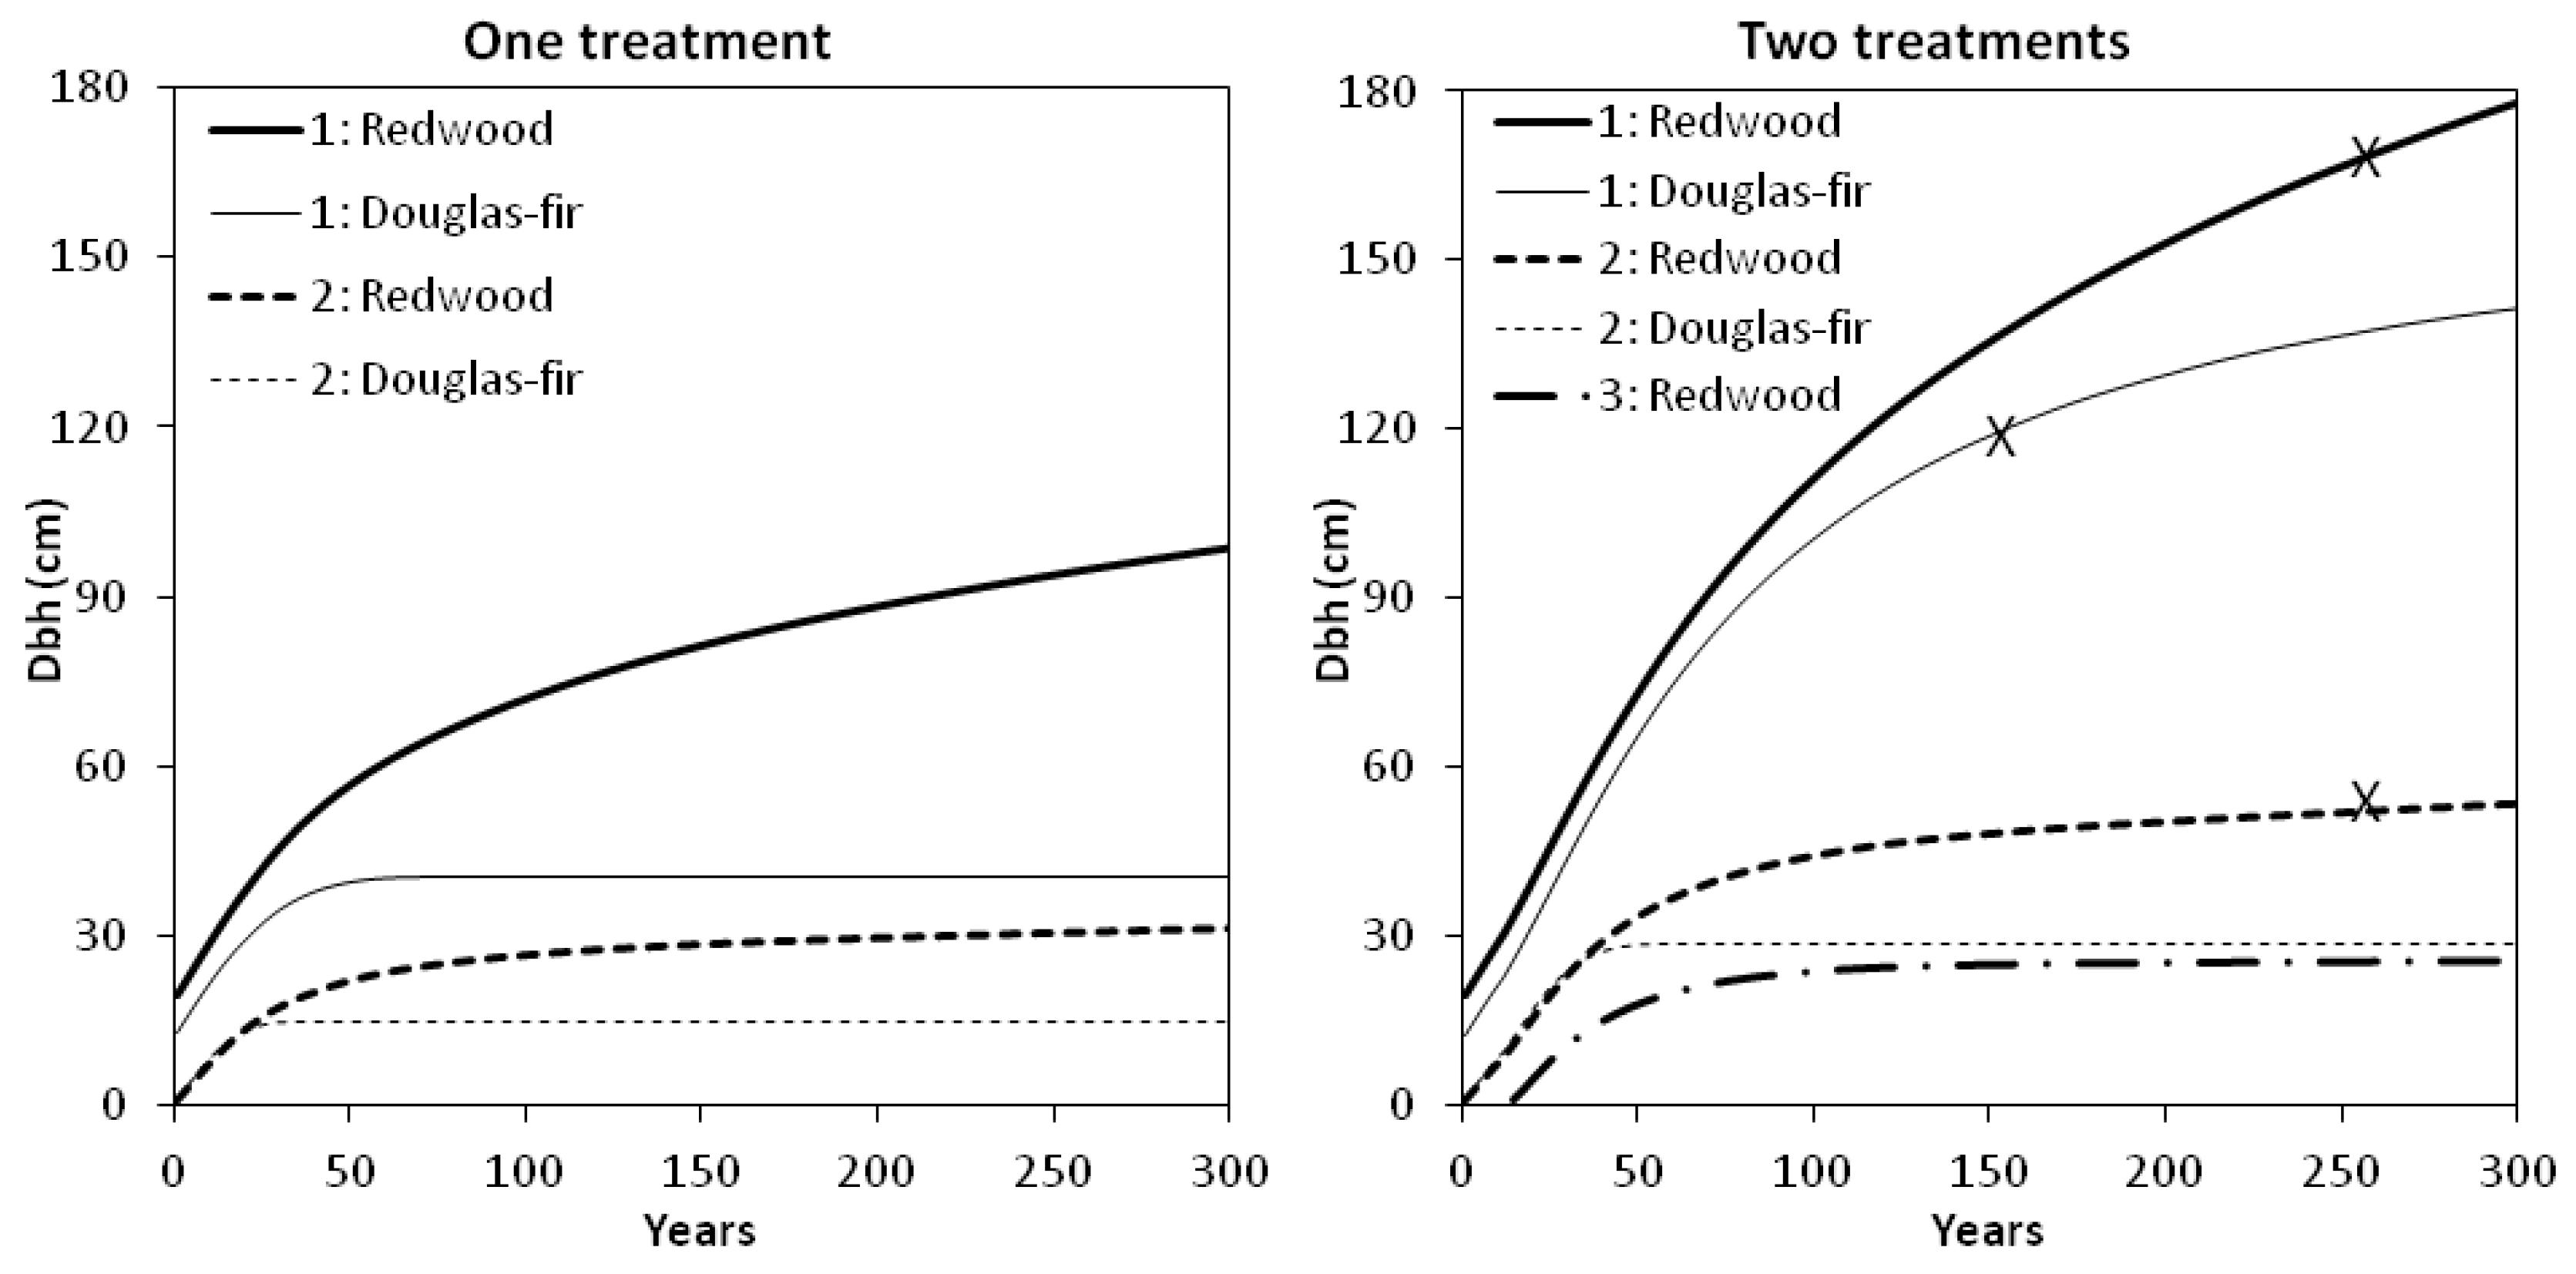
Our first simulation was a “one treatment” restoration prescription (PCT only), without any subsequent intervention or disturbance. Model predictions indicated that tree growth would proceed slowly (Figure 5). Overstory redwood had not attained a mean dbh of 100 cm after 300 years. Stand density exceeded 1480 (the maximum SDI for Douglas-fir [12]) by year 70, at which time the average overstory Douglas-fir had reached 41 cm dbh. Our models did not predict mortality explicitly, but we speculated that density-dependent mortality among understory and smaller overstory Douglas-fir could result in a gradual increase in average tree dbh among fewer, larger surviving Douglas-fir. Under this scenario, crown ratio fell below the reference condition and minimum tree-size and density thresholds were not attained within 300 years.
Figure 5. Simulated diameter development of redwood and Douglas-fir in two or three cohorts (overstory cohort, “1”; second cohort, “2”; third cohort, “3”) under two different scenarios. Left panel: “One treatment” with 465 overstory stems ha−1 remaining after one precommercial thinning (PCT) (before time zero). Right panel: “Two treatments” including one PCT (before time zero) followed by a second stand entry (partial cutting to leave 70 stems ha−1 in the overstory) before the average overstory redwood reached 30 cm dbh. Restoration goals for mean dbh denoted by “x”.
Forests 04 00455 g005
In a second scenario, we simulated a second stand entry after 12 years, before the average redwood reached 30 cm dbh (Figure 5). Partial cutting left 40 redwood trees and 30 Douglas-fir trees ha−1 in the overstory. To re-create snag reference conditions, these densities included an allowance for natural mortality or snag creation at the rate of two overstory snags ha−1 and four understory snags ha−1 (equal numbers of Douglas-fir and redwood) every 50 years. Under this “two treatment” restoration prescription (PCT + second entry) our models predicted rapid growth of overstory conifers towards our old-growth reference conditions. Overstory redwood reached a mean dbh of 100 cm at year 83, and Douglas-fir attained the same mean diameter at year 99. After 154 years, the remaining overstory Douglas-fir (27 trees ha−1) reached 120 cm average dbh and had 47% crown ratio, the minimum thresholds based on our reference condition. At year 261, 35 overstory redwood trees reached our tree-size goal of 170 cm mean dbh. Stand density index was approaching the maximum for redwood, higher than the reference condition and indicative of crowding. However, overstory redwood crown ratio was predicted to remain within the range of values sampled in old-growth stands at HFR. At this time in the simulation, redwood trees in the midstory (53 cm mean dbh) had almost attained the 56 cm threshold.
Neither treatment scenario depicted in Figure 5 predicted restoration of the understory Douglas-fir reference condition. Under both scenarios, predicted dbh increment of understory Douglas-fir ceased once stand density climbed above 1480 SDI. Unknown was how long this cohort would survive, and how density-dependent mortality would alter average dbh over time. In our reference condition plots, understory Douglas-fir were rare but present. Managing for Douglas-fir regeneration and additional recruitment into the overstory will likely require some form of disturbance, such as the reintroduction of fire or partial harvesting to alter forest floor and light conditions and make growing space available. Identifying Douglas-fir trees furthest from overstory redwood trees, and reducing stand density in their immediate vicinity should relieve crowding. Theoretically this modification to the spatial pattern of tree locations would result in allocation of more growing space to Douglas-fir and less to other stand components. Our second simulation appeared to make enough growing space available for overstory Douglas-fir while meeting the 30 cm dbh limit for cutting and slowing the process of (predicted) crown rise. Unknown is whether such heavy early cutting would encourage development of large, persistent lower branches in the oldest cohort. Raising the 30 cm dbh limit for cutting specified under the current management plan [15] could allow deferral of cutting until crown rise had proceeded and the overstory had lower stems free of live branches.
Our models only provide estimates indicative of tree growth and stand development. They have a wide range of applicability in terms of tree size and stand density. However, predictions should only be regarded as “hypotheses for future testing” until DBHI models are validated with independent data. Incorporating models of tanoak growth, conifer and hardwood mortality, dbh distributions, and height growth would improve predictions of tree growth and stand structure. We recommend field-testing the restoration treatments presented and some alternative treatments (different densities and timing of cutting) and monitoring subsequent tree growth, regeneration, and mortality for future model validation and to inform adaptive management at HFR.

4. Conclusions

A mixture of redwood and Douglas-fir dominated the overstory and defined the old-growth reference condition at HFR. Douglas-fir was scarcely found in the understory. Conversely, redwood was outnumbered by Douglas-fir in young regenerating stands. Our dbh increment data and model simulations indicated that Douglas-fir was more sensitive to competition than redwood. Only one of the two restoration prescriptions applied to young stands met restoration goals within a 300-year timeframe. The PCT-only regime did not promote rapid development of overstory trees towards the old-growth reference condition. A second treatment was needed to further reduce stand density, and promote and sustain rapid growth among overstory redwood and Douglas-fir trees while allowing for snag recruitment and making growing space available for smaller trees in the understory. This prescription set the young stand on a more direct trajectory towards the old-growth reference condition for overstory tree size, density, and species composition. It took longer for overstory redwood trees to attain the mean dbh found in our reference condition than overstory Douglas-fir. After the second treatment, simulations indicated that increasing stand density was constraining understory dbh growth. Douglas-fir was most impacted, whereas redwood in the understory continued to grow and met the restoration goal in terms of tree size found in the old-growth reference stands.

Acknowledgments

Support was provided by a Bureau of Land Management National Landscape Conservation System Science Grant. Field assistance was provided by Brian Anderson, Jake Birge, Charles Brown, Desiree Davenport, Nathan Hancock, Daniel Kluegel, Janna Loeppky, Britney Newby, Meghan Still, and the Humboldt State University FOR 431 Forest Restoration class of 2011.

Conflict of Interest

The authors declare no conflict of interest.

References

  1. Stephenson, N.L. Reference conditions for giant sequoia forest restoration: Structure, process, and precision. Ecol. Appl. 1999, 9, 1253–1265. [Google Scholar] [CrossRef]
  2. Moore, M.M.; Covington, W.W.; Fulé, P.Z. Reference conditions and ecological restoration: A southwestern ponderosa pine perspective. Ecol. Appl. 1999, 9, 1266–1277. [Google Scholar] [CrossRef]
  3. White, P.S.; Walker, J.L. Approximating nature’s variation: Selecting and using reference information in restoration ecology. Restor. Ecol. 1997, 5, 338–349. [Google Scholar] [CrossRef]
  4. Dagley, C.M. Spatial pattern of coast redwood in three alluvial flat old-growth forests in northern California. For. Sci. 2008, 54, 294–302. [Google Scholar]
  5. Dagley, C.M.; Berrill, J.-P. Reference Conditions for Old-Growth Redwood Restoration on Alluvial Flats. In Proceedings of Coast Redwood Forests in a Changing California: A Symposium for Scientists and Managers; Pacific Southwest Research Station, Forest Service, US Department of Agriculture: Albany, CA, USA, 2012. [Google Scholar]
  6. Van Mantgem, P.J.; Stuart, J.D. Structure and Dynamics of an Upland Old-Growth Forest at Redwood National Park, California. In Proceedings of Coast Redwood Forests in a Changing California: A Symposium for Scientists and Managers; Pacific Southwest Research Station, Forest Service, US Department of Agriculture: Albany, CA, USA, 2012. [Google Scholar]
  7. Fritschle, J.A. Identification of old-growth forest reference ecosystems using historic land surveys, Redwood National Park, California. Restor. Ecol. 2012, 20, 679–687. [Google Scholar] [CrossRef]
  8. Lorimer, C.G.; Porter, D.J.; Madej, M.A.; Stuart, J.D.; Veirs, S.D.; Norman, S.P.; O’Hara, K.L.; Libby, W.J. Presettlement and modern disturbance regimes in coast redwood forests: Implications for the conservation of old-growth stands. For. Ecol. Manag. 2009, 258, 1038–1054. [Google Scholar] [CrossRef]
  9. Agee, J.K. The landscape ecology of western forest fire regimes. Northwest Sci. 1998, 72, 24–34. [Google Scholar]
  10. O’Hara, K.L.; Nesmith, J.C.; Leonard, L.; Porter, D.J. Restoration of old forest features in coast redwood forests using early-stage variable-density thinning. Restor. Ecol. 2010, 18, 125–135. [Google Scholar] [CrossRef]
  11. Helms, J.A. The Dictionary of Forestry; The Society of American Foresters: Bethesda, MD, USA, 1998; p. 210. [Google Scholar]
  12. Reineke, L.H. Perfecting a stand-density index for even-aged forests. J. Agric. Res. 1933, 46, 627–638. [Google Scholar]
  13. Shaw, J.D. Application of stand density index to irregularly structured stands. West. J. Appl. For. 2000, 15, 40–42. [Google Scholar]
  14. Berrill, J.-P.; Dagley, C.M. Geographic patterns and stand variables influencing growth and vigor of Populus tremuloides in the Sierra Nevada (USA). ISRN For. 2012, 2012. [Google Scholar] [CrossRef]
  15. US Department of the Interior Bureau of Land Management and California Department of Fish and Wildlife, Headwaters Forest Reserve Proposed Resource Management Plan and Final EIS/EIR; Environmental Impact Statement: Arcata, CA, USA, 2003.
  16. Long, J.N.; Daniel, T.W. Assessment of growing stock in uneven-aged stands. West. J. Appl. For. 1990, 5, 93–96. [Google Scholar]
  17. Berrill, J.-P.; Jeffress, J.L.; Engle, J.M. Coast Redwood Live Crown and Sapwood Dynamics. In Proceedings of Coast Redwood Forests in a Changing California: A Symposium for Scientists and Managers; Pacific Southwest Research Station, Forest Service, US Department of Agriculture: Albany, CA, USA, 2012. [Google Scholar]
  18. Eng, H. Tree Height Estimation in Redwood/Douglas-fir Stands in Mendocino County. In Proceedings of Coast Redwood Forests in a Changing California: A Symposium for Scientists and Managers; Pacific Southwest Research Station, Forest Service, US Department of Agriculture: Albany, CA, USA, 2012. [Google Scholar]
  19. Hermann, R.K.; Lavender, D.P. Douglas-Fir. In Silvics of North America: 1 Conifers; Burns, R.M., Honkala, B.H., Eds.; US Department of Agriculture, Forest Service: Albany, CA, USA, 1990. [Google Scholar]
  20. Spies, T.A.; Franklin, J.F. The Structure of Natural Young, Mature, and Old-Growth Douglas-Fir Forests Oregon and Washington. In Wildlife and Vegetation of Unmanaged Douglas-Fir Forests; Pacific Southwest Research Station, Forest Service, US Department of Agriculture: Albany, CA, USA, 1991; pp. 91–109. [Google Scholar]
  21. Berrill, J.-P.; O’Hara, K.L. Patterns of leaf area and growing space efficiency in young even-aged and multiaged coast redwood stands. Can. J. For. Res. 2007, 37, 617–626. [Google Scholar] [CrossRef]

