
A 20-Year Overview of Quercus robur L. Mortality and Crown Conditions in Slovenia


Slovenian Forestry Institute, Večna pot 2, 1000 Ljubljana, Slovenia
Forests 2015, 6(3), 581-593; https://doi.org/10.3390/f6030581
Submission received: 25 November 2014
/
Revised: 11 February 2015
/
Accepted: 15 February 2015
/
Published: 27 February 2015
Abstract
:Pedunculate oak (Quercus robur L.) forests in Slovenia are experiencing widespread mortality. Changes in lowlands are reflected in decline of complete forest complexes, high mortality, uneven stand structure and associated forest regeneration problems. Prediction of the present-tree response in disturbed forest ecosystems may significantly contribute to better guideline policies for the silvicultural and forest management practice in the changing environment in both stressed and stabile forest ecosystems. Data from annual crown condition surveys for the 1995–2014 period from four permanent plots have been compared with parameters from hemispherical photo analysis and hydrometeorological data. Good agreement has been confirmed between crown defoliation and total openness; all parameters from the hemispherical photo analysis, which were corrected for winter period values, also indicated a better agreement. Mortality rate and crown defoliation correlated well with extreme drought events in 2003 and 2013. Pattern of agreement among compared parameters was different for the plots Krakovski gozd, Dobrava and some other plots. Mortality is influenced by the average air temperatures much more than by precipitation and groundwater table oscillations.
1. Introduction
Pedunculate oak (Quercus robur L.), one of the important and key tree species of European forests, is naturally widely distributed in the different climatic areas. It covers the widest area of all European oaks [1]; in humid Atlantic region it coincides well with sessile oak (Q. petraea (Matt.) Liebl.), while in Scandinavia and in the eastern European region it reaches even further [2,3]. In the area located east and south-east of the Alps and where under the influence of the Mediterranean and Pannonian regions, it is a distinctive heliophyte, well distributed in humid valleys and floodplains on deep clayed or sandy soils with sufficient groundwater level, where occasional floods are no rarity [1]. In Slovenia, oaks grow on 55 per cent of forested area; apart from pedunculate and sessile oaks, bitter oak (Q. cerris L.) and downy oak (Q. pubescens Wild.) are also found in lowlands and on the edges of the colline zone, where forest cover is smaller and population density higher than in other forested areas.
European oak forests constitute important ecosystems as sources of high-quality wood, wildlife habitats and biodiversity hot spots. Pedunculate oak forests in particular are experiencing widespread mortality in Europe, which have resulted in uneven age-class proportions and have reduced seedling regeneration, and sustainability concerns. Oak mortality has occurred repeatedly during the past three centuries and became more pronounced in recent decades in Europe [4] and North America [5]. Although the cause of mortality is currently unknown, it has been associated with changes in water availability [6,7,8,9,10,11,12], weather extremes and forest management choices [12]. Many studies have also explained periodic oak decline owing to climate extremes and pathogens [13] or to the occurrence of Phytophthora fungi, although the primary pathogenicity remains unknown [14]. Extinction of lowland forests is therefore characterized not only by economic loss, but also by degradation and loss of rich oak-growing sites.
Although lowland oak forests in Slovenia are exposed to temperate climate, they encounter periods of severe drought, which are known to be involved in forest decline processes [11] as well as in limiting forest primary productivity and tree growth. Except for floodplain characteristics, they are the most artificially changed forests in Slovenia as well as in lowlands of other European countries. Originally, their natural range coincided with that of the nowadays most intensely managed agricultural land [12,15]. Larger complexes of pedunculate oak are now restricted to small areas and found only on moist sites less suited for agriculture. Significant correlation has been confirmed between groundwater table and pre-dawn water potential [16], lower groundwater, precipitation and defoliation of pedunculate oaks [11] and also between groundwater table, water potential and stomatal conductance in different light categories of planted and naturally regenerated oak saplings [12]. Short term ability of adult oaks to osmotically compensate water stress has been confirmed during drought stress [17], but their condition is not improving according to their radial growth and status of crown transparency [18].
Changes in lowlands are reflected in decline of complete forest complexes, high mortality and uneven stand structure that are associated with problems in natural regeneration of pedunculate oak. The main aim of our research was to overview the last 20-year period status of the lowland oaks and to predict their ecological perspective. Study and prediction of the present-tree response in disturbed forest ecosystems would contribute to guideline policies for the silviculture and forest management practices in both stressed and stabile forest ecosystems.
Our goal of the research was to compare long-term crown conditions with parameters obtained from analysis of hemispherical photos (1) and to parallel crown conditions with evidenced mortality and groundwater table over the 20-year period on all studied plots (2).
2. Material and Methods
2.1. Plot Description
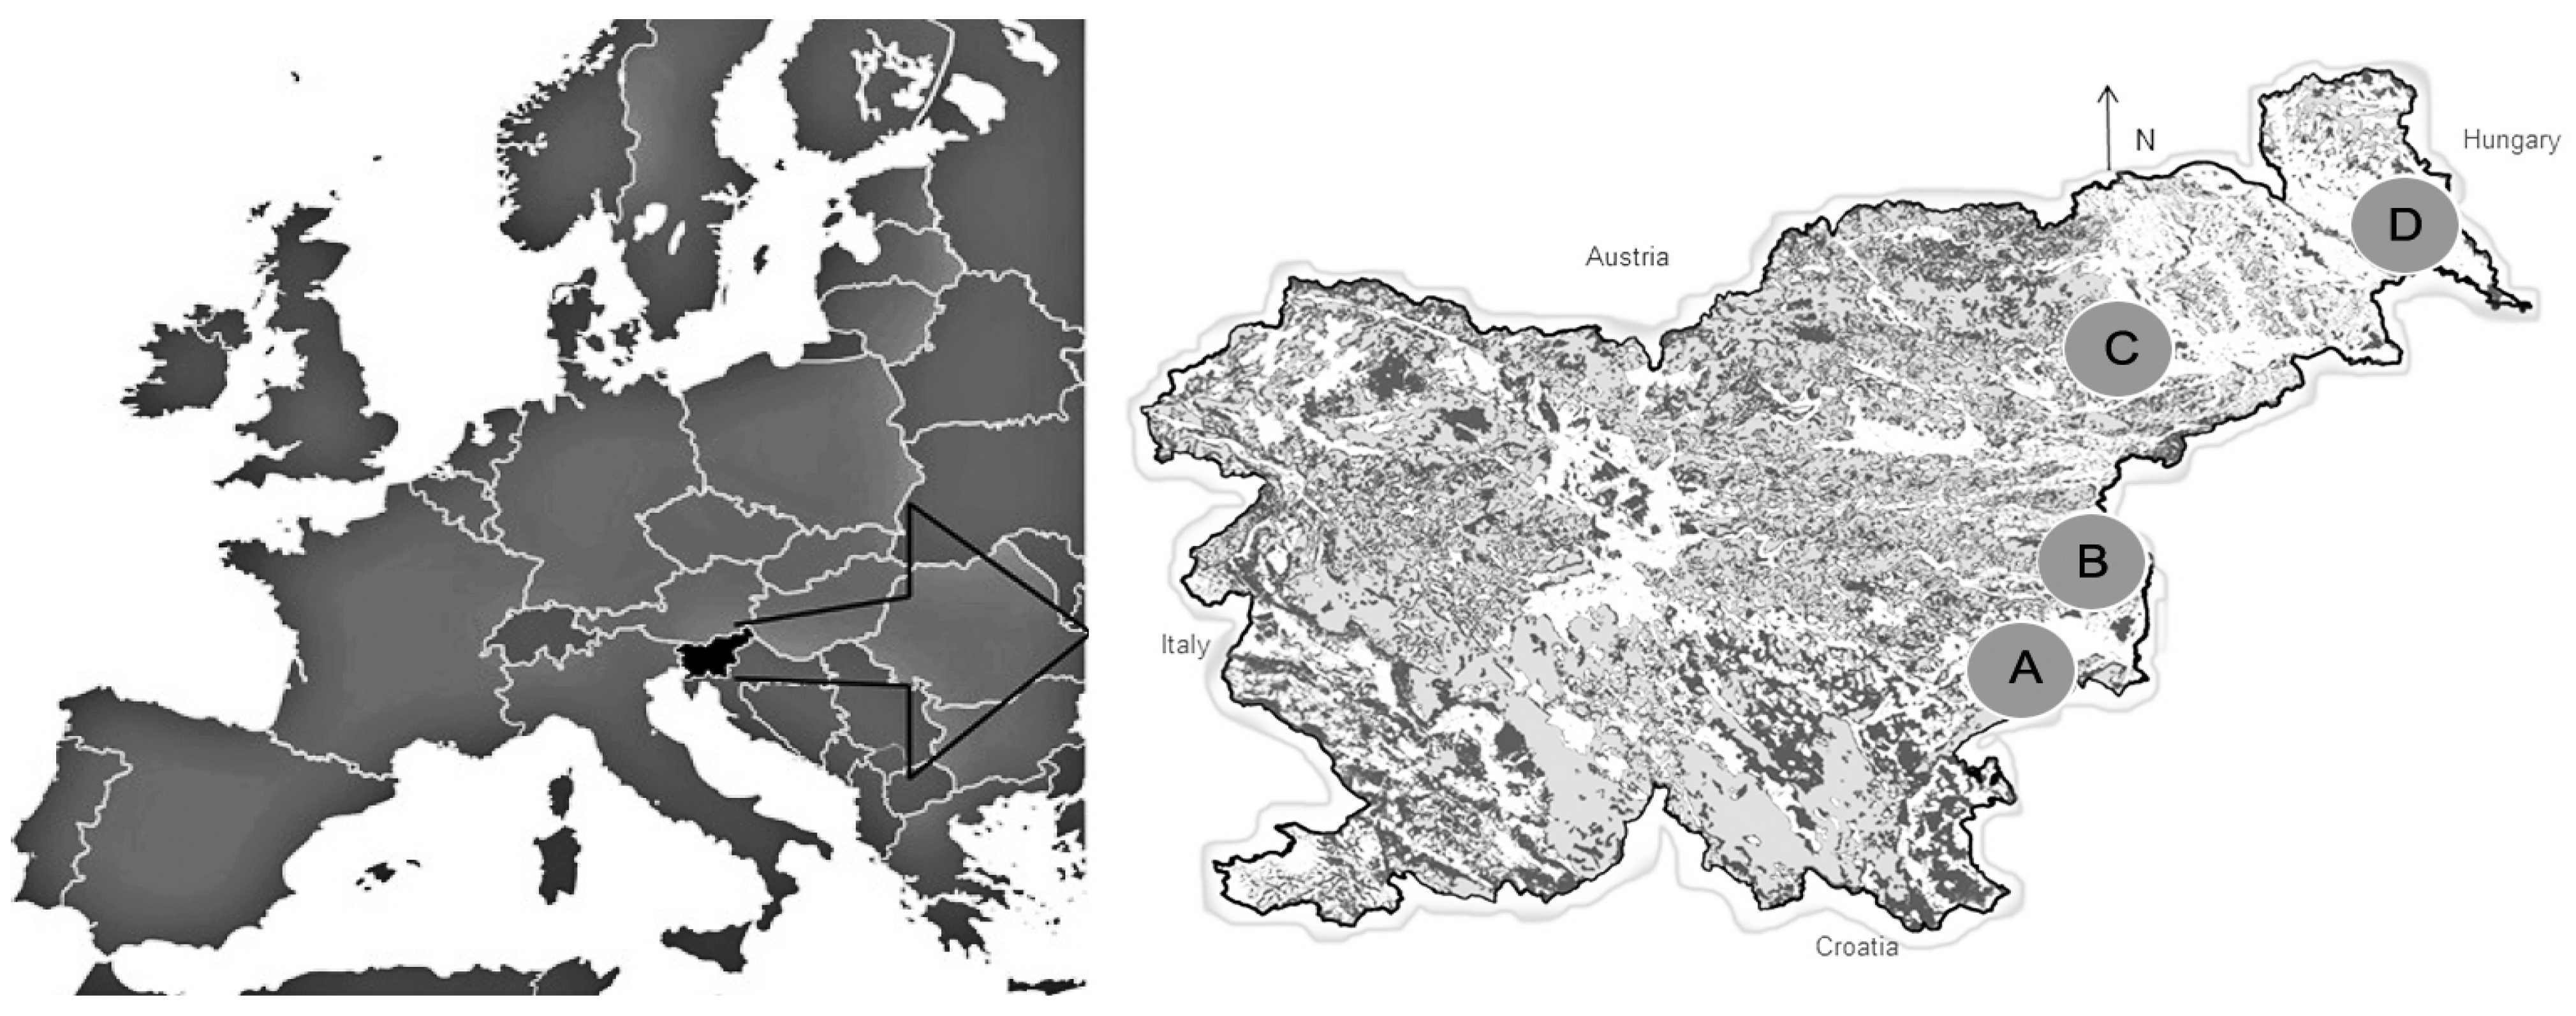
Surveys included four permanent plots on autochthonous pedunculate oak sites that once represented wide unfragmented forest complexes (Table 1). Plots were established in 1985 for the purpose of oak monitoring that were not disturbed by forest management measures: Krakovski gozd (A), Dobrava near Brežice (B), Cigonca near Slovenska Bistrica (C) and Hraščica near Beltinci (D) with their main characteristics presented in Figure 1. All plots included more than 100 years old stands on homogenous sites with more than 50% of pedunculate oak in the dominant (mature) layer, with canopy closure higher than 0.7 and average stand density of 200–250 adult pedunculate oak trees/ha. Each rectangular research permanent plot was divided into 25 subplots (20 × 20 m in size). All pedunculate oaks were numbered and all trees with breast height diameter (dbh) over 10 cm marked and evidenced. Only dead trees were removed from the forest stand.

| Plot | Altitude (m) | Soil | Stand density (No/ha) | Annual average air T (°C) | Annual precipitation (mm) |
|---|---|---|---|---|---|
| A | 154 | Gleysols on Pleistocene clay and loam | 204 | 10.9 | 1138 |
| B | 176 | Gleysols on uncalcareous alluvial sediments | 211 | 11.0 | 990 |
| C | 265 | Gleysols on Pleistocene clay and loam | 237 | 10.7 | 1061 |
| D | 163 | Eutric cambisols on gravel | 241 | 10.6 | 792 |
Figure 1.
Location of the research plots in the forested area of Slovenia.

2.2. Assessment of Crown Conditions
The crown condition survey was performed every year during the first week of August on same adult trees on permanent plots to give an estimate of current state of pedunculate oaks in Slovenia. The main indicator was evaluated at first by the ocular estimate of the missing proportion to virtual and same healthy tree of the same social status and site conditions as the estimated one [19] to the accuracy of 5%. Ocular surveys, which started in 1995 and were completed in 2014, were performed by the same person (author) during this period.
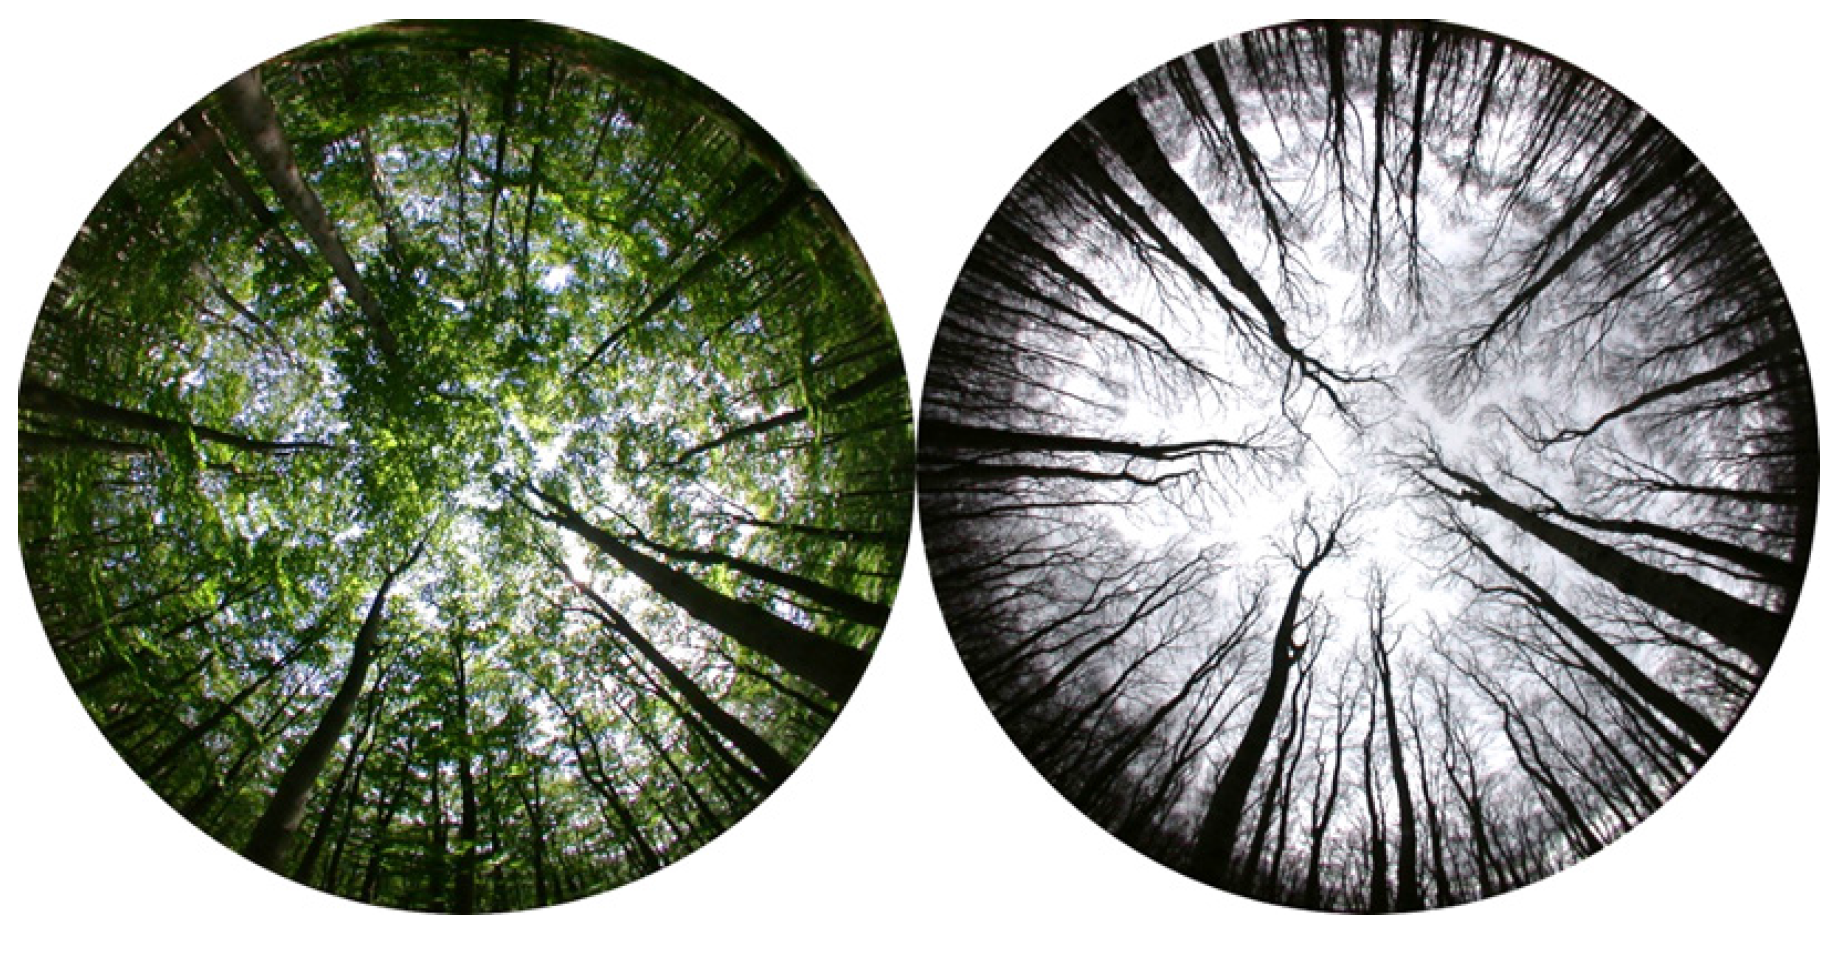
During the 2005–2014 period, the hemispherical photos, all taken from the same height and spot, supported ocular estimates; 25 photos were made every year (one per subplot) for each permanent plot over a systematic grid on every hectare plot. Color digital hemispherical photographs were taken during windless weather and standard overcast sky conditions 150 cm above the forest floor when the solar disk was completely obscured. The camera was levelled and the fish-eye lens oriented toward magnetic north prior to each shot. Photographs were taken with a digital Nikon Coolpix 995 of fine photo quality, calibrated fish-eye lens and analyzed with WinScanopy software (2003 pro-d).
Exposure fitting was done to above canopy conditions prior to shooting on every plot as indicated by Macfarlane et al. [20] and Zhang et al. [21] without noteworthy blooming effects [22]. In the process of hemispherical photograph analysis, the ‘‘standard overcast sky’’ (SOC) model was applied for diffuse light distribution. For the calculation within the vegetation period, the sun’s position was specified every 10 min. The solar constant was defined as 1.370 W/m2, 0.6 was set for atmospheric transmissivity and 0.15 for the proportion of diffuse radiation compared to the calculated direct potential radiation. An automatic thresholding method based on the same color scheme was applied for the discrimination between sky and canopy elements in all digital photographs, as thresholding of the photographs is crucial and may significantly affect the calculated parameters [23]. The analysis was carried out for 120-degree angle of hemisphere, as it proved to be the best explaining angle [24]. Several parameters from the photo analysis were used for further comparisons:
- Canopy openness—(percent open sky) share of open sky unobstructed by the vegetation compared to real canopy above lens,
- Indirect Site Factor (ISF%)—share of diffuse light below the canopy compared to the share of diffuse light in the open (above the canopy), and
- Leaf Area Index (Licor LAI 2000 generalized linear method corrected with clumping indexes of the sky grid’s zenith rings).
Results from the high growing season were corrected for the results obtained during the winter period to assess crown condition without area produced by trunks and branches [25] (Figure 2).
Crown conditions parameters obtained from the hemispherical photo analysis were compared with ocular estimates and tree mortality rate in regard to the total tree number of a hectare plot for every year and studied plot. Trees were considered dead if the crown transparency did not improve from the 100% assimilation area loss during the two consecutive observation years.
Data from surveys were compared with average monthly temperature and precipitation from the closest meteorological stations Kostanjevica ob Krki (plot A), Bizeljsko (plot B), Slovenske Konjice (plot C) and Murska Sobota (plot D) [26] and groundwater levels from the closest measurement stations [27].
Figure 2.
Hemispherical image of summer (left) and winter (right) stand conditions. Corrected area = area measured in summer-area measured in winter.
Figure 2.
Hemispherical image of summer (left) and winter (right) stand conditions. Corrected area = area measured in summer-area measured in winter.

2.3. Data Analysis
Parameters from the hemispherical photo analysis and ocular estimates were compared for the same 2005–2014 period. Regression coefficients were provided for every parameter and comparison. Data analysis and correlation between measured variables were analyzed with the Statistica data analysis software system (2011), obtaining the significance of differences (p) and the determination coefficient of the linear regression (r2).
3. Results
3.1. Temperature and Precipitation
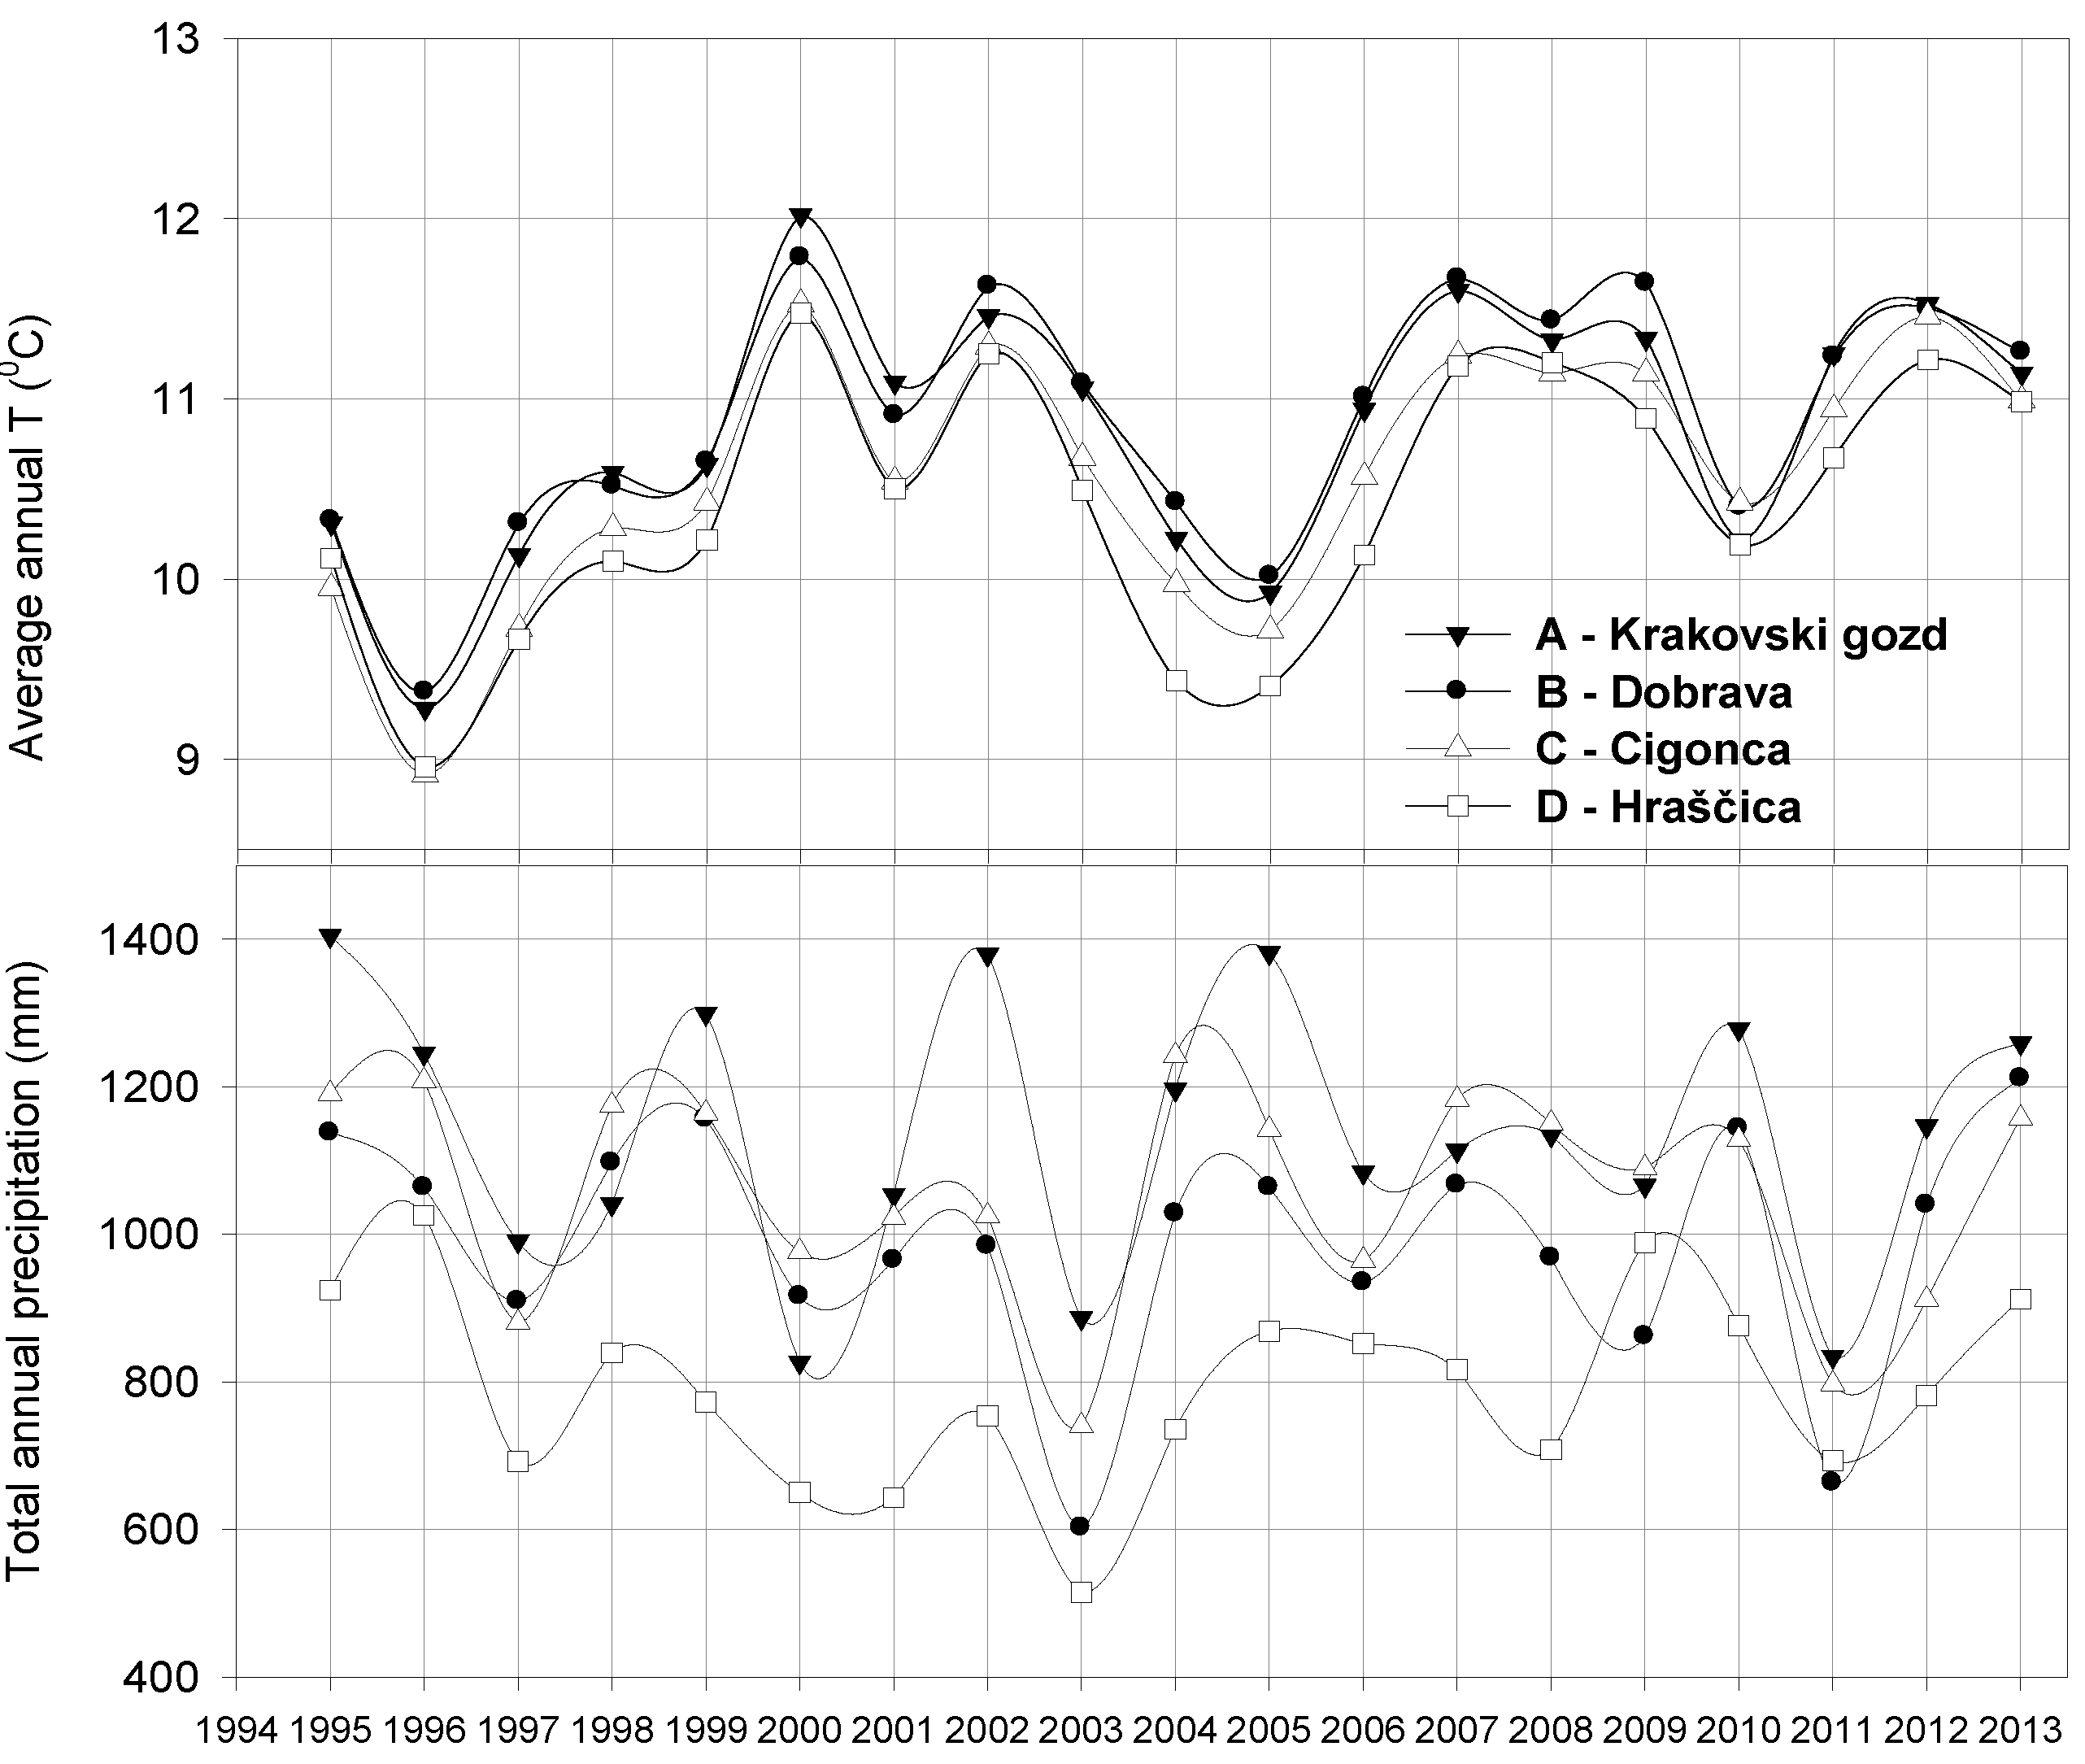
Amount of average annual precipitation varied among plots: most precipitation fell on plot A (1137 mm), followed by plot C (1061 mm), plot B (990 mm) and plot D (792 mm), while average air temperatures during the same period did not oscillate between plots (Figure 3).
Figure 3.
Average annual air temperature and total annual precipitation on research plots (1995–2013).
Figure 3.
Average annual air temperature and total annual precipitation on research plots (1995–2013).

3.2. Groundwater
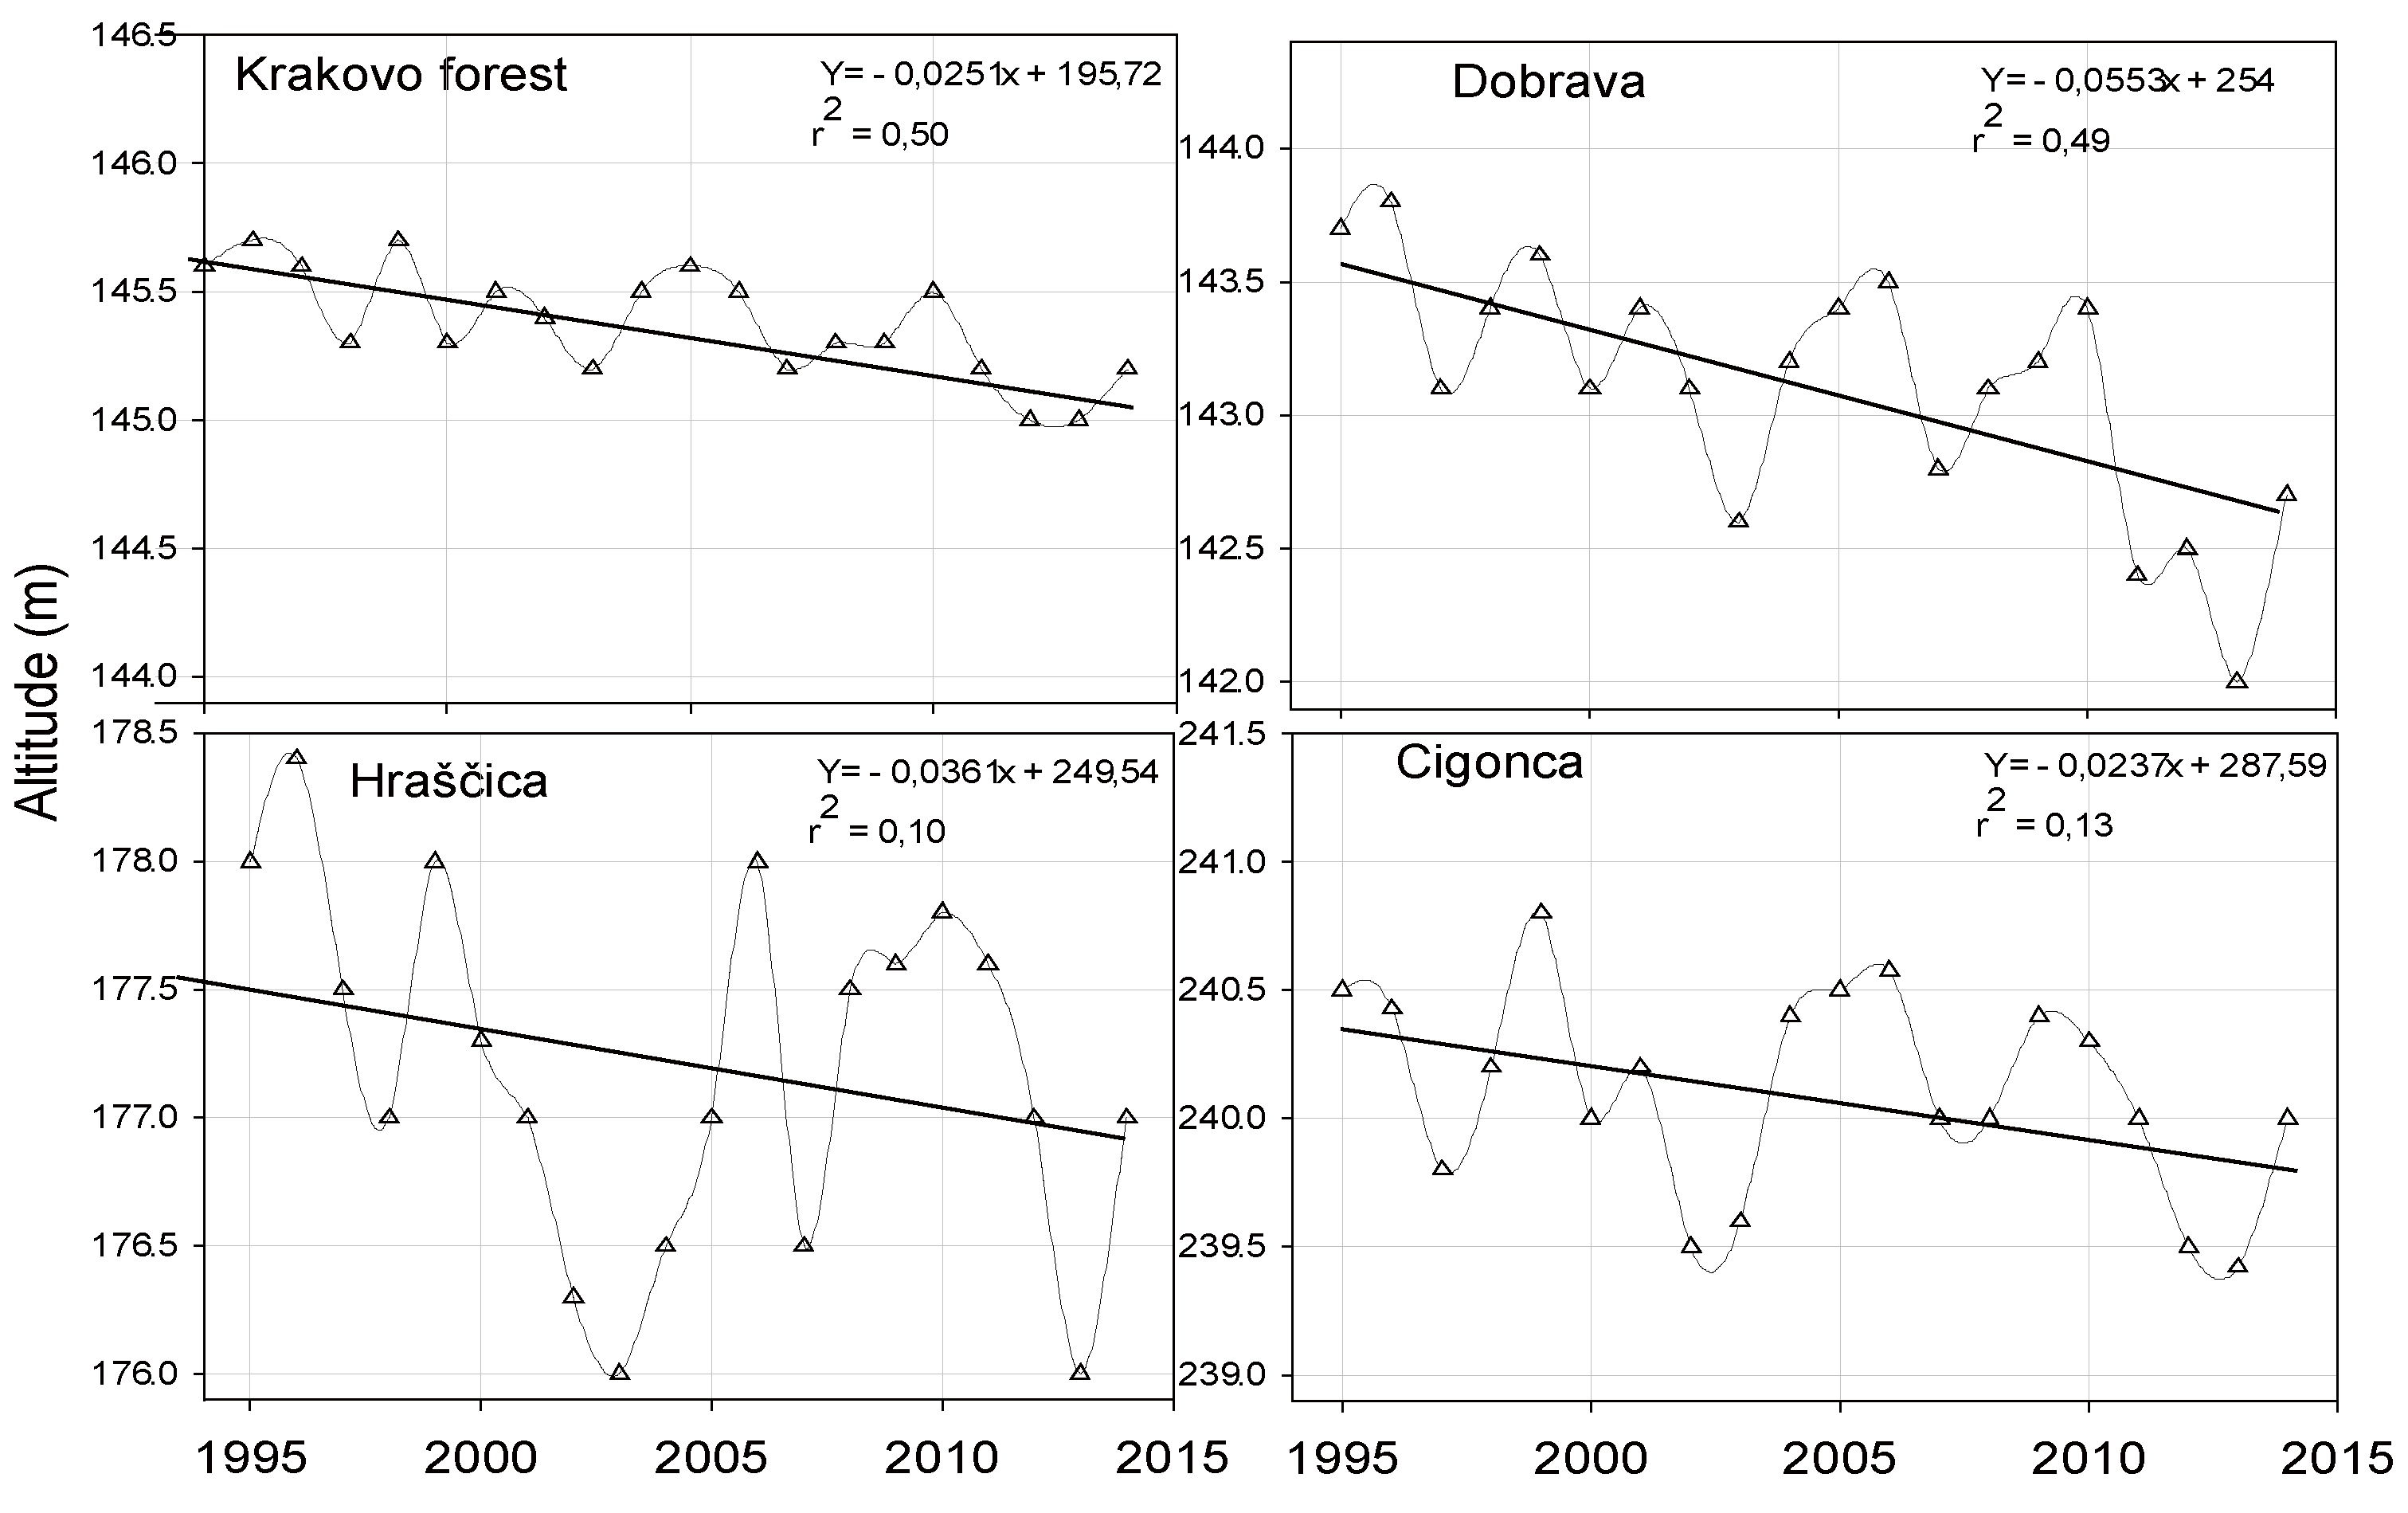
Annual average values for the groundwater table during the 20-year observation period from the closest hydrological stations [27] are presented on the same amplitude range (Y-axis, 2.5 m) to better illustrate the dynamics and the observed trend (Figure 4). At all measuring stations, significant decline of average values with pronounced amplitude variation could be evidenced.
Figure 4.
Dynamics of groundwater table for observed forest complex-the mean annual value for the closest measuring station is provided.
Figure 4.
Dynamics of groundwater table for observed forest complex-the mean annual value for the closest measuring station is provided.
3.3. Crown Defoliation vs. Hemispherical Photo Analysis
For the 2005–2014 period, comparisons between ocular assessment and hemispherical photo analysis parameters (total openness, ISF and LAI) were made for all plots. Correlation coefficients are presented for the regular and corrected data, where parameters obtained during the high growing season were corrected for the ones during the winter period (Table 2).
Table 2.
Correlation coefficients (r2) for the agreement between average ocular estimate and parameters from hemispherical analysis. Corrected values are bold, regular ones are shaded.
| Plot parameter | A (Krakovski gozd) | B (Dobrava) | C (Cigonca) | D (Hraščica) | Total | |||||
|---|---|---|---|---|---|---|---|---|---|---|
| Corrected | Regular | Corrected | Regular | Corrected | Regular | Corrected | Regular | Corrected | Regular | |
| Tot. openness | 0.84 | 0.79 | 0.85 | 0.65 | 0.80 | 0.64 | 0.81 | 0.72 | 0.78 | 0.67 |
| ISF (%) | 0.68 | 0.57 | 0.55 | 0.51 | 0.53 | 0.52 | 0.55 | 0.54 | 0.54 | 0.51 |
| LAI (lin) | 0.50 | 0.40 | 0.48 | 0.41 | 0.43 | 0.39 | 0.44 | 0.42 | 0.43 | 0.39 |
| LAI (log) | 0.47 | 0.34 | 0.49 | 0.35 | 0.40 | 0.38 | 0.39 | 0.41 | 0.38 | 0.34 |
Best agreement was achieved in all cases with total openness and ISF-relation between canopy and sky region above the measured point and share between indirect light at the point of measurement and above canopy, respectively, while LAI parameters indicated lower values, as they are derived-calculated and changed by the algorithm during the evaluation process.
3.4. Crown Defoliation
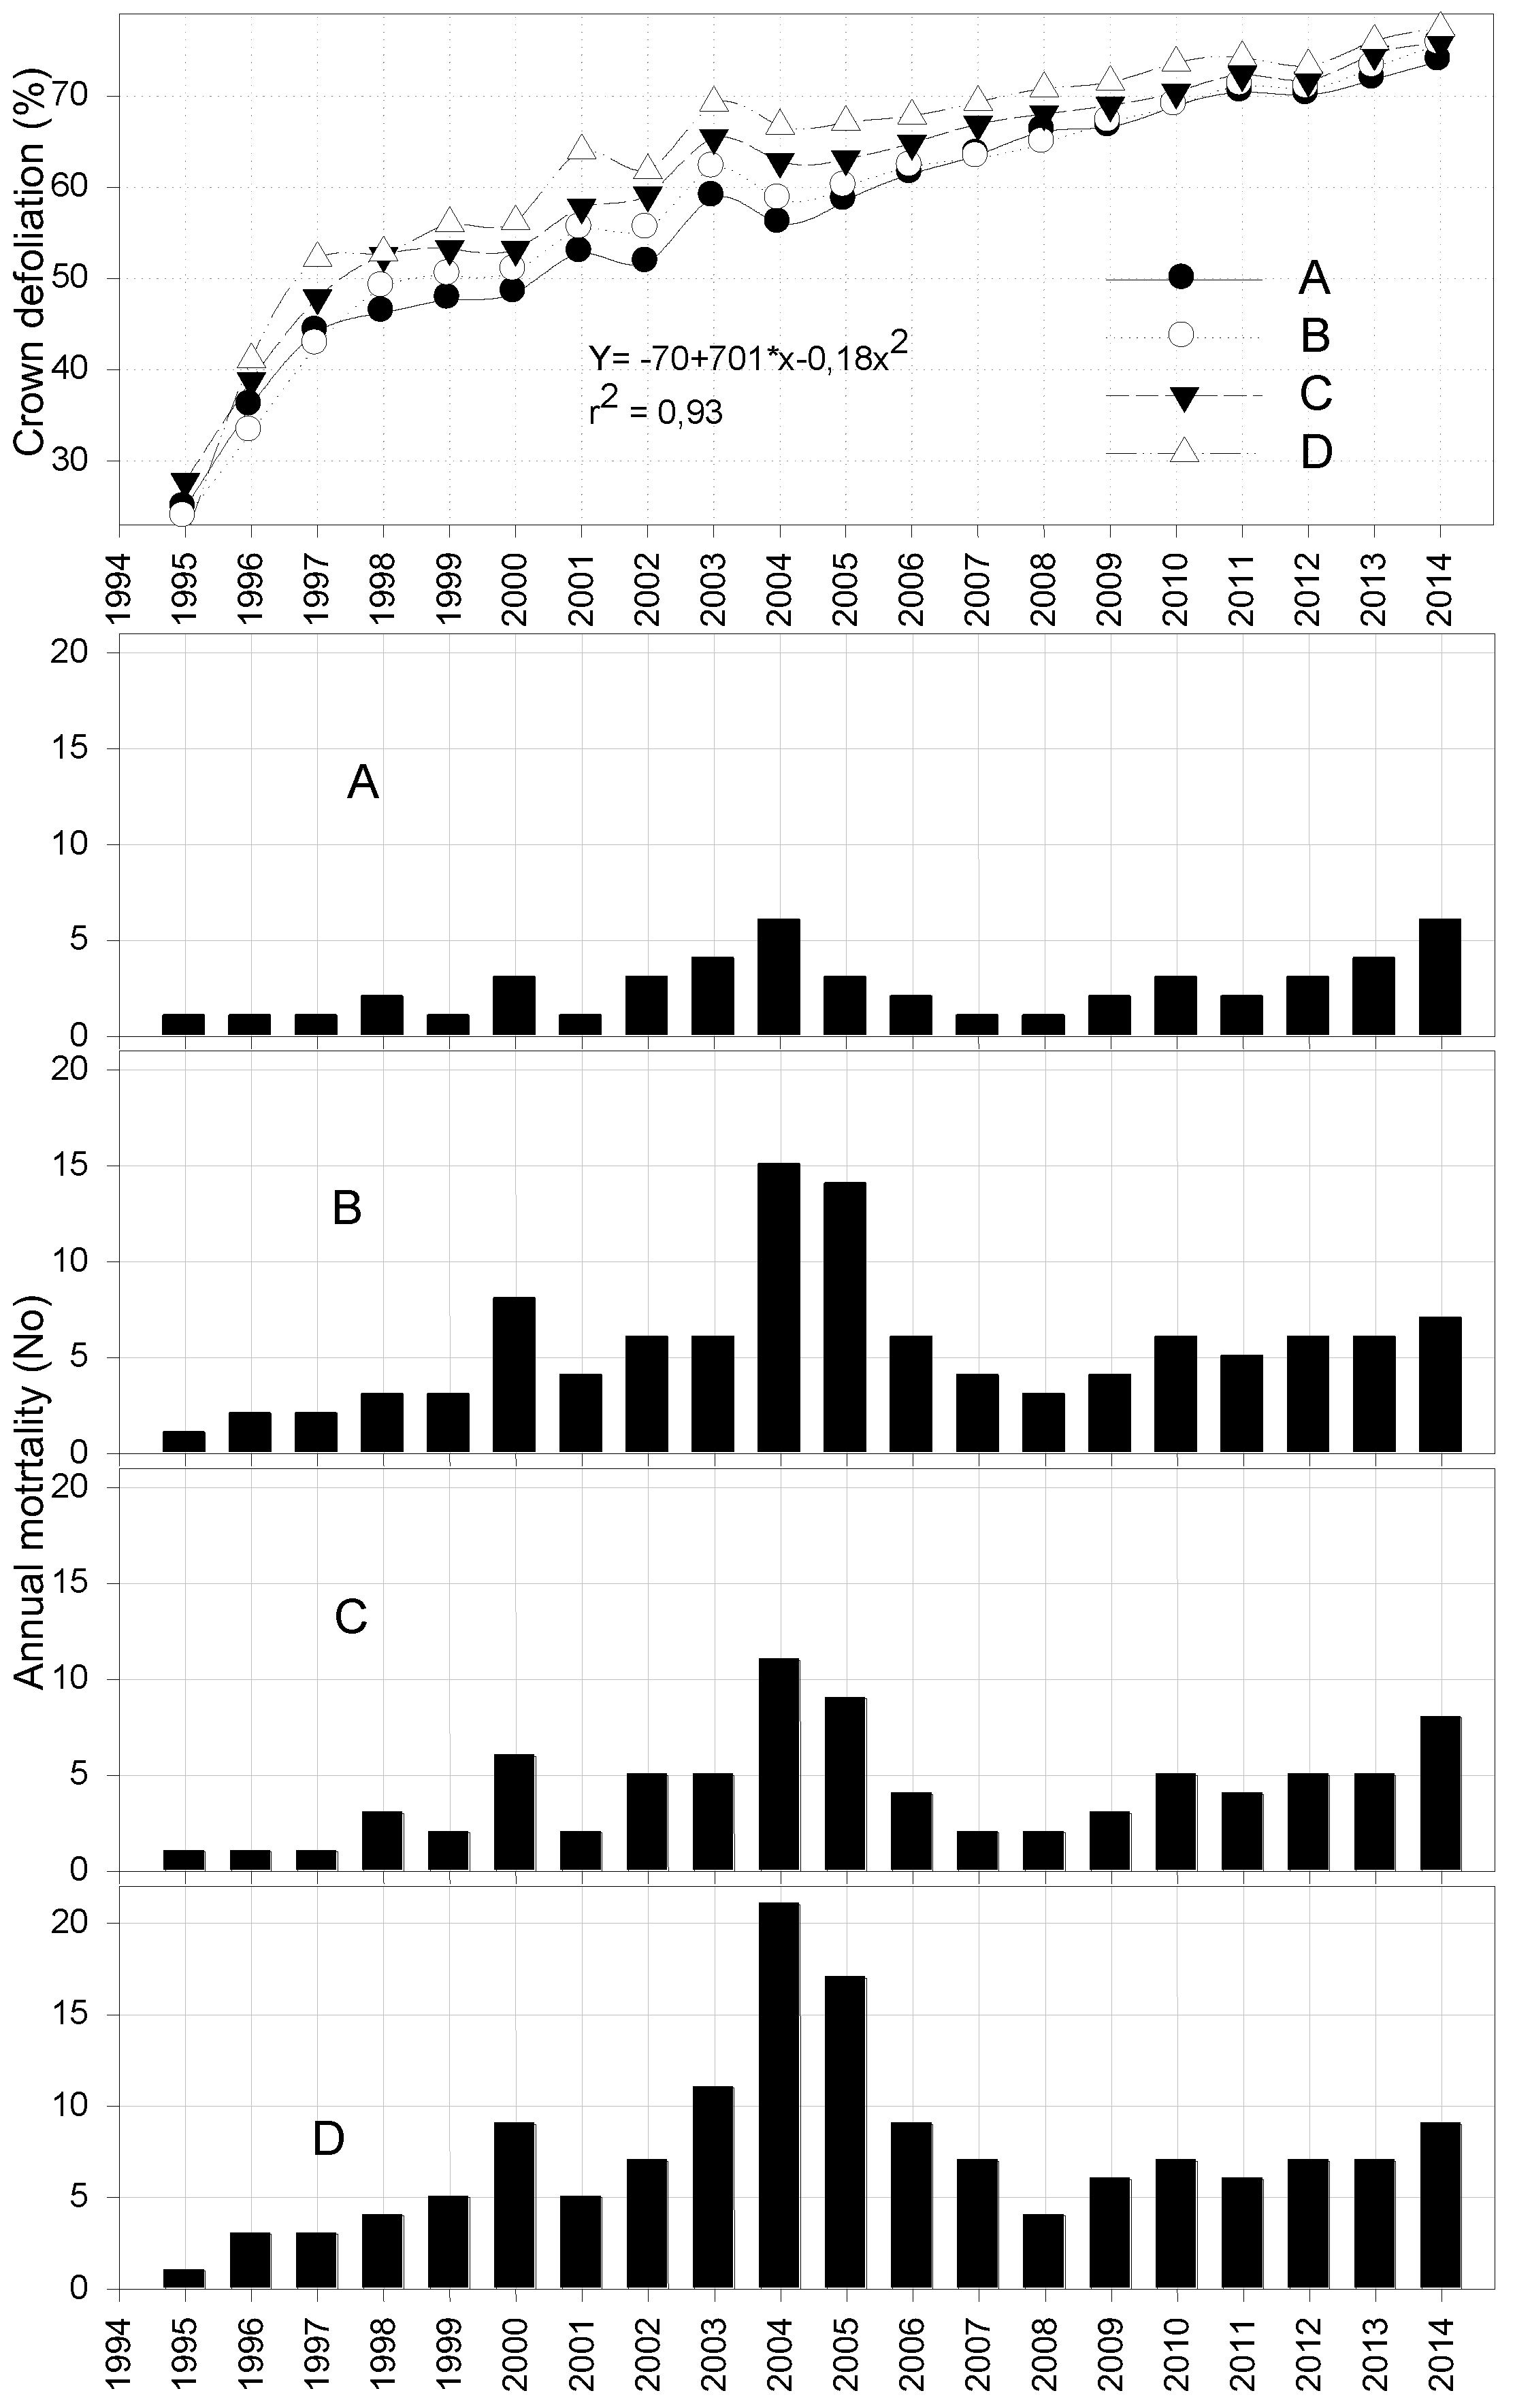
Ocular assessment showed increased crown defoliation since 1995, which coincided well with extreme weather events such as droughts in 2000 and 2003. With increasing defoliation, progressive decrease in dispersion after 2005 of individual values was also evidenced, indicating that oaks are gradually losing the individual response (Figure 5).
Figure 5.
The average crown defoliation on all pedunculate oak plots (1995–2014, n = 192 adult trees, 48 per plot) with standard deviation (above) and corresponding total annual mortality rate (No/ha, below), on every plot (A, B, C and D).
Figure 5.
The average crown defoliation on all pedunculate oak plots (1995–2014, n = 192 adult trees, 48 per plot) with standard deviation (above) and corresponding total annual mortality rate (No/ha, below), on every plot (A, B, C and D).

The steepest increase in crown defoliation was noted between 1995 and 1997. From 1998 to 2010, the conditions on all plots were comparable, with crown defoliation increasing towards 70%. The only recovery during the 19-year period was noted from 2001–2002 for less than 5%.
3.5. Mortality, Groundwater and Climate
Min-max range of groundwater table significantly correlated with mortality. Well evidenced are drops below the critical value in extreme droughts in 2003 and 2013. The total mortality rate corresponded well with defoliation (r2 = 0.71; p ≤ 0.000) on all plots (Figure 6). Highest agreement between defoliation and mortality was established on plots A-Krakovski gozd (R2 = 0.77), C-Cigonca (r2 = 0.74), D-Hraščica (r2 = 0.67) and lowest on plot B-Dobrava (r2 = 0.62).
During the observed period, 393 adult oaks died; highest mortality rate was noted for plots D-Hraščica (148), B-Dobrava (111) and C-Cigonca (84), and lowest for A-Krakovski gozd (50). Groundwater table correlated better with average annual air temperature than average annual precipitation and did not change significantly when compared to the May-August period or to individual months. Values for June as the most influential month are also presented (Table 3).
Figure 6.
Comparison between cumulative mortality and average groundwater (a); between annual mortality and annual crown defoliation (b) (1995–2014); between mortality and average annual air temperature (c) and between mortality and annual precipitation (d).
Figure 6.
Comparison between cumulative mortality and average groundwater (a); between annual mortality and annual crown defoliation (b) (1995–2014); between mortality and average annual air temperature (c) and between mortality and annual precipitation (d).

Table 3.
Correlation coefficients (r2) between groundwater vs. total precipitation and average air temperatures in different periods (1995–2013). Values higher than (r2 = 0.50) are marked in bold.
| Plot | Total annual precipitation (mm) | Average annual air temperature (°C) | Total precipitation (May–August) (mm) | Average air temperature (May–August) (°C) | Precipitation in June (mm) | Average air temperature in June (°C) |
|---|---|---|---|---|---|---|
| A (Krakovski gozd) | 0.29 | 0.62 | 0.29 | 0.46 | 0.31 | 0.07 |
| B (Dobrava) | 0.29 | 0.53 | 0.33 | 0.43 | 0.29 | 0.08 |
| C (Cigonca) | 0.23 | 0.23 | 0.21 | 0.43 | 0.27 | 0.21 |
| D (Hraščica) | 0.24 | 0.20 | 0.23 | 0.53 | 0.30 | 0.30 |
Comparison between temperature and precipitation vs. mortality rate highlighted only significant relation with temperatures (Table 4).
Table 4.
Correlation coefficients (r2) between mortality vs. total precipitation and average air temperatures in different periods (1995–2013). Values higher than r2 = 50 are marked in bold.
| Plot | Total annual precipitation (mm) | Average annual air temperature (°C) | Total precipitation (May–August) (mm) | Average air temperature (°C) |
|---|---|---|---|---|
| A (Krakovski gozd) | 0.05 | 0.31 | 0.07 | 0.31 |
| B (Dobrava) | 0.11 | 0.37 | 0.12 | 0.44 |
| C (Cigonca) | 0.25 | 0.50 | 0.25 | 0.51 |
| D (Hraščica) | 0.12 | 0.60 | 0.04 | 0.64 |
4. Discussion
Consequences of oak stand degradation, causing massive oak dieback in the eighties, could be seen today. Uneven distribution of precipitation, extreme temperatures and water pollution have disturbed the natural balance at the end of the 19th century [28,29]. Several theories have attempted to explain the oak decline as a combined effect of several factors [13] and some have indicated possible causes in parts of Europe [6,30,31,32].
The destabilized status has been worsened by unsuitable silvicultural and technical measures and changed environmental conditions. In depth studies concerning oaks have been performed to explain dysfunctions induced by water stress [8,9,10].
Favorable light conditions constitute basic environmental conditions for most of the life processes in terrestrial ecosystems. Tight connection exists between tree canopies, stand structure and available light below crown canopies [33], which results in different survival and adaptation strategies of plants to changed light conditions.
In our study, a significant agreement was confirmed between ocular crown assessment and parameters obtained from the hemispherical photo analysis during the 2005–2014 period: the best were between crown conditions and total openness, and there was smaller agreement with LAI. Agreement was better if parameters were corrected for winter values.
The highest mortality rate was observed on the easternmost plot with highest groundwater table oscillations and smallest amount of precipitation. Different response was also noted for plots from the southern part of the country (A-Krakovski gozd and B-Dobrava), showing similar correlation between groundwater and average annual air temperature (Table 3) from C-Cigonca and D-Hraščica between mortality and average annual air temperature (Table 4). Drop and oscillations in the groundwater were highest on plot D -Hraščica and lowest on plot A-Krakovski gozd. Increased defoliation, reduced radial growth [18] and reduced individual response indicate questionable perspective and weaker adaptation ability of adult oaks, as the defoliation variability becomes narrower through years (Figure 5). Similar conclusions are reported for Croatian lowland oak forests by Matić [34]. A drop in groundwater table during the last decade combined with weather extremes resulted in large-scale dieback of mature and senescent stands in 40% of all present pedunculate oak forests, causing changes in stand density and structure [35].
Some authors report lower mortality in trees with wider crowns and larger breast diameter [30,36]. Although a large leaf area should be an advantage in periods of sufficient water availability, it could also predispose trees to severe water stress when water availability declines, because of higher transpiration demand [37].
According to our former research, many ecological processes proved to be significantly connected with the groundwater table level and consequently with water availability in general. In connection with regeneration, the water stress was caused by decrease of groundwater table below critical threshold point in different light categories [12], while adult trees also managed to compensate short-term water stress during summer periods by increasing osmotic component in the sap [17]. Adaptation was better in stands with smaller tree density, where thinning has been performed recently, prior to water stress [17,25]. Oaks that have experienced worse growth and environmental conditions in the past (and found a way to adapt to it) have better stress and survival strategies than the ones with continuously favorable site conditions [17].
It is our belief that the amplitude and frequency of extreme events increases, and that already weakened trees are becoming more and more susceptible to negative effects of environmental stress. Physiologically weakened adult trees have no more available adaptation plasticity, so at first sight moderate drought increases its lethal effect.
5. Conclusions
Lowland oak forests are threatened mainly by the conversion of forests into agricultural land, where relatively small remaining forest patches are affected by the rapidly changing environmental factors. Increasing mortality rate is gradually induced by reduced water availability—the altered groundwater table since the late 1980s is accompanied by the precipitation redistribution that adult oak trees are no longer able to compensate and adapt; consequently, the individual response is lost. In the future, pedunculate oak trees may exhibit greater rates of mortality, particularly on sites of prior fast growth, if the predictions of increased drought severity and frequency are accurate.
Acknowledgement
The Public Forest Service (JGS) and the Program Research Group at the Slovenian Forestry Institute financially supported the research.
Conflicts of Interest
The authors declare no conflict of interest.
References
- Trinajstić, I. Taxonomic problems of pedunculate oak in Croatia. In Pedunculate Oak in Croatia (in Croatian); Croatian Academy of Sciences and Arts: Zagreb, Croatia, 1996; pp. 96–101. [Google Scholar]
- Krahl-Urban, J. Die Eichen. Forstliche Momographie der Traubeneiche und der Stieleiche; Verlag Paul Parey: Hamburg, Berlin, 1996; p. 288. [Google Scholar]
- Leibundgut, H. Unsere Waldbäume; Verlag Paul Haupt: Bern, Stuttgart, 1991; p. 172. [Google Scholar]
- Thomas, F.M.; Blank, R.; Hartmann, G. Abiotic and biotic factors and their interactions as causes of oak decline in Central Europe. For. Pathol. 2002, 32, 277–307. [Google Scholar] [CrossRef]
- Allen, C.D.; Macalady, A.K.; Chenchouni, H.; Bachelet, D.; McDowell, N.; Vennetier, M.; Kitzberger, T.; Rigling, A.; Breshears, D.D.; Hogg, E.H.; et al. A global overview of drought and heat-induced tree mortality reveals emerging climate change risks for forests. For. Ecol. Manag. 2010, 259, 660–684. [Google Scholar]
- Hämmerli, F.; Stadler, B. Eichenschäden, Eine Übersicht zur Situation in Europa und in der Schweiz. Forstwesen 1989, 104, 357–374. [Google Scholar]
- Levanič, T. Effects of hydromelioration on diameter growth and increment of black alder, ash and oak in Slovene Prekmurje. Res. Rep. For. Wood Technol. 1993, 42, 7–65. [Google Scholar]
- Cochard, H.; Breda, N.; Granier, A. Whole tree hydraulic conductance and water loss regulation in Quercus during drought: Evidence for stomatal control of embolism? Ann. Sci. For. 1996, 53, 197–206. [Google Scholar] [CrossRef]
- Triboulot, M.B.; Fauveau, M.L.; Breda, N.; Label, S.; Dreyer, E. Stomatal conductance and xylem-sap abscisic acid (ABA) in adult oak trees during a gradually imposed drought. Ann. Sci. For. 1996, 53, 207–220. [Google Scholar] [CrossRef]
- Tyree, M.T.; Cochard, H. Summer and winter embolism in oak: Impact on water relations. Ann. Sci. For. 1996, 53, 173–180. [Google Scholar] [CrossRef]
- Čater, M. Pedunculate oak (Quercus robur L.) crown defoliation-Changes on permanent research plots. Ekologia (Bratislava) 2003, 22, 430–443. [Google Scholar]
- Čater, M.; Batič, F. Groundwater and light conditions as factors in the survival of pedunculate oak (Quercus robur L.) seedlings. Eur. J. For. Res. 2006, 125, 419–426. [Google Scholar] [CrossRef]
- Führer, E. Der Zusammenhang zwischen der Dürre und der Erkrankung der Traubeneichenbestände in Ungarn. Forstw. Cbl. 1992, 111, 129–136. [Google Scholar] [CrossRef]
- Jung, T.; Blaschke, H.; Oßwald, W. Involvement of soilborne Phytophthora species in Central European oak decline and the effect of site factors on the disease. Plant Pathol. 2000, 49, 706–718. [Google Scholar] [CrossRef]
- Wraber, M. Gozdna vegetacijska slika in gozdnogojitveni problemi Prekmurja. Geografski Vestnik. 1951, 23, 1–22, (In Slovene language). [Google Scholar]
- Čater, M.; Simončič, P.; Batič, F. Pre-dawn water potential and nutritional status of pedunculate oak (Quercus robur L.) in the north-east of Slovenia. Phyton (Horn) 1999, 39, 13–22. [Google Scholar]
- Čater, M. Osmotic adaptation of Quercus robur L. under water stress in stands with different tree density-relation with groundwater table. Dendrobiology 2011, 65, 29–36. [Google Scholar]
- Levanič, T.; Čater, M.; McDowell, N.G. Associations between growth, wood anatomy, carbon isotope discrimination and mortality in a Quercus robur forest. Tree Physiol. 2011, 31, 298–308. [Google Scholar] [CrossRef] [PubMed]
- Solomon, S.; Qin, D.; Manning, M.; Chen, Z.; Marquis, M.; Averyt, K.B.; Tignor, M.; Miller, H.L. Climate Change: The Physical Science Basis. Contribution of Working Group I to the Fourth Assessment Report of the Intergovernmental Panel on Climate Change; Cambridge University Press: Cambridge, United Kingdom, New York, NY, USA, 2007; p. 996. [Google Scholar]
- Macfarlane, C.; Coote, M.; White, D.A.; Adams, M.A. Photographi exposure affects indirect estimation of leaf area in plantations of Eucalyptus globulus. Agric. For. Meteorol. 2000, 100, 155–168. [Google Scholar] [CrossRef]
- Zhang, Y.; Chen, J.M.; Miller, J.R. Determining digital hemispherica photograph exposure for leaf area index estimation. Agric. For. Meteorol. 2005, 133, 166–181. [Google Scholar] [CrossRef]
- Leblanc, S.G.; Chen, J.M.; Fernandes, R.; Deering, D.W.; Conley, A. Methodology comparison for canopy structure parameter extraction from digital hemispherical photography in boreal forests. Agric. For. Meteorol. 2005, 129, 187–207. [Google Scholar] [CrossRef]
- Ishida, M. Automatic thresholding for digital hemispherical photography. Can. J. For. Res. 2004, 34, 2208–2216. [Google Scholar] [CrossRef]
- Čater, M.; Schmid, I.; Kazda, M. Instantaneous and potential radiation effect on underplanted European beech below Norway spruce canopy. Eur. J. For. Res. 2011, 132, 23–32. [Google Scholar] [CrossRef]
- Čater, M. Comparison of light condition parameters on the research plots. Gozdarski vestnik. 2011, 69, 5–6, 289–293. [Google Scholar]
- Slovenian Environment Agency, Ministry of the Environment and Spatial Planning. Available online: http://meteo.arso.gov.si/met/en/ (accessed on 1 January 2015).
- Uhan, J. Količinsko stanje podzemnih voda v Sloveniji. Poročilo o monitoringu v letu 2012. Available online: http://www.arso.gov.si/vode/podzemne%20vode/publikacije%20in%20poro%C4%8Dila/Koli%C4%8Dinsko_stanje_podzemnih_voda_v_Sloveniji_Poro%C4%8Dilo_o_monitoringu_2012_31jul2014.pdf (accessed on 14 November 2014)(Monitoring report In Slovenian language).
- Manojlović, P. Sadašnje stanje hrastovih šuma u Slavoniji. In Pola Stolječa Šumarstva 1876–1926; Hrvatski štamparski zavod d.d.: Zagreb, Croatia, 1926; pp. 372–385. [Google Scholar]
- Donaubauer, E. Recent Oak Decline and Possible Pathogens. In IUFRO-95 Papers and Abstracts, IUFRO XX World Congress, Tampere, Finland, 6–12 August 1995.
- Harapin, M.; Androić, M. Sušenje i zaštita šuma hrasta lužnjaka. In Hrast Lužnjak (Quercus robur L.) u Hrvatskoj; Klepac, D., Ed.; Hrvatska akademija znanosti i umjetnosti: Zagreb, Croatia, 1996; p. 559. [Google Scholar]
- Hartmann, G.; Blank, R.; Lewark, S. Eichensterben in Norddeutschland, Verbreitung, Schadbilder, mögliche Ursachen. (Oak decline in Northern Germany. Distribution, symptoms, probable causes). Forst und Holz. 1989, 44, 475–487. [Google Scholar]
- Näveke, S.; Meyer, F.H. Feinwurzelsysteme unterschiedlich geschädigter Eichen im Lappwald. AFZ. 1990, 45, 382–384. [Google Scholar]
- Comeau, P.G.; Heineman, J.L. Predicting understory light microclimate from stand parameters in young paper birch (Betula papyrifera Marsh.) stands. For. Ecol. Manag. 2003, 180, 303–315. [Google Scholar] [CrossRef]
- Matić, S. Managing forests of pedunculate oak (Quercus robur L.) in changed site conditions. In Forests of Pedunculate Oak in Changed Site and Management Conditions; Croatian Academy of Sciences and Arts: Zagreb, Croatia, 2009; pp. 1–22. [Google Scholar]
- Čavlović, J.; Božić, M.; Teslak, K. Rotation and density in planning the management of Pedunculate oak forests under conditions of a disturbed stand structure. In Forests of Pedunculate Oak in Changed Site and Management Conditions Zagreb; Croatian Academy of Sciences and Arts: Zagreb, Croatia, 2009; pp. 23–37. [Google Scholar]
- Marcu, G. Ursachen des Eichensterbens in Rumänien und Gegenmaßnahmen. Österreichische Forstzeitung. 1987, 3, 53–54. [Google Scholar]
- McDowell, N.G.; Adams, H.D.; Bailey, J.D.; Hess, M.; Kolb, T. Homeostatic maintenance of Ponderosa pine gas exchange in response to stand density changes. Ecol. Appl. 2006, 16, 1164–1182. [Google Scholar] [CrossRef] [PubMed]
© 2015 by the authors; licensee MDPI, Basel, Switzerland. This article is an open access article distributed under the terms and conditions of the Creative Commons Attribution license (http://creativecommons.org/licenses/by/4.0/).
Share and Cite
MDPI and ACS Style
Čater, M. A 20-Year Overview of Quercus robur L. Mortality and Crown Conditions in Slovenia. Forests 2015, 6, 581-593. https://doi.org/10.3390/f6030581
AMA Style
Čater M. A 20-Year Overview of Quercus robur L. Mortality and Crown Conditions in Slovenia. Forests. 2015; 6(3):581-593. https://doi.org/10.3390/f6030581
Chicago/Turabian StyleČater, Matjaž. 2015. "A 20-Year Overview of Quercus robur L. Mortality and Crown Conditions in Slovenia" Forests 6, no. 3: 581-593. https://doi.org/10.3390/f6030581