Studies evaluating forest ecosystems are difficult to undertake due to the fact that the ideal scenario should consist of stands of even-age, mixed and single species grown under the same biogeoclimatic conditions (e.g., soil conditions, nutrients, climatic patterns, water regime,
etc.). Moreover, such sites would need to include the appropriate variables that warrant investigation, for example forest type and species makeup. Alternatively, surrogate sites can be used, and often existing stands with common variables, which offers a means to compare pure stands of species with their mixtures [
5,
16]. In this project, we used the PSP for such an investigation; although not ideal, they are naturally regenerated stands in the boreal forest that are reserve sites and not available for forestry activities.
3.1. Wood Density
Wood density is the single most important physical property influencing wood quality. It is an excellent predictor of strength, stiffness and hardness, and can be related to pulp quantity and quality [
17,
18,
19,
20]. Aubry
et al. [
18] identified wood density as a major contributor to the whole tree dollar value along with branch angle and volume. Wood density results from three interacting components: earlywood density, latewood density and the proportion of latewood [
20,
21]. Earlywood is produced early in the growing season until shoot elongation terminates, then latewood is deposited until cambial activity ceases in late summer [
20].
Figure 1 shows the mean density for the aspen trees grown on the pure and mixed sites, as well as the densities of each social class. The aspen wood density ranged from 338 kg·m
−3 to 581 kg·m
−3 with a mean value of 457 kg·m
−3 for all trees. These findings are consistent with previously published values for aspen [
22,
23,
24,
25].
Figure 1.
Mean wood density (kg·m−3) for trembling aspen trees originating from an aspen site (PSP 430) and mixed site (PSP 434) by site and social classes. Error bars indicate standard deviation. Asterisk indicate significant differences (α = 5%). n = 100 on the aspen site, while n = 50 on the mixed site.
There were no significant differences in wood density when comparing sites. This observation implies that the presence of white spruce in the mixed stand had little effect on the overall wood density of trembling aspen. However, this is not the case when comparing trees by social class between sites. The dominant trees originating from the aspen site had a significantly higher mean density than those from the mixed site (463 kg·m−3 vs. 438 kg·m−3, respectively). This suggests that the younger and smaller dominant trees from the aspen site have a higher density than the older, more mature trees from the mixed site. One possible explanation for this observation is that the dominant trees originating from the aspen site have only the co-dominant aspen trees with which to compete, and as such have more resources available to them, leading to a higher wood density. In contrast, on the mixed site, the dominant aspen trees have to compete not only with the co-dominant aspen for resources, but also the spruce that now occupies a portion of the available growing space. This limits the available resources to the dominant aspen trees, including light and nutrients, and ultimately leads to a lower wood density. Since the co-dominant trees from the aspen site are already suppressed by the dominant aspen, the presence of spruce in the mixed site has little effect on resource availability, and thus does not impact the wood trait in these trees.
Similarly,
Figure 2 shows the mean density values for white spruce trees originating from both the spruce and the mixed site, as well as the spruce density values for each site as a function of social class.
Figure 2.
Mean wood density (kg·m−3) for white spruce trees originating from a spruce site (PSP 379) and mixed site (PSP 434) by site and social classes. Error bars indicate standard deviation. Asterisk indicate significant differences (α = 5%). n = 100 on the spruce site, while n = 50 on the mixed site.
The density of the white spruce samples varied from 326 kg·m
−3 to 519 kg·m
−3, with a mean density of 412 kg·m
−3. These results are in accordance with previously published values for white spruce [
26,
27,
28]. When comparing sites, there were no significant differences between trees originating from the spruce site and the mixed site. Despite being statistically similar, trees from the mixed site had an overall lower mean density than trees from the spruce site (384 kg·m
−3 vs. 427 kg·m
−3, respectively). As previously discussed, the trees from the pure spruce site are older than those from the mixed site, and this difference likely explains the observed difference. The mature wood in the older trees represents a larger percentage of the total wood. In addition, the smaller growth rings of the older spruce site trees lead to a smaller earlywood to latewood ratio, which could also contribute to the overall increased wood density.
Although the comparison of trees originating from the spruce and mixed sites showed no difference in wood density, statistical variation is apparent when comparing social classes. Trees from both the dominant and co-dominant class showed higher mean wood density in trees originating from the spruce site. This again follows the general trend that white spruce trees from the pure spruce site have a higher wood density than those from the mixed site, regardless of social class. When comparing different social classes from the same site, trees from the co-dominant class have a higher mean density than those from the dominant class in both sites. This comparison suggests that the presence of aspen in the mixed site had no significant apparent effect on the differences in wood density between social classes.
Given the importance of wood density [
22,
29,
30], it is understandable that any difference in wood density between the single species and mixed species site would be of industrial importance. Unfortunately, when comparing sites, there were no significant differences between the single species and mixed species sites for both trembling aspen and white spruce. This observation suggests that the presence or absence of one species has little effect on the overall wood density of the other species. If, however, data is available which permits the segregation into social classes, then predictions of wood density can be made, in particular for white spruce where significant differences occurred between sites for both dominant and co-dominant classes. Therefore, when forest managers make decisions on factors, such as which site to harvest, the best time for harvesting, or the final use of the timber from each type of site, wood density should not be a factor taken into consideration if the trees have not first been sub-divided into social classes.
3.2. Microfibril Angle (MFA)
Microfibril angle is the dominant angle of cellulose microfibrils, primarily in the S
2 layer of the cell wall, measured against the long axis of fibre cells. It is an important determinant of wood strength and elasticity [
31]. Microfibril angle has been shown to explain a large portion of the variation of longitudinal modulus of elasticity (E
L) in loblolly pine and
Eucalyptus delegatensis R.T. Baker (Evans and Ilic 2001) [
32,
33]. Cramer
et al. [
32] reported that up to 75% of the variation in E
L could be explained by microfibril angle and specific gravity when earlywood and latewood data are combined, while Evans and Ilic [
33] report an
R2 of 0.956 relating E
L to the ratio of microfibril angle and density. There has been an increase in the recognition of the importance of incorporating wood quality traits in tree improvement programs, however, until recently, microfibril angle has been largely ignored, probably due to the inherent challenges in measuring this trait [
31]. There is little doubt that microfibril angle is an important contributor to wood strength, yet the genetic control and relationship with other traits are largely unexplored. Within individual tracheids, microfibril angle changes little from tip to tip, however, the trend is for decreasing angles from the first earlywood cell to the final latewood cell within a growth ring [
34,
35]. Microfibril angle decreases from pith to bark and with increasing tree height, and there is a strong relationship with the number of rings from the pith [
36,
37]. It is widely accepted that microfibril angle is related to fibre length (Barnett and Bonham 2004) with an
R2 of 88.4% for Douglas-fir [
36] and significant negative correlations reported by Ivkovich
et al. [
38] and Hannrup
et al. [
39] in spruce.
For the trembling aspen samples, measurements were taken every centimeter starting at the pith in order to better understand changes in MFA as a function of cambial age. As expected, a higher MFA was apparent near the pith, which decreased with age, and then eventually stabilized (
Table 1).
Table 1.
Mean microfibril angle (degrees) at given distances from pith for trembling aspen trees originating from the aspen site (PSP 430) and the mixed site (PSP 434). n = 100 for the aspen site, while n = 50 for the mixed site.
Table 1.
Mean microfibril angle (degrees) at given distances from pith for trembling aspen trees originating from the aspen site (PSP 430) and the mixed site (PSP 434). n = 100 for the aspen site, while n = 50 for the mixed site.
| Distance (cm) | Aspen Site | Mixed Site |
|---|
| 0 | 28.59 | 29.46 |
| 1 | 23.84 | 26.28 |
| 2 | 20.50 | 23.25 |
| 3 | 18.47 | 21.30 |
| 4 | 17.90 | 20.27 |
| 5 | 17.79 | 19.83 |
| 6 | 17.53 | 19.45 |
| 7 | 17.64 | 19.23 |
| 8 | 17.76 | 19.30 |
| 9 | 17.45 | 19.60 |
| 10 | - | 19.55 |
| 11 | - | 18.71 |
| 12 | - | 18.74 |
| 13 | - | 17.49 |
This plateau occurred much earlier for the trees originating from the pure aspen site (4 cm distance from pith) than for those in the mixed site, which appeared to be still declining. Due to the inherent differences in tree diameter, the trees from the mixed site generated more values than the smaller trees from the pure aspen site. However, since the MFA tended to stabilize once a region of mature wood was deposited, it is feasible to compare the differences between sites for the first 10 cm from the pith. Using this approach, it was clear that the trees from the mixed site had a higher MFA than the trees from the pure aspen site at any given distance from the pith. The mean MFA for the trees originating from the mixed site at the first point of measurement (near the pith) was less than one degree higher than that of trees from the aspen site (29.49° vs. 28.59°). As the distance from the pith increased, so did the difference between MFA from the mixed and aspen sites, reaching a maximum difference of 2.83° at 3 cm from the pith. To better illustrate the differences in MFA between sites, both the mean MFA for the entire tree as well as the MFA estimate of each tree’s final growth year were analyzed using a t-student test, revealing significant differences (α = 5%) between sites; the mixed site exhibiting higher values for both mean MFA and final MFA (19.75° vs. 20.89°, and 18.01° vs. 18.94°, respectively). Clearly, the mixed site has a propensity to deposit wood cells that characteristically displayed higher MFA values than the trees originating from the pure aspen site.
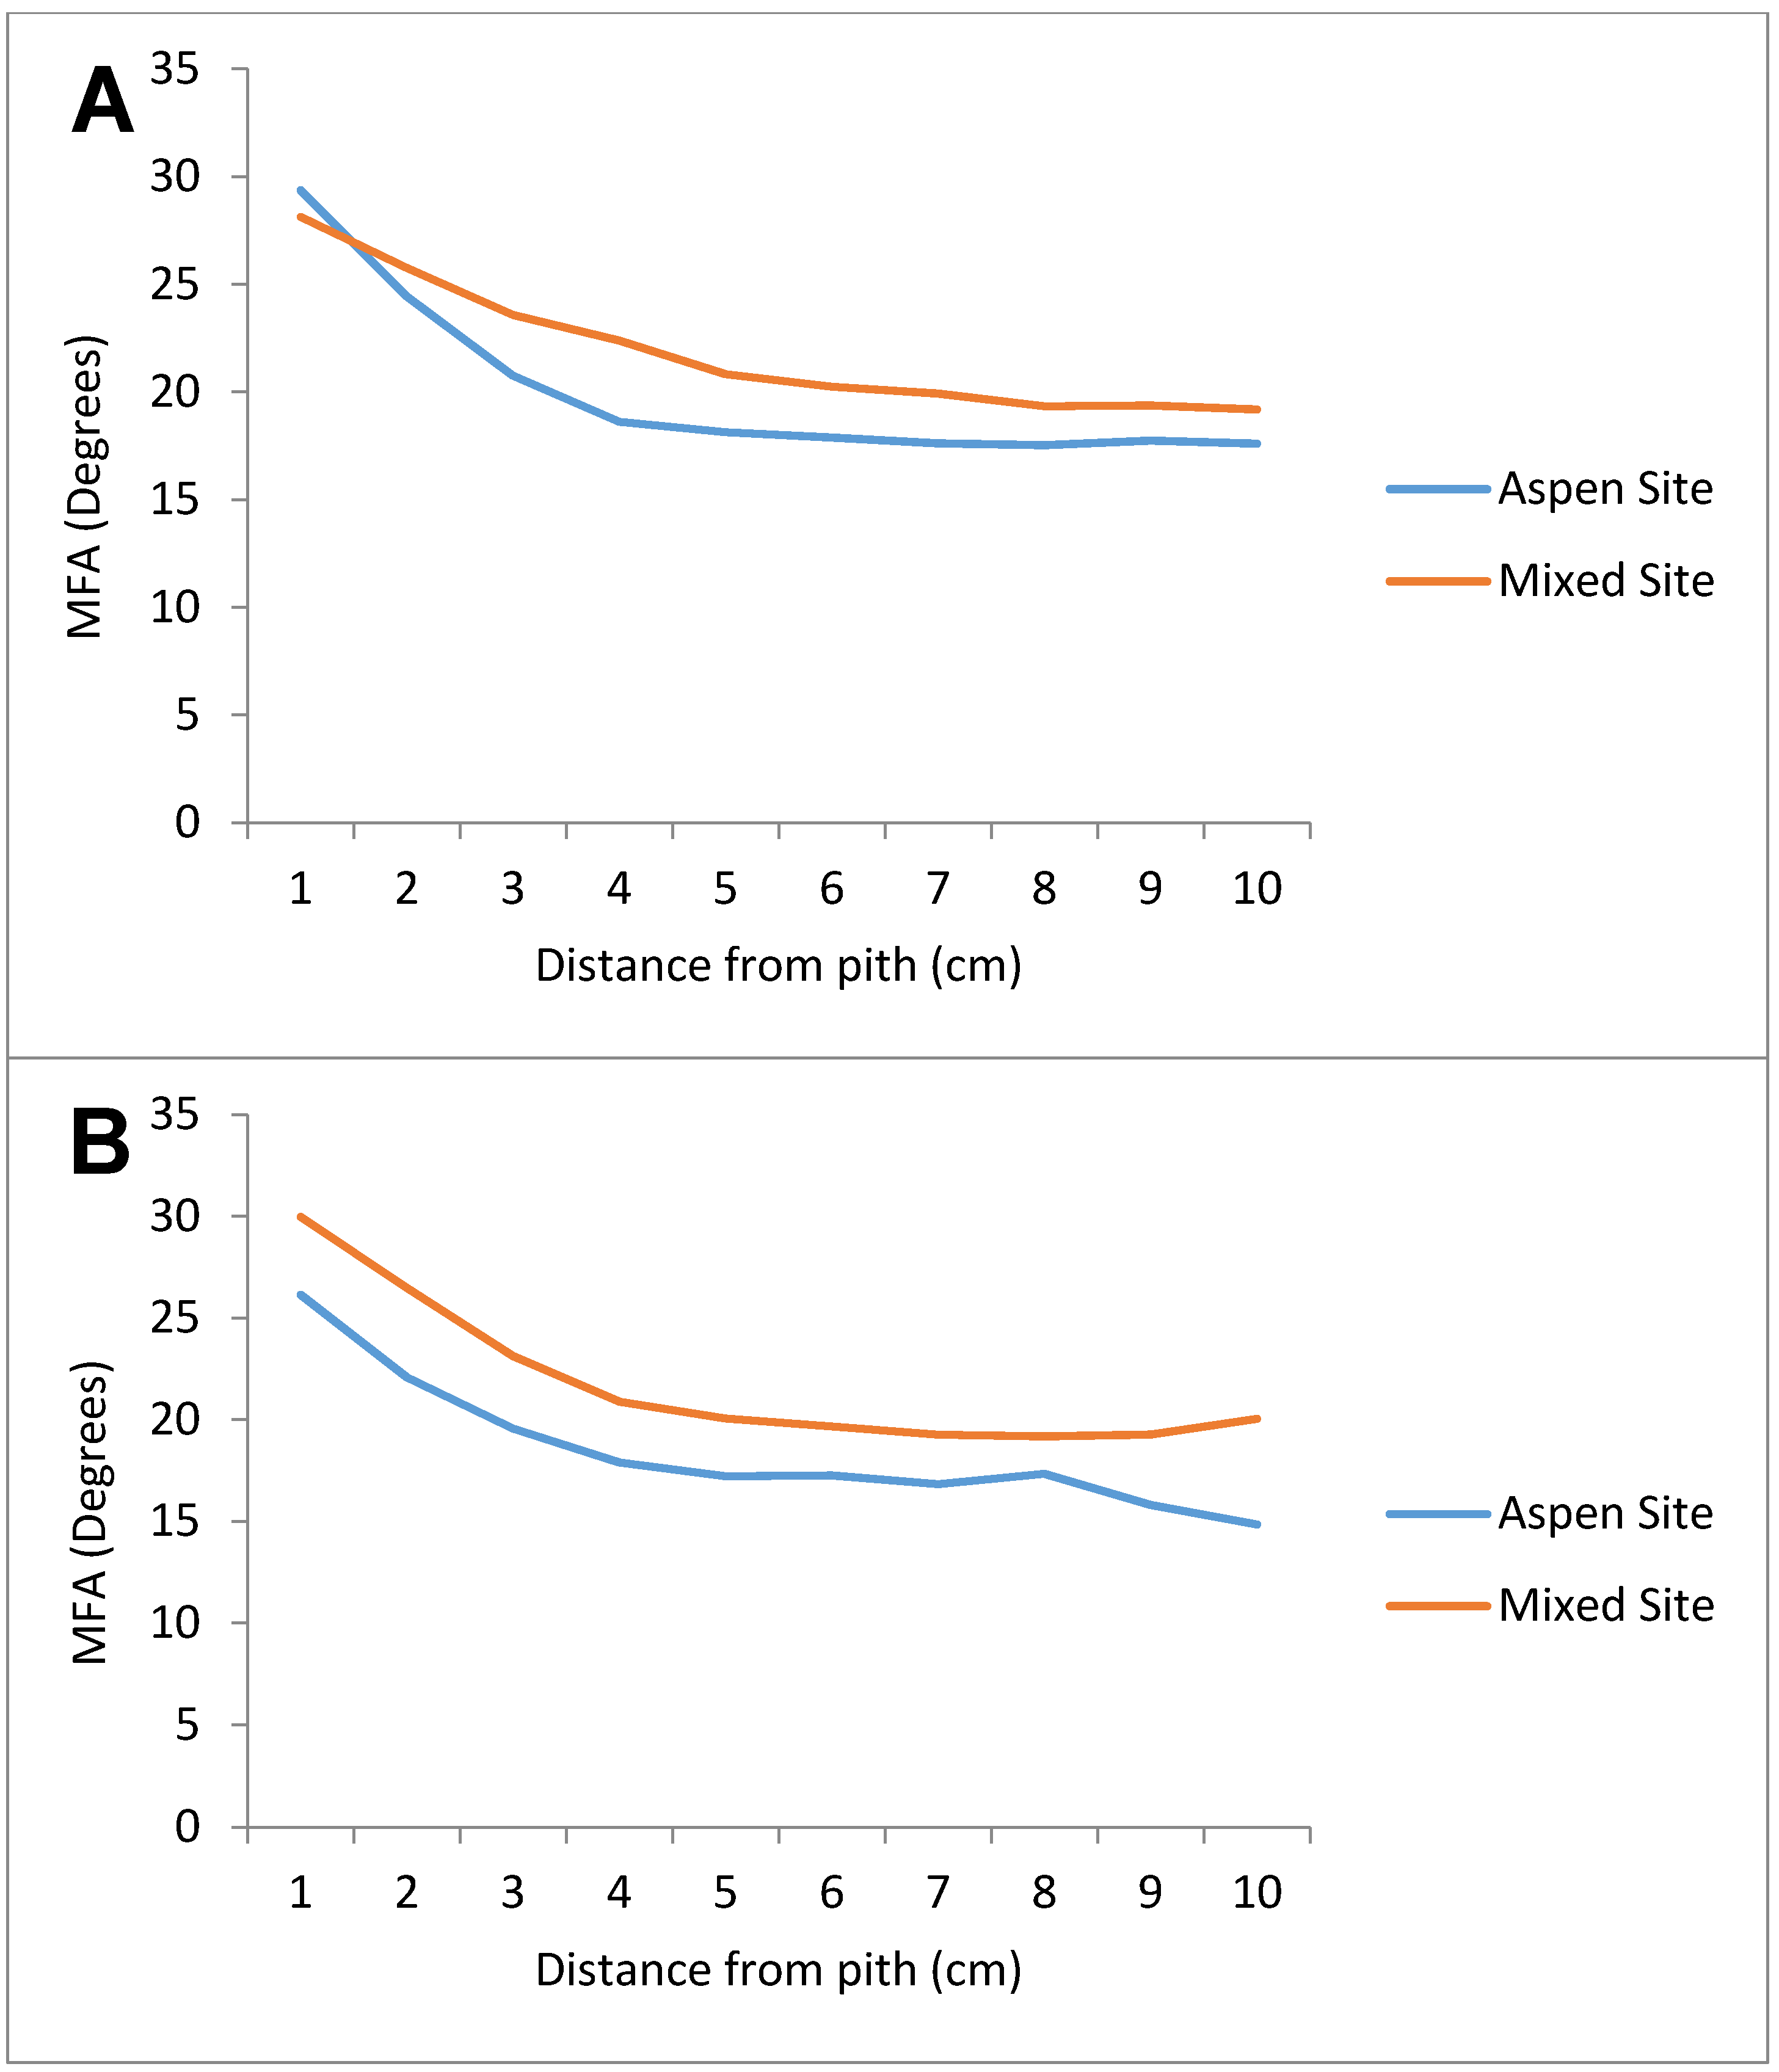
Separating the trees into dominant and co-dominant classes and comparing classes across sites produced similar results (
Figure 3). The mixed site had higher MFA values than the pure aspen site in both classes, with the only change occurring with the dominant aspen, where the aspen site showed a higher value for the angle measured near the pith. From that point on, the mixed site demonstrated a higher MFA at any distance from the pith. Again, when comparing mean MFA values and the final MFA values by class between the sites, the trees from the mixed site showed significantly higher MFA (α = 5%). This suggests that adopting social class categorization may not be efficient when the microfibril angle is being considered, since the results are similar to those obtained by site comparisons.
Figure 3.
Mean microfibril angle (degrees) at given distances from pith for all dominant (A) and co-dominant (B) trembling aspen trees in aspen site (PSP 430) and mixed site (PSP 434). n = 100 for the aspen site, while n = 50 for the mixed site.
Figure 3.
Mean microfibril angle (degrees) at given distances from pith for all dominant (A) and co-dominant (B) trembling aspen trees in aspen site (PSP 430) and mixed site (PSP 434). n = 100 for the aspen site, while n = 50 for the mixed site.
In contrast, since growth rings were easily discernible in the spruce samples, measurements of MFA were taken every five years of growth, starting from the pith. Generally, trees from both sites had similar MFAs in first ten years of growth (
Table 2). As the trees aged, trees from the mixed site (PSP 434) showed a more rapid decline and consequently lower overall MFA estimated than those from the pure spruce site at similar ages. Trees originating from the mixed site also reach a plateau at a younger age than those from the spruce site. Unlike the trembling aspen, the MFA estimated for the white spruce trees showed very little differences between sites. When comparing the first 50 years of growth of trees originating from the pure spruce and the mixed site, there were no significant differences between them. Although the spruce site had a slightly smaller initial MFA, the first 20 years showed practically no differences. Thereafter, the MFA of the mixed site drops below that of the spruce site, reaching a maximum difference of 3.80° at age 25. After which, the difference between sites once again decreased, remaining at less than a degree different until age 50. When the mean MFA for the entire tree and the final MFA value for each tree were compared in an attempt to identify potential differences between sites, there were no significant differences between sites (α = 5%). The pure spruce site showed a slightly higher estimate for both mean tree MFA and final MFA (22.52°
vs. 20.96° and 17.54°
vs. 17.38°, respectively).
Table 2.
Mean microfibril angle (degrees) at given ages for white spruce trees originating from the spruce site (PSP 379) and the mixed site (PSP 434). n = 100 for the spruce site, while n = 50 for the mixed site.
Table 2.
Mean microfibril angle (degrees) at given ages for white spruce trees originating from the spruce site (PSP 379) and the mixed site (PSP 434). n = 100 for the spruce site, while n = 50 for the mixed site.
| Age (Years) | Spruce Site | Mixed Site |
|---|
| 1 | 32.17 | 32.28 |
| 5 | 29.78 | 29.69 |
| 10 | 25.45 | 24.30 |
| 15 | 22.06 | 21.86 |
| 20 | 21.54 | 18.45 |
| 25 | 20.54 | 16.74 |
| 30 | 18.90 | 17.35 |
| 35 | 18.03 | 17.13 |
| 40 | 18.87 | 16.85 |
| 45 | 17.06 | 17.55 |
| 50 | 17.01 | 16.22 |
| 55 | 16.45 | - |
| 60 | 16.31 | - |
| 65 | 16.68 | - |
| 70 | 16.72 | - |
| 75 | 16.06 | - |
| 80 | 16.30 | - |
| 85 | 16.47 | - |
| 90 | 16.58 | - |
| 95 | 17.03 | - |
| 100 | 17.09 | - |
| 105 | 17.94 | - |
| 110 | 18.35 | - |
| 115 | 17.99 | - |
| 120 | 16.53 | - |
| 125 | 17.17 | - |
| 130 | 17.42 | - |
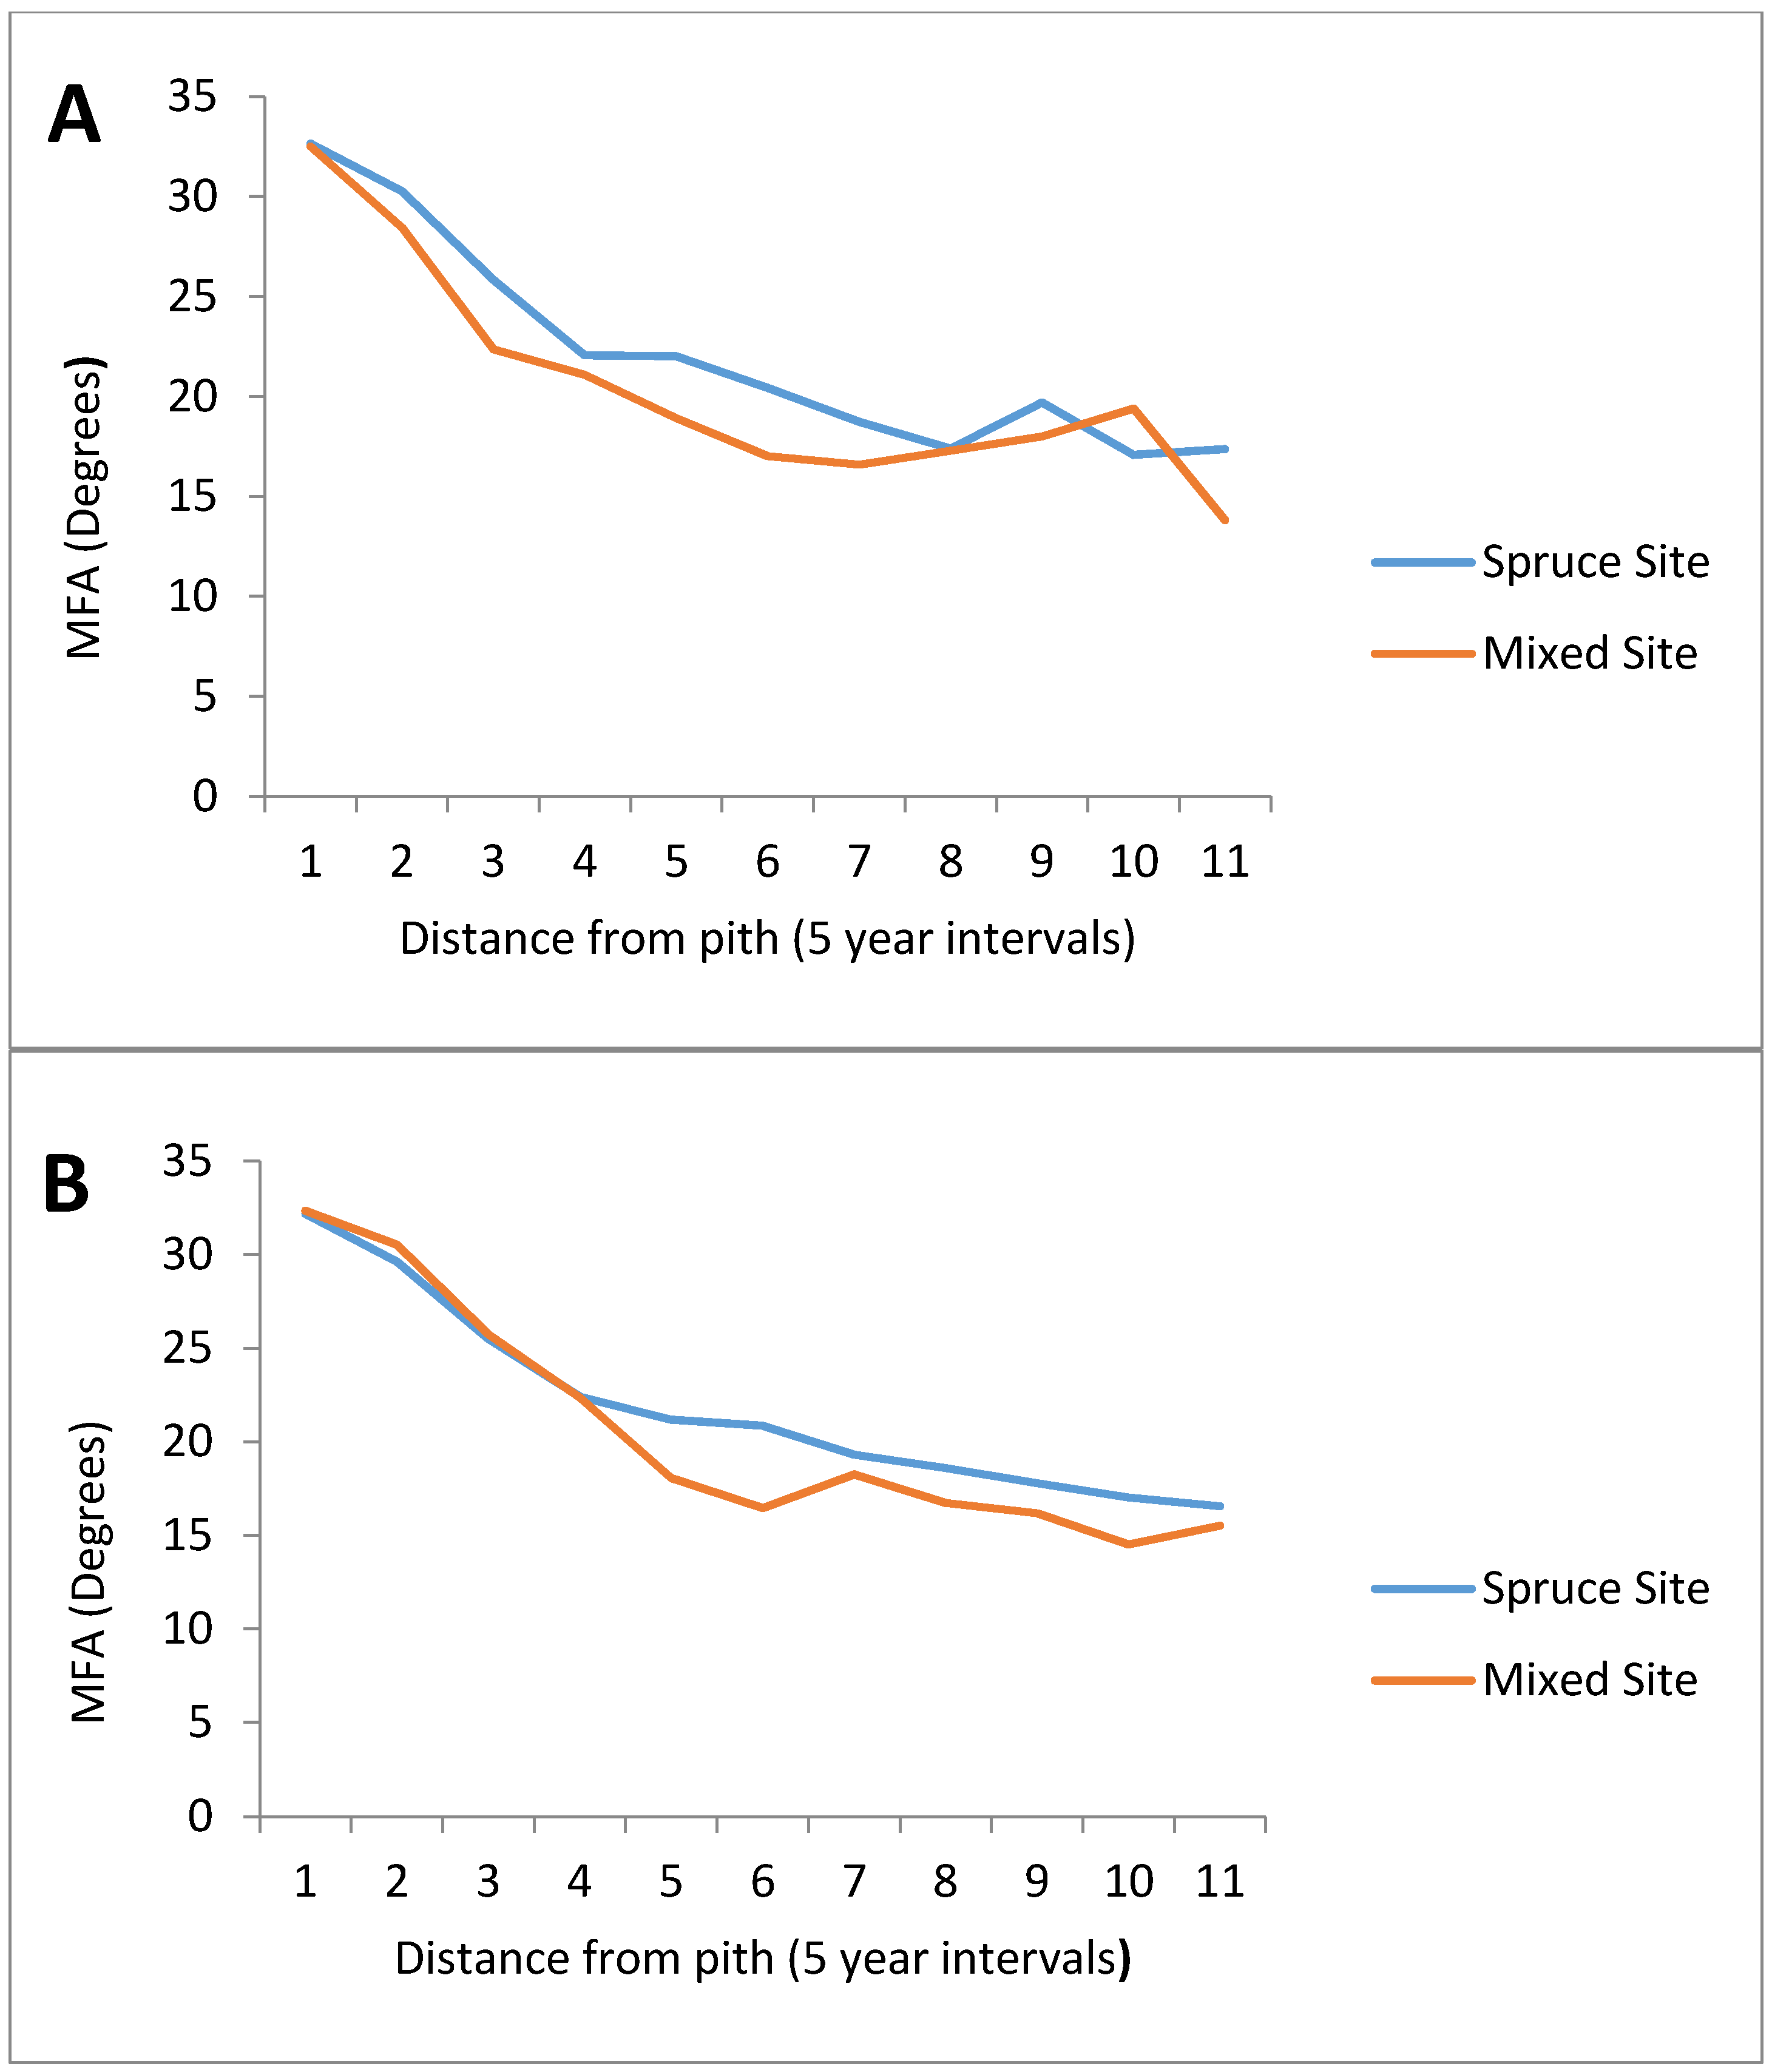
The use of social classes to compare sites produced similar results (
Figure 4). For both the dominant and co-dominant classes, the mixed site showed a slight reduction in MFA. In the dominant class, this reduction occurs from the 5th year onward, with the mixed site only showing a higher MFA at year 45. The mixed co-dominant class only started to show smaller MFA estimates than the co-dominant spruce at approximately year 15, remaining below the co-dominant spruce site for the remaining years. When comparing the mean tree MFA and the final MFA both the dominant and the co-dominant classes show no significant differences between sites. Overall, the differences in white spruce MFA between the mixed and spruce sites were not significant, for both site
vs. site comparison, as well as social class comparisons.
Figure 4.
Mean microfibril angle (degrees) at given ages for all dominant (A) and co-dominant (B) white spruce trees originating from the spruce site (PSP 379) and mixed site (PSP 434). n = 100 for the spruce site, while n = 50 for the mixed site.
Figure 4.
Mean microfibril angle (degrees) at given ages for all dominant (A) and co-dominant (B) white spruce trees originating from the spruce site (PSP 379) and mixed site (PSP 434). n = 100 for the spruce site, while n = 50 for the mixed site.
Overall, the microfibril angle only showed significant changes between sites in trembling aspen trees. There were no significant differences in MFA for white spruce when comparing sites, or when comparing social classes across sites. Therefore, it is apparent that the presence or absence of trembling aspen has little effect on the microfibril angle of white spruce. Trembling aspen trees from the mixed site showed a higher MFA than those from the aspen site. However, a lower MFA is considered a more desirable trait, therefore rendering the aspen wood from the pure aspen site a more attractive choice, especially for the lumber sector. MFA has been linked with longitudinal shrinkage, modulus of elasticity and modulus of rupture, and has been shown to be at least as important as density for the prediction of the strength and the stiffness of solid wood of some tree species [
33,
40,
41,
42]. Evans and Ilic [
33] reported that MFA together with wood density accounted for 96% of the variation in the modulus of elasticity for
E. delegatensis, with MFA alone accounting for 86% of the variation. As shown, wood density of trembling aspen had very little variation between sites and social classes, only showing statistical differences when comparing the dominant social class across sites. On the other hand, MFA varied significantly in all comparisons, both between sites and between social classes. This makes MFA a valuable measurement to compare aspen resources, since it could be used to infer differences in wood and fibre stiffness and shrinkage between the sites, as well as between social classes.
3.3. Fibre Traits
Fibre length and coarseness are important wood fibre traits, which significantly influence paper quality, and thus have implications for the pulp and paper industry. Fibre morphology and cell wall structure directly influences fibre flexibility, plasticity and resistance to processing [
43]. Coarseness is important to paper strength, which decreases with increasing coarseness [
44]. It is also expected that improvements to growth and wood density through silvicultural and breeding activities will directly result in changes to fibre dimensions. For example, in an extreme case, the effect of increasing growth rate due to fertilizer application on fibre properties was measured in
Picea abies (L.) Karst. [
43]. Measurements were taken on trees involved in a long-term nutrient optimization experiment in northern Sweden. Trees from control plots were compared to trees from irrigation/fertilization plots. The authors found that in the presence of unlimited water and nutrients, growth rate increased resulting in a concurrent increase in lumen diameter and cell wall thickness, and a decrease in cell wall proportion and fibre length. This suggests that fibre morphology may be controlled by maturation and the number of cell divisions [
43]. In Scots pine (
Pinus sylvestris L.), Ericsson and Fries report a negative phenotypic correlation between fibre length and diameter [
45]. However, strong positive phenotypic and genetic correlations were observed between fibre length, coarseness and height in maritime pine, and fibre length, height and diameter growth in Scots pine [
19,
46]. Furthermore, a strong relationship between wood density and coarseness and a weak relationship between wood density and fibre length have been documented [
47].
All fibre traits showed significant differences when comparing sites regardless of social class, as seen on
Table 3. Fibres from the pure aspen site were longer than those from the mixed site. Fibre coarseness also followed a similar trend. Fibre length for the trembling aspen had a mean value of 0.868 mm for all trees from both aspen and mixed aspen site combined, which were similar values to those previously published [
25,
48,
49].
Table 3.
Fibre and tracheid length (mm), width (µm) and coarseness (mg·m−1) per site and social class. (n = 100 samples per site).
Table 3.
Fibre and tracheid length (mm), width (µm) and coarseness (mg·m−1) per site and social class. (n = 100 samples per site).
| Site/Social Class | Length (mm) | Width (µm) | Coarseness (mg·m−1) |
|---|
| Aspen Site (PSP 430) | 0.897 ± 0.102 * | 27.0 ± 1.4 * | 0.136 ± 0.028 * |
| Dominant | 0.893 ± 0.104 | 27.0 ± 1.5 † | 0.138 ± 0.029 |
| Co-Dominant | 0.909 ± 0.094 ‡ | 26.9 ± 1.2 ‡ | 0.132 ± 0.026 |
| Mixed Site (PSP 434) | 0.804 ± 0.071 * | 24.9 ± 1.2 * | 0.124 ± 0.024 * |
| Dominant | 0.847 ± 0.062 | 25.3 ± 1.3 † | 0.127 ± 0.018 |
| Co-dominant | 0.788 ± 0.068 ‡ | 24.7 ± 1.1 ‡ | 0.123 ± 0.026 |
| Spruce Site (PSP 379) | 2.154 ± 0.245 ** | 38.1 ± 1.7 ** | 0.164 ± 0.025 ** |
| Dominant | 2.155 ± 0.244 †† | 38.7 ± 1.5 | 0.165 ± 0.025 †† |
| Co-Dominant | 2.196 ± 0.239 ‡‡ | 37.7 ± 1.7 ‡‡ | 0.163 ± 0.026 ‡‡ |
| Mixed Site (PSP 434) | 1.931 ± 0.192 ** | 37.2 ± 2.2 ** | 0.130 ± 0.019 ** |
| Dominant | 1.983 ± 0.196 †† | 38.3 ± 1.8 | 0.133 ± 0.021 †† |
| Co-dominant | 1.875 ± 0.189 ‡‡ | 36.2 ± 2.1 ‡‡ | 0.128 ± 0.018 ‡‡ |
The trembling aspen trees from the aspen site had a significantly longer mean fibre length than the trees from the mixed site (0.897 mm vs. 0.804 mm). Similarly, the fibre coarseness values also indicated that trees from the pure aspen site possess significantly higher mean coarseness values than those from the mixed site (0.136 mg·m−1 vs. 0.124 mg·m−1). Although all fibre traits showed significant differences between the two sites, when the trees were divided into social classes, some traits show similar values in the same social class for both sites. Fibre length had a higher mean value in trees from the aspen site when comparing co-dominant classes. Again, there was a significant difference in fibre coarseness between sites, and when the trees were divided into social classes no such difference emerge.
Similar to the trembling aspen, the white spruce from the mixed and pure spruce site showed differences in all fibre traits. Tracheid lengths varied between 1.469 mm and 2.641 mm with a mean value of 2.08 mm for all white spruce trees, regardless of site. These values are consistent with estimates previously published [
27,
49]. Tracheids originating from the spruce site possessed a higher mean (2.15 mm) than those from the mixed site (1.93 mm). According to Sanio’s Law, “the tracheid increases in size from within outwards, throughout a number of annual rings, until they have attained a definite size, which remains constant for the following annual rings” [
50]. Since trees from the spruce site possess, on average, over twice as many growth rings as those from the mixed site, it is expected that the samples from the pure spruce site will possess a larger proportion of tracheids that have already reached their defined size. As a result, the mean tracheid length value of the entire tree will be higher. Tracheid coarseness of all white spruce trees independent of site, varied from 0.102 to 0.258 mg·m
−1 with a mean value of 0.152 mg·m
−1. As expected, coarseness also showed a similar pattern, where tracheids from the pure spruce site possess a higher mean coarseness than those from the mixed site (0.164 mg·m
−1 vs. 0.130 mg·m
−1).
When grouping the samples by social classes in an attempt to eliminate the effect of age, clear trends became apparent. For both dominant and co-dominant classes, the tracheids from the spruce site had longer lengths than tracheids from the same class in the mixed site. On the pure spruce site however, tracheids from dominant trees had shorter mean length than those from the co-dominant trees. This was not the case in the trees originating from the mixed site, suggesting that as the stand advances from a mixed composition to one dominated by white spruce, the co-dominant white spruce trees will have longer tracheids that will eventually surpass the tracheids lengths of the dominant class as succession progresses. Grouping the trees into social classes had no effect on white spruce coarseness.
It is imperative to determine what the final use for the wood from each site is in order to decide which of the two sites is the most efficient for each species. However, as a general rule, longer cells are of greater interest to the pulp and paper industry, as fibres possessing these characteristics generate higher quality paper products [
51,
52]. If indeed longer cells are desired, the aspen trees from the pure aspen site possess the desired properties, as they show significantly longer fibre length, and greater coarseness. In contrast, if spruce is the species of interest, then the trees originating from the pure spruce site have the highest quality fibres. Fibre coarseness is a valuable tool when trying to specify the value of wood for pulp and paper since it takes into consideration length, width and cell wall thickness. A lower coarseness will generate higher fibre collapse, producing a paper with improved density and optical properties, while fibres with high coarseness will generate paper with a high porosity [
53]. If the industry in question is seeking fibres with a higher coarseness, then they should prioritize sites where the species in question is dominant and not from a mixed site.
When considering social classes in the trembling aspen, there is no strong indication that a particular social class will be better than its equivalent in the mixed or pure site. In white spruce, the trees from the spruce site possess significantly higher tracheid length and coarseness regardless of social class. Therefore, classification by social classes for both trembling aspen and white spruce is not beneficial, in terms of fibre traits.
3.4. Cell Wall Chemistry
Wood chemical components ultimately contribute to the strength of wood and primarily affect pulping [
19,
54]. During the production of high quality paper, lignin is removed from the polysaccharide component of wood, which must be balanced with cellulose degradation [
55]. Chantre
et al. conducted a comprehensive study on the feasibility and relevance of selection for pulping potential in Douglas-fir. They report strong positive relationships between density traits and cellulose content, but negative relationships with lignin. They also report a strong positive relationship between modulus of elasticity (MOE), an indicator of lumber strength, and cellulose (0.606), but a negative relationship with lignin (−0.548) [
56].
The results of cell wall composition analysis are summarized in
Table 4. The mean carbohydrate and lignin content of the xylem of the trembling aspen samples, regardless of site, was 75.3% carbohydrates and 21.9% lignin. These values are in accordance to previously published values for cell wall composition of trembling aspen [
25,
57].
Table 4.
Xylem cell wall carbohydrate and lignin content (%) per site and social class (n = 30 samples per site).
Table 4.
Xylem cell wall carbohydrate and lignin content (%) per site and social class (n = 30 samples per site).
| Site/Social Class | % Carbohydrate | % Lignin |
|---|
| Aspen Site (PSP 430) | 74.12 ± 6.44 | 22.62 ± 1.92 * |
| Dominant | 75.17 ± 4.63 | 22.32 ± 1.62 † |
| Co-Dominant | 71.38 ±9.65 | 23.41 ± 2.50 ‡ |
| Mixed Site (PSP 434) | 77.60 ± 3.38 | 20.39 ± 1.63 * |
| Dominant | 78.54 ± 1.52 | 19.91 ± 1.92 † |
| Co-dominant | 76.79 ± 4.39 | 20.81 ± 1.31 ‡ |
| Spruce Site (PSP 379) | 70.89 ± 2.50 | 25.57 ± 0.99 ** |
| Dominant | 67.16 ± 4.19 | 25.10 ± 0.77 †† |
| Co-Dominant | 68.98 ± 5.20 | 25.22 ± 0.70 ‡‡ |
| Mixed Site (PSP 434) | 70.11 ± 4.08 | 26.88 ± 0.93 ** |
| Dominant | 70.12 ± 4.71 | 26.85 ± 1.02 †† |
| Co-dominant | 70.10 ± 1.93 | 26.95 ± 0.76 ‡‡ |
There were no significant differences in carbohydrate content of the aspen, regardless of site. However, there was a reduction in lignin content in the aspen trees from the mixed site (20.4% vs. 22.6%). When separating the trees into social classes, a similar trend showing lower lignin content in the mixed site occurs for both dominant and co-dominant social classes. The lower lignin content apparent by social classes on the aspen site compared to the mixed site is larger than the difference between all trees from each site, regardless of class: 22.3% to 19.9% for dominant trees, and 23.4% to 20.8% for co-dominant trees. Despite these differences, there were still no significant changes in carbohydrate content between sites when comparing social classes.
The total carbohydrate and lignin content for all spruce trees, regardless of site or class, was 70.9% and 26.0%, respectively. These values are similar to previously published cell wall chemistries in white spruce [
58,
59]. Following the same trend as trembling aspen, there were no significant differences in carbohydrate content between the spruce and the mixed site. However, once again there was a difference in the lignin content, where the mixed site showed a statistically higher amount of lignin than the spruce site (26.9%
vs. 25.6%). This difference in lignin content, together with improved fibre quality traits (
i.e. tracheid length and coarseness) makes the spruce trees from the spruce site a better candidate for pulp and paper applications. Sub-dividing the sites into dominant and co-dominant classes had no effect on cell wall chemistries. For both dominant and co-dominant classes there were no significant differences in carbohydrate content. In addition, the spruce site had lower lignin content than the mixed site for both classes. As with the trembling aspen, dividing the sites by social classes showed no advantage.
For both species and social classes, the presence or absence of one species seems to have no significant effect on the levels of carbohydrate in the cell wall. However, it does influence the lignin content, since both species showed significant differences between the species specific site and the mixed site. For the trembling aspen, the mixed site had the lowest observed estimates of cell wall lignin. In contrast, the spruce site had the lowest lignin content for the spruce. As discussed, following the notion of a relay floristics forest succession, the aspen site is at a younger stage than the mixed site, which in turn will one day progress into the spruce site. As such, it is possible to conclude that the older the site, the lower the lignin content for both trembling aspen and white spruce. When comparing social classes between sites, both dominant and co-dominant classes showed the same pattern as comparing sites independent of social class for both species. It is, therefore, irrelevant to wood chemistry to divide the sites into social classes.


