1. Introduction
For a long time, the general consensus in Europe was that forest ecosystem services beyond wood production would be sufficiently provided as mere side effects of the latter, a concept that was well outlined by the term
wake theory [
1]. In the present, however, they have emancipated, and their relative importance is subject to partly heated societal debates from the local to the pan-European scale. The emergence of the Helsinki Criteria for sustainable forest management [
2,
3] marks an important milestone in this process. Consequently, important questions are how far ecosystem service provision is sensitive to forest management, and to what extent different ecosystem services are conflicting or compatible.
Although local case studies have contributed to these questions, there is no synthesis available yet. Furthermore, while the vulnerability of ecosystem service provision due to climate change has been investigated on a European level [
4,
5,
6]), silvicultural steering possibilities were not fathomed on such a large scale. Existing studies were limited to single ecosystem services only and did not follow a regionally tailored bottom-up approach (cf. [
7,
8]). This is remarkable, as meanwhile most of Europe’s forests are covered by management-oriented forest growth simulation models—partly even embedded in decision support systems (DSS)—that enable such a scrutiny.
The European Union project INTEGRAL [
9], a collaboration of 21 research groups from 13 European countries, asks how different policies influence forest managers’ behavior in terms of silvicultural treatment and how this would influence the provision of ecosystem services in a time frame of about 30 years (assuming constant climate conditions during that time span). To this end, mostly two representative case study areas have been selected per country, where, in a so far unprecedented collaboration of social and natural scientists, sets of policy scenarios have been developed and translated into forest owner-specific management scenarios that were able to drive up-to-date forest growth simulators and DSS containing such simulators, respectively. An important part of the research was to identify each region’s most relevant forest ecosystem services and to design and/or implement appropriate quantitative indicators for benchmarking ecosystem service provision in the forest growth scenarios. As a result there exists for each case study a set of policy scenarios with interlinked forest management scenarios and corresponding simulation results that show timelines of ecosystem service provision.
While the broad scope of the project results, from policy to ecosystem services, will be reported in other publications, it seems worthwhile to have a closer look at the silvicultural scenarios—without considering which policies triggered them—and the resulting ecosystem service provision expected from forest simulations. While forest ownership structure is crucial for management decisions in a given policy framework, it is not considered an influence variable in the study on hand. We focus on the management and its influence on ecosystem services; but we do not ask who decided on a given management option and why. The character of this work is explorative as there is no pre-defined set of hypotheses or theoretical framework we could test. Rather, we would like to contribute to the formation of hypotheses as a background for further studies.
Thus, this study uses the existing results for asking:
- -
What kind of ecosystem services are important throughout Europe and which are relevant on a regional level only?
- -
Can ecosystem services be meaningfully controlled by forest management, and is this different across Europe?
- -
Which ecosystem services are conflicting, neutral, or positively correlated?
Based on this synthesis we discuss the steering potential for Europe’s forests.
2. Material and Methods
2.1. Case Study Areas
The 20 case study areas underlying this study were selected in the INTEGRAL project’s framework in order to represent typical forest landscapes for each country, the term “typical” concerning tree species composition, site conditions, and management paradigms, but also socioeconomic frame conditions for forestry. In the project, they were assigned to six European forest regions, namely Eastern Europe, Central Western Europe, North Western Europe, Southern Europe, Western Europe, and Northern Europe, each of these regions having a distinctive ecological, socioeconomic, and political context [
10] (
Table 1,
Figure 1).
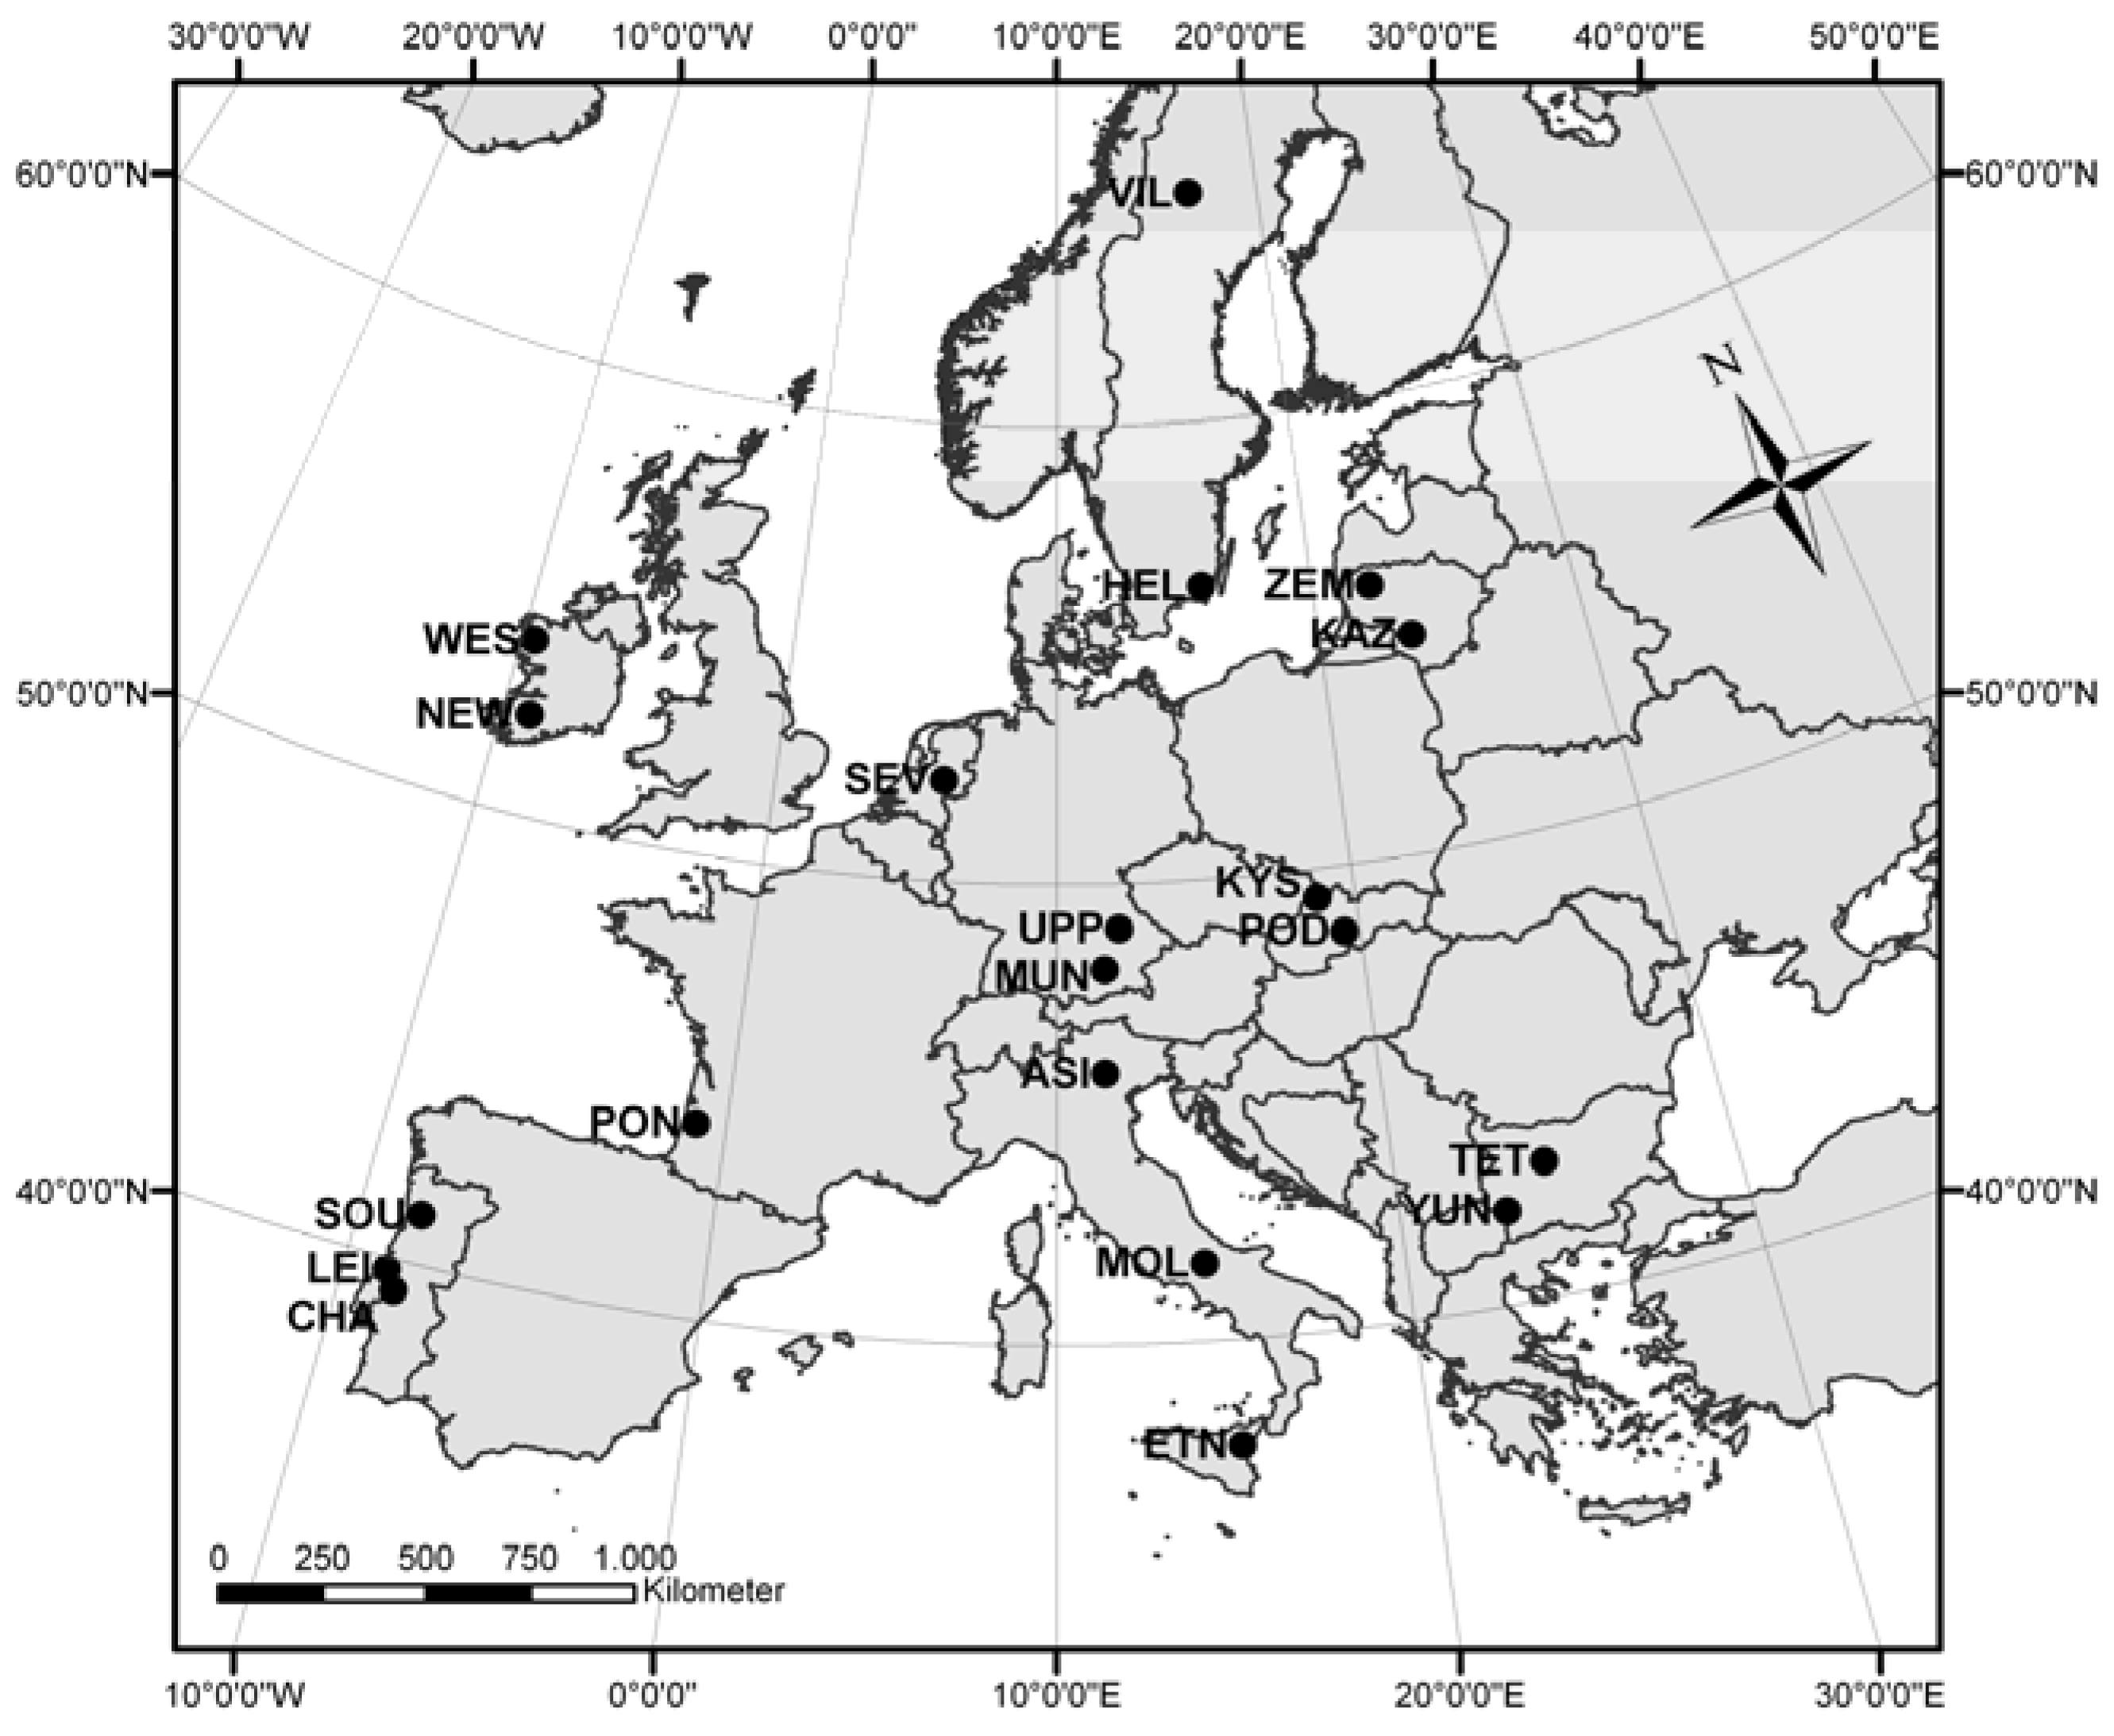
Figure 1.
Geographic locations of all INTEGRAL case study areas. See
Table 1 for the full case study names.
Figure 1.
Geographic locations of all INTEGRAL case study areas. See
Table 1 for the full case study names.
Table 1.
The INTEGRAL case studies used in this work, selected group affiliations, and key properties. The table is sorted by country and case study name (alphabetical order).
Table 1.
The INTEGRAL case studies used in this work, selected group affiliations, and key properties. The table is sorted by country and case study name (alphabetical order).
| Country | Case Study Area (CSA) | CSA Acronym | Forest Region | Species Composition | Social Environment | Latitude | Longitude | Total Area (ha) | Forest Area (ha) |
|---|
| Bulgaria | Teteven | TET | Eastern Europe | broadleaf | rural | 42°55′ N | 24°25′ E | 27,400 | 10,100 |
| Bulgaria | Yundola | YUN | Eastern Europe | conifer | rural | 42°01′ N | 23°06′ E | 10,100 | 3700 |
| France | Pontenx | PON | Central Western Europe | conifer | rural | 44°12′ N | 00°55′ W | 101,000 | 66,700 |
| Germany | Munich South | MUN | Central Western Europe | mixed | city near | 48°08′ N | 11°34′ E | 60,000 | 43,200 |
| Germany | Upper Palatinate | UPP | Central Western Europe | mixed | rural | 49°01′ N | 12°05′ E | 300,000 | 159,000 |
| Ireland | Newmarket | NEW | North Western Europe | conifer | rural | 52°12′ N | 09°00′ W | 75,100 | 13,500 |
| Ireland | Western Peatlands | WES | North Western Europe | conifer | rural | 53°48′ N | 09°31′ W | 1,000,000 | 116,000 |
| Italy | Asiago | ASI | Southern Europe | mixed | rural | 45°52′ N | 11°31′ E | 46,700 | 30,900 |
| Italy | Etna | ETN | Southern Europe | broadleaf | city near | 37°45′ N | 14°59′ E | 25,300 | 7000 |
| Italy | Molise | MOL | Southern Europe | mixed | rural | 41°40′ N | 14°15′ E | 600 | 600 |
| Lithuania | Kazlu Ruda | KAZ | Eastern Europe | conifer | rural | 54°45′ N | 23°30′ E | 66,000 | 36,800 |
| Lithuania | Zemaitija | ZEM | Eastern Europe | mixed | rural | 55°59' N | 22°15′ E | 38,000 | 11,700 |
| Netherlands | South East Veluwe | SEV | Western Europe | conifer | city near | 52°13′ N | 5°58′ E | 8000 | 6000 |
| Portugal | Chamusca | CHA | Southern Europe | broadleaf | rural | 39°21′ N | 8°29′ W | 74,600 | 53,000 |
| Portugal | Leiria | LEI | Southern Europe | conifer | rural | 39°45′ N | 8°48′ W | 75,200 | 44,400 |
| Portugal | Sousa | SOU | Southern Europe | mixed | rural | 41°04′ N | 8°15′ W | 48,900 | 22,000 |
| Slovakia | Kysuce | KYS | Eastern Europe | mixed | city near | 49°22′ N | 18°44′ E | 152,000 | 121,600 |
| Slovakia | Podpol’anie | POD | Eastern Europe | broadleaf | rural | 48°34′ N | 19°30′ E | 20,000 | 10,200 |
| Sweden | Helgea | HEL | Northern Europe | conifer | rural | 56°25′ N | 15°42′ E | 120,000 | 96,000 |
| Sweden | Vilhelmina | VIL | Northern Europe | conifer | rural | 64°55′ N | 16°35′ E | 850,000 | 530,000 |
The case study areas are located in 10 European countries; these are (in alphabetical order) Bulgaria (2 case studies), France (1 case study), Germany (2), Ireland (2), Italy (3), Lithuania (2), the Netherlands (1), Portugal (3), Slovakia (2), and Sweden (2). As shown in
Table 1, they cover a range of northern latitudes between 38° (Etna, Italia) and 65° (Vilhelmina, Sweden) and longitudes between 9° W (Leiria, Portugal) and 24° E (Teteven, Bulgaria). The average total size and the forest area size of such a case study area amounts to about 160,000 ha and 70,000 ha, respectively. However, there is a large variance in the area sizes; the smallest case study area (Molise, Italy) is a forest biosphere reserve with slightly more than 600 ha only, while the largest (Western Peatlands, Ireland) covers an area of about 1,000,000 ha. For the purposes of this study, the case study areas (CSAs) were grouped into three tree species composition classes (
Table 1). “Broadleaf” (4 CSAs) and “conifer” (9 CSAs) mean that the concerned area is dominated by deciduous species stands and conifer stands, respectively. The category “mixed” (7 CSAs) indicates a more or less balanced mixture of conifer and deciduous species in a given case study area at the stand level or on larger scales. Another simple grouping we called “social environment” considered if a case study area is located in an urban catchment (group name “city near”, 4 CSAs) or in a more rural landscape (“rural”, 16 CSAs, see
Table 1).
2.2. Investigated Ecosystem Services
In total, 23 different ecosystem services have been investigated in the case study areas (
Table 2). Some of them, e.g., biodiversity or harvested wood, were reported as important in each case study area; others, like the area available for reindeer herding, pine cone production or sub-specifications of harvested wood (e.g., eucalypt pulpwood, conifer sawlog production), were specific to certain case studies only (
Table 3). For the purpose of this study we grouped the ecosystem services according to the six Helsinki criteria for sustainable forest management [
3] as well as into the four categories suggested by the FORSYS COST Action FP0804 [
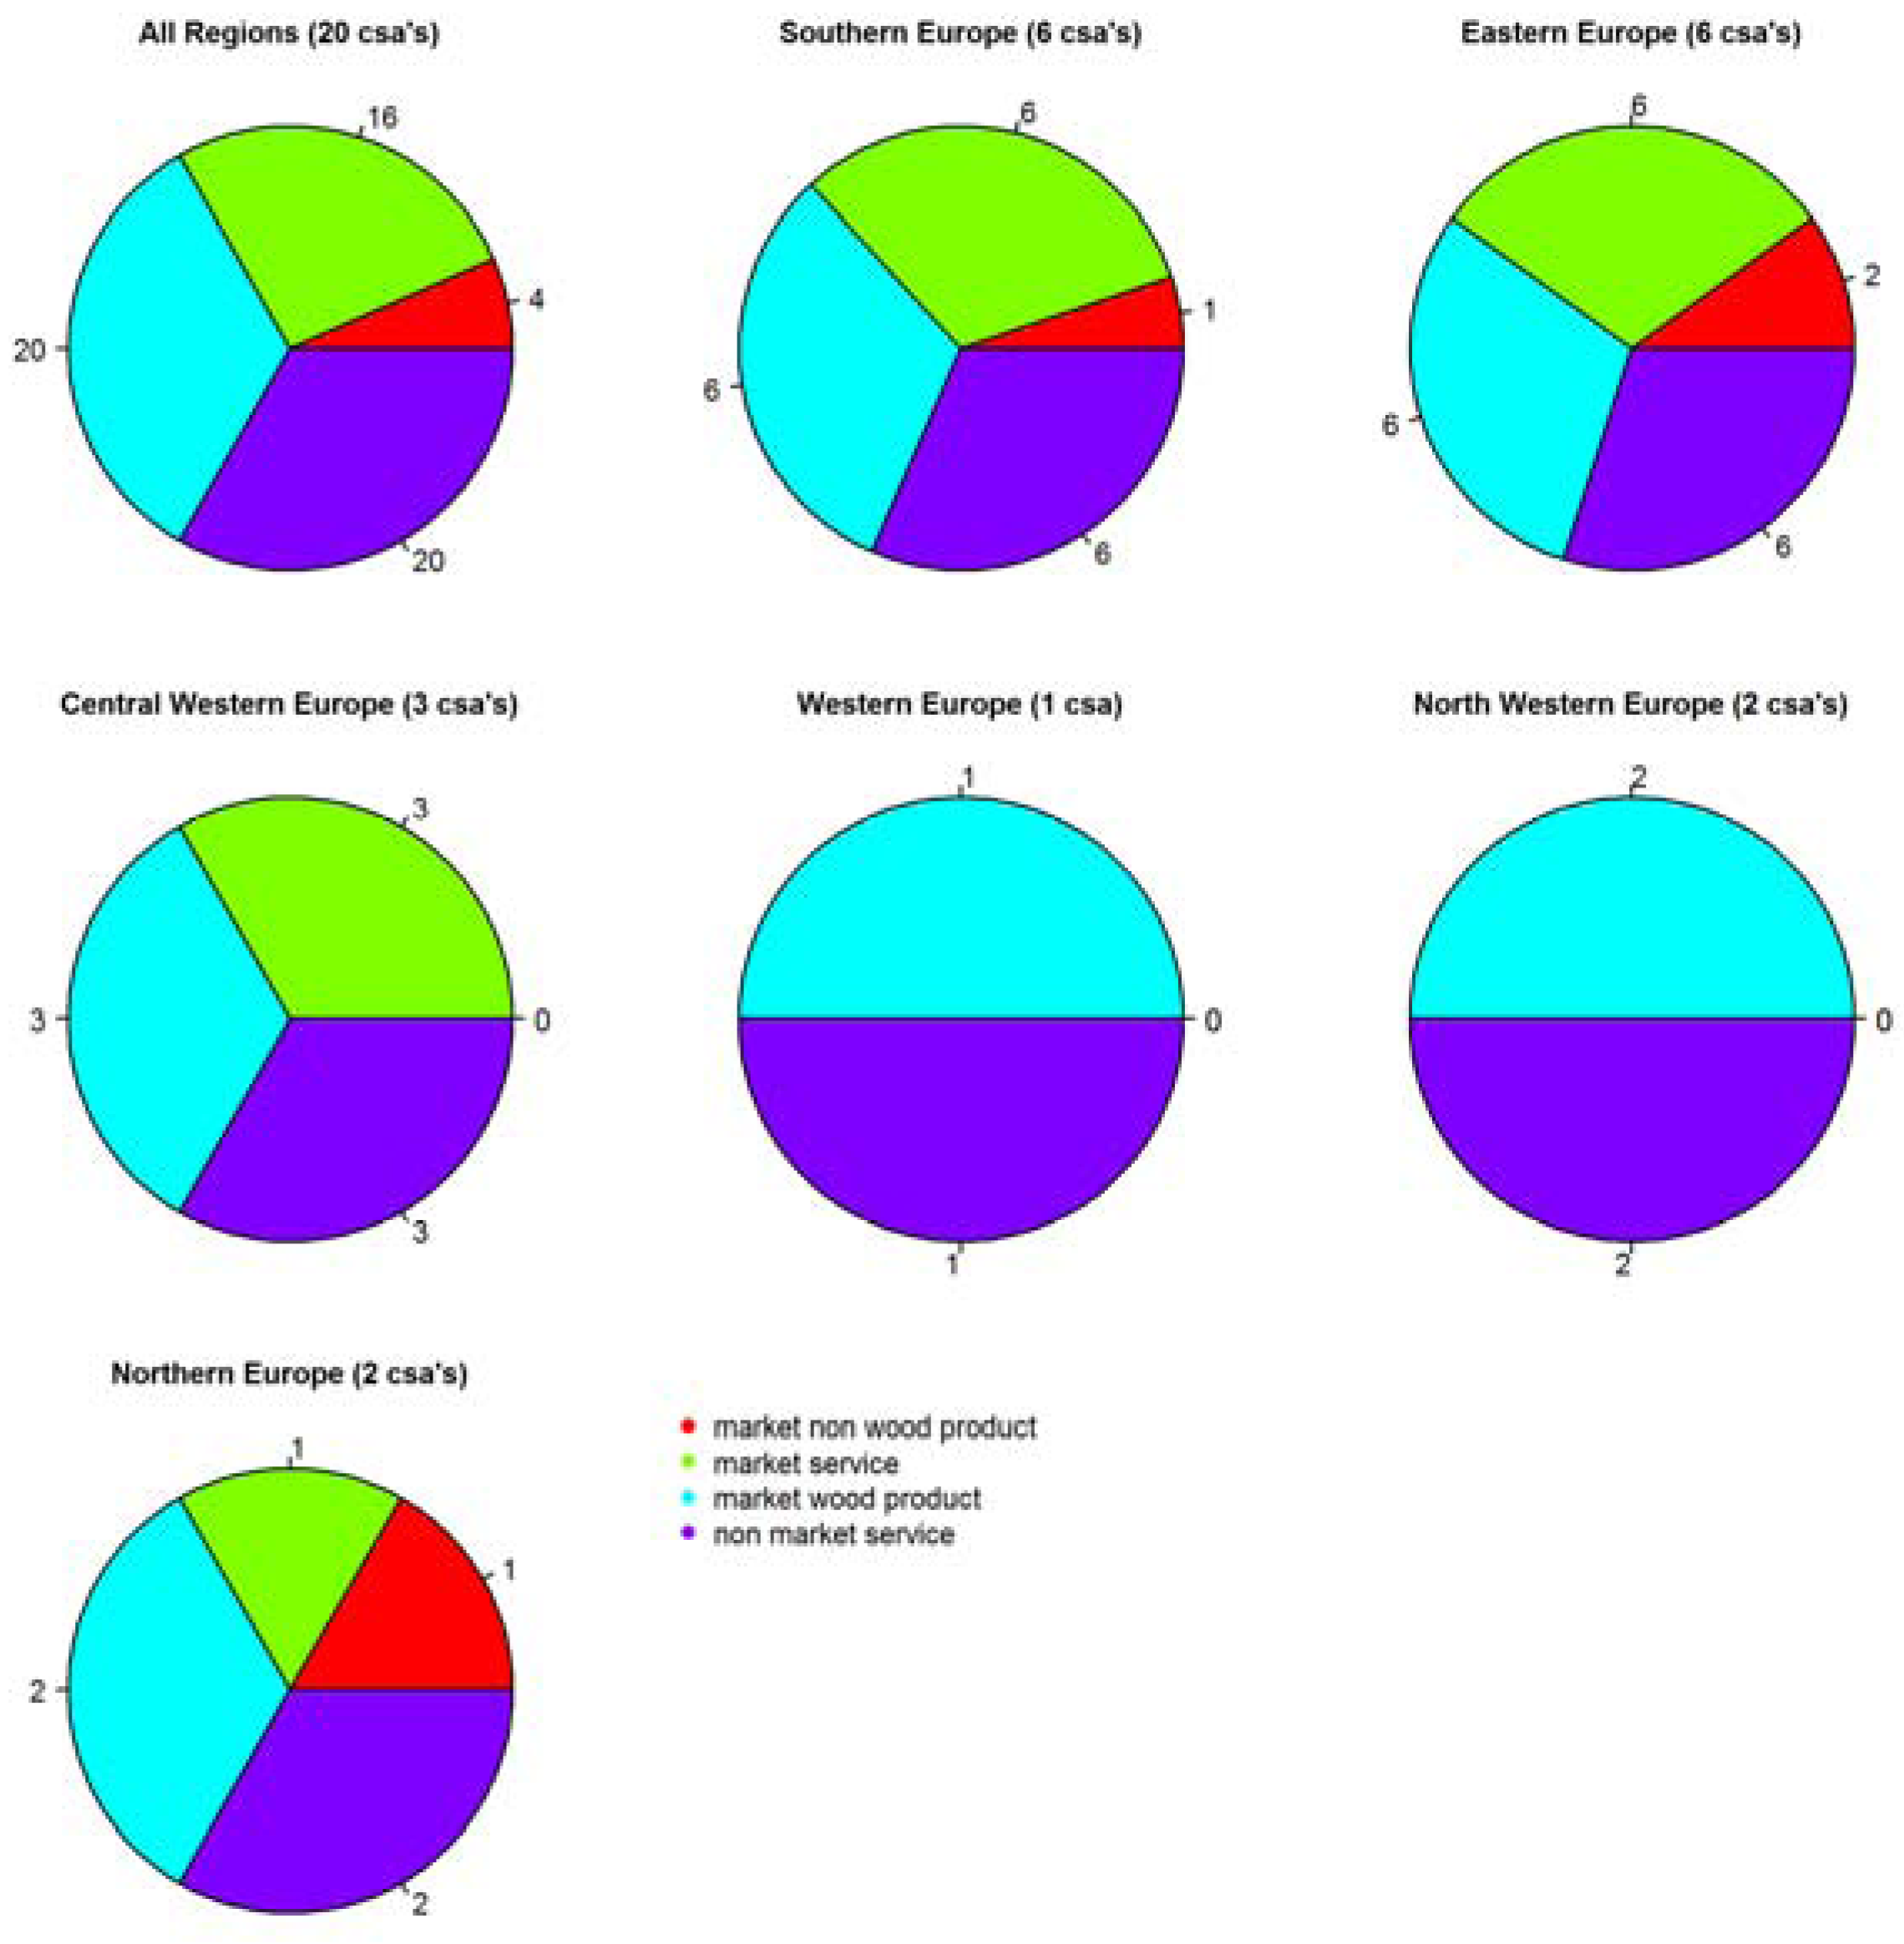
11]. Both systems overlap; however, there are some important differences. The FORSYS categories only distinguish between wood products, non-wood products, and services, noting whether these products and services are traded on markets or not. The Helsinki criteria are more detailed concerning the forest services; however, they do not make a distinction between market or non-market products and services.
Concerning the Helsinki criteria, most reported ecosystem services (ESS) belong to the groups “protective functions” (7 ESS), and wood production (5 ESS), while according to the FORSYS categories the largest groups are “non-market services” (10 ESS) and “market wood products” (5 ESS). While standing wood volume was attributed to the Helsinki class “forest resources,” it was not attributed to any of the FORSYS categories because it is neither a product nor a service
per se. See
Table 3 for a complete list of the investigated ecosystem services by country and case study area. For each investigated ecosystem service, country-specific index calculation methods were used and partly newly developed in the INTEGRAL project (see
Supplementary Information 2 for details), taking into account the specifically most important conditions. Being more difficult to compare than uniformly calculated index values, they ensure a high relevance on the spot.
Table 2.
Forest ecosystem services (ESS) investigated in all case study areas together. The ESS were grouped (I) according to the Helsinki criteria [
3]; and (II) according to the FORSYS categories [
11].
Table 2.
Forest ecosystem services (ESS) investigated in all case study areas together. The ESS were grouped (I) according to the Helsinki criteria [3]; and (II) according to the FORSYS categories [11].
| Ecosystem Service | Helsinki Criterion No. | Helsinki Class | FORSYS Class |
|---|
| carbon sequestration | 1 | forest resource | non-market service |
| standing volume | 1 | forest resource | |
| harvested wood | 3 | production (wood) | market wood product |
| conifer sawlog production | 3 | production (wood) | market wood product |
| cork oak fuelwood production | 3 | production (wood) | market wood product |
| eucalypt pulpwood production | 3 | production (wood) | market wood product |
| hardwood timber production | 3 | production (wood) | market wood product |
| cork production | 3 | production (non-wood) | market non-wood product |
| mushroom production | 3 | production (non-wood) | market non-wood product |
| pine cone production | 3 | production (non-wood) | market non-wood product |
| reindeer area | 3 | production (non-wood) | market non-wood product |
| biodiversity | 4 | biodiversity | non-market service |
| coastal protection | 5 | protective functions | non-market service |
| fire safety | 5 | protective functions | non-market service |
| natural dynamics protection | 5 | protective functions | non-market service |
| quality water provision | 5 | protective functions | non-market service |
| sand dunes embankment | 5 | protective functions | non-market service |
| water & soil protection | 5 | protective functions | non-market service |
| watershed protection | 5 | protective functions | non-market service |
| hunting | 6 | socioeconomic functions | market service |
| landscape aesthetics | 6 | socioeconomic functions | non-market service |
| recreation | 6 | socioeconomic functions | market service |
| tourism | 6 | socioeconomic functions | market service |
Table 3.
Investigated ecosystem services per country and case study area (CSA).
Table 3.
Investigated ecosystem services per country and case study area (CSA).
| Country | CSA Acronym | Ecosystem Service | Helsinki Class | FORSYS Class |
|---|
| Bulgaria | TET | biodiversity | biodiversity | non-market service |
| carbon sequestration | forest resource | non-market service |
| harvested wood | production (wood) | market wood product |
| recreation | socioeconomic functions | market service |
| standing volume | forest resource | |
| tourism | socioeconomic functions | market service |
| Bulgaria | YUN | biodiversity | biodiversity | non-market service |
| carbon sequestration | forest resource | non-market service |
| harvested wood | production (wood) | market wood product |
| recreation | socioeconomic functions | market service |
| standing volume | forest resource | |
| tourism | socioeconomic functions | market service |
| France | PON | biodiversity | biodiversity | non-market service |
| carbon sequestration | forest resource | non-market service |
| harvested wood | production (wood) | market wood product |
| recreation | socioeconomic functions | market service |
| standing volume | forest resource | |
| Germany | MUN | biodiversity | biodiversity | non-market service |
| carbon sequestration | forest resource | non-market service |
| harvested wood | production (wood) | market wood product |
| quality water provision | protective functions | non-market service |
| recreation | socioeconomic functions | market service |
| Germany | UPP | biodiversity | biodiversity | non-market service |
| carbon sequestration | forest resource | non-market service |
| harvested wood | production (wood) | market wood product |
| recreation | socioeconomic functions | market service |
| Ireland | NEW | biodiversity | biodiversity | non-market service |
| carbon sequestration | forest resource | non-market service |
| harvested wood | production (wood) | market wood product |
| quality water provision | protective functions | non-market service |
| Ireland | WES | biodiversity | biodiversity | non-market service |
| carbon sequestration | forest resource | non-market service |
| harvested wood | production (wood) | market wood product |
| quality water provision | protective functions | non-market service |
| Italy | ASI | biodiversity | biodiversity | non-market service |
| carbon sequestration | forest resource | non-market service |
| harvested wood | production (wood) | market wood product |
| recreation | socioeconomic functions | market service |
| Italy | ETN | biodiversity | biodiversity | non-market service |
| carbon sequestration | forest resource | non-market service |
| harvested wood | production (wood) | market wood product |
| recreation | socioeconomic functions | market service |
| Italy | MOL | biodiversity | biodiversity | non-market service |
| carbon sequestration | forest resource | non-market service |
| harvested wood | production (wood) | market wood product |
| recreation | socioeconomic functions | market service |
| Lithuania | KAZ | biodiversity | biodiversity | non-market service |
| harvested wood | production (wood) | market wood product |
| recreation | socioeconomic functions | market service |
| water & soil protection | protective functions | non-market service |
| Lithuania | ZEM | carbon sequestration | forest resource | non-market service |
| harvested wood | production (wood) | market wood product |
| recreation | socioeconomic functions | market service |
| Netherlands | SEV | biodiversity | biodiversity | non-market service |
| carbon sequestration | forest resource | non-market service |
| fire safety | protective functions | non-market service |
| harvested wood | production (wood) | market wood product |
| landscape aesthetics | socioeconomic functions | non-market service |
| natural dynamics protection | protective functions | non-market service |
| Portugal | CHA | carbon sequestration | forest resource | non-market service |
| conifer sawlog production | production (wood) | market wood product |
| cork oak fuelwood production | production (wood) | market wood product |
| cork production | production (non-wood) | market non-wood product |
| eucalypt pulpwood production | production (wood) | market wood product |
| pine cone production | production (non-wood) | market non-wood product |
| recreation | socioeconomic functions | market service |
| Portugal | LEI | carbon sequestration | forest resource | non-market service |
| coastal protection | protective functions | non-market service |
| conifer sawlog production | production(wood) | market wood product |
| recreation | socioeconomic functions | market service |
| sand dunes embankment | protective functions | non-market service |
| watershed protection | protective functions | non-market service |
| Portugal | SOU | carbon sequestration | forest resource | non-market service |
| conifer sawlog production | production (wood) | market wood product |
| eucalypt pulpwood production | production (wood) | market wood product |
| hardwood timber production | production (wood) | market wood product |
| recreation | socioeconomic functions | market service |
| Slovakia | KYS | biodiversity | biodiversity | non-market service |
| carbon sequestration | forest resource | non-market service |
| harvested wood | production (wood) | market wood product |
| hunting | socioeconomic functions | market service |
| mushroom production | production (non-wood) | market non-wood product |
| quality water provision | protective functions | non-market service |
| recreation | socioeconomic functions | market service |
| standing volume | forest resource | |
| Slovakia | POD | biodiversity | biodiversity | non-market service |
| carbon sequestration | forest resource | non-market service |
| harvested wood | production (wood) | market wood product |
| hunting | socioeconomic functions | market service |
| mushroom production | production (non-wood) | market non-wood product |
| quality water provision | protective functions | non-market service |
| recreation | socioeconomic functions | market service |
| standing volume | forest resource | |
| Sweden | HEL | biodiversity | biodiversity | non-market service |
| carbon sequestration | forest resource | non-market service |
| harvested wood | production (wood) | market wood product |
| quality water supply | protective functions | non-market service |
| Sweden | VIL | biodiversity | biodiversity | non-market service |
| carbon sequestration | forest resource | non-market service |
| harvested wood | production (wood) | market wood product |
| recreation | socioeconomic functions | market service |
| reindeer area | production (non-wood) | market non-wood product |
| standing volume | forest resource | |
| tourism | socioeconomic functions | market service |
2.4. Forest Management Scenarios
The scenarios calculated with the above-mentioned tools originate from case-study specific policy analyses performed in the INTEGRAL project. Although this study utilizes these scenarios uncoupled from their political context, the original concept needs to be explained.
For each case study, several possible alternative socioeconomic scenarios for the coming decades were elaborated. As the forest area in most case studies belongs to different groups of owners, the probable forest management behavior of the different relevant owner types in the context of a given socioeconomic scenario was elaborated in detail. In order to make this information feasible for scenario calculations, owner behavior was translated into quantitative management rules and definitions, which were directly compatible with the specific simulation tools/DSS (see [
28] for detailed explanations of the scenario building process). Although the applied simulation tools/DSS are very different, typical variables that defined forest management for simulation purposes were intensity and type of thinnings (e.g., thinning from above or below, selective thinning,
etc.), thinning frequency, rotation length, and species preferences for harvesting and regenerating stands. Dependent on the specific simulation tool’s/DSS’s concept and the case studies’ frame conditions, such settings were in some cases applied in an overarching way for large forest landscape compartments, in other cases very detailed with specific settings for a broad spectrum of different forest stand types. On average, four different scenarios (max. 7, min. 3) were defined per case study area, amounting to 85 scenarios in total. In each case study, all scenarios started with the same initial forest state, and were applied immediately,
i.e., possible transient phases from current concepts to the scenario conditions were neglected. The scenarios were simulated for three decades in most case studies; in some cases the simulations were extended to 50 years (Bulgaria, France, Netherlands), and 60 years (Lithuania). The central simulation outcomes were the case study-specific indicators for ecosystem service provision at the end of the simulation time span. Climate conditions were assumed to be constant at their present state.
While in the original INTEGRAL context the scenarios’ policy aspects are highly important, this study focuses on the treatment-dependency of ecosystem service provision. Thus, for the purpose of this work, a simple scenario grouping that could be meaningfully applied across all case studies was sought. As all case studies covered one scenario that could be interpreted as “business as usual” (or was explicitly called so), this was used as the reference for grouping. As the grouping criterion that could be applied in each case study while being relevant for this work as well, we chose forest management intensity. A scenario was termed “more intensive” or “less intensive” if it assumed a more intensive forest management on case study area level compared to business as usual. Precisely, “more intensive” means that on landscape level a higher wood production is strived for. This mainly comprises measures like increased felling budgets and rotation shortening, which are often accompanied by reduced stand densities, but also indirect measures like increasing the share of more productive tree species in the course of thinnings and stand regeneration (cf. [
29]). Here, we made no difference between whether this is done evenly on the whole area or by a strong treatment segregation on stand level, as long as the overall goal—higher wood production at the landscape level—was the same. In addition to the scenarios “business as usual,” “more intensive,” and “less intensive,” we introduced a fourth group, called “near business as usual.” In this group, we pooled all scenarios that were comparable to business as usual in terms of management intensity, but resulted from another policy framework, which was not defined as the respective case study’s business as usual. This grouping resulted in 20 “business as usual,” 25 “less intensive,” 32 “more intensive,” and eight “near business as usual” scenarios (
Table 5).
Table 5.
Number of calculated scenarios by scenario category, country, and case study area (CSA).
Table 5.
Number of calculated scenarios by scenario category, country, and case study area (CSA).
| | | # of Scenarios in Scenario Category |
|---|
| Country | CSA-Acronym | Business as Usual | Near b.a.u. | Less Intensive | More Intensive |
|---|
| Bulgaria | TET | 1 | 0 | 1 | 1 |
| Bulgaria | YUN | 1 | 0 | 1 | 1 |
| France | PON | 1 | 1 | 2 | 2 |
| Germany | MUN | 1 | 0 | 2 | 1 |
| Germany | UPP | 1 | 0 | 1 | 2 |
| Ireland | NEW | 1 | 0 | 2 | 1 |
| Ireland | WES | 1 | 1 | 0 | 3 |
| Italy | ASI | 1 | 0 | 1 | 3 |
| Italy | ETN | 1 | 1 | 3 | 2 |
| Italy | MOL | 1 | 0 | 1 | 2 |
| Lithuania | KAZ | 1 | 0 | 1 | 2 |
| Lithuania | ZEM | 1 | 0 | 1 | 2 |
| Netherlands | SEV | 1 | 1 | 1 | 2 |
| Portugal | CHA | 1 | 1 | 0 | 2 |
| Portugal | LEI | 1 | 1 | 0 | 2 |
| Portugal | SOU | 1 | 1 | 2 | 0 |
| Slovakia | KYS | 1 | 0 | 2 | 0 |
| Slovakia | POD | 1 | 0 | 1 | 1 |
| Sweden | HEL | 1 | 1 | 1 | 2 |
| Sweden | VIL | 1 | 0 | 2 | 1 |
| Sum | | 20 | 8 | 25 | 32 |
It is important to keep in mind that an overall reference scenario does not make sense. The case study-specific business as usual scenarios strongly reflect each country’s or forest region’s socioeconomic frame conditions for forestry. Evidently, they also depend on the current forest state in each case study area, which results from long-term feedback between the social economy and the forest state itself. The second INTEGRAL policy brief [
10] denominates the socioeconomic context for each forest region, which ranges from “commodity-oriented forestry driven by strong forest industry, large forest area and globalized wood market” in Northern Europe to “amenity-oriented forestry influenced by small forest areas und urban society demands” in Western Europe (see
Table 6 for a complete list).
2.5. Scenario Result Consolidation
As each country or case study had its own indices for given ecosystem services, a cross-country comparison based on the direct simulation results was not feasible. Instead, based on the expertise of each contributing research team, we classified each ecosystem service’s value on landscape level obtained at the end of a scenario simulation along an ordinal scale, expressed through the symbols “--”, “−”, “0”, “+”, “++”. Here, “0” means no meaningful change compared to the initial situation. The signs “+” and “−”, by contrast, indicate an increase or decrease, respectively, which is considered meaningful for the stakeholders in the case study area of interest, and “++” and “--” symbolize an increase or decrease that is considered particularly strong in the case study’s context. While inevitably losing quantitative information, this scaling overcomes the problem that in different regions meaningful changes of the same ecosystem service might imply different orders of magnitude.
Table 6.
European forest regions, their current socioeconomic context, and representative countries in this study. Adapted from the 2nd INTEGRAL policy brief [
10].
Table 6.
European forest regions, their current socioeconomic context, and representative countries in this study. Adapted from the 2nd INTEGRAL policy brief [10].
| Forest Region | Socioeconomic Context | Representative Countries |
|---|
| Eastern Europe | commodity-oriented forestry driven by transition to market economy, moderate role of forest industry and relatively large forest areas | Bulgaria, Lithuania, Slovakia |
| Central Western Europe | multifunctional forestry driven by a pluralistic society, market economy, moderate forest areas, and moderate role of forest industry | France, Germany |
| North Western Europe | plantation-oriented forestry driven by small forest area and market economy | Ireland |
| Southern Europe | partly low forest management driven by primacy of non-wood products and natural risks; partly plantation-oriented forestry driven by property fragmentation, forest industry, market economy, and natural risks | Italy, Portugal |
| Western Europe | amenity-oriented forestry influenced by small forest areas und urban society demands | The Netherlands |
| Northern Europe | commodity-oriented forestry driven by strong forest industry, large forest area, and globalized wood market | Sweden |
The classification was performed in a combined bottom-up/top-down-approach. We communicated the above classification scheme to the contributing teams, and they reported their classification as well as the corresponding numerical simulation output. During the consolidation process we carefully checked and compared all group reports and called back in case of potential incongruities. Most important for the subsequent analyses was the comparison of the non-business-as-usual scenario outcomes with the related business as usual scenario. To this end, we assigned the numerical values −2, −1, 0, 1, and 2 to the ordinal scale “--”, “−”, “0”, “+”, and “++” in exactly this order. From each numerical ecosystem service value obtained in a given scenario we subtracted the corresponding business as usual value (e.g., subtracting “++” from “−” means −1 − 2 = −3, indicating a strong decrease in a given ecosystem service’s provision compared to business as usual). In order to avoid pseudo-precision, all such results greater or smaller than zero were assigned “+” or “−”, respectively, and all zero results were marked with “0.” Thus, “+” and “−” express a meaningful increase or decrease of an ecosystem service compared to business as usual at the end of the simulation time span, while “0” indicates no momentous difference.
2.6. Evaluating the Consolidated Results
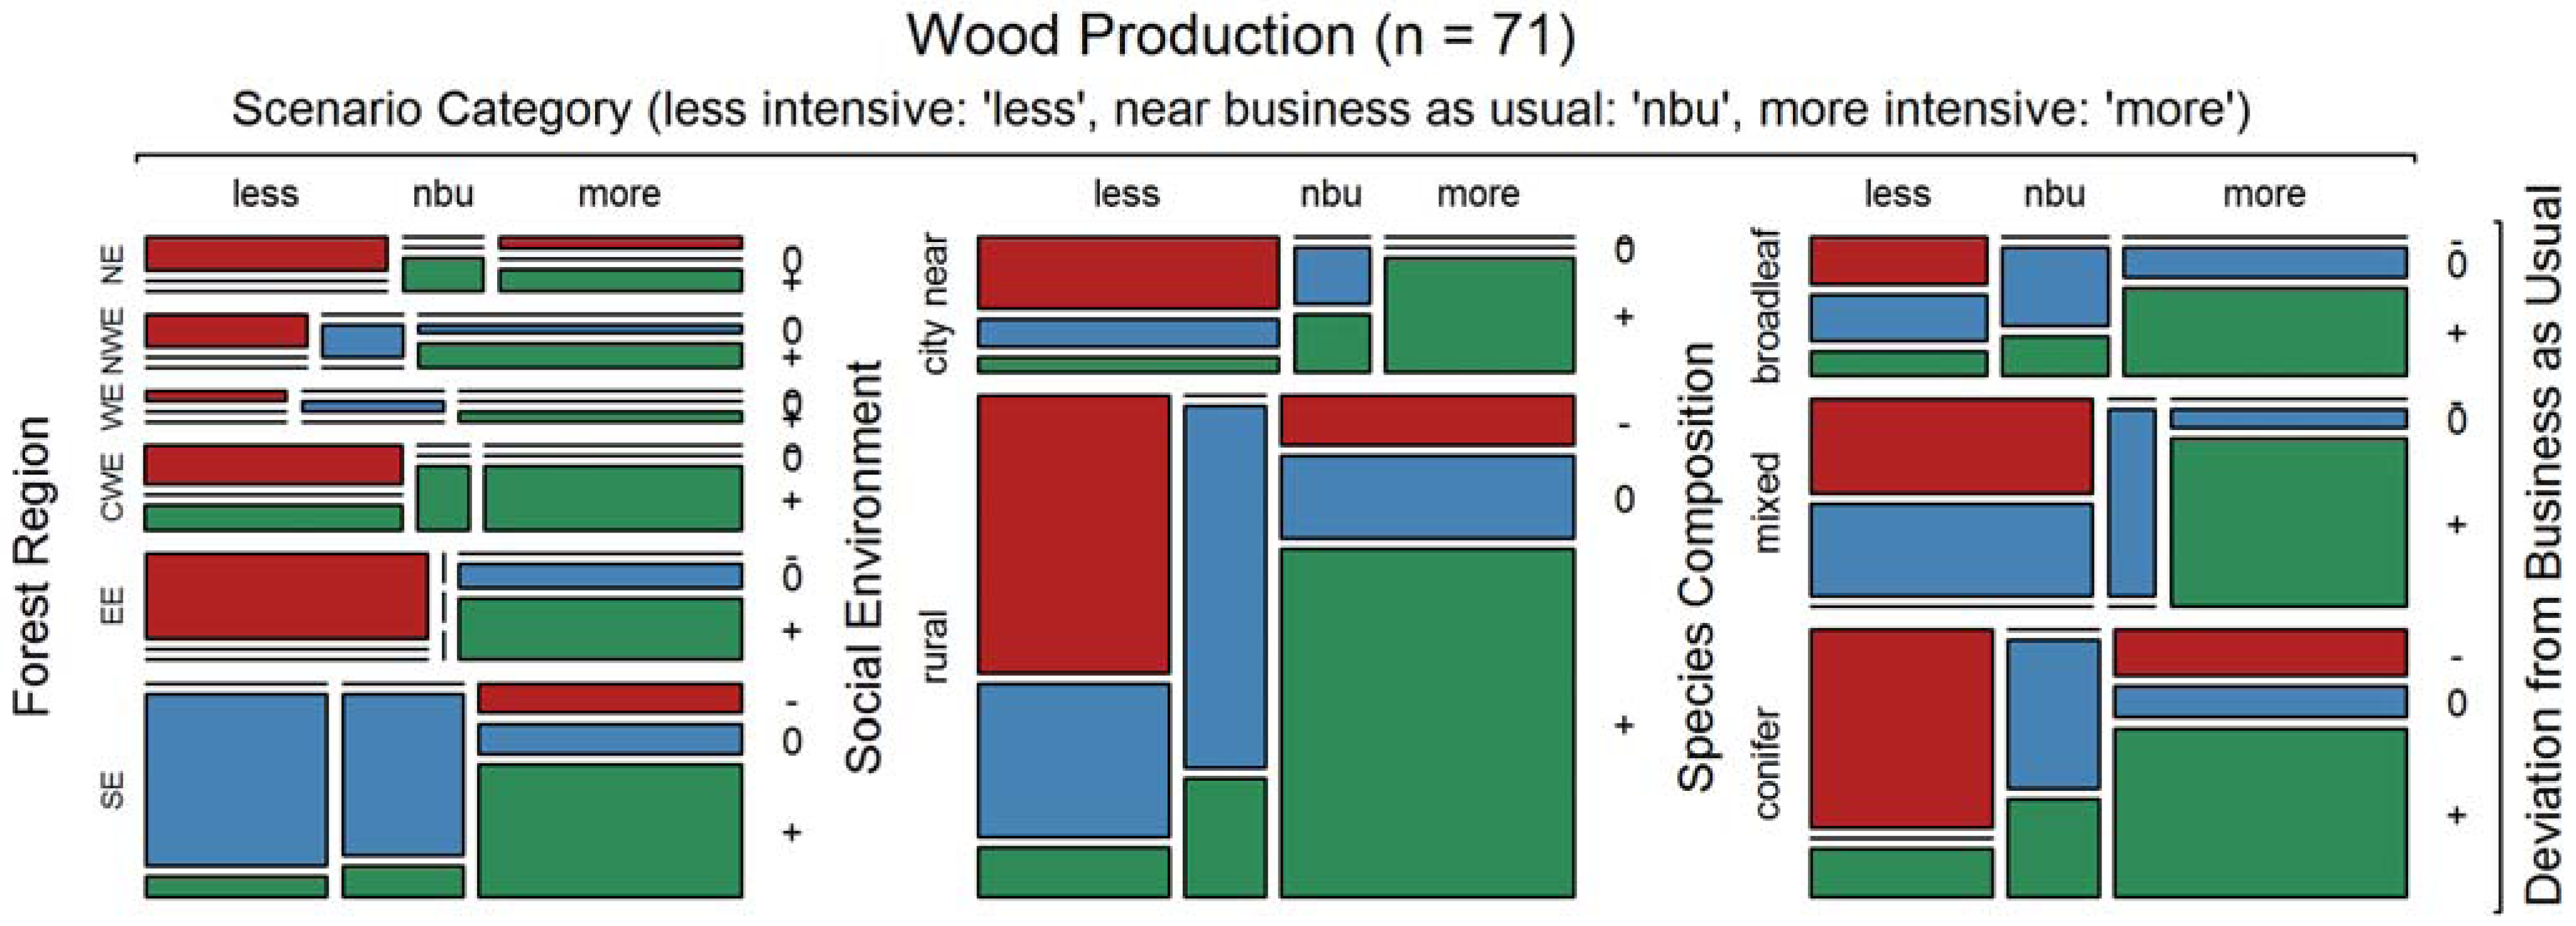
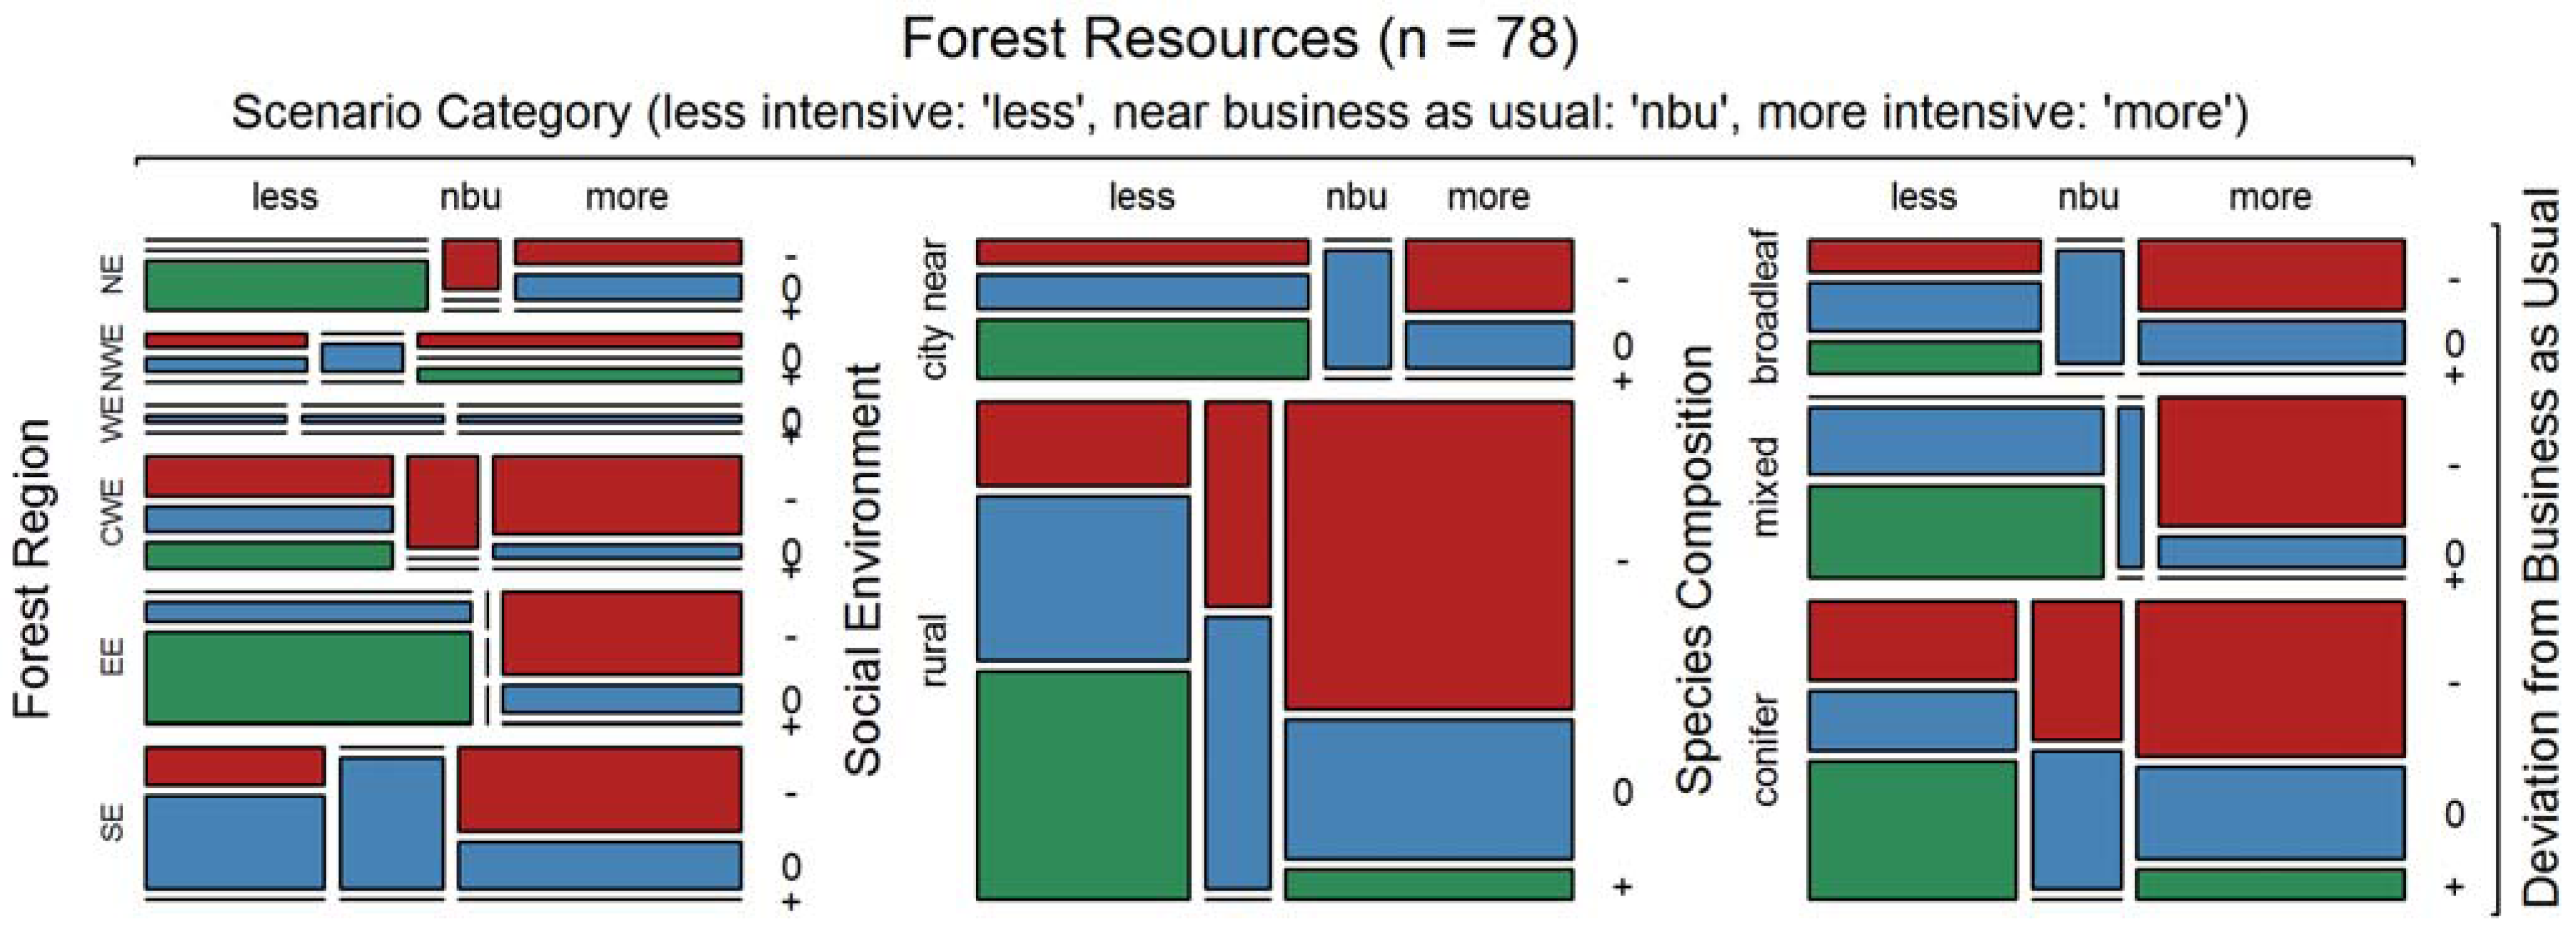
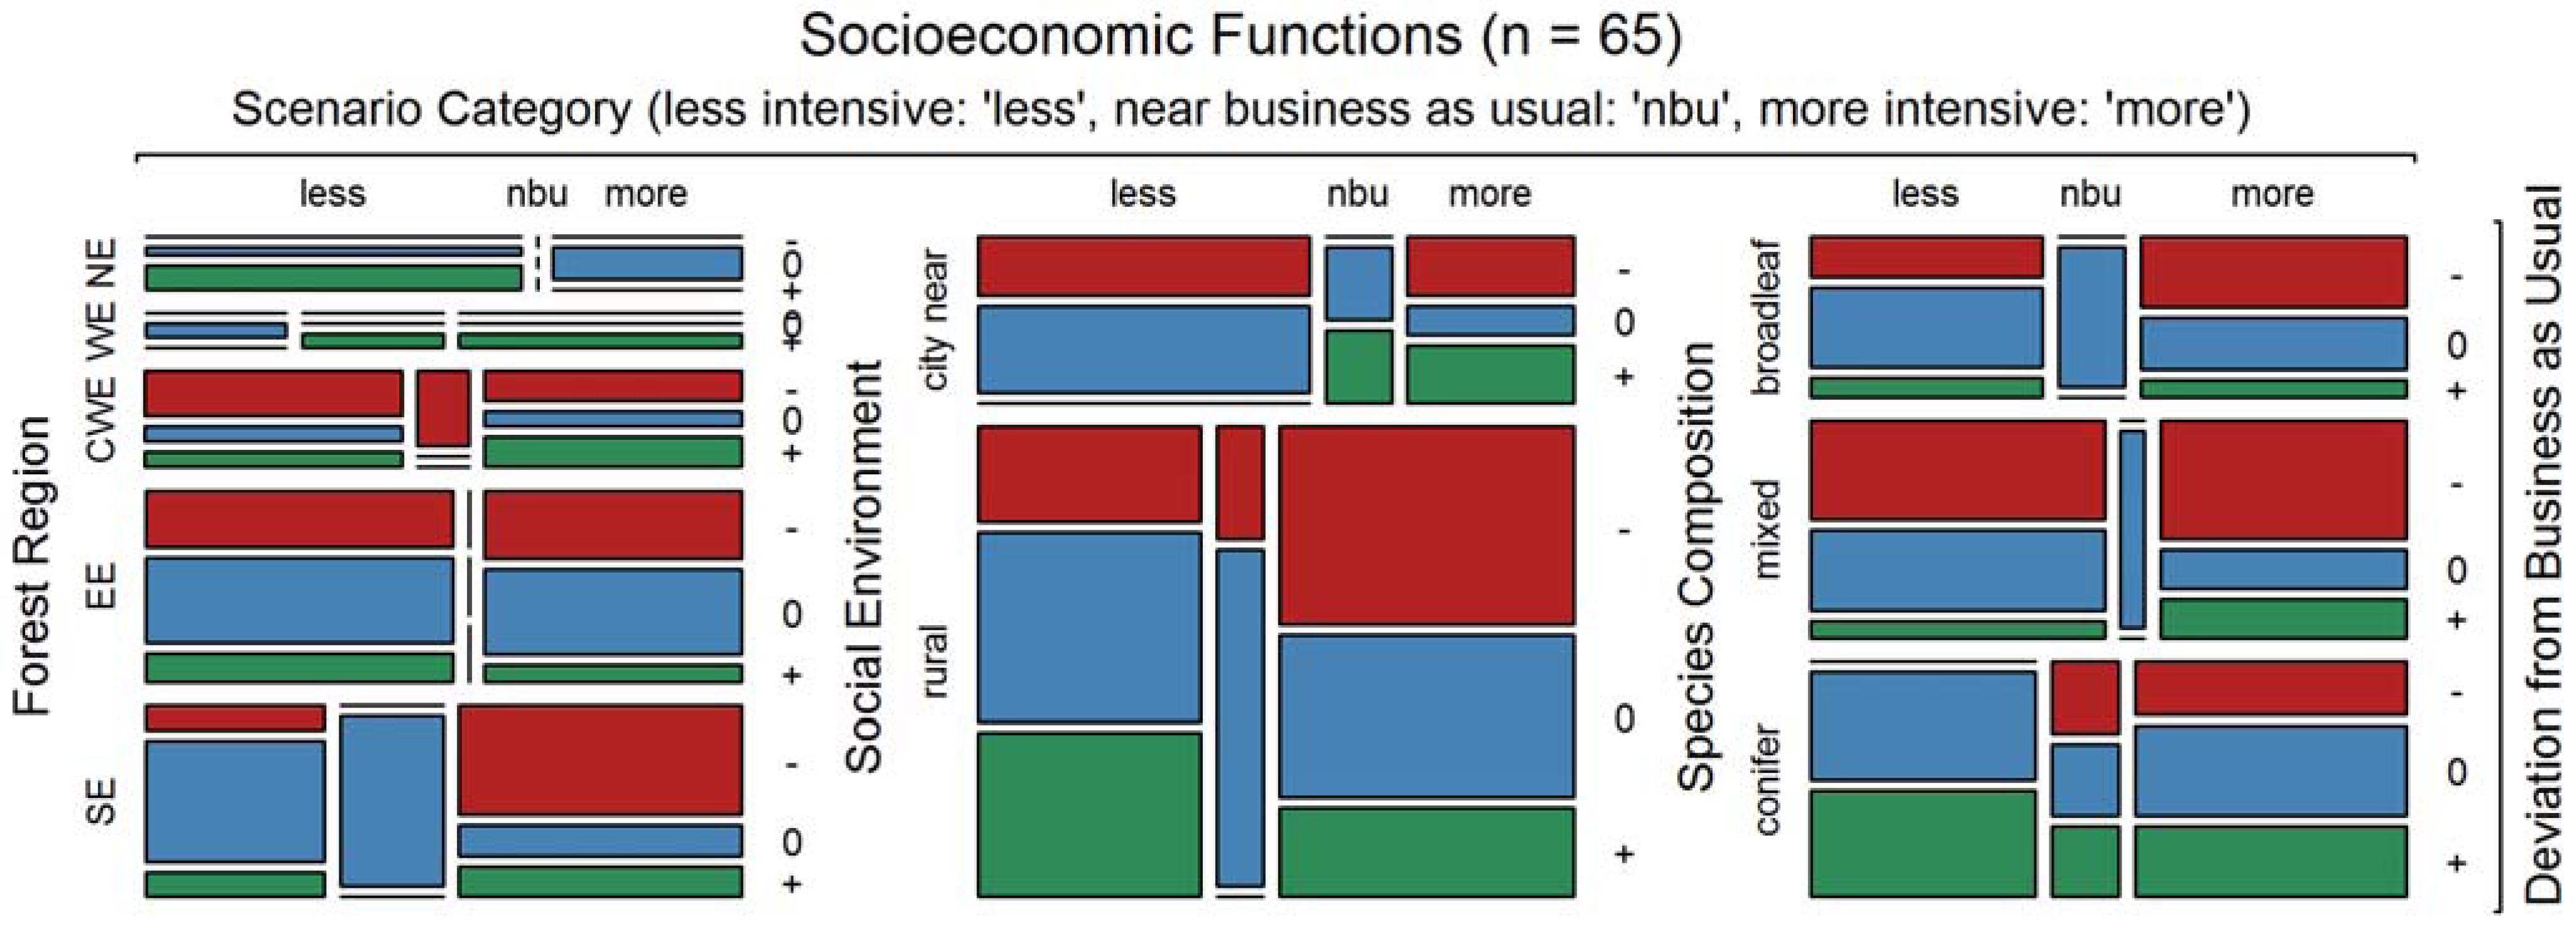
Given the consolidated scenario outcomes described above, it was possible to scrutinize them for influences of the management scenario groups as defined above (“more intensive,” “less intensive,” “near business as usual”) on ecosystem service provision. Hereby the ecosystem services were grouped according to both the Helsinki criteria and the FORSYS-classification (see 2.2). In this context, ecosystem service provision is always understood as deviation from business as usual.
The case study-specific covariables forest region, species composition, and social environment were considered as well. Although technically possible, we refrained from testing effects statistically, as the simulation outcomes are not empirical but modeled data. As the backbone of our descriptive analysis we chose mosaic plots [
30] as implemented in the R-package vcd [
31]. A mosaic plot’s total area (
Figure 4 may be taken as an example) represents the total amount of observations taken into account. This area is divided into tiles that display a specific combination of categorical properties (like scenario category, social environment,
etc. in
Figure 4) each. Each tile’s area represents the number of observations inside such a property combination. See
Supplementary Information 1 for a detailed explanation of how to read mosaic plots.
4. Discussion
Based on 20 case study areas throughout Europe, this study comes to statements about the relative importance of given ecosystem service categories and their sensitivity to the intensity of forest management. The latter was analyzed in the context of the covariables forest region, social environment, and species composition. Although these covariables partly correlate and thus must be interpreted with care, this allows us to make conclusions about management steering possibilities, tradeoffs and synergies, in terms of different ecosystem services’ provision, as presented above.
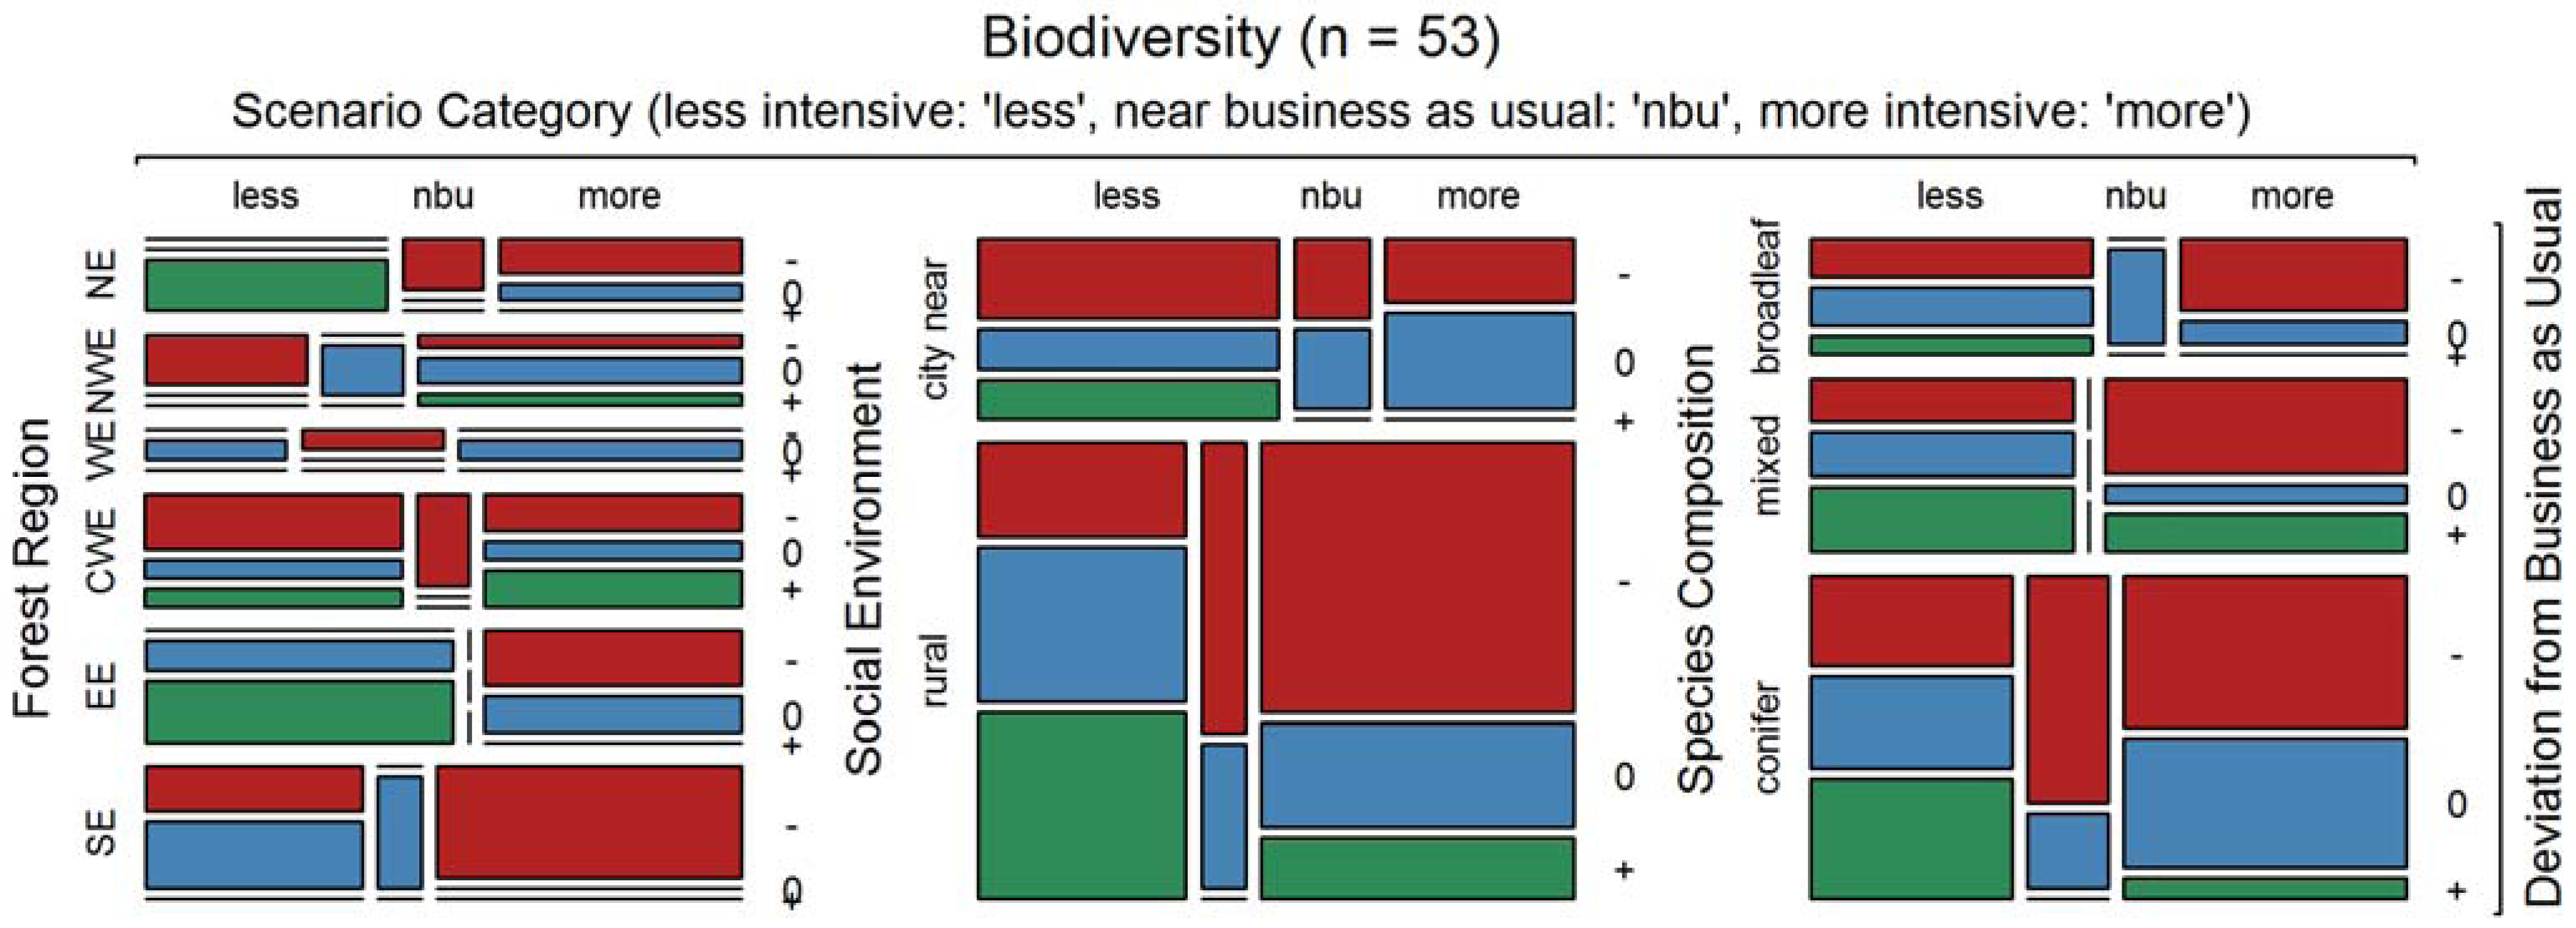
The ecosystem service categories that show a strong sensitivity to management intensity are wood production/market wood products (positive correlation), forest resources (negative correlation), and biodiversity. Surprisingly, biodiversity can react in both ways to management, negatively or positively. The latter finding agrees well with a recent meta-analysis [
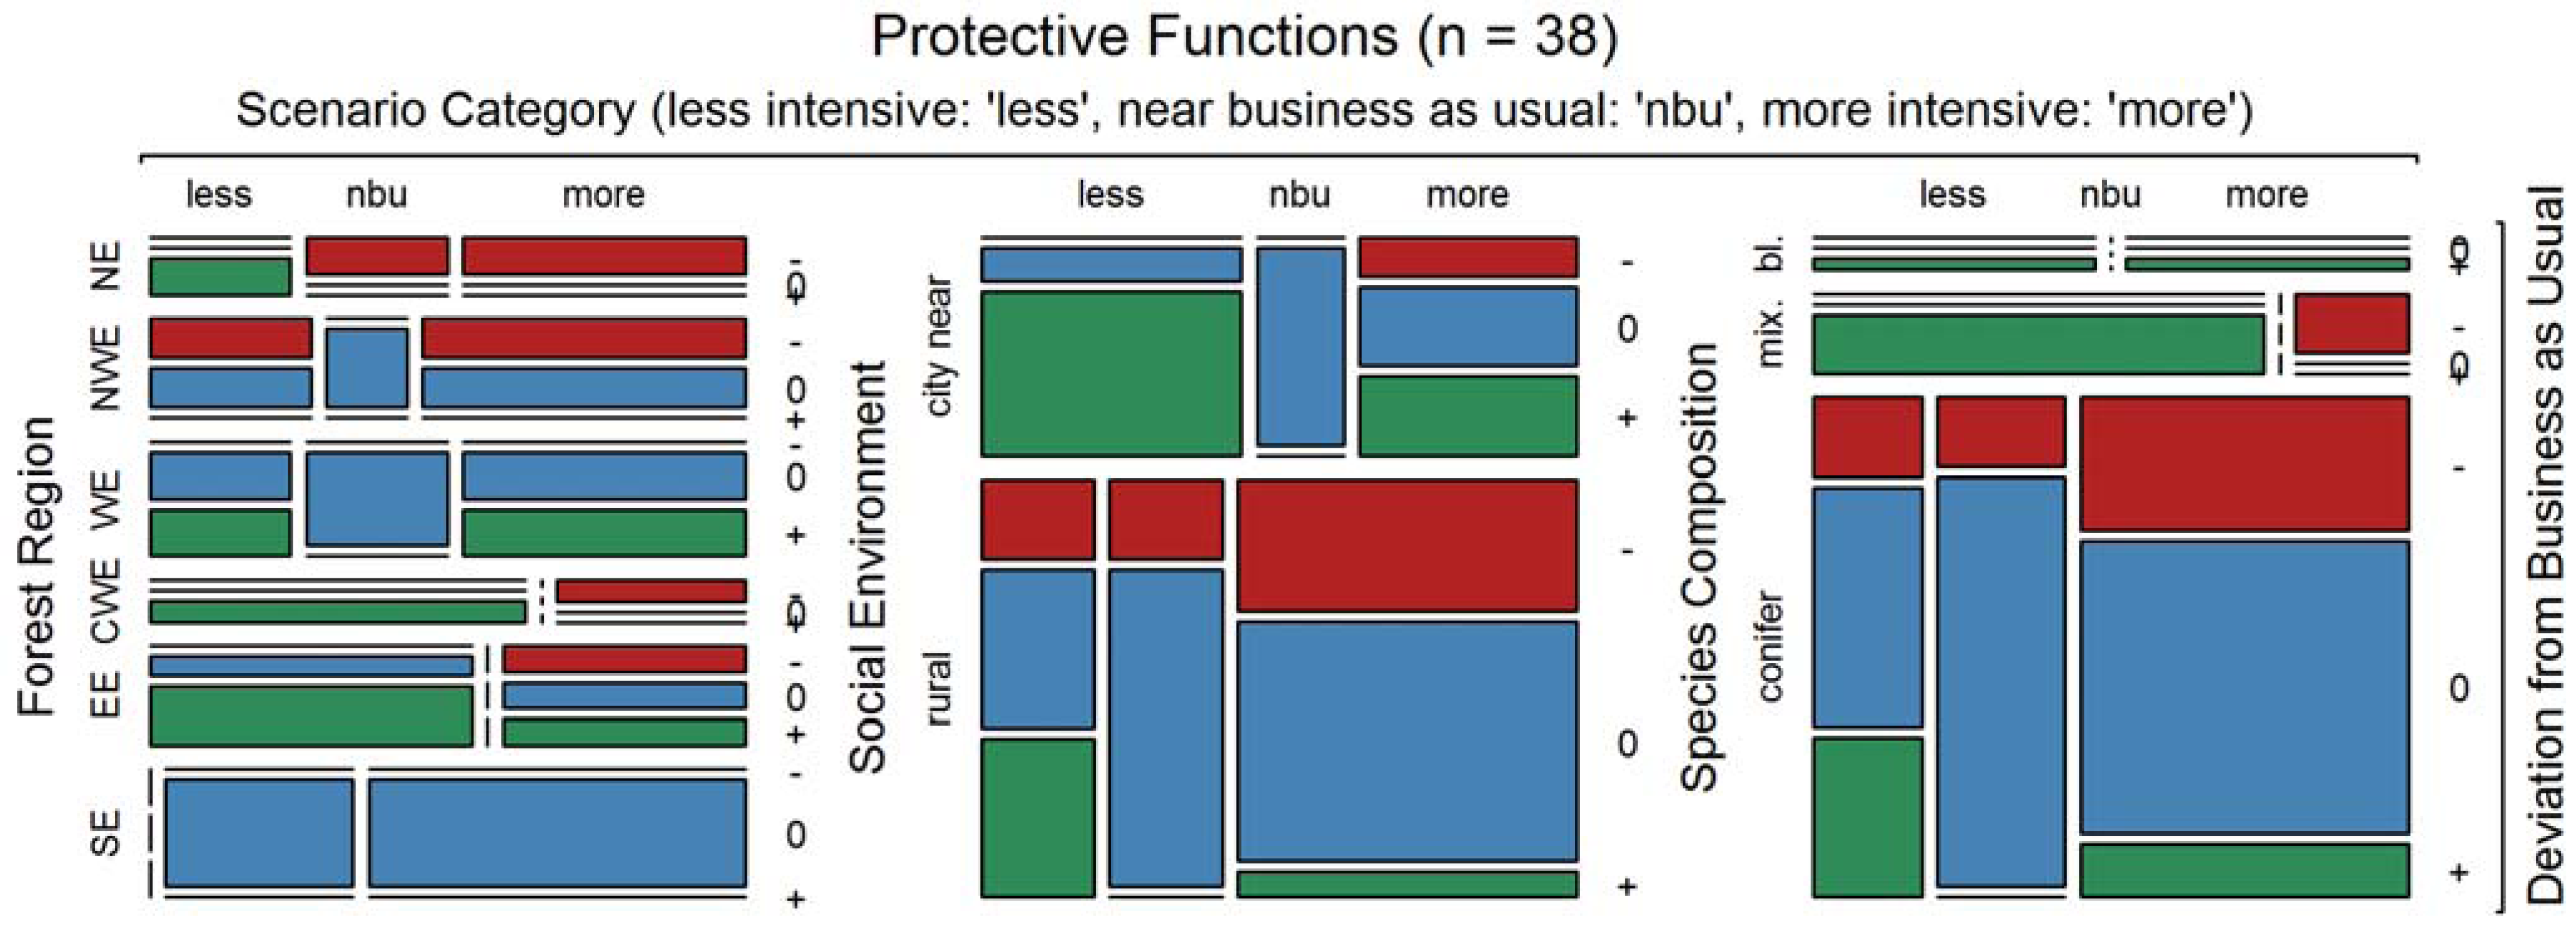
32], while the former disagrees with it. Our interpretation suggests that the former trend is prevailing in regions where the general development is from low intensity management to greater intensity, while the latter trend occurs in regions where there is a trend from plantation management to more close-to-nature forestry. Most other ecosystem service categories show only weak and negative correlations with management intensity. We could also identify different tradeoffs and synergies in the provision of different ecosystem services. A strong tradeoff exists between the maintenance of forest resources and wood production. Strong connections also exist between biodiversity and wood production and forest resources. Whether these connections are tradeoffs or synergies is region-specific. Remarkably, though, both are possible. An issue that is not fully covered by this study is the risk of calamities, especially in over-dense conifer stands, which may in some places result from low-intensity management and often bear an increased risk of storm or snow damage with subsequent insect attacks. Clearly undesired by forest owners who strive for a steady timber production, the consequences of such calamities for other ecosystem services’ provision are non-trivial.
Climate change and its possible effects were deliberately not considered in this study. The overwhelming majority of the contributing models are empirical, covering forest growth dynamics best under current climate conditions. Instead of burdening our study with the additional uncertainty of climate scenarios (cf. [
33]), we chose simulation time spans, 30 years in most cases, which seemed short enough to assume no substantially different results under changing climate. Europe-wide forest growth and management scenarios including climate change usually take into account considerably longer time frames [
4,
5]. As a recent empirical study shows [
34], past climate change (together with the fertilizing effects of increased N-immissions and CO
2 supply) has accelerated forest dynamics in Central Europe. Remarkably, though, this study hints that typical stand structures stayed virtually the same; only their progression accelerated. As most of the ecosystem services investigated in the study at hand are connected to structural forest properties, we take that as another argument for the stability of our results. To our knowledge, the study at hand is the only one covering such a broad spectrum of ecosystem services on the European level. Our outcomes, however, are not implausible in the context of other large-scale studies that focused on a smaller set of ecosystem services, often carbon budgets and wood supply, as summarized in [
7].
Besides the wide range of ecosystem services investigated, methodological heterogeneity is a characteristic of this study. The forest growth models and DSS that were applied, and the forest data that were used for defining the initial state for the scenarios, included very different approaches across the contributing countries and case studies. The same is true for the indices that were taken as a measure for a given ecosystem service’s provision. This may seem problematic in terms of comparability on the one hand. On the other hand, however, this procedure ensured that in each case study the best available models and indices were used, which exactly fit into the regionally relevant information supply and demand (cf. [
35,
36]). As each model is built for being applied to the most important tree species in a given region, we are confident that a more precise and more relevant collection of forest development scenarios across Europe can hardly be achieved at the time being. However, we do not see the study at hand as a competitor to large-scale studies with one single model [
8,
37], more as a bottom-up complement to the usual top-down approach.
In two countries, namely Bulgaria and the Netherlands, the applied models (SIBYLA [
12] and LandClim [
22], respectively) have not been developed and formally validated with data from the relating case studies. However, in terms of natural conditions the Bulgarian case study regions are inside the range of applicability of the model SIBYLA; in addition, the simulation results were examined for plausibility and approved by local experts. The model LandClim is a process-based model that covers a broad range of natural conditions including the case study area where it has been applied, South East Veluwe. See
Supplementary Information 3 for more details and literature.
It is important to state that the calculated management scenarios were not initially defined in order to assess ecosystem service provision against management intensity. They were derived from case study-specific societal and policy framework scenarios considered to drive forest managers’ behavior [
9,
12]. As such, they result from a so far rather unique collaboration between social scientists and forest growth and management modelers. Their definition, based on local stakeholder workshops as well as locally experienced social and natural scientists, ensured that the scenarios stayed in a plausible and therefore useful framework. However, aggregating the scenarios by treatment intensity as defined above for the purpose of this study turned out to be a straightforward procedure. Our confidence in this grouping is supported by the absolutely plausible behavior of wood production when related to treatment intensity.
As another important point to mention, the case study areas were not selected with the purpose of being representative in the sense of a forest inventory. Instead, the most important selection criterion was relevance for the respective country. Therefore, the case study areas represent situations where typical and relevant problems have to be dealt with. This fits well with the choice of models, indices, and data as discussed above. From that point of view, our study’s most prominent weakness—heterogeneity in methods and data—might be its most prominent strength.
5. Conclusions
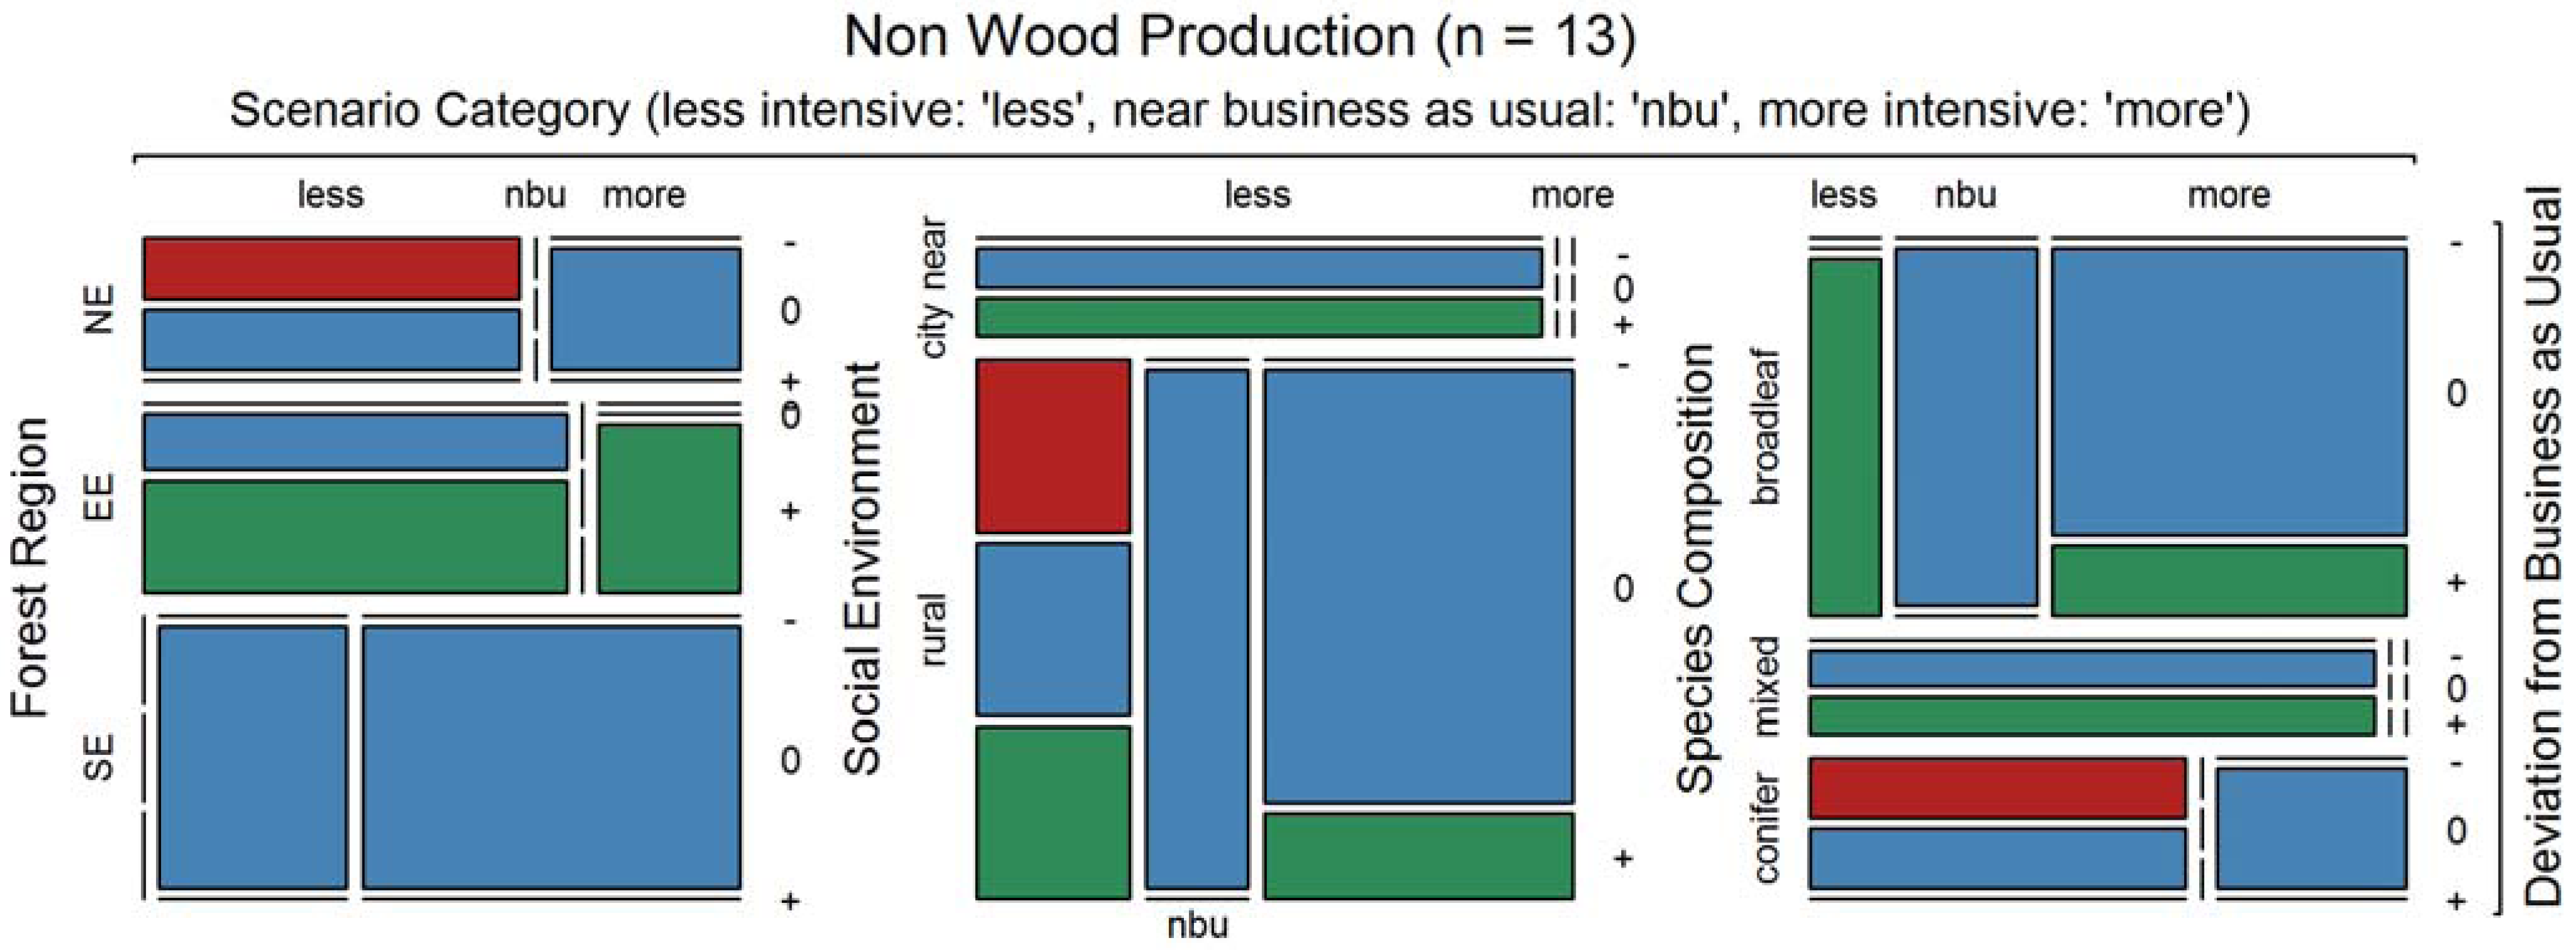
At the European level, ecosystem service steering potential by forest management seems to be highest for wood production, forest resources, and biodiversity. Non-wood production, by contrast, where regional differences are high and our information base is smallest, seems to be very elastic when related to management intensity, at least as seen from a pan-European perspective. Strong tradeoffs were observed between the stocks of forest resources and wood production. Biodiversity may both, be in a strong tradeoff or in synergy with wood production, depending on a given region’s forest conditions and history. Except for non-wood production, almost any other ecosystem service group shows a weak tradeoff with wood production. The covariables species composition and social environment are of punctual interest only, while forest region often makes an important difference in terms of an ecosystem service’s treatment sensitivity. This confirms region-specific approaches to forest management in Europe.
Concerning the choice of methods, the coherent results of this study seem to justify a subsidiary approach—upscaling from local tools and data to the European level.


 ,
, 


