

Utilizing Random Forest with iForest-Based Outlier Detection and SMOTE to Detect Movement and Direction of RFID Tags

 , ,
, ,  ,
, 
Abstract
:1. Introduction
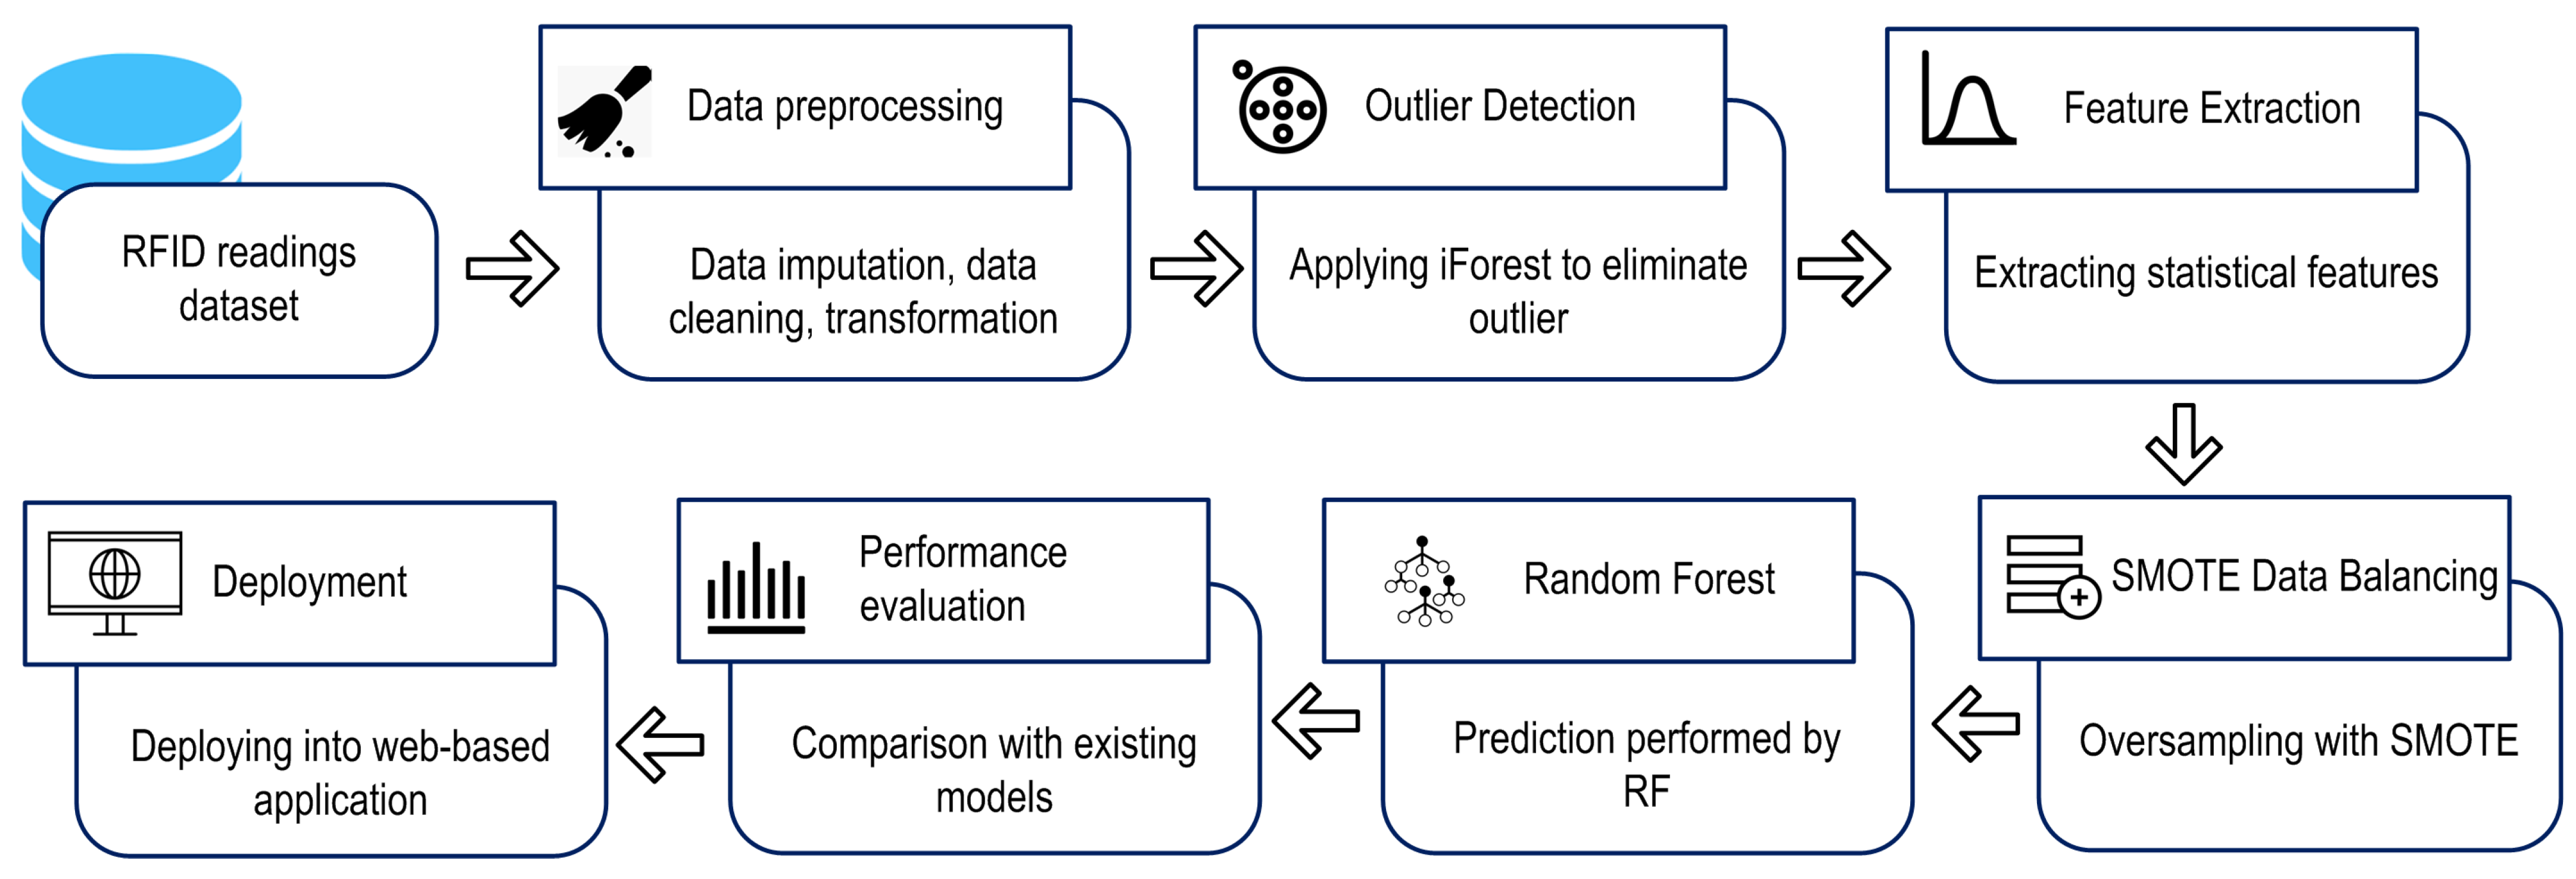
- We proposed a combined method of iForest outlier detection, SMOTE data balancing and Random Forest to classify movements and directions of RFID tags, which has never been done before.
- We evaluated the performance of the proposed prediction model on our dataset by considering more complex movements and directions of RFID tags that can happen in real warehouse environments.
- We improved the performance of the proposed model by removing the outlier and balancing the training-set.
- We conducted extensive comparative experiments on the proposed model with other prediction models and previous study results.
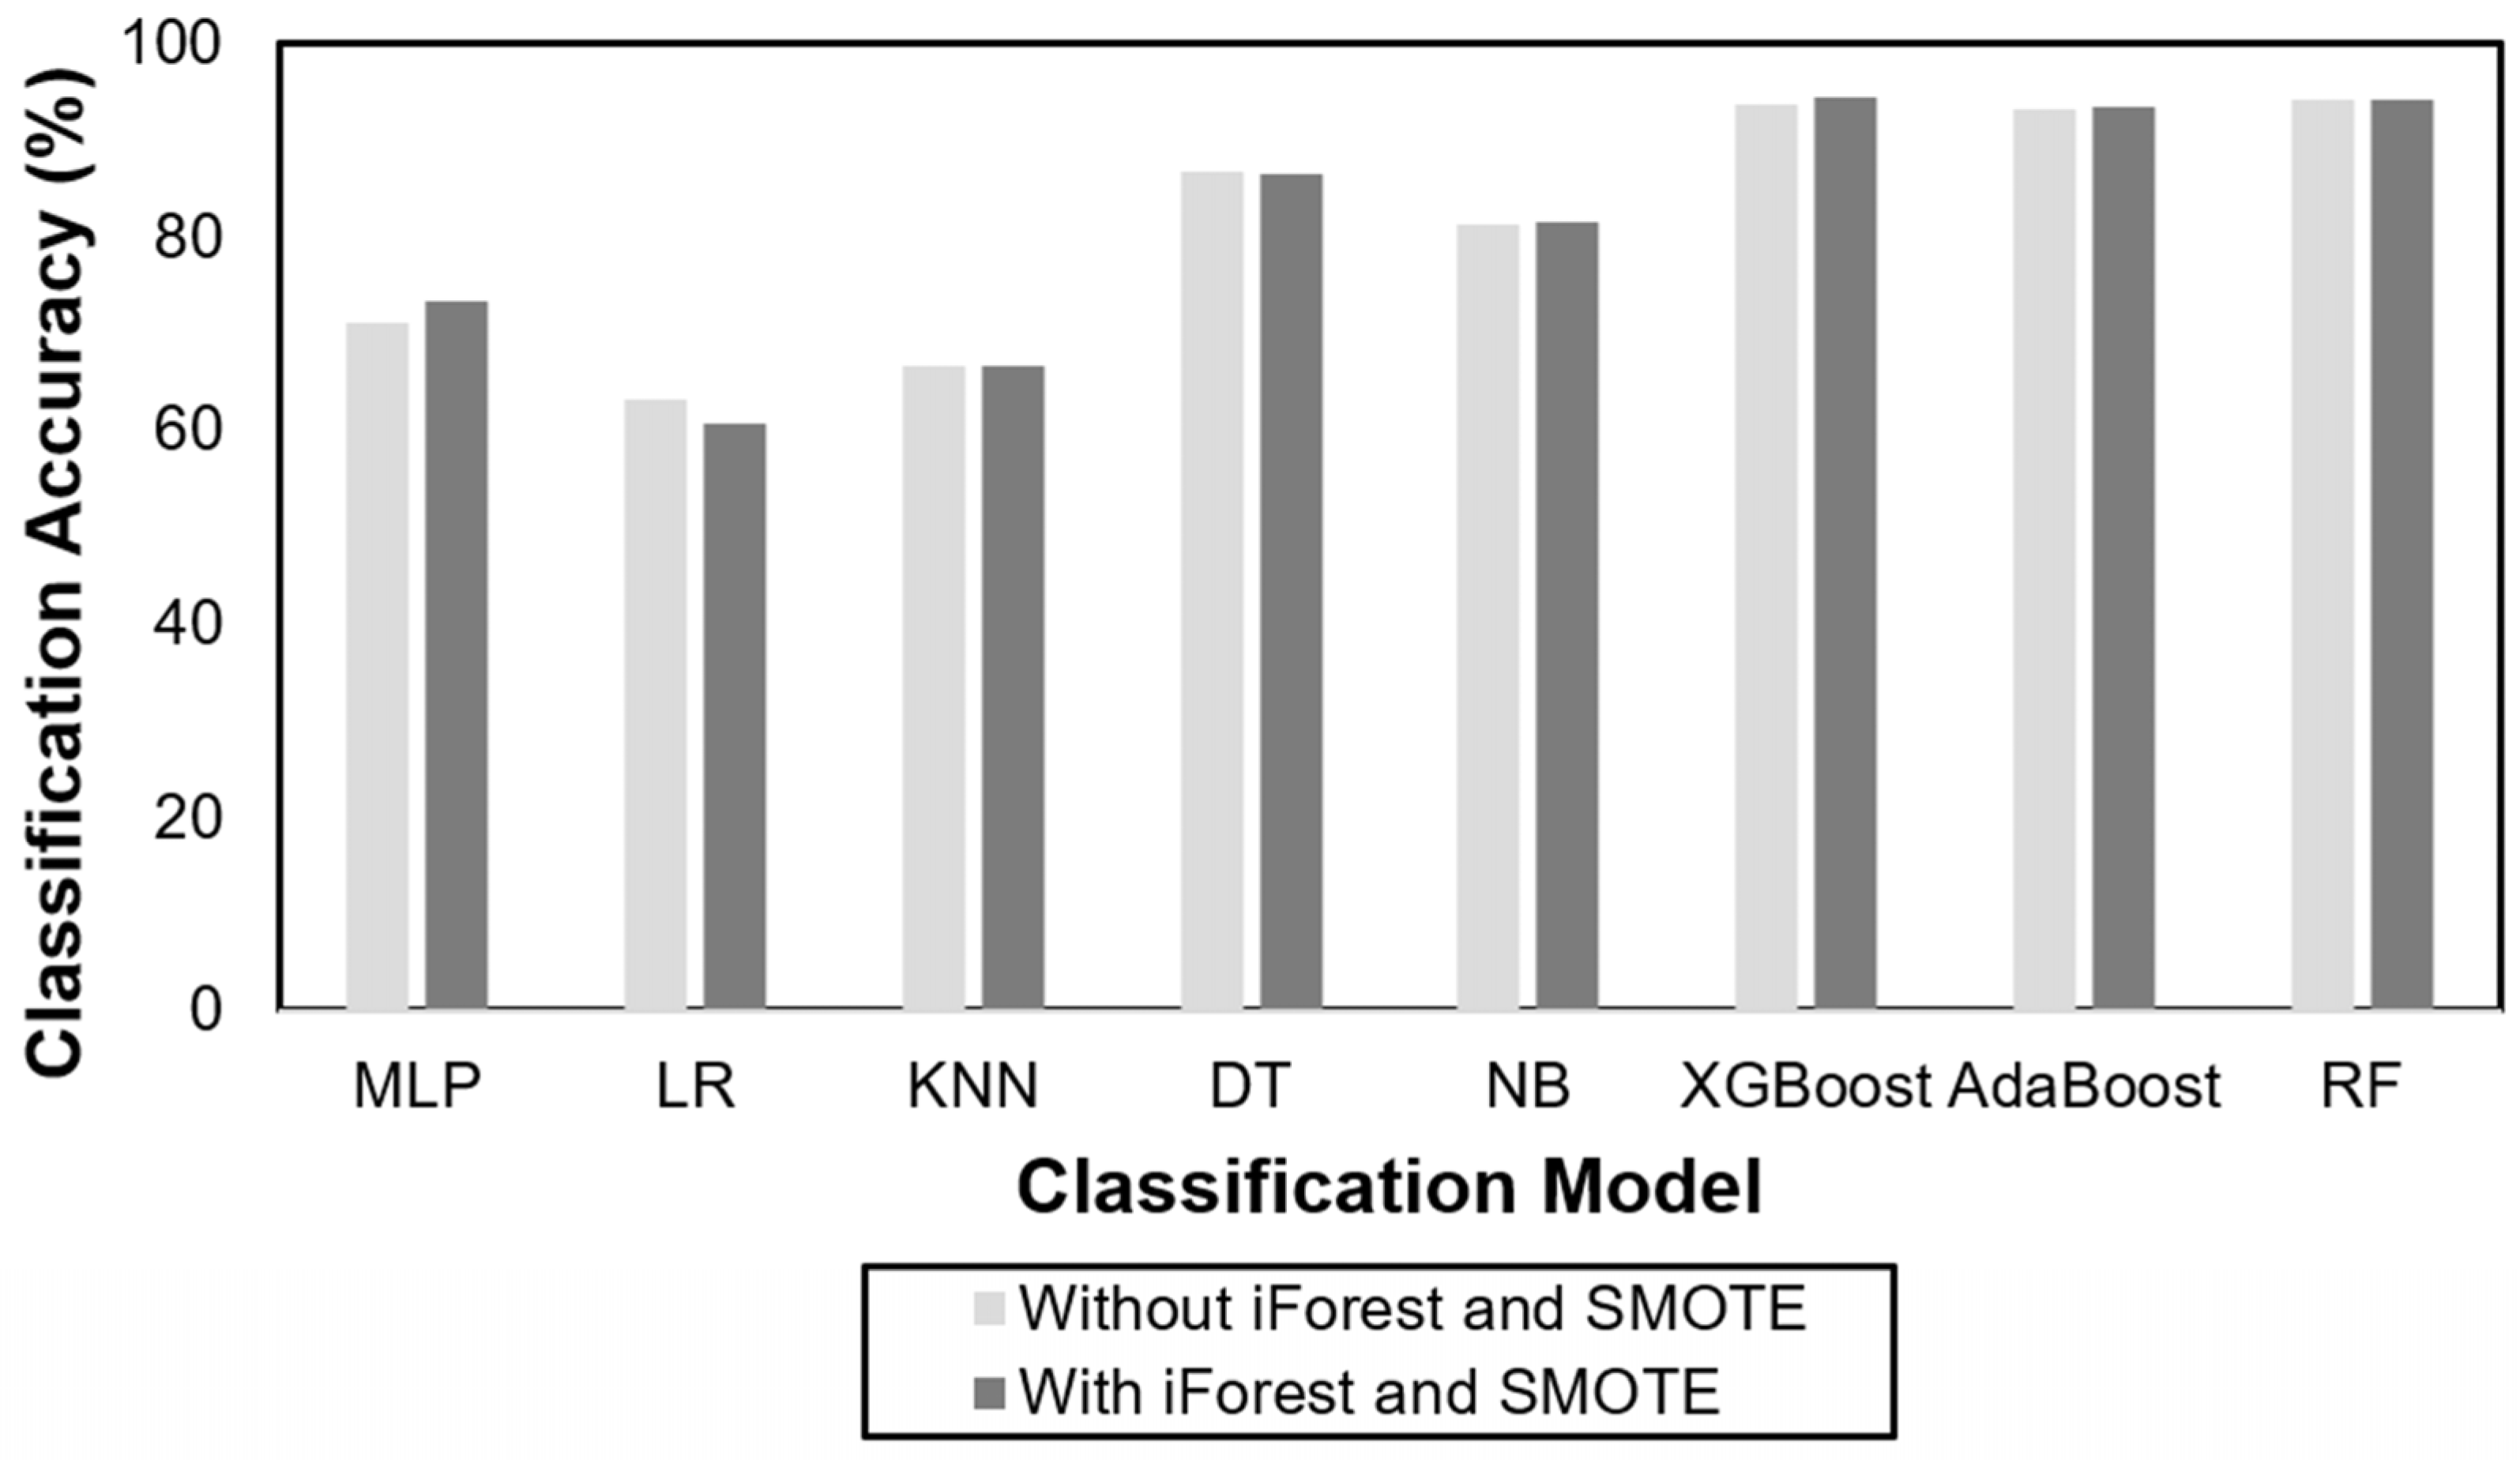
- We provided the impact analysis of outlier detection and data balancing method with or without iForest and SMOTE toward model’s accuracy performance.
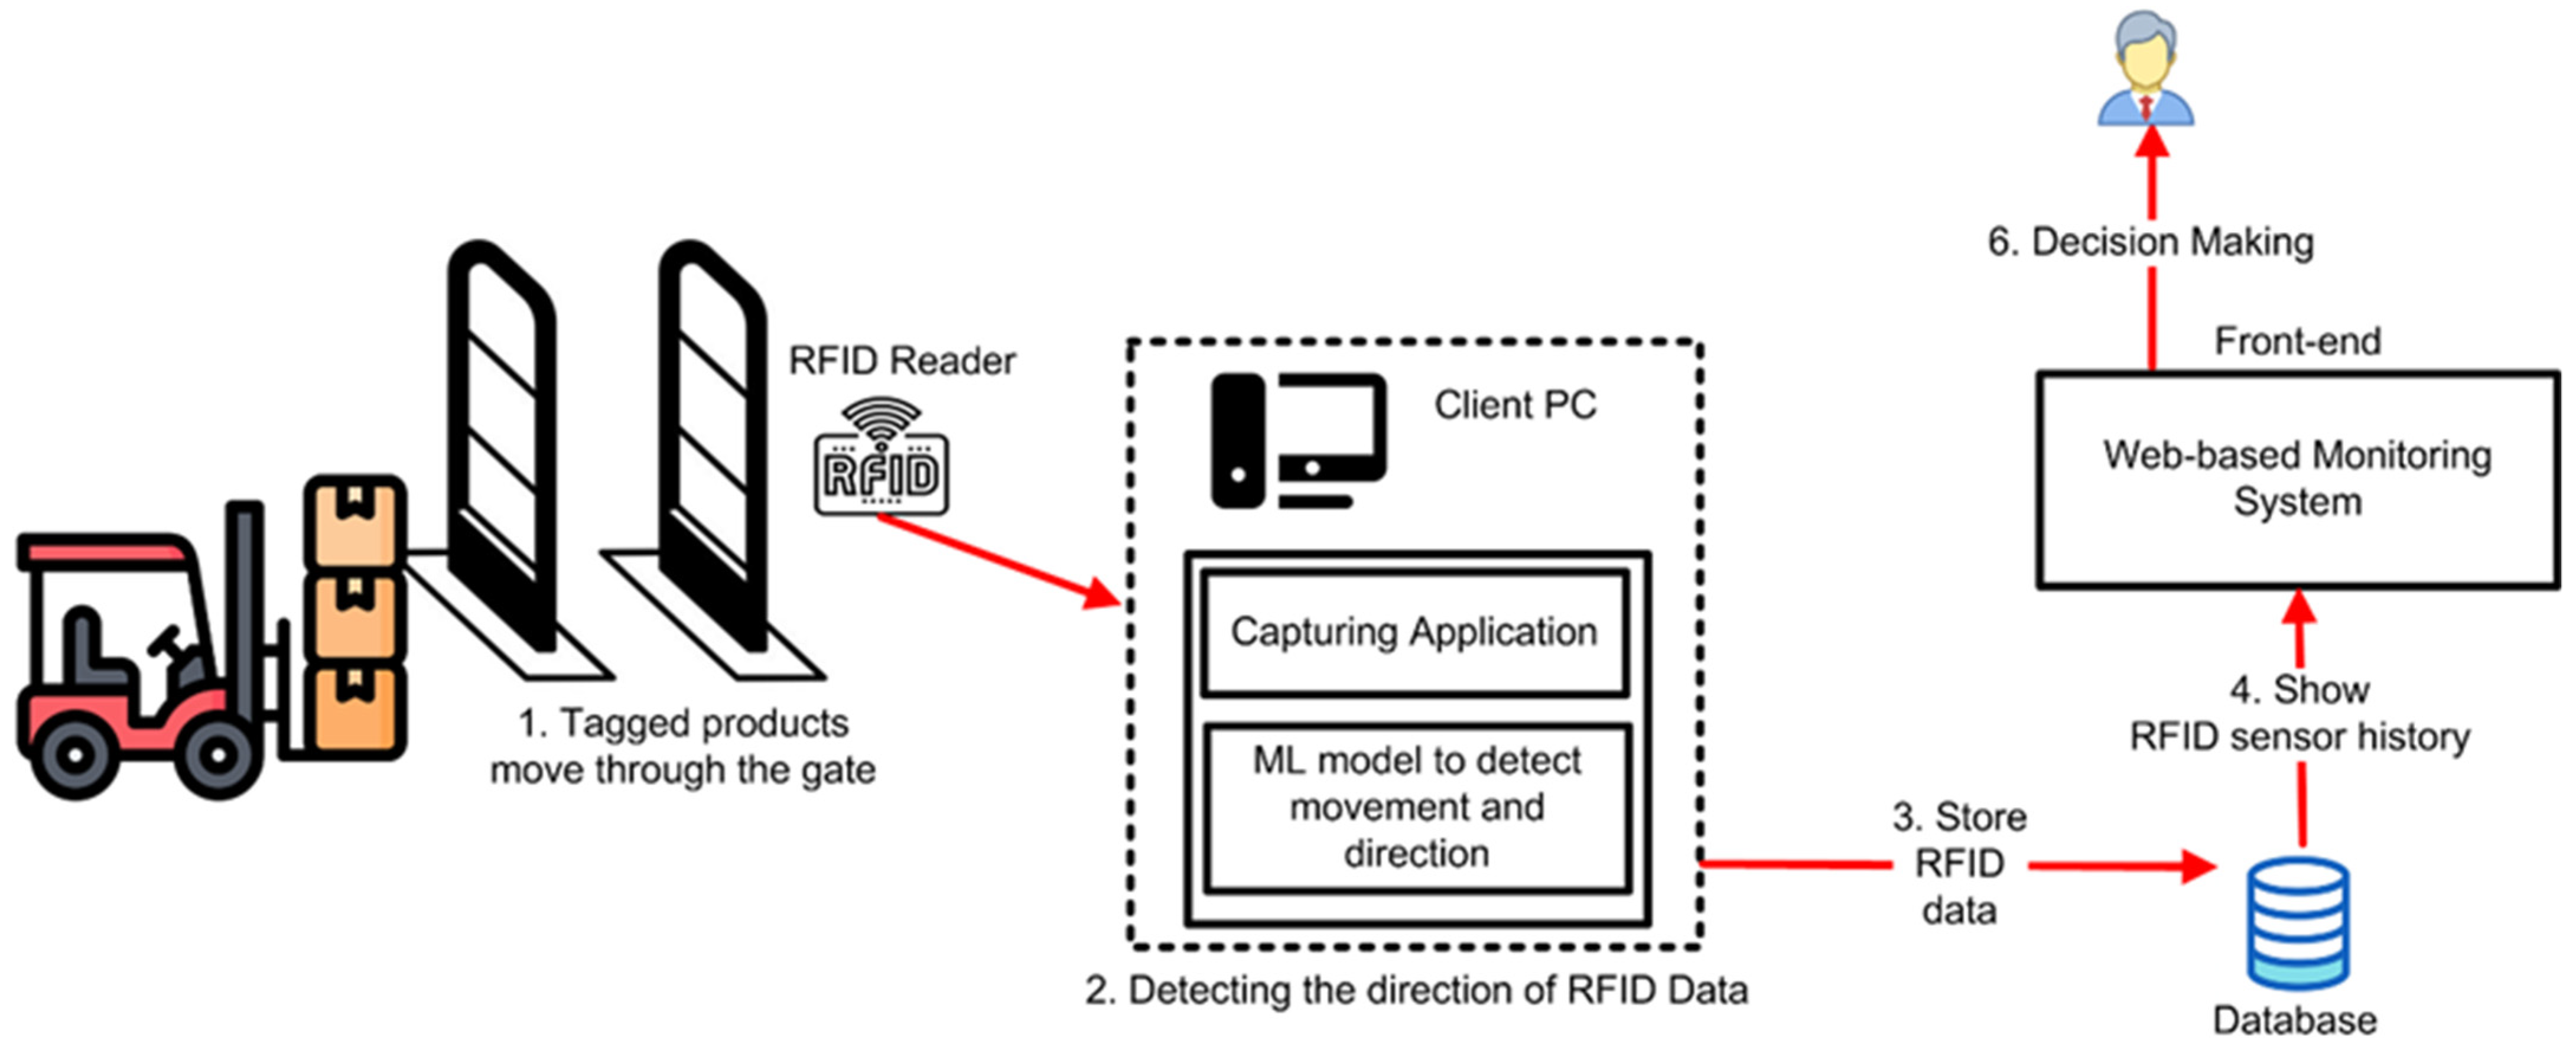
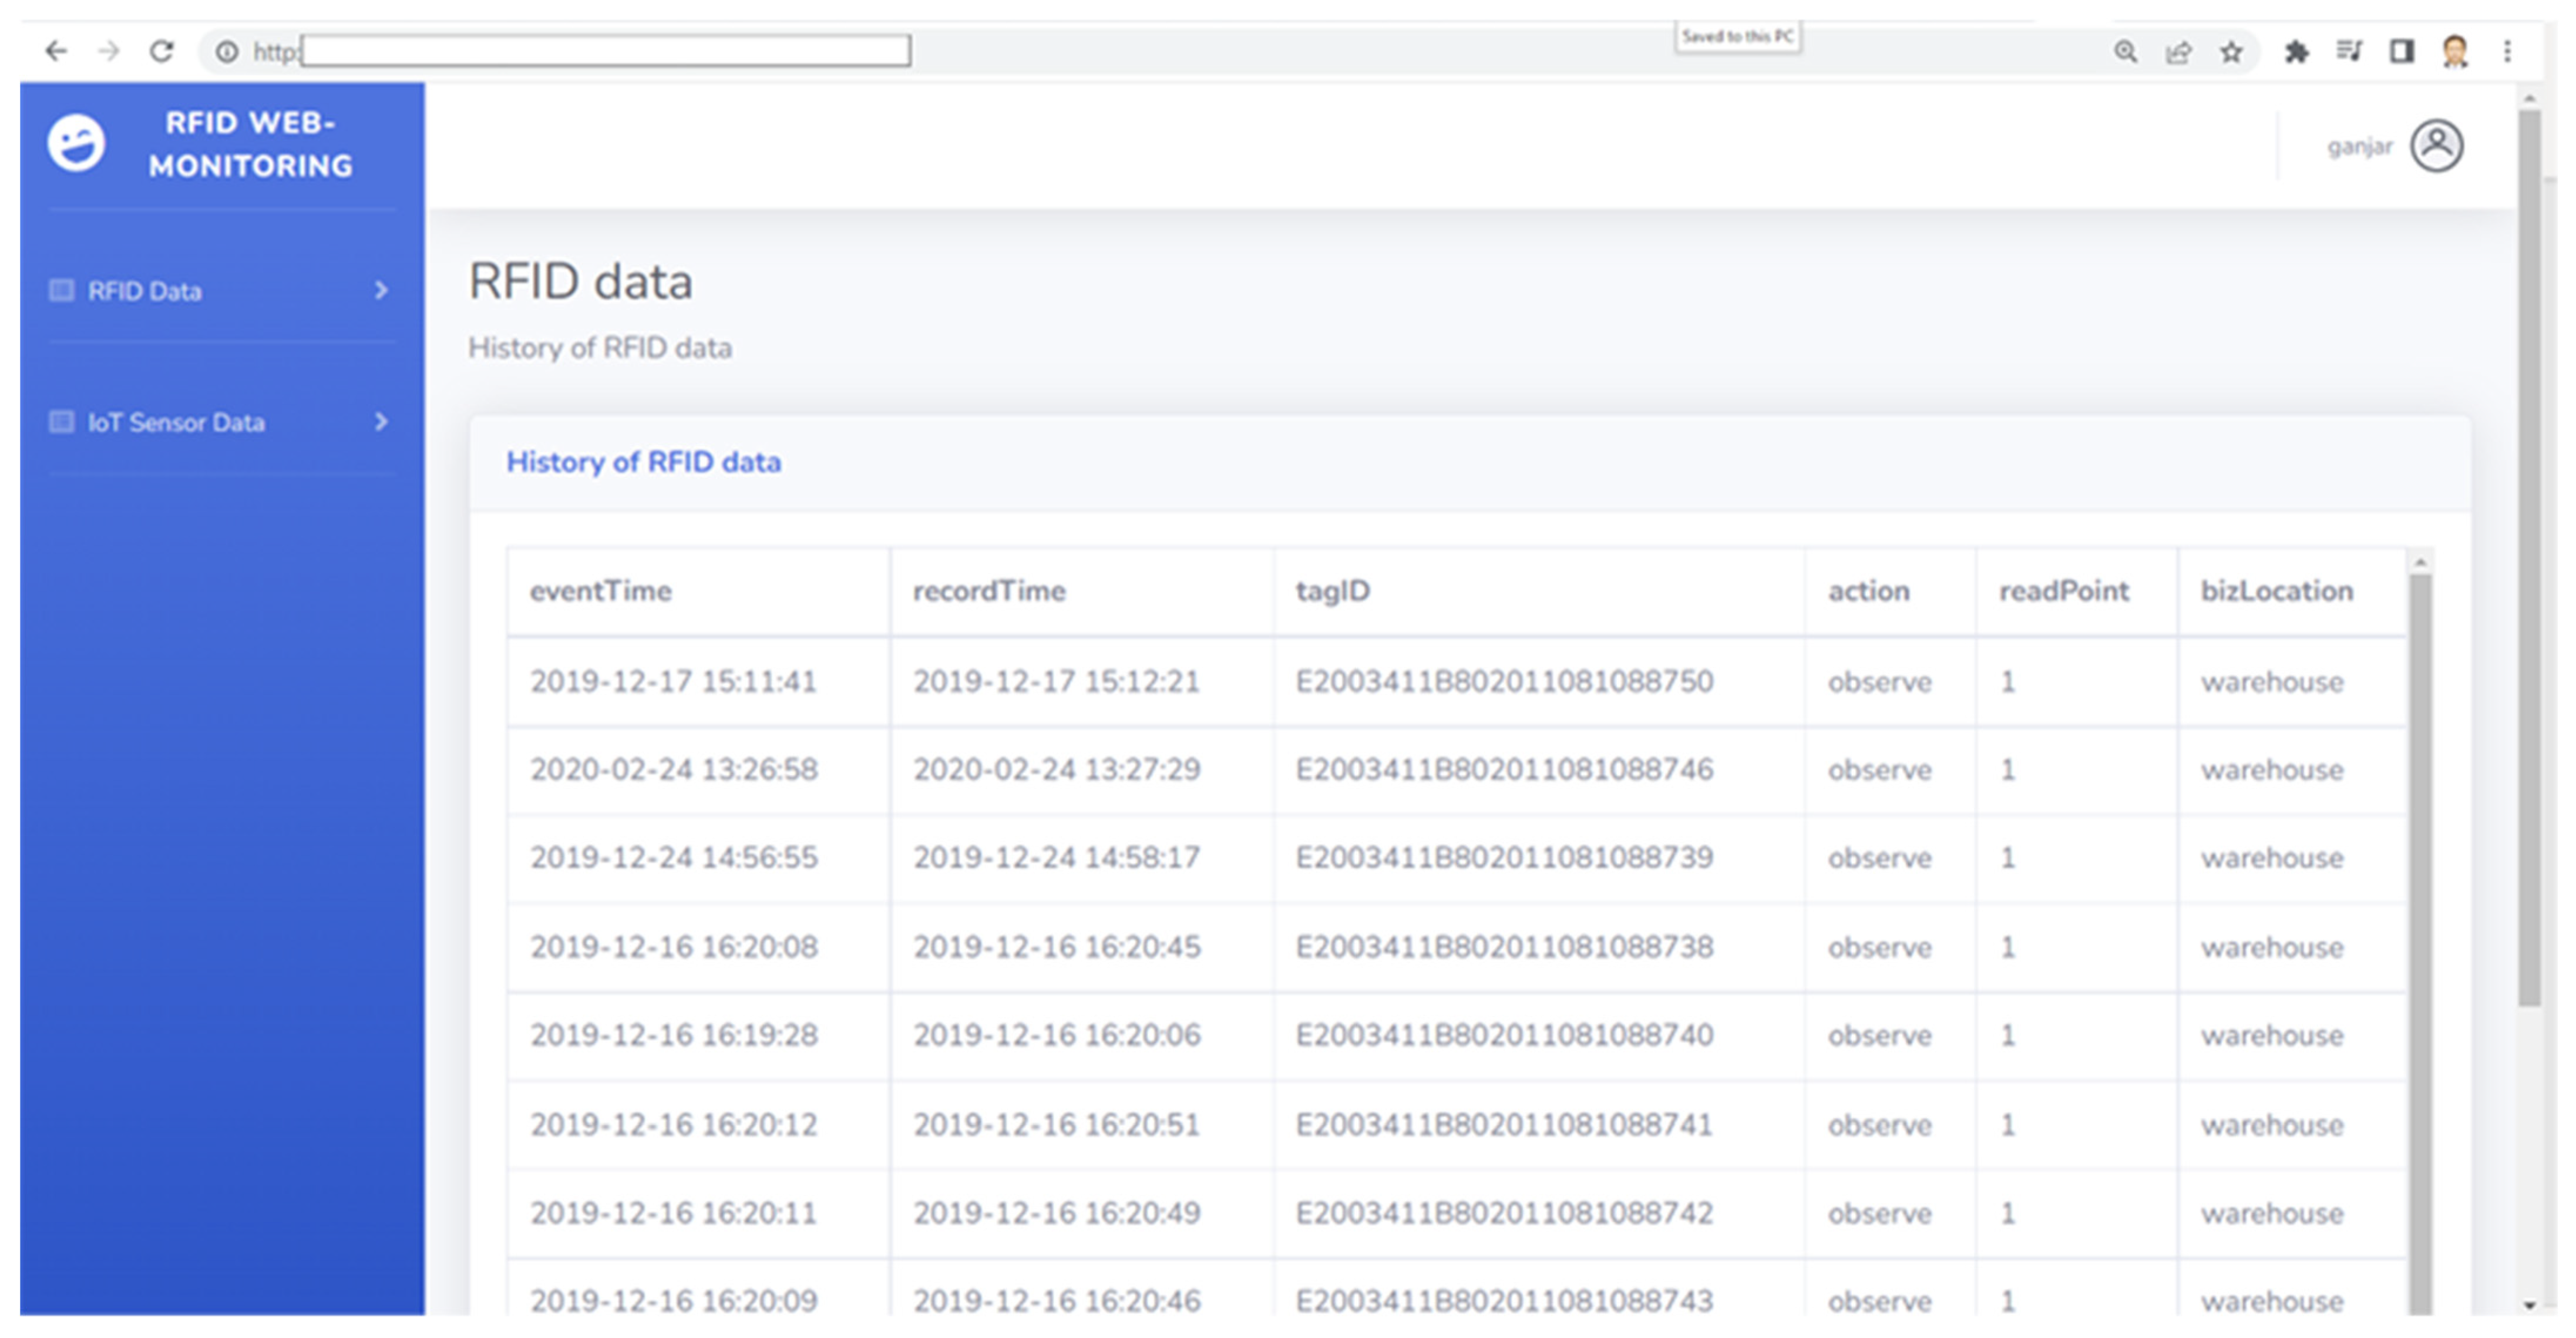
- Finally, we demonstrated the practicability of our proposed model by designing and developing the web-based RFID monitoring system.
- In addition, implementing the proposed predicted model into a web-based RFID monitoring system could be applied in warehouse to detect the direction of the tagged product automatically.
2. Literature Review
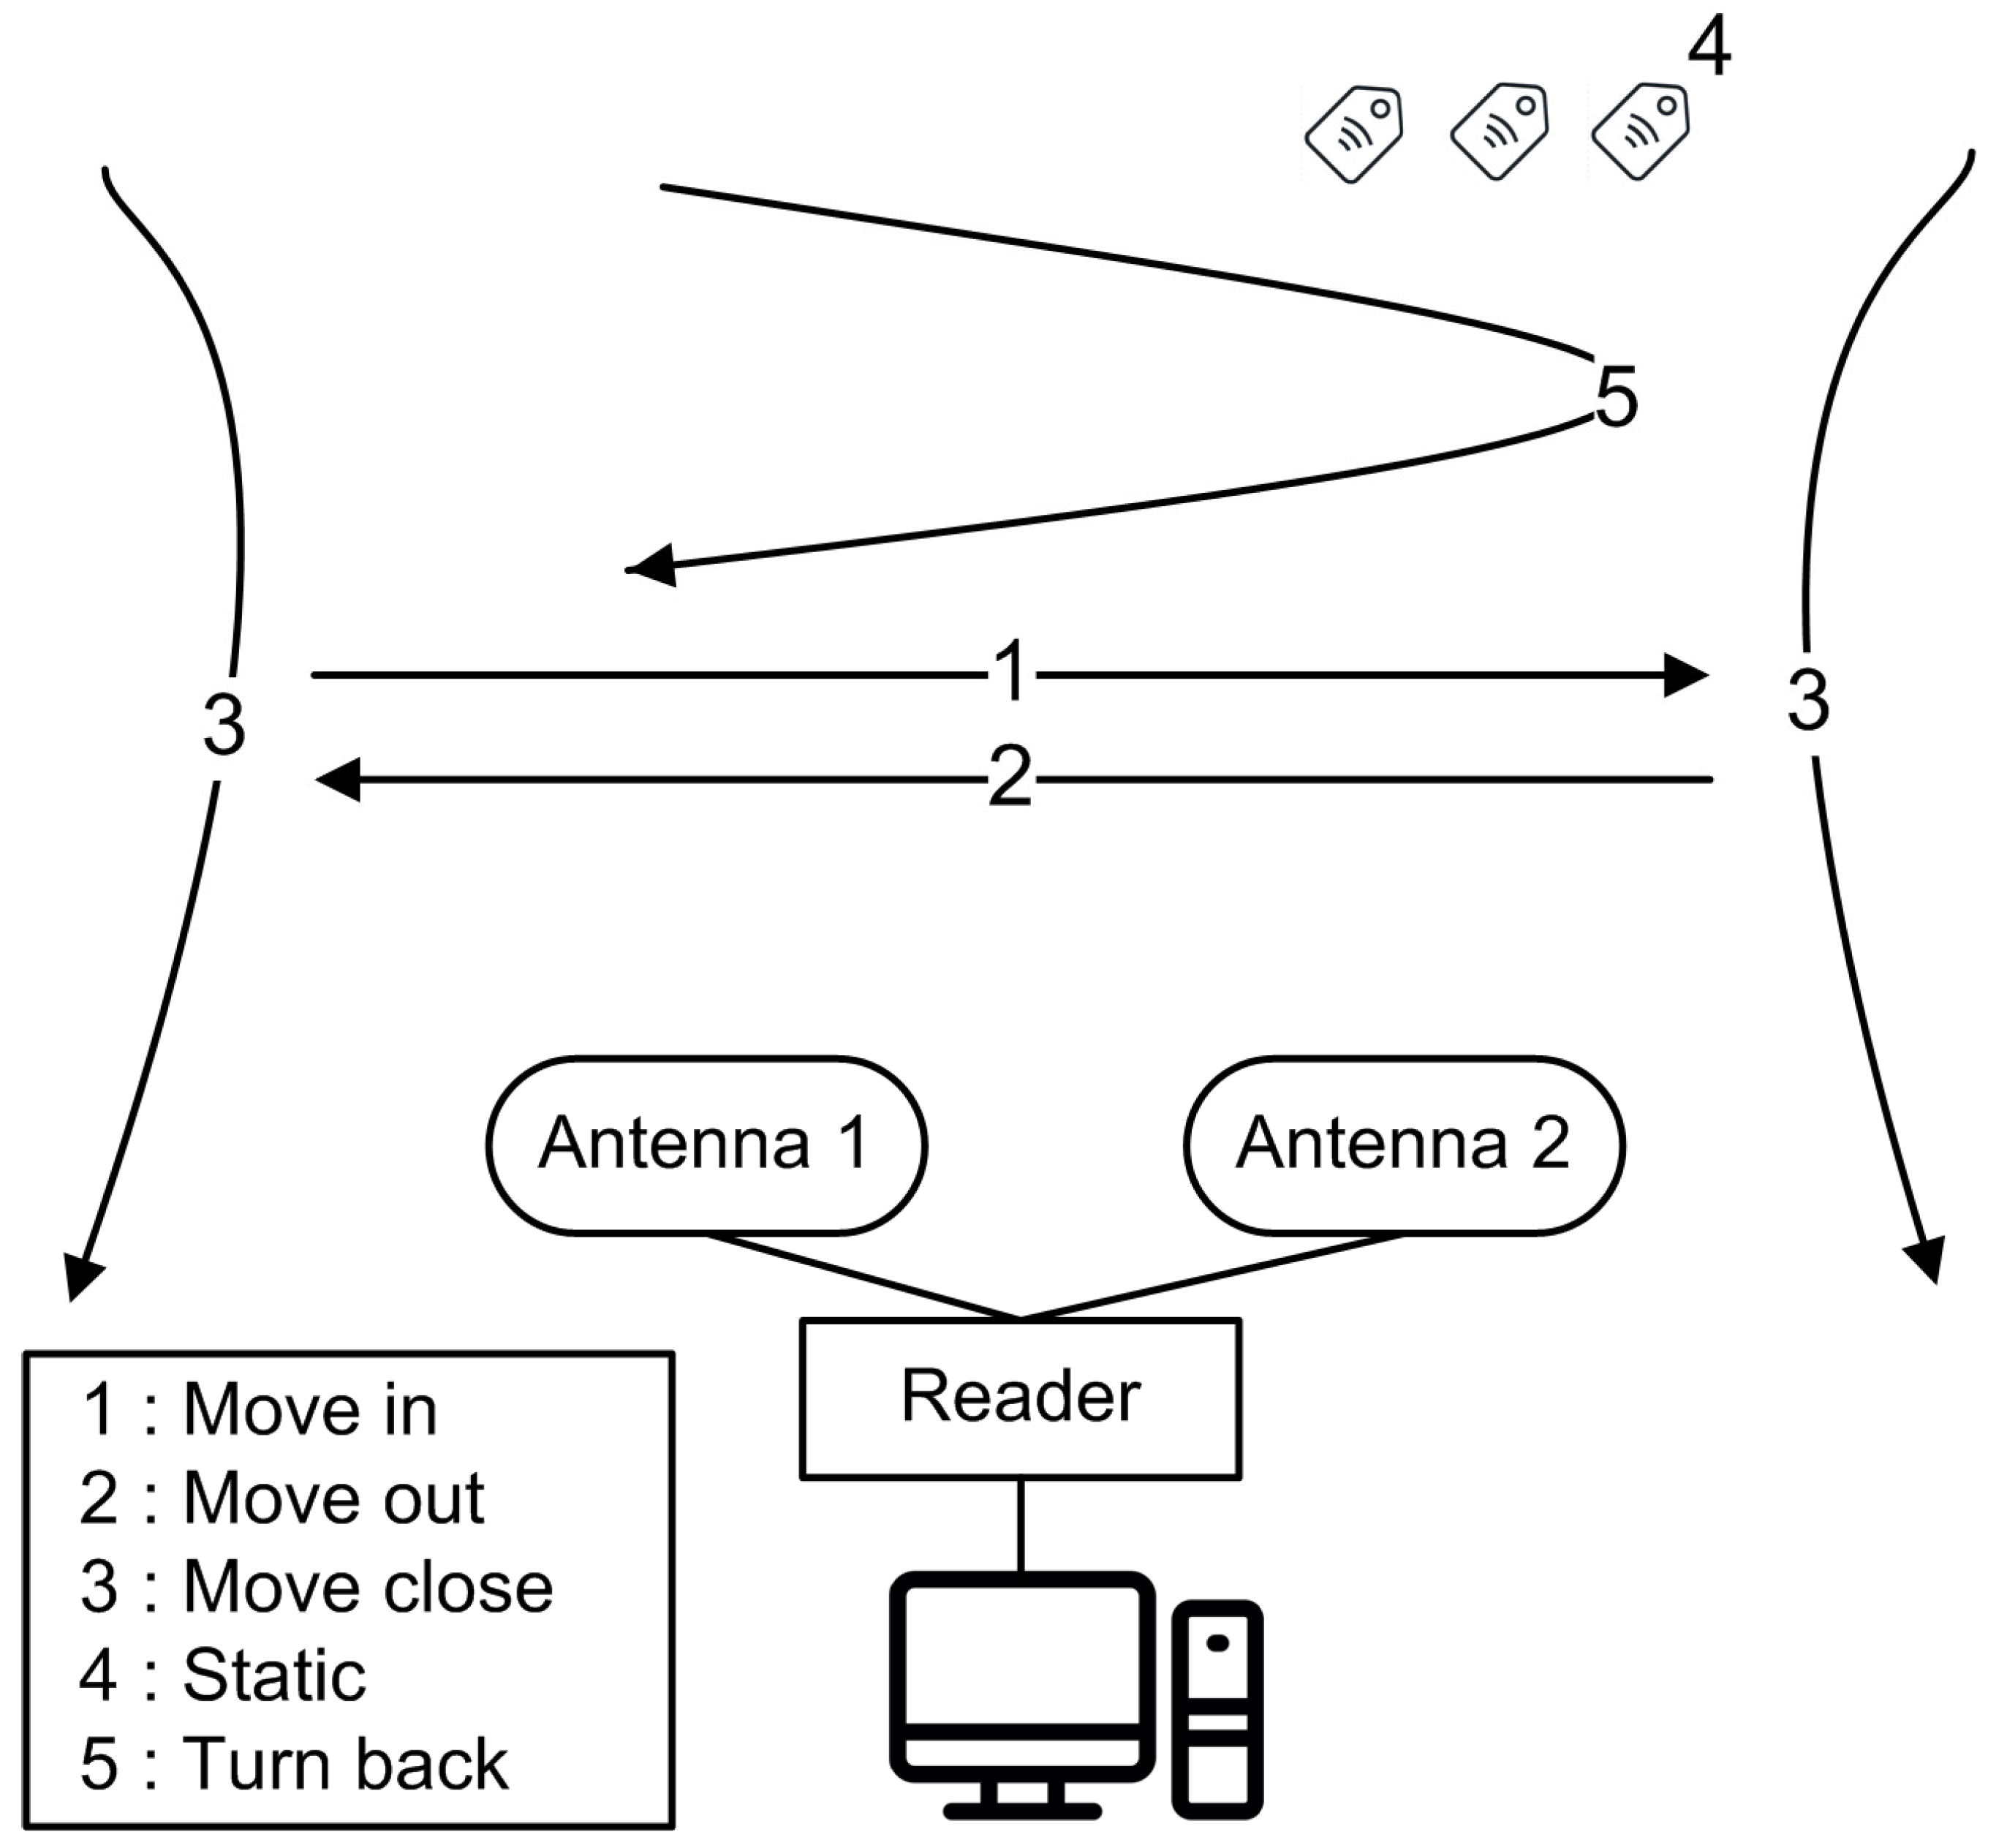
2.1. Tag Movement and Direction
2.2. iForest Outlier Detection
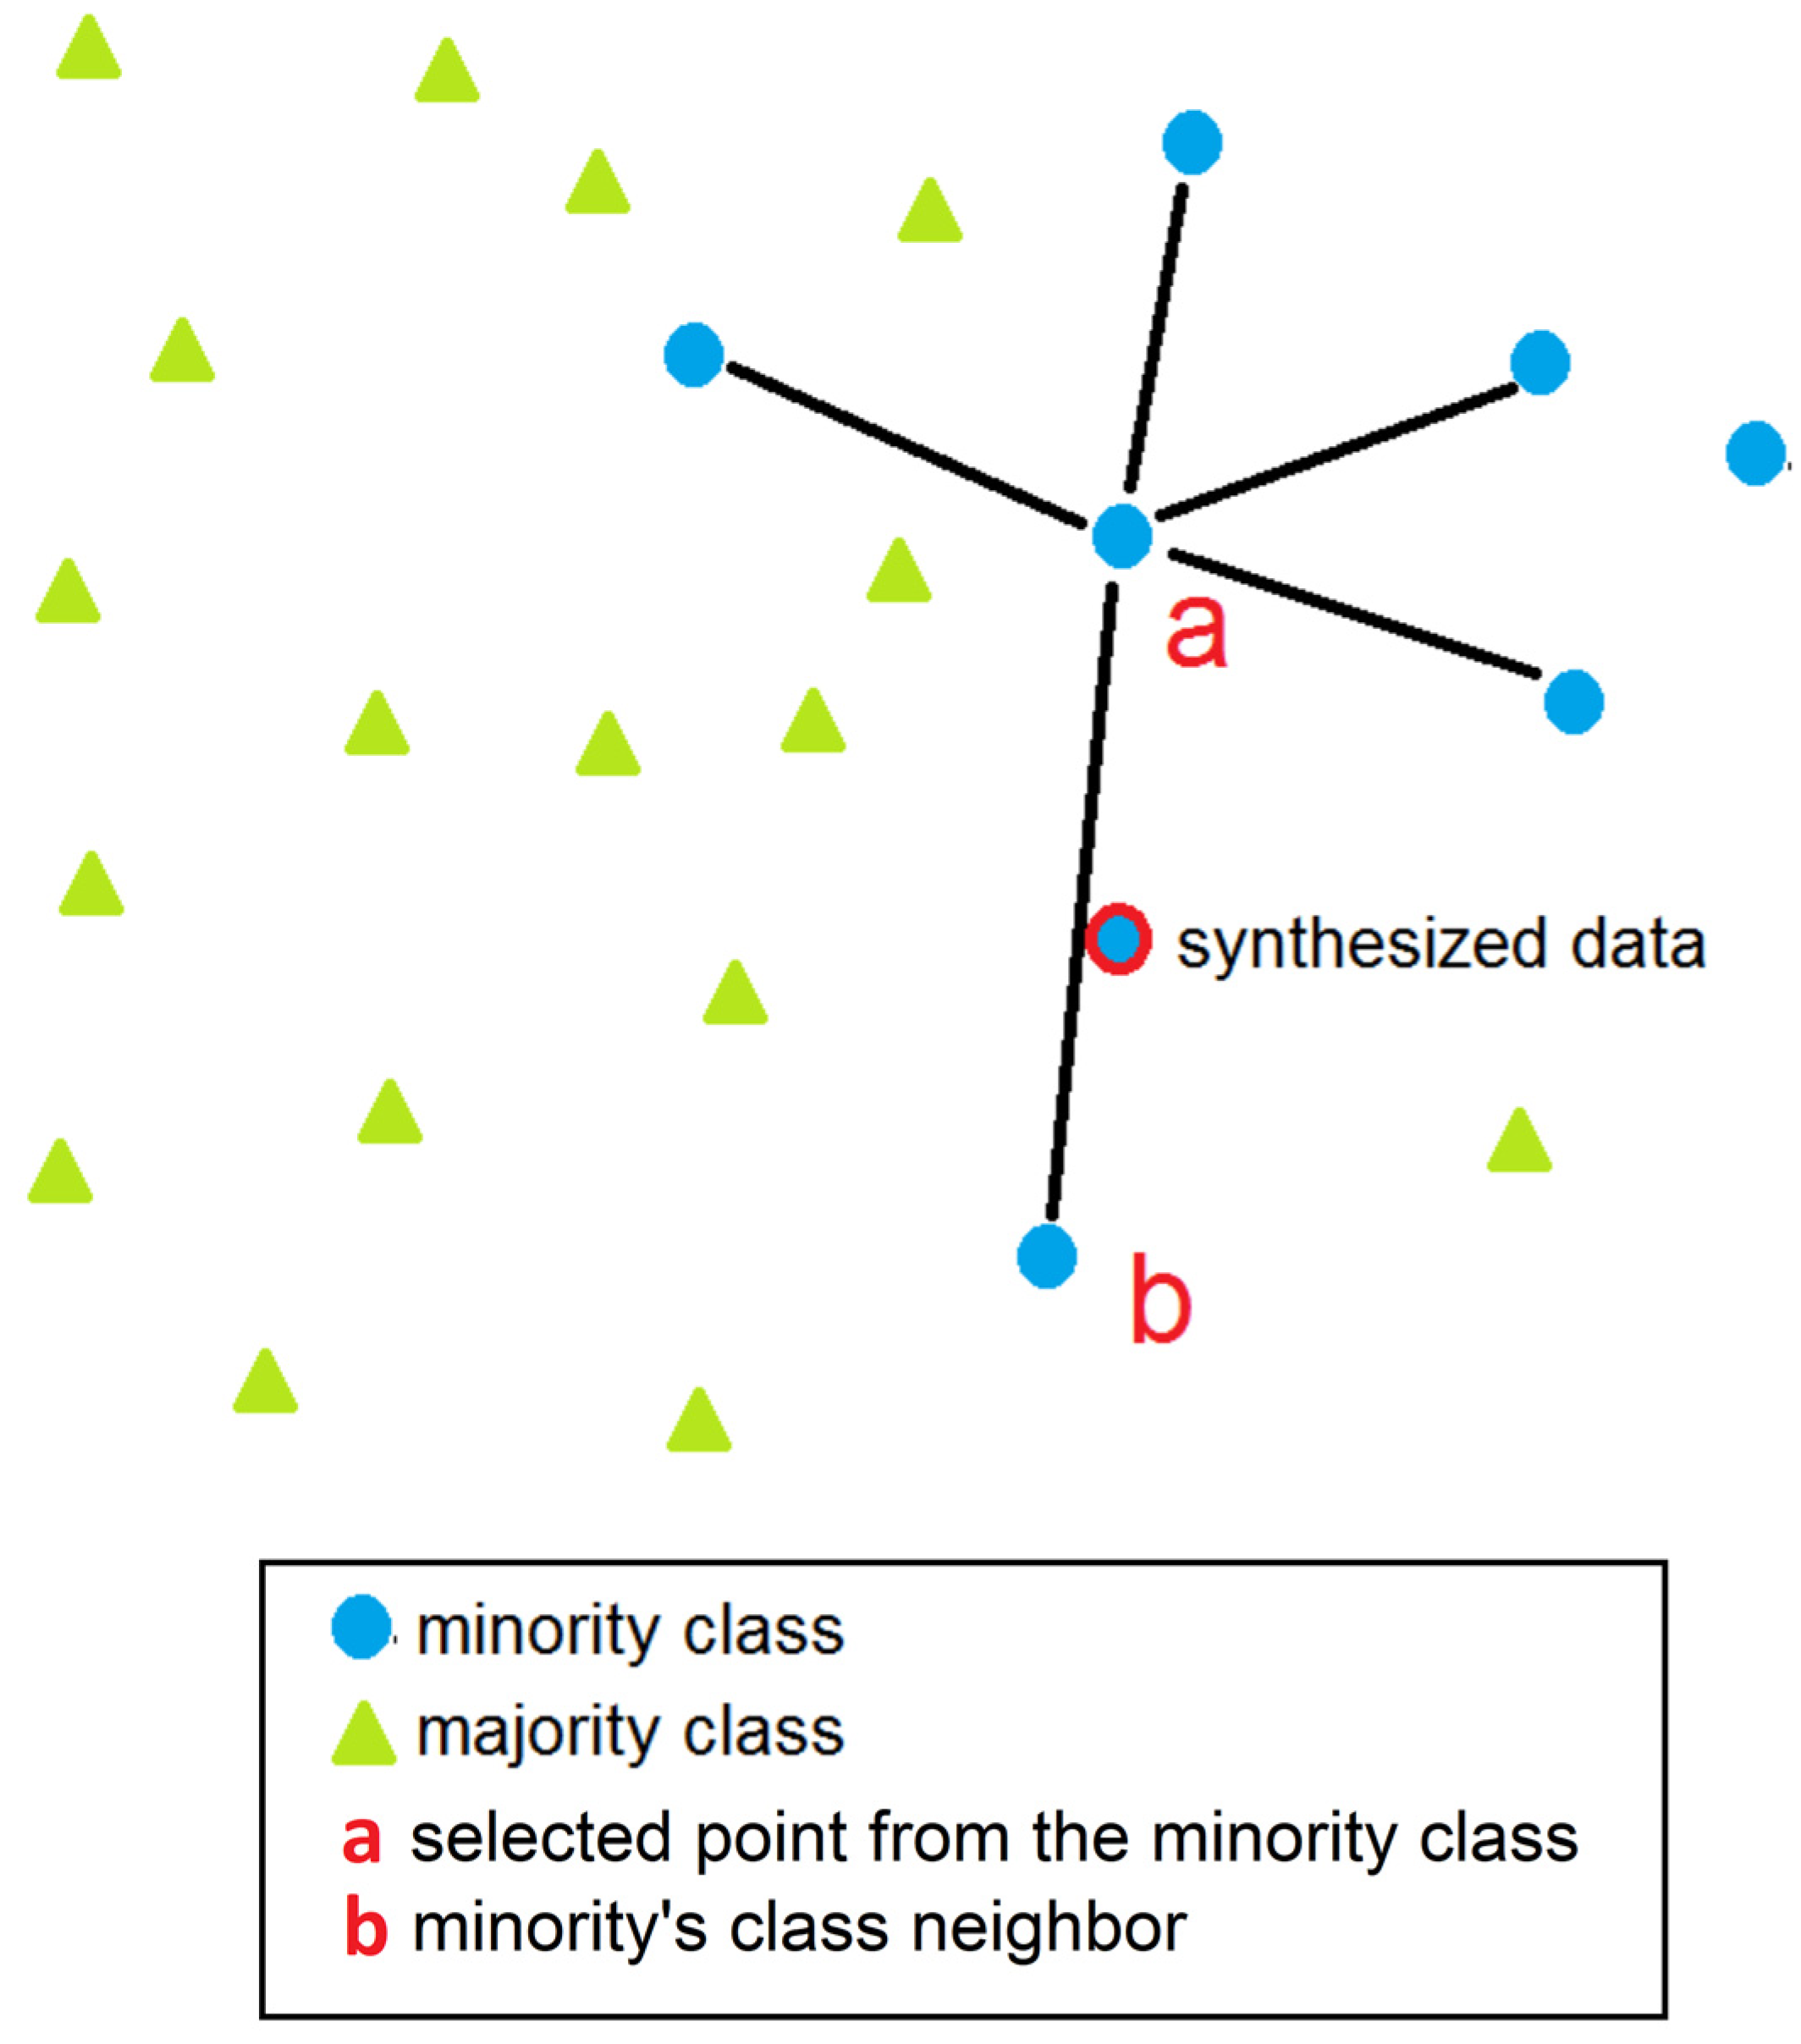
2.3. SMOTE
2.4. Random Forest
3. Methodology
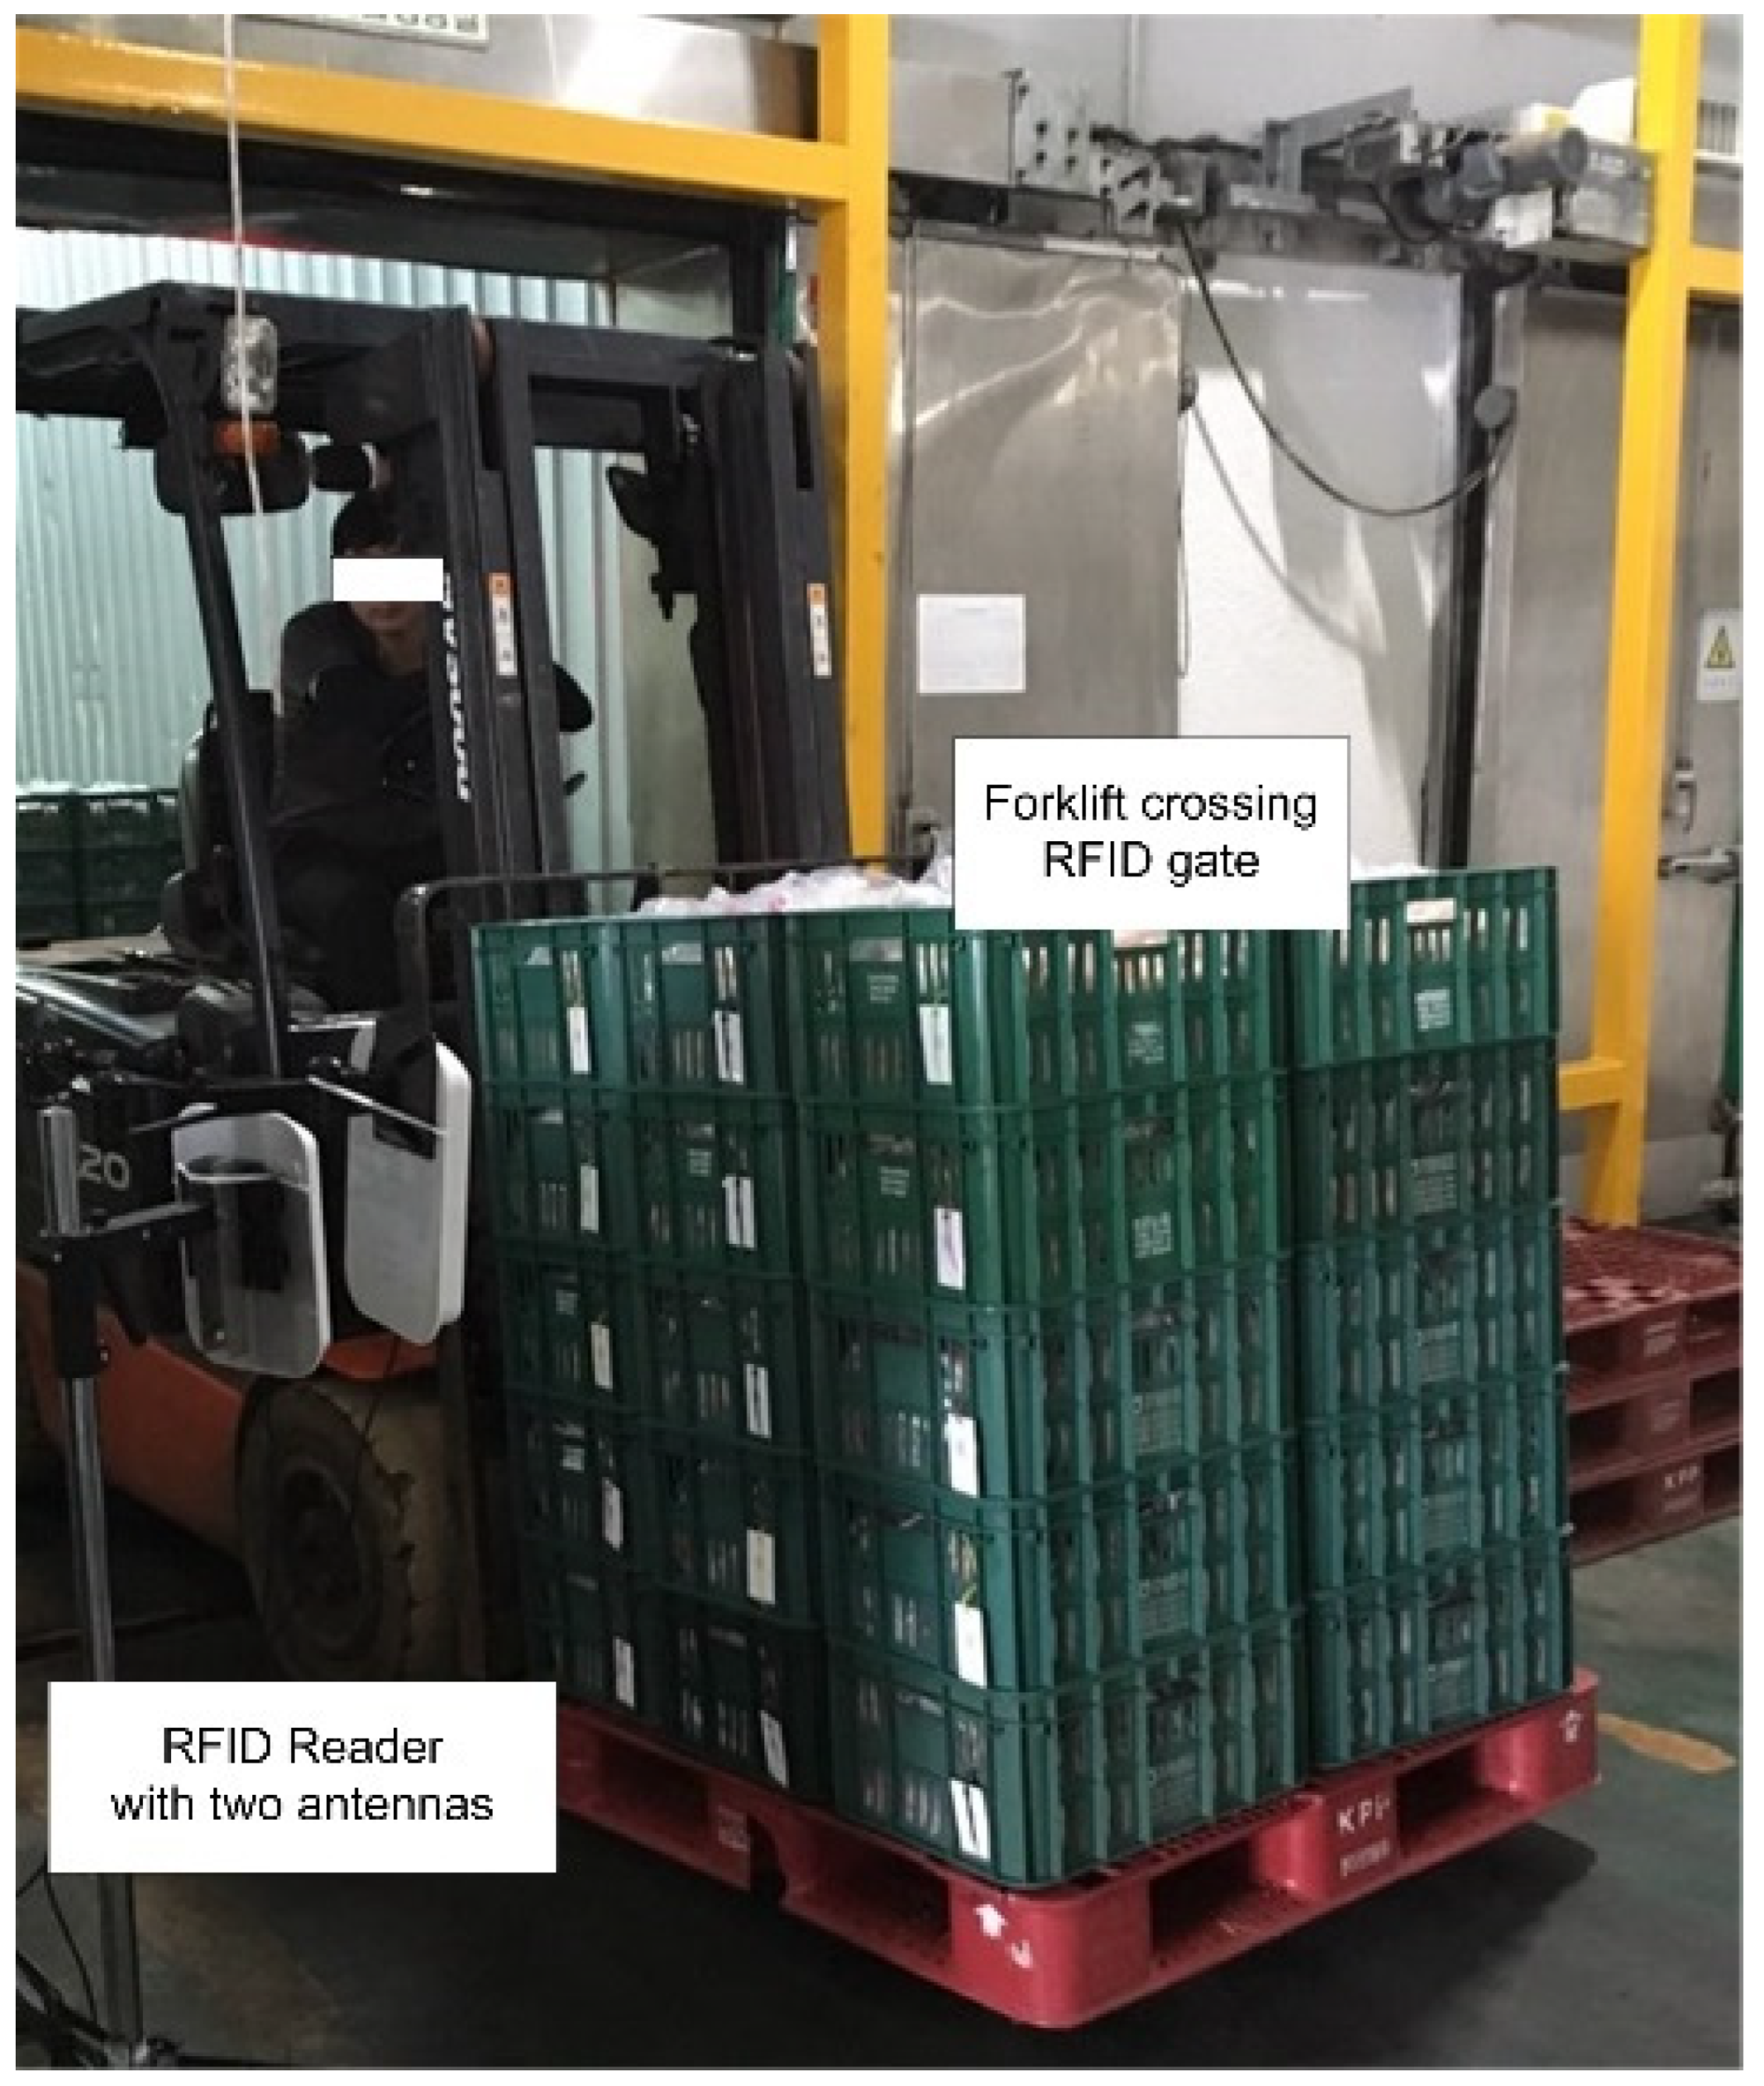
3.1. Dataset
3.2. iForest Outlier Detection
| Algorithm 1 Isolation forest - | |
| Input | D, NumTree, MaxSample |
| Output | Set of iTrees |
| 1: | Initialize Forest |
| 2: | set height limit h = |
| 3: | for i = 1 to NumTree do |
| 4: | D’ ⟵ sample(D, MaxSample) |
| 5: | Forest ⟵ Forest iTree (D’, 0, h) |
| 6: | end for |
| 7: | return Forest |
3.3. Feature Extraction
3.4. SMOTE
3.5. Random Forest
| Algorithm 2 Random forest | |
| Input | : training dataset D, ensemble size T, subspace dimension d |
| Output | : majority votes from tree models |
| for t = 1 to T do | |
| Build a bootstrap sample from D | |
| Select d features randomly and reduce the dimensionality of accordingly | |
| Train a tree model on | |
| Split on the best feature in d | |
| Let grow without pruning | |
| end | |
4. Results and Discussion
4.1. Performance of Machine Learning Models
4.2. Impact of Outlier Detection and Data Balancing Method
4.3. Comparison with Previous Studies
4.4. Practical Application
5. Conclusions and Future Works
Author Contributions
Funding
Data Availability Statement
Conflicts of Interest
References
- Yang, S.; M. R., A.R.; Kaminski, J.; Pepin, H. Opportunities for Industry 4.0 to Support Remanufacturing. Appl. Sci. 2018, 8, 1177. [Google Scholar] [CrossRef] [Green Version]
- Senthilkumar, R.; Venkatakrishnan, P.; Balaji, N. Intelligent Based Novel Embedded System Based IoT Enabled Air Pollution Monitoring System. Microprocess. Microsyst. 2020, 77, 103172. [Google Scholar] [CrossRef]
- Effendi, S.Z.; Oktiawati, U.Y. Implementation and Performance Analysis of Temperature and Humidity Monitoring System for Server Room Conditions on Lora-Based Networks. J. Internet Softw. Eng. 2022, 3, 20–25. [Google Scholar] [CrossRef]
- Guevara, N.E.; Bolaños, Y.H.; Diago, J.P.; Segura, J.M. Development of a Low-Cost IoT System Based on LoRaWAN for Monitoring Variables Related to Electrical Energy Consumption in Low Voltage Networks. HardwareX 2022, 12, e00330. [Google Scholar] [CrossRef]
- Subardono, A.; Hariri, I.K. Monitoring and Analysis of Honeypot System Performance Using Simple Network Management Protocol (SNMP). J. Internet Softw. Eng. 2021, 2, 1–8. [Google Scholar] [CrossRef]
- Rahim, M.A.; Rahman, M.A.; Rahman, M.M.; Asyhari, A.T.; Bhuiyan, M.Z.A.; Ramasamy, D. Evolution of IoT-Enabled Connectivity and Applications in Automotive Industry: A Review. Veh. Commun. 2021, 27, 100285. [Google Scholar] [CrossRef]
- Ammar, M.; Haleem, A.; Javaid, M.; Bahl, S.; Garg, S.B.; Shamoon, A.; Garg, J. Significant Applications of Smart Materials and Internet of Things (IoT) in the Automotive Industry. Mater. Today Proc. 2022, 68, 1542–1549. [Google Scholar] [CrossRef]
- El Zouka, H.A.; Hosni, M.M. Secure IoT Communications for Smart Healthcare Monitoring System. Internet Things 2021, 13, 100036. [Google Scholar] [CrossRef]
- Mani, N.; Singh, A.; Nimmagadda, S.L. An IoT Guided Healthcare Monitoring System for Managing Real-Time Notifications by Fog Computing Services. Procedia Comput. Sci. 2020, 167, 850–859. [Google Scholar] [CrossRef]
- Keller, T.; Thiesse, F.; Kungl, J.; Fleisch, E. Using Low-Level Reader Data to Detect False-Positive RFID Tag Reads. In Proceedings of the 2010 Internet of Things (IOT), Tokyo, Japan, 29 November–1 December 2010; IEEE: Piscataway, NJ, USA, 2010; pp. 1–8. [Google Scholar]
- Ma, H.; Wang, Y.; Wang, K. Automatic Detection of False Positive RFID Readings Using Machine Learning Algorithms. Expert Syst. Appl. 2018, 91, 442–451. [Google Scholar] [CrossRef]
- Zhu, S.; Wang, S.; Zhang, F.; Zhang, Y.; Feng, Y.; Huang, W. Environmentally Adaptive Real-Time Detection of RFID False Readings in a New Practical Scenario. In Proceedings of the 2018 IEEE SmartWorld, Ubiquitous Intelligence & Computing, Advanced & Trusted Computing, Scalable Computing & Communications, Cloud & Big Data Computing, Internet of People and Smart City Innovation (SmartWorld/SCALCOM/UIC/ATC/CBDCom/IOP/SCI), Guangzhou, China, 8–12 October 2018; IEEE: Piscataway, NJ, USA, 2018; pp. 338–345. [Google Scholar]
- Alfian, G.; Syafrudin, M.; Yoon, B.; Rhee, J. False Positive RFID Detection Using Classification Models. Appl. Sci. 2019, 9, 1154. [Google Scholar] [CrossRef] [Green Version]
- Motroni, A.; Pino, M.R.; Buffi, A.; Nepa, P. Artificial Intelligence Enhances Smart RFID Portal for Retail. In Proceedings of the 2022 IEEE International Conference on RFID (RFID), Las Vegas, NV, USA, 17 May 2022; IEEE: Piscataway, NJ, USA, 2022; pp. 53–57. [Google Scholar]
- Motroni, A.; Buffi, A.; Nepa, P.; Pesi, M.; Congi, A. An Action Classification Method for Forklift Monitoring in Industry 4.0 Scenarios. Sensors 2021, 21, 5183. [Google Scholar] [CrossRef]
- Tang, J.; Gong, Z.; Wu, H.; Tao, B. RFID-Based Pose Estimation for Moving Objects Using Classification and Phase-Position Transformation. IEEE Sens. J. 2021, 21, 20606–20615. [Google Scholar] [CrossRef]
- Alfian, G.; Syafrudin, M.; Farooq, U.; Ma’arif, M.R.; Syaekhoni, M.A.; Fitriyani, N.L.; Lee, J.; Rhee, J. Improving Efficiency of RFID-Based Traceability System for Perishable Food by Utilizing IoT Sensors and Machine Learning Model. Food Control. 2020, 110, 107016. [Google Scholar] [CrossRef]
- Mizuno, K.; Miwa, Y.; Naito, K.; Ehara, M. State Estimation Scheme for Multiple RF Tags with an Angled Single Antenna. In Proceedings of the 2022 IEEE International Conference on RFID (RFID), Las Vegas, NV, USA, 17 May 2022; IEEE: Piscataway, NJ, USA, 2022; pp. 64–69. [Google Scholar]
- Mani, S.; Chen, Y.; Elasy, T.; Clayton, W.; Denny, J. Type 2 Diabetes Risk Forecasting from EMR Data Using Machine Learning. AMIA Annu. Symp. Proc. AMIA Symp. 2012, 2012, 606–615. [Google Scholar]
- López, B.; Torrent-Fontbona, F.; Viñas, R.; Fernández-Real, J.M. Single Nucleotide Polymorphism Relevance Learning with Random Forests for Type 2 Diabetes Risk Prediction. Artif. Intell. Med. 2018, 85, 43–49. [Google Scholar] [CrossRef] [Green Version]
- Sun, J.; McNaughton, C.D.; Zhang, P.; Perer, A.; Gkoulalas-Divanis, A.; Denny, J.C.; Kirby, J.; Lasko, T.; Saip, A.; Malin, B.A. Predicting Changes in Hypertension Control Using Electronic Health Records from a Chronic Disease Management Program. J. Am. Med. Inform. Assoc. 2014, 21, 337–344. [Google Scholar] [CrossRef] [Green Version]
- Alam, M.Z.; Rahman, M.S.; Rahman, M.S. A Random Forest Based Predictor for Medical Data Classification Using Feature Ranking. Inform. Med. Unlocked 2019, 15, 100180. [Google Scholar] [CrossRef]
- Salazar, L.H.A.; Leithardt, V.R.Q.; Parreira, W.D.; da Rocha Fernandes, A.M.; Barbosa, J.L.V.; Correia, S.D. Application of Machine Learning Techniques to Predict a Patient’s No-Show in the Healthcare Sector. Future Internet 2021, 14, 3. [Google Scholar] [CrossRef]
- Omasheye, O.R.; Azi, S.; Isabona, J.; Imoize, A.L.; Li, C.-T.; Lee, C.-C. Joint Random Forest and Particle Swarm Optimization for Predictive Pathloss Modeling of Wireless Signals from Cellular Networks. Future Internet 2022, 14, 373. [Google Scholar] [CrossRef]
- Heigl, M.; Anand, K.A.; Urmann, A.; Fiala, D.; Schramm, M.; Hable, R. On the Improvement of the Isolation Forest Algorithm for Outlier Detection with Streaming Data. Electronics 2021, 10, 1534. [Google Scholar] [CrossRef]
- Chang, K.; Yoo, Y.; Baek, J.-G. Anomaly Detection Using Signal Segmentation and One-Class Classification in Diffusion Process of Semiconductor Manufacturing. Sensors 2021, 21, 3880. [Google Scholar] [CrossRef]
- Hu, S.; Gao, J.; Zhong, D.; Deng, L.; Ou, C.; Xin, P. An Innovative Hourly Water Demand Forecasting Preprocessing Framework with Local Outlier Correction and Adaptive Decomposition Techniques. Water 2021, 13, 582. [Google Scholar] [CrossRef]
- Chen, J.; Zhang, J.; Qian, R.; Yuan, J.; Ren, Y. An Anomaly Detection Method for Wireless Sensor Networks Based on the Improved Isolation Forest. Appl. Sci. 2023, 13, 702. [Google Scholar] [CrossRef]
- Chawla, N.V.; Bowyer, K.W.; Hall, L.O.; Kegelmeyer, W.P. SMOTE: Synthetic Minority Over-Sampling Technique. J. Artif. Intell. Res. 2002, 16, 321–357. [Google Scholar] [CrossRef]
- Sun, J.; Lang, J.; Fujita, H.; Li, H. Imbalanced Enterprise Credit Evaluation with DTE-SBD: Decision Tree Ensemble Based on SMOTE and Bagging with Differentiated Sampling Rates. Inf. Sci. 2018, 425, 76–91. [Google Scholar] [CrossRef]
- Le, T.; Lee, M.; Park, J.; Baik, S. Oversampling Techniques for Bankruptcy Prediction: Novel Features from a Transaction Dataset. Symmetry 2018, 10, 79. [Google Scholar] [CrossRef] [Green Version]
- Jin, O.; Qu, L.; He, J.; Li, X. Recognition of New and Old Banknotes Based on SMOTE and SVM. In Proceedings of the 2015 IEEE 12th Intl Conf on Ubiquitous Intelligence and Computing and 2015 IEEE 12th Intl Conf on Autonomic and Trusted Computing and 2015 IEEE 15th Intl Conf on Scalable Computing and Communications and Its Associated Workshops (UIC-ATC-ScalCom), Beijing, China, 10–14 August 2015; IEEE: Piscataway, NJ, USA, 2015; pp. 213–220. [Google Scholar]
- Liu, F.T.; Ting, K.M.; Zhou, Z.-H. Isolation Forest. In Proceedings of the 2008 Eighth IEEE International Conference on Data Mining, Pisa, Italy, 15–19 December 2008; IEEE: Piscataway, NJ, USA, 2008; pp. 413–422. [Google Scholar]
- Breiman, L. Random Forest. Mach. Learn. 2001, 45, 5–32. [Google Scholar] [CrossRef] [Green Version]
- Alfian, G. RFID Reading Dataset. Available online: https://github.com/ganjar87/RFID_reading_dataset (accessed on 18 February 2023).
- Pedregosa, F.; Varoquaux, G.; Gramfort, A.; Michel, V.; Thirion, B.; Grisel, O.; Blondel, M.; Müller, A.; Nothman, J.; Louppe, G.; et al. Scikit-Learn: Machine Learning in Python. J. Mach. Learn. Res. 2012, 12, 2825–2830. [Google Scholar] [CrossRef]
- Sokolova, M.; Lapalme, G. A Systematic Analysis of Performance Measures for Classification Tasks. Inf. Process. Manag. 2009, 45, 427–437. [Google Scholar] [CrossRef]
- Keller, T.; Thiesse, F.; Ilic, A.; Fleisch, E. Decreasing False-Positive RFID Tag Reads by Improved Portal Antenna Setups. In Proceedings of the 2012 3rd IEEE International Conference on the Internet of Things, Wuxi, China, 24–26 October 2012; IEEE: Piscataway, NJ, USA, 2012; pp. 99–106. [Google Scholar]
- Rau, H.-H.; Hsu, C.-Y.; Lin, Y.-A.; Atique, S.; Fuad, A.; Wei, L.-M.; Hsu, M.-H. Development of a Web-Based Liver Cancer Prediction Model for Type II Diabetes Patients by Using an Artificial Neural Network. Comput. Methods Programs Biomed. 2016, 125, 58–65. [Google Scholar] [CrossRef]
- Ahmed, N.; Ahammed, R.; Islam, M.M.; Uddin, M.A.; Akhter, A.; Talukder, M.A.-A.; Paul, B.K. Machine Learning Based Diabetes Prediction and Development of Smart Web Application. Int. J. Cogn. Comput. Eng. 2021, 2, 229–241. [Google Scholar] [CrossRef]


| Feature Type | Attribute Name | Description |
|---|---|---|
| RSS | RSS_Min | Minimum signal strength |
| RSS_Max | Maximum signal strength | |
| RSS_Mean | The average signal strength | |
| RSS_Std | Standard deviation signal strength | |
| RSS_Med | The median signal strength | |
| RSS_Diff | Difference between the highest and lowest signal strengths | |
| RSS_Kurt | Indication of whether the RSS distribution is heavy- or light-tailed relative to normal | |
| RSS_Skew | Distribution asymmetry of signal strengths | |
| RSS_Count | Total number of reads for the tag | |
| Timestamp | Time_Min | Timeframe (seconds) of tag read at the first time. |
| Time_Max | Timeframe (seconds) of tag read at the last time. | |
| Time_Mean | The average value for the timeframe (seconds) | |
| Time_Std | Standard deviation value for the timeframe (seconds) | |
| Time_Med | The median value for the timeframe (seconds) | |
| Time_Diff | Total period (seconds) for a tag between the first and last read time | |
| Time_Kurt | Indication of whether the timeframe distribution is heavy- or light-tailed relative to normal | |
| Time_Skew | Distribution asymmetry of timeframe | |
| Time_Count | Total number of seconds for the tag |
| Metric | Formula |
|---|---|
| Method | Performance Evaluation (%) | ||||
|---|---|---|---|---|---|
| Accuracy | Precision | Specificity | Recall | F-Score | |
| MLP | 71.165 ± 5.745 | 70.001 ± 7.665 | 92.923 ± 1.388 | 67.699 ± 6.106 | 65.728 ± 6.537 |
| LR | 63.301 ± 3.998 | 60.646 ± 4.426 | 90.711 ± 0.959 | 58.978 ± 4.241 | 58.402 ± 4.106 |
| KNN | 66.699 ± 3.336 | 64.346 ± 3.521 | 91.844 ± 0.827 | 62.355 ± 3.368 | 62.316 ± 2.960 |
| DT | 86.699 ± 4.343 | 86.477 ± 3.881 | 96.713 ± 1.075 | 85.570 ± 3.887 | 85.519 ± 4.084 |
| NB | 81.262 ± 3.475 | 80.395 ± 7.628 | 95.200 ± 0.914 | 79.022 ± 4.134 | 78.467 ± 5.869 |
| XGBoost | 93.592 ± 2.983 | 93.363 ± 3.028 | 98.434 ± 0.730 | 92.900 ± 3.207 | 92.726 ± 3.322 |
| AdaBoost | 93.107 ± 3.174 | 92.963 ± 3.161 | 98.312 ± 0.772 | 92.624 ± 3.139 | 92.418 ± 3.289 |
| RF + iForest + SMOTE | 94.251 ± 3.267 | 93.751 ± 3.547 | 98.612 ± 0.786 | 93.502 ± 3.510 | 93.332 ± 3.617 |
| Author | Purpose | Architecture | Feature | Method | Accuracy (%) | Practical Application |
|---|---|---|---|---|---|---|
| [10] | Detecting movement | One reader 4 antennas | Statistical features from RSS and timestamps | Information Gain | 95.69 | Not reported |
| [11] | Detecting movement | Two readers | Statistical Features from RSS and phase readings | SVM | 95.3 | Not reported |
| [13] | Detecting movement | One reader, one antenna | Statistical Features from RSS | RF with IQR outlier detection | 97.496 | Yes |
| [17] | Detecting movement and direction | One reader, two antennas | Statistical Features from RSS and Timestamp | XGBoost | 93.5 | Yes |
| Our study | Detecting movement and direction | One reader, two antennas | Statistical Features from RSS and Timestamp | RF with iForest Outlier Detection and SMOTE | 94.251 | Yes |
Disclaimer/Publisher’s Note: The statements, opinions and data contained in all publications are solely those of the individual author(s) and contributor(s) and not of MDPI and/or the editor(s). MDPI and/or the editor(s) disclaim responsibility for any injury to people or property resulting from any ideas, methods, instructions or products referred to in the content. |
© 2023 by the authors. Licensee MDPI, Basel, Switzerland. This article is an open access article distributed under the terms and conditions of the Creative Commons Attribution (CC BY) license (https://creativecommons.org/licenses/by/4.0/).
Share and Cite
Alfian, G.; Syafrudin, M.; Fitriyani, N.L.; Alam, S.; Pratomo, D.N.; Subekti, L.; Octava, M.Q.H.; Yulianingsih, N.D.; Atmaji, F.T.D.; Benes, F. Utilizing Random Forest with iForest-Based Outlier Detection and SMOTE to Detect Movement and Direction of RFID Tags. Future Internet 2023, 15, 103. https://doi.org/10.3390/fi15030103
Alfian G, Syafrudin M, Fitriyani NL, Alam S, Pratomo DN, Subekti L, Octava MQH, Yulianingsih ND, Atmaji FTD, Benes F. Utilizing Random Forest with iForest-Based Outlier Detection and SMOTE to Detect Movement and Direction of RFID Tags. Future Internet. 2023; 15(3):103. https://doi.org/10.3390/fi15030103
Chicago/Turabian StyleAlfian, Ganjar, Muhammad Syafrudin, Norma Latif Fitriyani, Sahirul Alam, Dinar Nugroho Pratomo, Lukman Subekti, Muhammad Qois Huzyan Octava, Ninis Dyah Yulianingsih, Fransiskus Tatas Dwi Atmaji, and Filip Benes. 2023. "Utilizing Random Forest with iForest-Based Outlier Detection and SMOTE to Detect Movement and Direction of RFID Tags" Future Internet 15, no. 3: 103. https://doi.org/10.3390/fi15030103
APA StyleAlfian, G., Syafrudin, M., Fitriyani, N. L., Alam, S., Pratomo, D. N., Subekti, L., Octava, M. Q. H., Yulianingsih, N. D., Atmaji, F. T. D., & Benes, F. (2023). Utilizing Random Forest with iForest-Based Outlier Detection and SMOTE to Detect Movement and Direction of RFID Tags. Future Internet, 15(3), 103. https://doi.org/10.3390/fi15030103