1. Introduction
In the garment industry, sustainable production plays a vital role in the development of future supply chain management. In recent decades, the scale of garment manufacturing in developing countries has rapidly expanded, especially in China. These countries have obtained many economic benefits by original equipment manufacturing, while their environments have suffered the equivalent cost. In the current fashion market, the mass industrialized production of garments often brings a huge number of overstocked goods with low response to dynamic changes in demand. To decrease the waste generated by this ineffective production, a series of innovative mechanisms have been proposed for supply chain management, such as distributed manufacturing systems [
1] or decision-support frameworks DESIRES [
2]. Sustainability has become an important issue in supply chain and production research. An increasing number of studies have been conducted in this field in recent years, e.g., [
3,
4,
5,
6]. Based on current sustainability issues in garment production and the aforementioned studies regarding sustainability, sustainable garment production needs to be more flexible, less costly, and more efficient for future supply chains.
Supply chain collaboration in the manufacturing stage is a popular issue in practice. “Sharing” is an important concept of supply chain collaboration, gradually changing our society structure from personal lifestyles to industrial supply chains in the past decade. People and companies have obtained many benefits from various innovative business models, such as UBER and Airbnb. Furthermore, the concept of sharing has gradually formulated in supply chains in the past decade and has been applied in many industries. The core of a sharing economy is resource sharing (RS). In supply chain research, RS is defined as “the process of leveraging capabilities and assets and investing in capabilities and assets with supply chain partners” [
7]. However, the implementation of RS is still at a low level in current supply chain practice and research. It is often concentrated on the sharing of intangible resources, like information, (e.g., [
8,
9,
10]) or sharing in financial fields (e.g., [
11,
12,
13]), which has been widely discussed in studies regarding inter-organizational supply chain collaboration. Limited supply chain collaboration research has addressed tangible resource sharing, such as logistics sharing amongst automotive manufacturers [
14], car platform sharing systems utilized in automobile manufacturing [
15], car sharing networks [
16], and inventory or warehouse sharing in the retail industry [
17]. Currently, the RS mechanism is utilized in the garment industry under certain circumstances, such as when there are fluctuations in market expectations or inadequate production capacities for an important order. Moreover, some garment manufacturers apply RS within the organization itself and resources are shared between different teams or departments [
18]. By applying real resource sharing as a common mechanism in the garment industry, we can expect better use of resources. This may lead to indirect positive effects on the supply chain as well, by reducing waste and improving efficiency, helping Small and medium enterprises (SMEs) become more competitive in the garment industry. Therefore, in the present study we explored the effect of the RS mechanism in the garment industry from several angles.
From traditional production models to the proposed model with RS mechanisms, one of the most important issues is to carry out quality control to ensure production by various manufacturers is the same level of quality. According to O. Dey and B. C. Giri, “in many academic researches, even though production process is often assumed to be perfect for reducing the complexity of modelling, but in reality, it is impossible that a production process is 100% defect-free” [
19], let alone the production for a shared order. The production failure rate would increase for a garment manufacturer producing a shared order. Therefore, the tradeoff between potential positive effects (e.g., higher facility utilization) and increased production failure rates became a big issue for applying the RS mechanism.
On the basis of the above discussion the effect of the RS mechanism on sustainable garment production under different failure rates needs to be explored more precisely in research. This is the main aim of the present study. We designed and generated several RS scenarios with different, increasing rates of production failure for shared order production. We utilized discrete-event simulation technology to conduct experiments on these scenarios and explore the influence of RS mechanisms. The structure of the remaining paper is as follows:
Section 2 described the problem and model in detail. In
Section 3, the methodology was introduced, including the sustainable production evaluation method and simulation experiment design. The results were presented and discussed in
Section 4. In
Section 5, several conclusions were summarized.
2. Problem Description
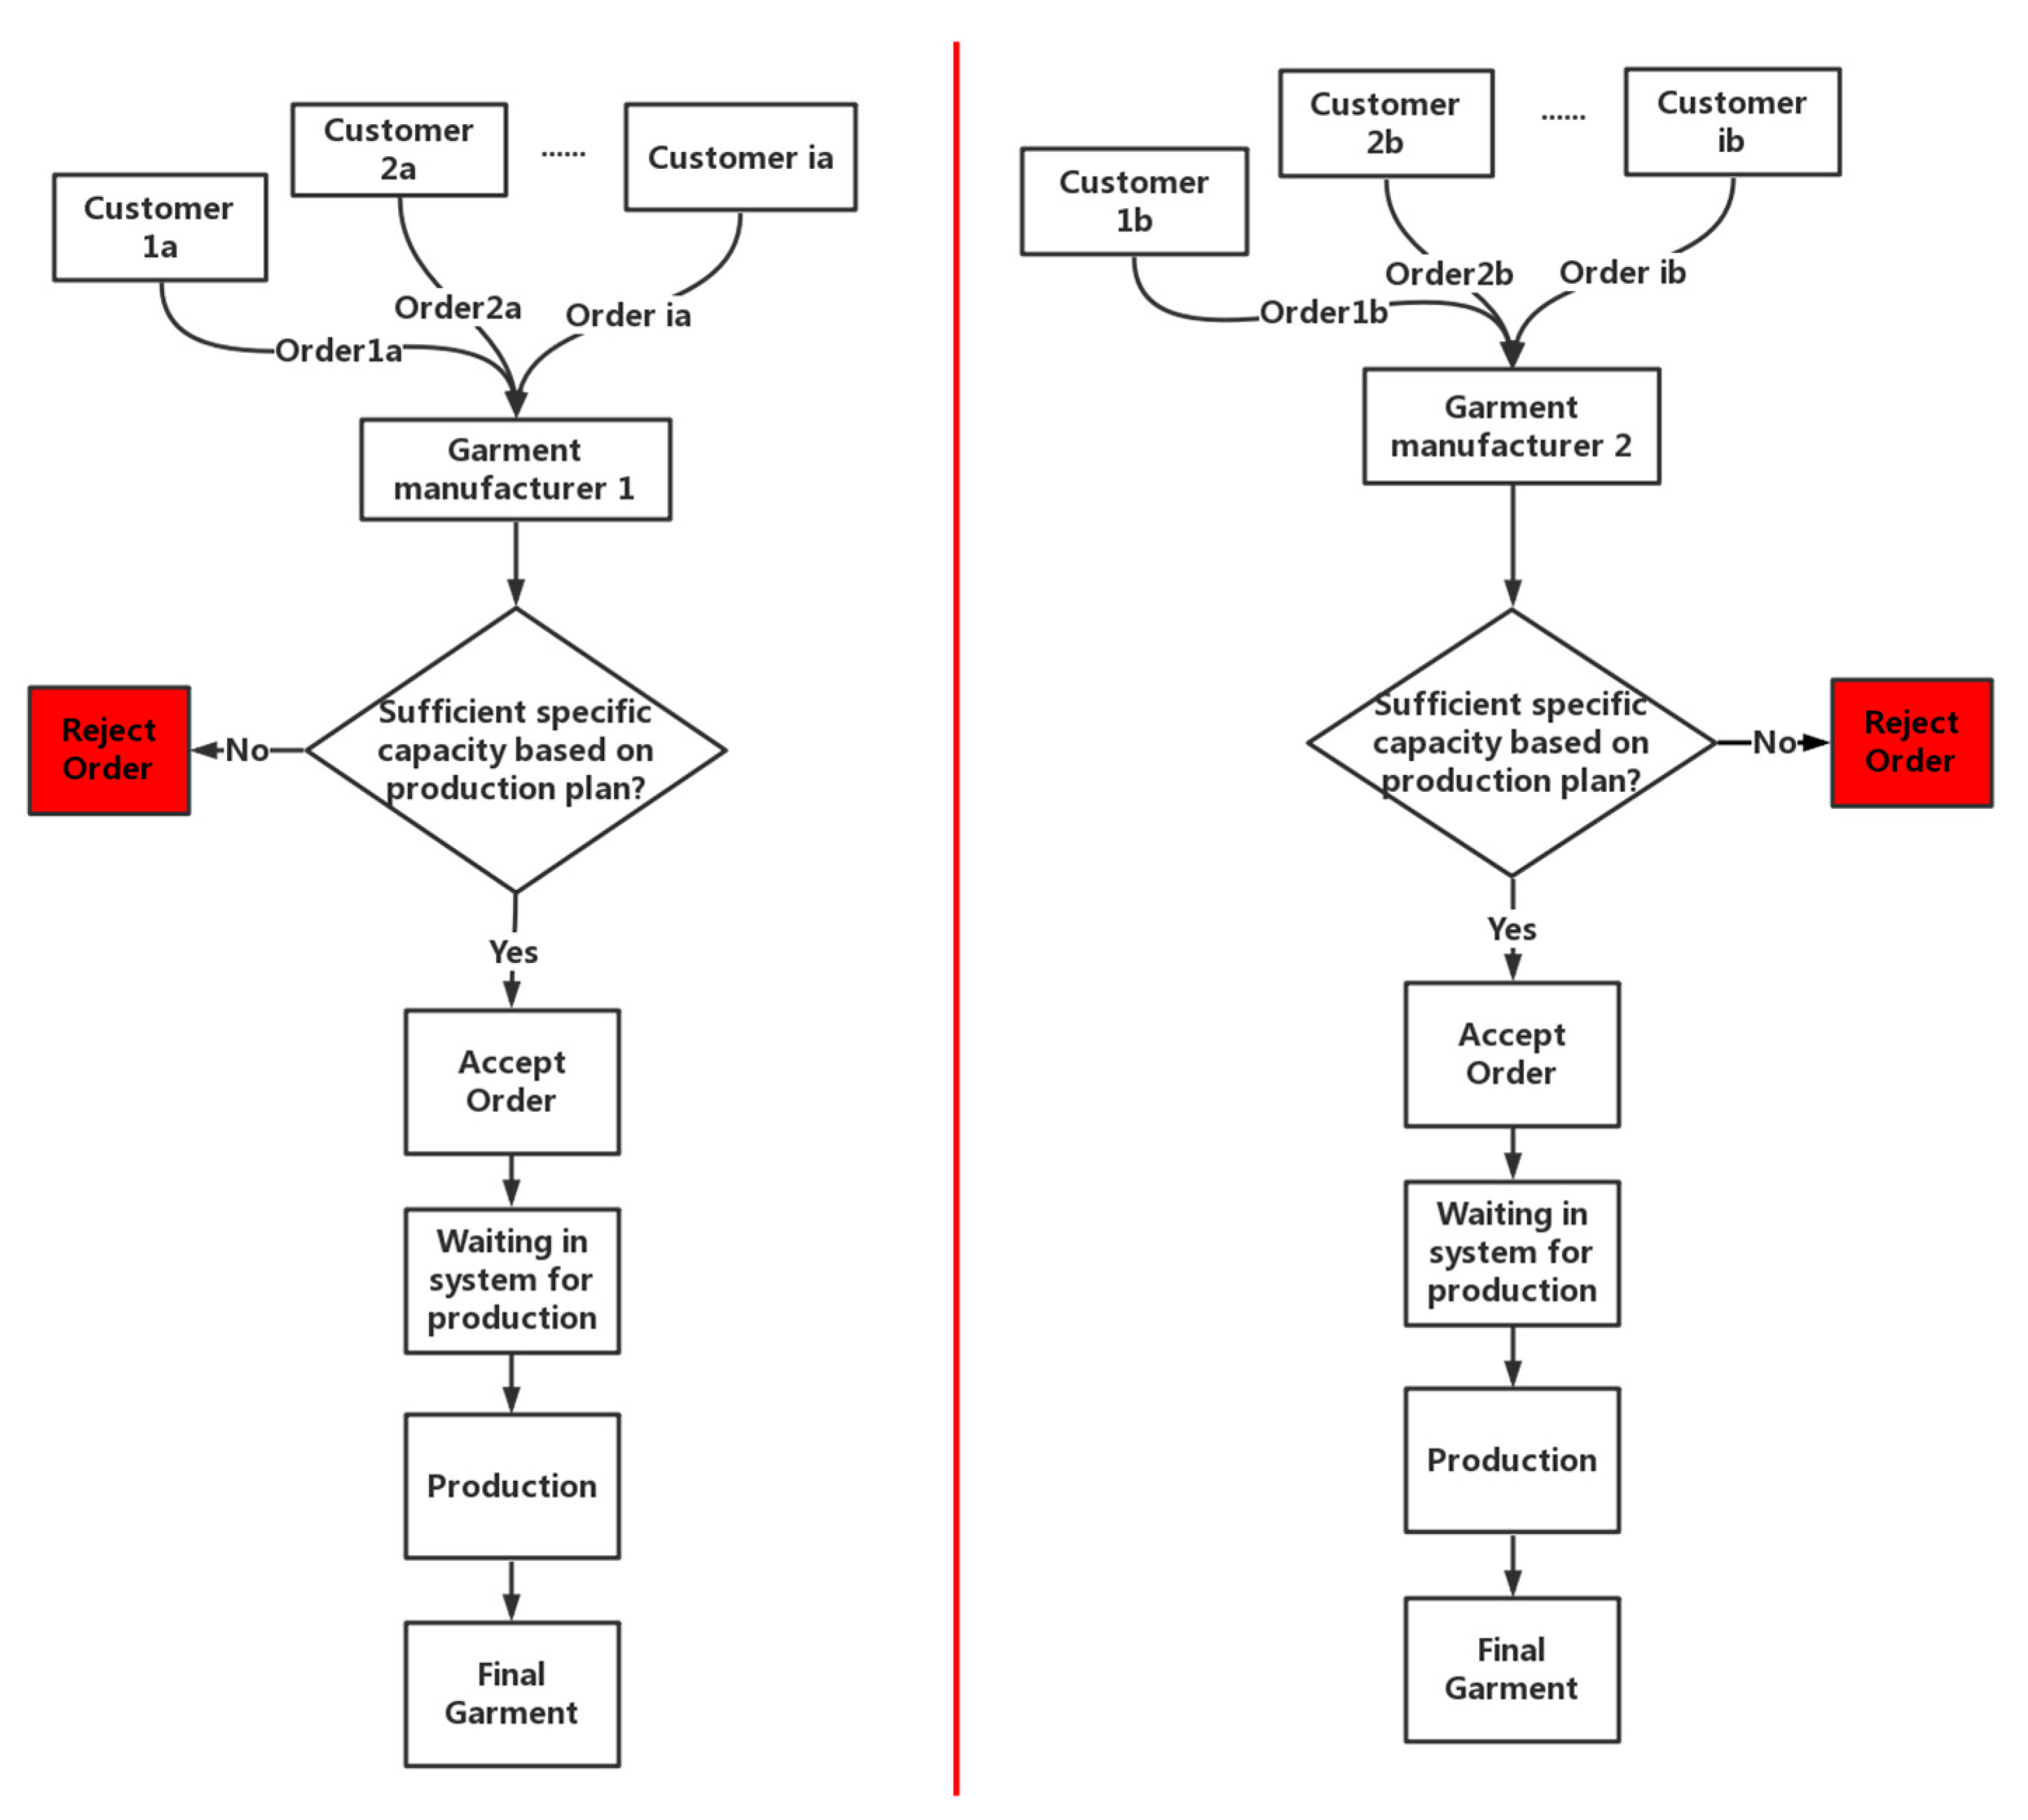
In traditional garment production models (
Figure 1), customers stochastically place different garment production orders to garment manufacturers. Garment manufacturers then check their recent production plan. If there is sufficient capacity (e.g., specific operators and machines) for the received order, then the manufacturer would accept it and put it into the system, waiting for production. Otherwise, the manufacturer would reject the order due to limited capacity over a short period of time.
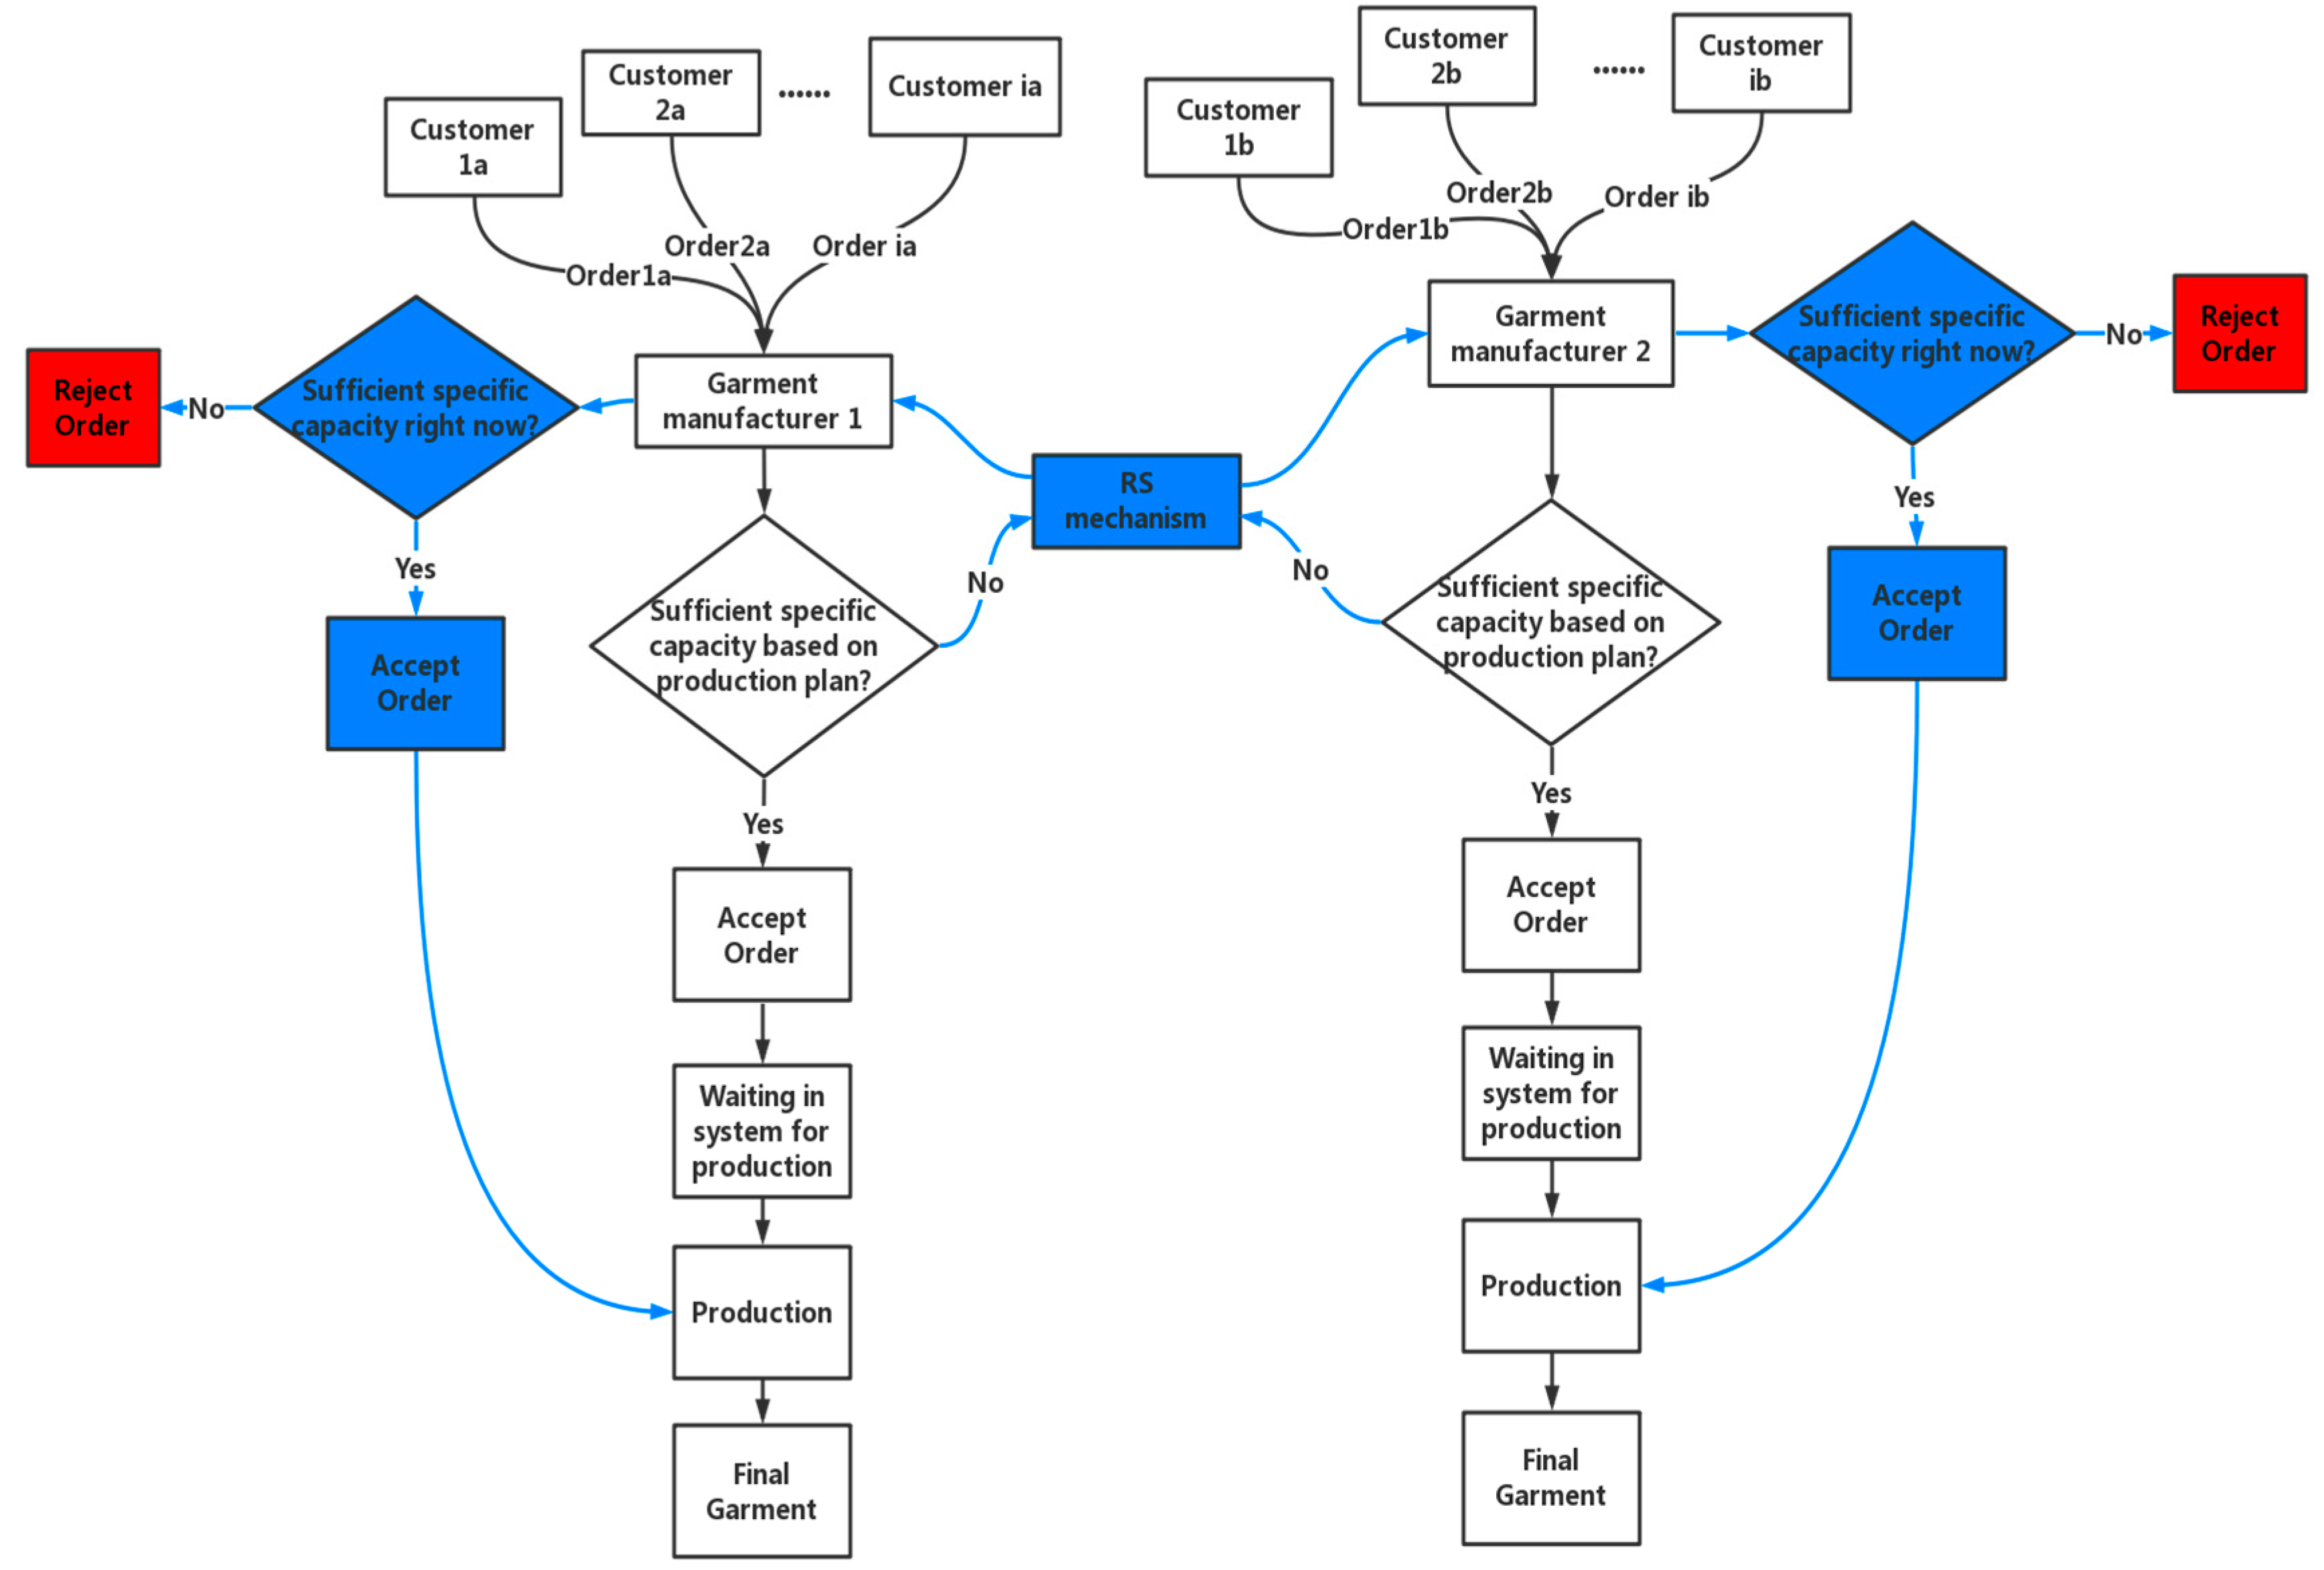
Under our proposed RS mechanism, manufacturers become collaborative partners with each other. On the premise of ensuring that the production of self-owned orders is not affected, production capacity is shared among partners based on mutual agreement. A flowchart of the production model under RS mechanisms is illustrated in
Figure 2. A new decision-making process is added on the basis of the traditional production model. If there is not sufficient capacity for the received order, instead of rejecting the order directly the manufacturer would share this order to its partner and demand production. If the partner has specific idle capacity for the received shared order, it would accept the shared order and start production. Otherwise, the order would be rejected.
Although the procedures and facilities used in garment production are generally similar between different manufacturers, there are still minor differences. To produce an order from an unfamiliar customer or produce an order of an unfamiliar product, it is normal to have more production issues, such as information asymmetry and unskillful processes. Considering all aforementioned situations, the production failure rate is inevitably increased for manufacturers producing a shared order. In the production of high quality premier garments, the process is more complex and the inspection criteria are stricter. Therefore, the failure rate would be even higher for premier garments compared to the increased failure rate for standard ones.
3. Methodology
The objective of the present study was to explore the precise influence of the proposed RS mechanism on sustainable production in the garment industry. Therefore, the evaluation criteria are essential. The method for sustainable production evaluation was introduced in
Section 3.1. Then, we conducted a simulation experiment on our proposed RS mechanism. The simulation experiment and scenario design were introduced in
Section 3.2.
3.1. Sustainable Production Evaluation
Various key performance indicators (KPIs) of sustainable production served as the evaluation criteria for different scenarios. To comprehensively evaluate the sustainability of garment manufacturing, KPIs were defined in terms of several important aspects of sustainability, including quality, cost, delivery, service, and environmental impact [
20]. Considering the feasibility of the RS production model in this study, four performance indicators were defined to represent the above aspects. The explanation and definition of the four sustainable production KPIs in the present study are presented in the following sections. The analytic network process (ANP) method was employed to calculate overall sustainable performance for every RS scenario to comprehensively evaluate the RS mechanism under different conditions.
Indices:
n: index of order type, n = 1, 2, …, N
m: index of each type order, m = 1, 2, …, M
i: index of manufacturer, i = 1, 2, …, I.
3.1.1. Lead Time
According to Z. Guo, H. Liu, D. Zhang, and J. Yang [
20], delivery is an important aspect in evaluating the sustainability of garment suppliers. We chose lead time (
LTi), because this plays a vital role in evaluating delivery level, as a representative aspect of delivery. Besides delivery, lead time has an influence on various other aspects of sustainability, including customer satisfaction and even cost. In the present study, customers stochastically set different required lead times for each order. If manufacturers accept the order but fail to deliver in time, a penalty is incurred. In the present study,
LTi stands for the average lead time for all types of orders in
i manufacturers.
3.1.2. Average Unit Cost
To simplify the model, we only considered costs directly influenced by RS, including labour costs and raw material costs. We also set a penalty for the late delivery of orders, as introduced in
Section 3.1.1. Therefore, total cost (
TCi) is calculated as Equation (1).
where
Yn is total product yield (including failed products) of order type
n,
RCn is raw material and processing cost per product of order type
n,
LC is labour cost per day,
TT is total working days,
LTnm is real lead time for order
m in type
n,
RLTnm is required lead time for order
m belonging to type
n set by customer,
p is penalty for late delivery per day.
A manufacturer may have high total costs due to high productivity, leading to a higher quantity of raw materials required for production. However, the cost per product may be lower than another low-productivity manufacturer who has low total cost. Therefore, total cost in the same period of time cannot reflect the real cost level of each scenario. We calculated and compared average unit cost (
ACi) to represent the cost aspect of each scenario. As products have different qualities and values, it is also unfair to divide total cost into the total yield of various types of products. Therefore, we designed real yield (
RYi) to neutralize the different product values by taking production time into consideration. We introduced a factor
where
PTn represents standard production time of product in order type
n and
PTmin is minimum standard production time among all types of products. Therefore, based on Equations (1) and (2), we derived
Based on Equations (1) and (3), the average unit cost is calculated as follows:
3.1.3. Customer Satisfaction Index
High customer satisfaction can help companies maintain good relations with customers, leading to a sustainable relationship. As introduced in
Section 2, manufacturers may reject an order from a customer if they do not have sufficient capacity in a short period of time for the incoming order. Because it is important for manufacturers to maintain sustainable relationships with customers, it is better not to reject a customer order. Therefore, an order accept rate (
OARi) was introduced as follows.
where
AOn is the total number of accepted type
n orders,
ROn is the total number of received type
n orders.
On-time delivery is another key factor to keep high customer satisfaction. We calculated on-time delivery rate (OTRi) for the experiment as Equation (6).
where
COn is the total number of completed type
n orders,
OTOn is the total number of on-time delivery type
n orders.
Considering the aforementioned two indicators, a customer satisfaction index (CSIi) was designed to reflect service aspects in sustainable production performance as follows.
3.1.4. Resource Waste Index
Maximizing facility utilization is pursued by every manufacturer. It is beneficial for both economic and sustainability reasons. High facility utilization means less waste of energy and resources. Therefore, we calculated facility utilization (FUi) for each scenario in the simulation experiment as follows.
where
PT is the real production time of all operators and machines,
TT is total working days.
Failed products are another type of waste so we merged production failure rate, which varies depending on product quality and RS mechanism, into the index. Resource waste index (RWIi) was designed as Equation (9). This reflects quality and environmental aspects in sustainable production evaluation.
where
FRn is the production failure rate of order type
n,
kn is the increased rate of failure for the production of order type
n under the RS mechanism.
3.1.5. Overall Sustainable Performance Index Based on an Analytical Network Process
We want to evaluate the overall sustainable performance under each scenario; however, it is difficult to compare simply based on each of the aforementioned KPIs. They have different scales. One scenario might have a high customer satisfaction rate and long lead time, while another scenario might have a low customer satisfaction rate and short lead time. Therefore, an overall sustainable performance index (OSPI) is needed by using a multi-criteria decision-making technique. In the present study, we employed Analytic Network Process (ANP) as an OSPI definition. ANP is a multi-criteria decision-making approach developed by Thomas L. Saaty [
21] that considers the interdependent relationships between factors in decision-making [
22]. In the present study, the four sustainable KPIs that were designed are mutually related to some extent, e.g., shortening lead time may increase customer satisfaction. AHP (Analytic Hierarchy Process), which is perhaps the most common multi-criteria decision analysis method, is not appropriate in the present study because AHP needs to be conducted under the assumption that criteria are independent. ANP reflects not only multi-criteria feedback but interdependent relationships between criteria and alternatives so a more accurate evaluation can be obtained [
23]. ANP can quantify qualitative criteria (the four sustainable production KPIs in the present study) and it is based on pairwise comparisons (comparing different scenarios of the simulation experiment in the present study). Considering all of the above reasons, ANP is appropriate for our study.
The four aforementioned KPIs became the four criteria in our ANP evaluation. The various scenarios designed for the experiment (introduced in
Section 3.2) served as alternatives. The influence of the four criteria with respect to each alternative is the same because each alternative is under the same conditions except for the production mechanism and the increasing production failure rate, which has no influence on judgement. We invited nine experts from the apparel manufacturing industry in China and Europe (including production engineers, general managers, and professors) for a group interview. As the influence of each criterion is distinct according to different objectives, we set various objectives to obtain the corresponding influence of criteria, such as a sustainability-, service-, or profit-oriented objective. For each objective, the experts were asked to reach a common conclusion regarding the influence of criteria with respect to each alternative. In the present study, for a sustainability-oriented objective, the influence of each criterion with respect to each alternative was set as follows:
ACi (influence = 4) >
RWIi (influence = 3) >
CSIi (influence = 2) >
LTi (influence = 1). The criteria pairwise comparison matrix with respect to each alternative is shown in
Table 1. For the inner dependency of the four criteria, cost and customer satisfaction are influenced by lead time as already mentioned. The pairwise comparisons for evaluating alternatives with respect to each criterion were calculated by their corresponding output based on the simulation experiment (shown in Table 6).
Table 2 indicates the pairwise comparison matrix of all alternatives in terms of a customer satisfaction index for M1. For example, based on Table 6, the customer satisfaction indices of scenario T and scenario RS2320 were 0.6466 and 0.823, respectively, for M1. Therefore, the influence of scenario T compared to scenario RS2320 with respect to the resource waste index was 0.6466/0.823 = 0.7857, while the influence of scenario RS2320 compared to scenario T was 0.823/0.6466 = 1.2728. All the pairwise comparisons for evaluating alternatives were calculated in this way, therefore the pairwise comparisons were undoubtedly consistent. All the weighted and unweighted supermatrices of ANP are shown in
Table A1,
Table A2,
Table A3,
Table A4,
Table A5 and
Table A6 in
Appendix.
3.2. Simulation Experiment and Scenario Design
It is impossible to run a RS mechanism experiment in a real-world industry. It is also hard for traditional analytical methods, such as Markov chain model, to address the stochastic nature and complex constraints in the garment production models introduced in
Section 2. To more accurately reflect the real situation in garment production, discrete-event simulation technology was used in the present study to manipulate the RS mechanism and explore its sustainable performance under different conditions. Discrete-event simulation is “the modelling of a system as it evolves over time by a representation in which the state variables change instantaneously at separate points in time” [
24]. It has been widely used in studies regarding production [
25,
26]. Discrete-event technology can model complex real-world systems with stochastic variables and events. It can also be used for optimizing and solving complex problems which are difficult to solve by standard mathematical modelling methods, e.g., linear programming. In this section, the simulation model was introduced in
Section 3.2.1. The experiment design and scenario design was introduced in
Section 3.2.2.
3.2.1. Simulation Model
SIMIO (SImulation Modelling framework based on Intelligent Objects) was utilized as the simulation engine for building the simulation model. It is one of the most common software packages used for building discrete-event simulation models. Two small-sized garment manufacturers were simulated in this study. Manufacturer 1 (M1) has 40 operators and the corresponding machines for garment production while manufacturer 2 (M2) has 50. We assumed all operators have the same skill to handle various types of garment production. All processes followed the FIFO (first-in-first-out) principle.
The inputs to the production model were the different types of orders placed by customers stochastically. Therefore, we defined orders at the beginning. We collected order data from a garment manufacturer located in Jiangsu Province in China which contained thousands of types of products. It is infeasible to define the order in the simulation model based on brand, style, pattern, quality, colour etc., and it is also meaningless for further analysis. By analyzing the collected data and interviewing garment industry professionals, we classified orders into six categories, as shown in
Table 3. Firstly, we classified orders into fashion-forward type and daily-basic type. For the fashion-forward type, customers placed orders more frequently but in relatively small quantities and they required delivery in a short time frame, as fashion changes frequently nowadays [
27]. For daily-basic types, customers preferred to place orders less frequently but in high quantities and the required lead time was relatively longer. Therefore, we defined three parameters—order frequency (OF), order size (size), and required lead time (RLT)—and set two levels for each to represent fashion type and daily-basic type. The difference in styles, patterns, and colours are mainly reflected in production time (PT); therefore, we defined three levels of PT. We also considered quality of product in the order classification. This was also reflected in PT in the simulation model. Premier products need more PT due to their stricter inspection criteria and more complex processes. We set fashion garment orders to premier type due to their more complex processes, while we set daily-basic orders to standard type due to their less complex processes. Corresponding parameters and probability distributions for six types of orders in this simulation model are indicated in
Table 4. In this way, the definition of orders in the simulation was simplified but still robust to represent the real situation in garment production.
3.2.2. Experiment and Scenario Design
As we described in the
Section 2, the production failure rate will increase if the order is shared to another manufacturer for production. To explore the influence of increased failure rate (
kn) and the threshold of
kn for improving sustainable production performance, we designed a list of scenarios with different
kn. As
kn is higher for the production of premier compared to standard garments, we set 3% for the difference of k
n between premier garment production and standard production in the simulation experiment (
k2n−1 −
k2n = 0.03). A 2% increase of
kn was set for each new scenario.
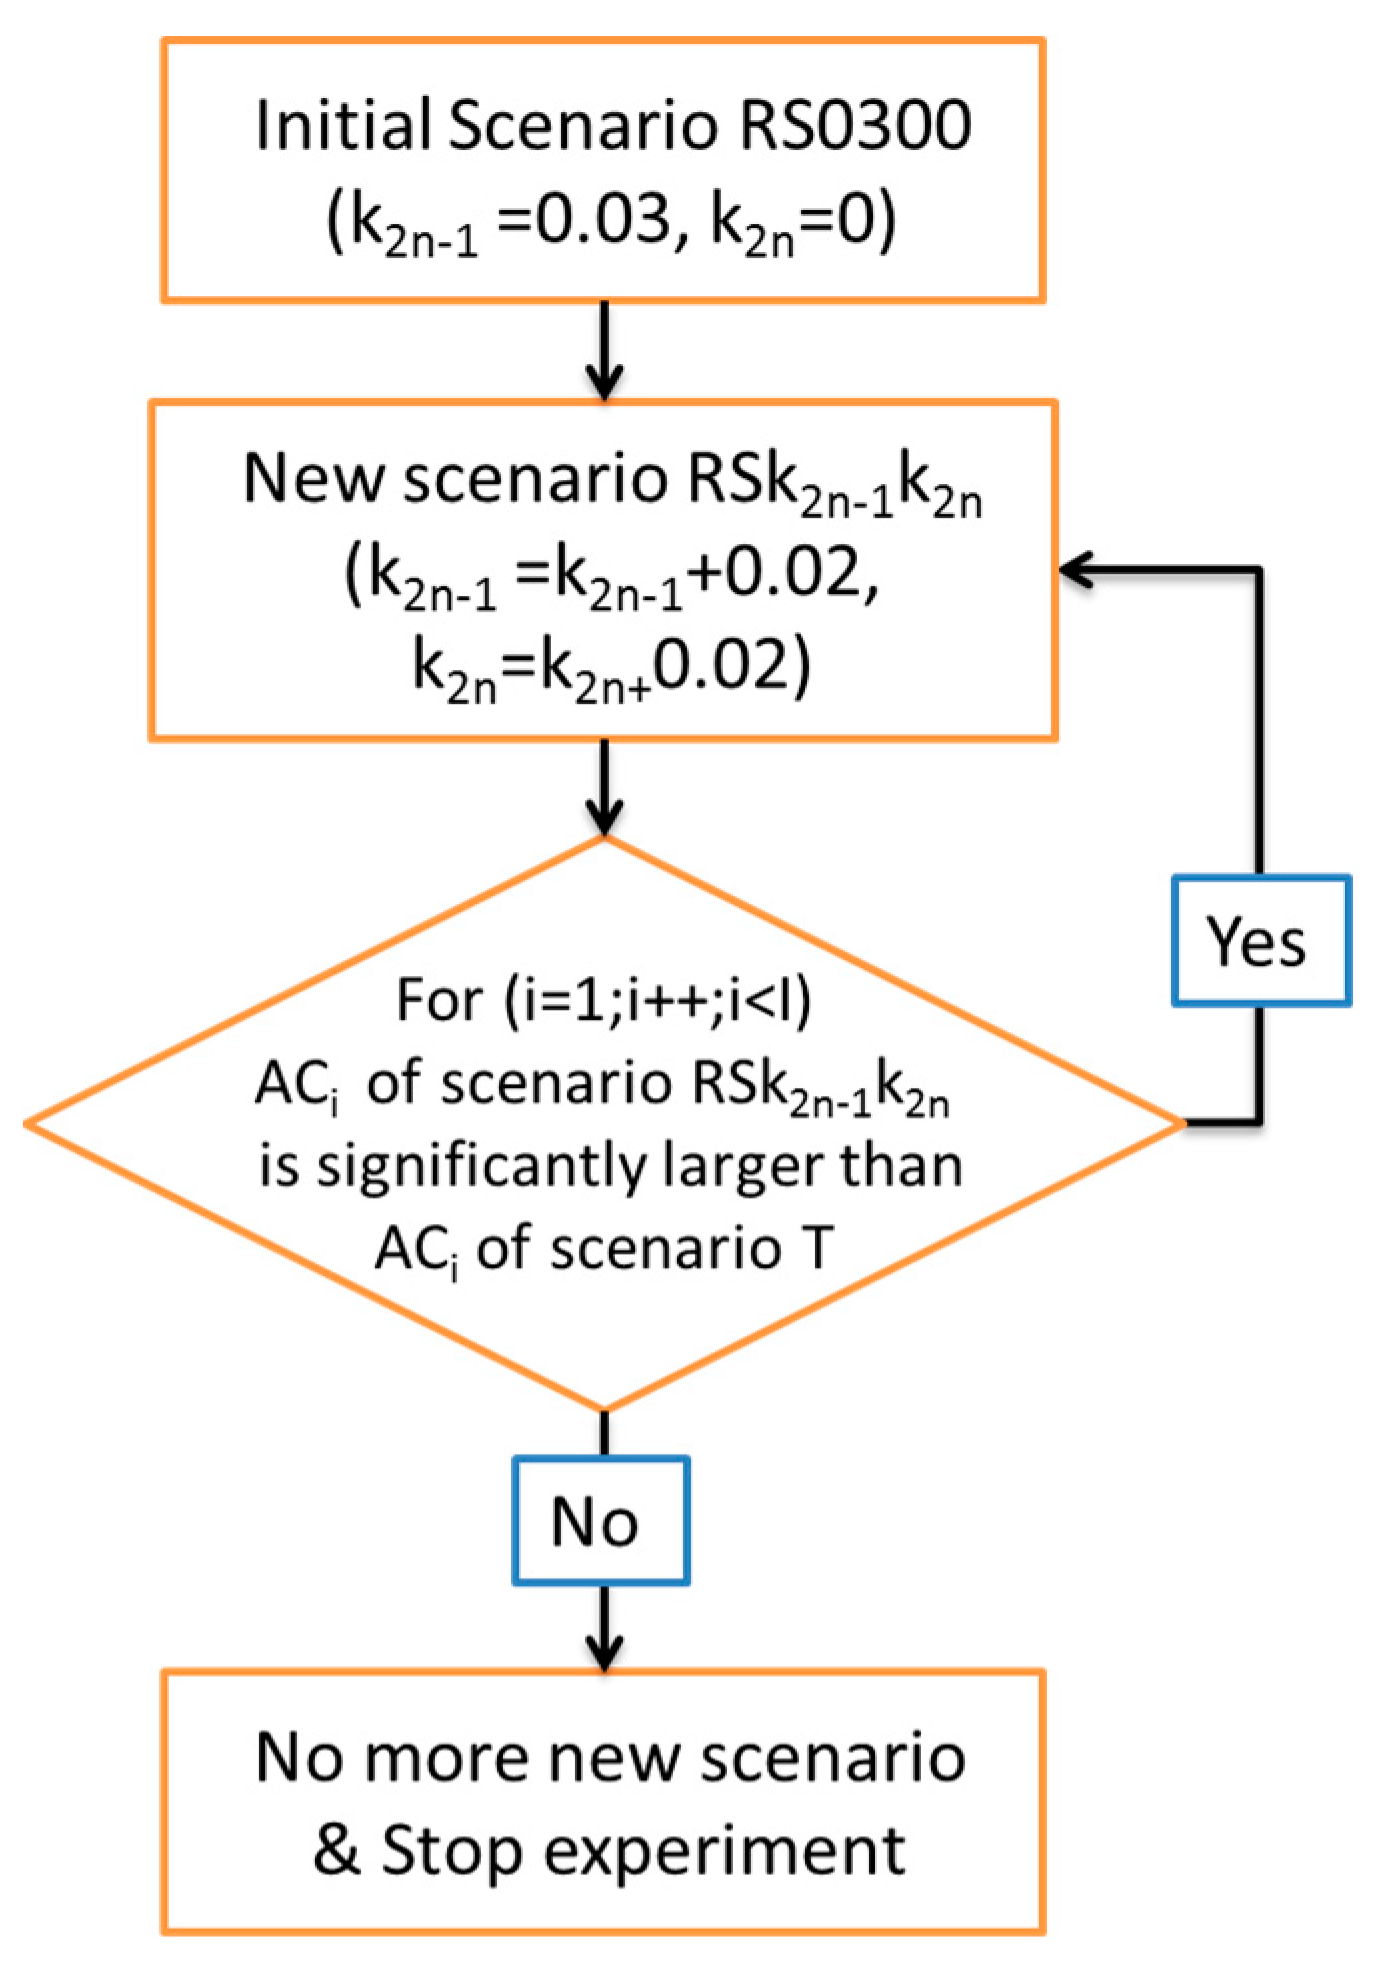
Scenario design and corresponding
kn is illustrated in
Table 5. The number in the name of each scenario stands for the
kn of production of premier fashion types and standard daily-basic types under the RS mechanism. Scenario T stands for the traditional production scenario which was the benchmark in the experiment. The output of each new RS scenario was compared to scenario T. An independent sample t-Test was performed after running each scenario in the simulation to determine whether there was a significant difference between two scenarios in terms of their KPIs. As manufacturers are always sensitive to cost and this is a preliminary motivation for implementing a RS mechanism (improving performance without additional investment), unit cost was determined as the stopping condition for the experiment. If there was a significant decrease in unit cost, then 2% was added to
kn, and a new scenario was generated for the next iteration of the experiment. If there was no significant difference or there was a significant increase in terms of unit cost for all manufacturers, which meant that the threshold of
kn was identified, no new scenario would be generated, and the experiment would be stopped. Output data for all generated scenarios were then exported for further analysis. The general flowchart of scenario generation is illustrated in
Figure 3. Once the threshold of
kn was identified, we conducted another experiment to explore the effect of the RS mechanism on the production of premier fashion type orders and standard daily-basic orders. We generated several new scenarios whose
kn was around the threshold while the RS mechanism was only applied for the production of either premier or standard type orders. By comparing the overall sustainable performance index, we can know which type of order is more demanding for the proposed RS mechanism.
4. Results and Discussion
We ran each generated scenario in the simulation experiment for 50 replications. In each scenario, a working schedule of five working days per week and eight hours per day was employed, and we simulated a total of 40 weeks. The output of scenario T, including yield, facility utilization etc., was compared to real data we collected from the manufacturer. In general, output data obtained from the simulation experiment was close to real data. Our model was developed totally based on the conceptual model and was debugged step-by-step. Therefore, our simulation model was valid and reflected the real situation for our case.
We conducted our experiment as we described in
Section 3.2.2. When the
kn reached 0.23 for premier fashion orders and 0.2 for standard daily-basic orders, there was no significant difference in the average unit cost of M1, M2 and the whole cluster (M1 + M2) between production models under the RS mechanism and traditional production model. When we increased
kn to 0.24 and then 0.25, there was still no significant difference and even a significant increase was discovered. This showed that the threshold of
kn for cost improvement was between 0.21 and 0.23 so we stopped generating new scenarios. All output data relevant to the defined sustainable KPIs of all scenarios with 50 replications were exported for further statistics analysis.
We calculated four defined sustainable KPIs for each replication based on the equation introduced in
Section 3.1 and calculated the mean value of 50 replications for each scenario. We also conducted independent
t-Tests on four KPIs of each generated RS scenario compared to scenario T, as shown in
Table 6. Values in green represent significant improvement, whereas values in yellow show that there was either no significant improvement or there was a significant decline. For M1, compared to scenario T, lead time and customer satisfaction indices were improved in all generated RS scenarios. The resource waste index increased in all RS scenarios due to the decrease of facility utilization as M1 is always overloaded in scenario T. For M2, the average unit cost and resource waste index were significantly improved in all generated scenarios (except RS2320), but the RS mechanism did not perform as well as M1 in terms of lead time and the customer satisfaction index. For the whole cluster, significant improvements were obtained in all scenarios (except RS2320) in terms of the four sustainable production KPIs. Therefore, the RS mechanism is really helpful for the whole industry cluster.
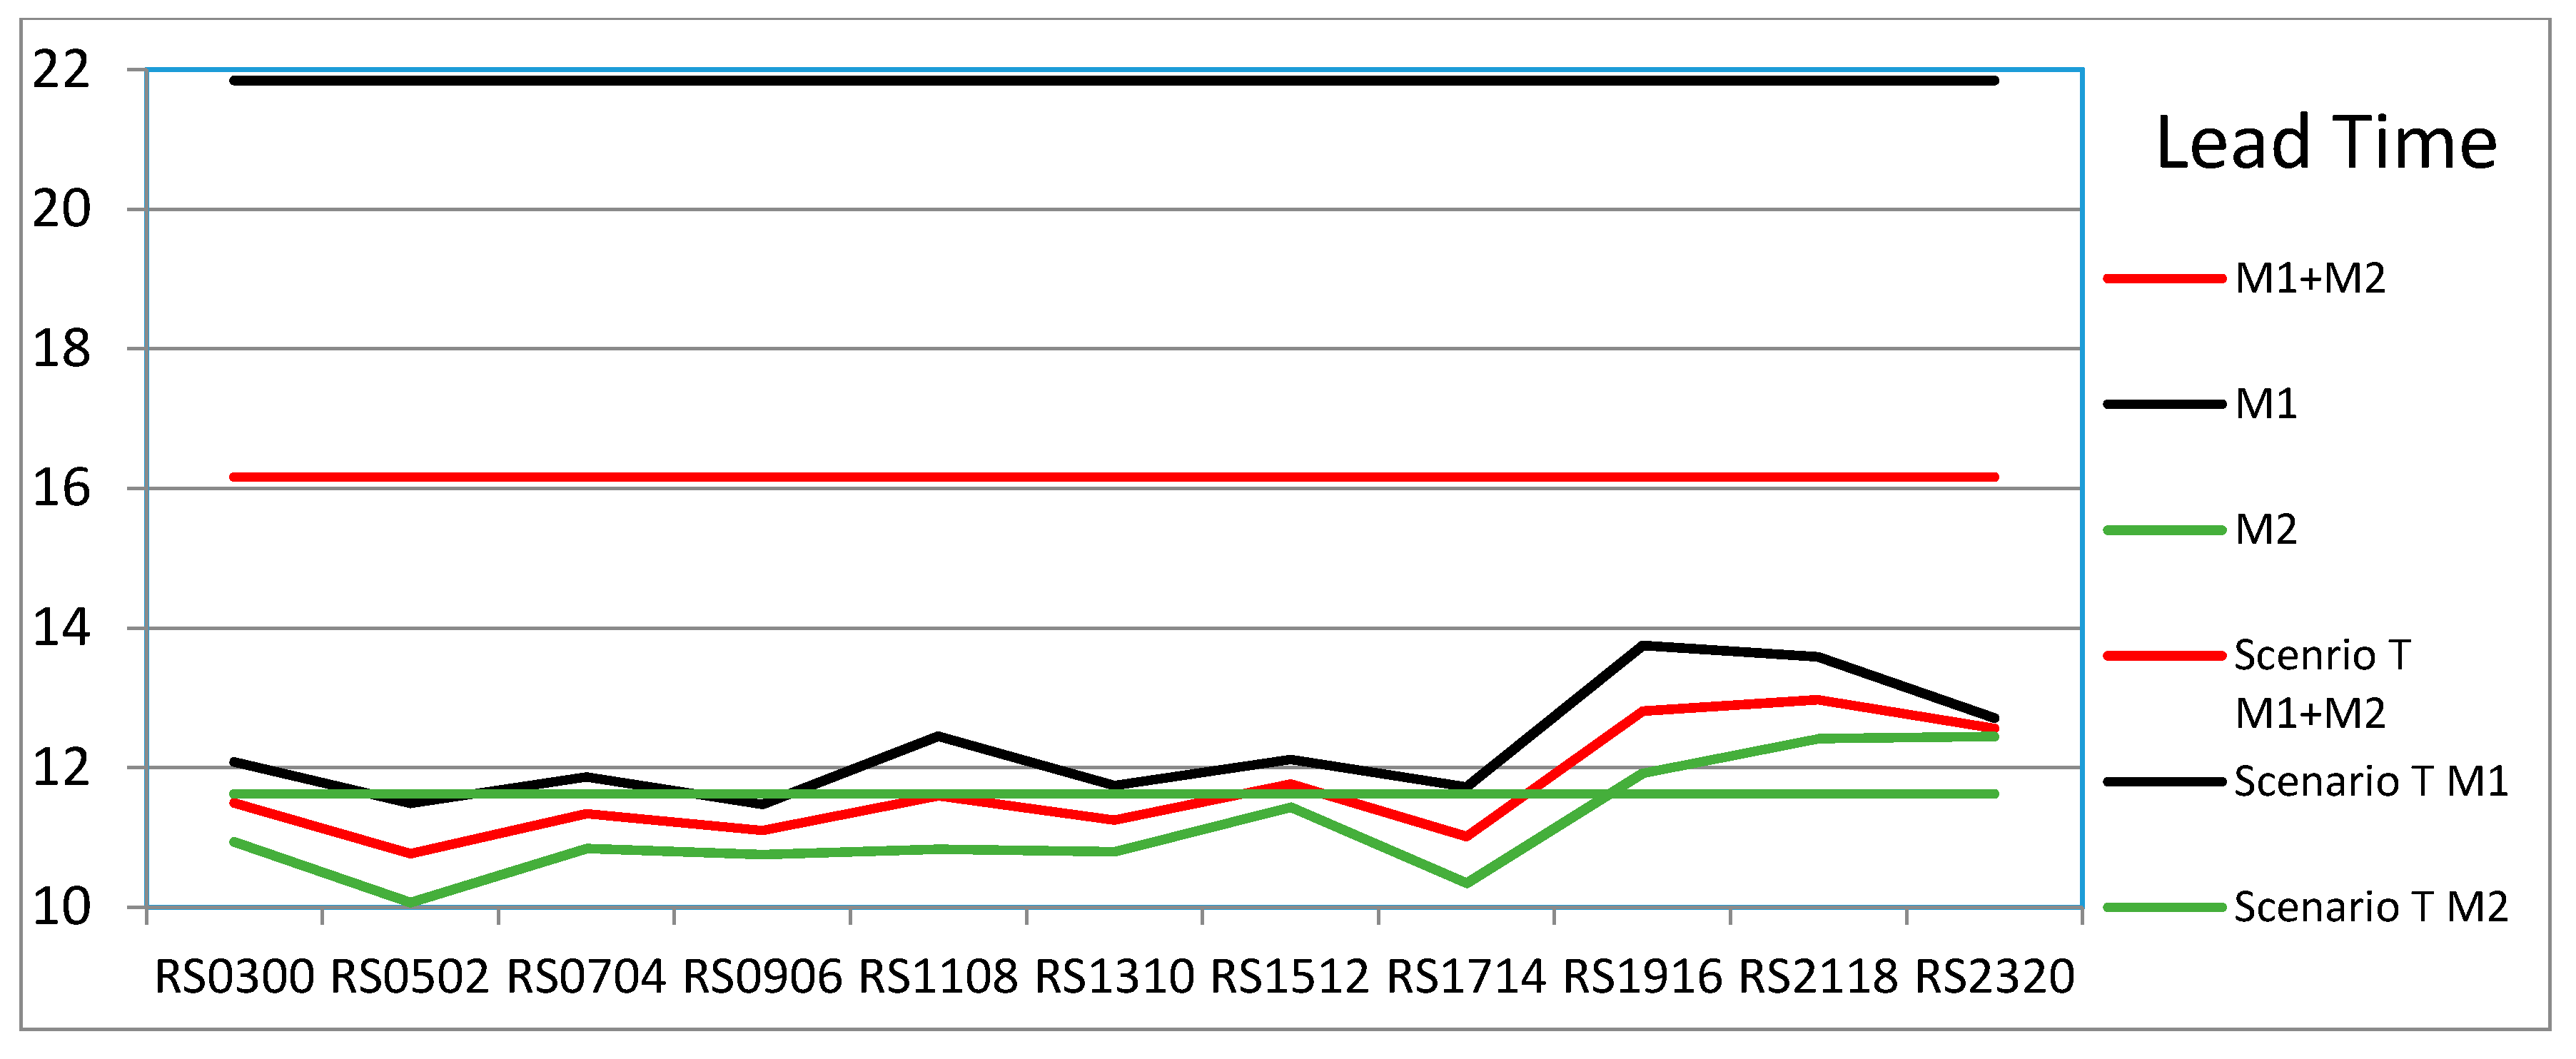
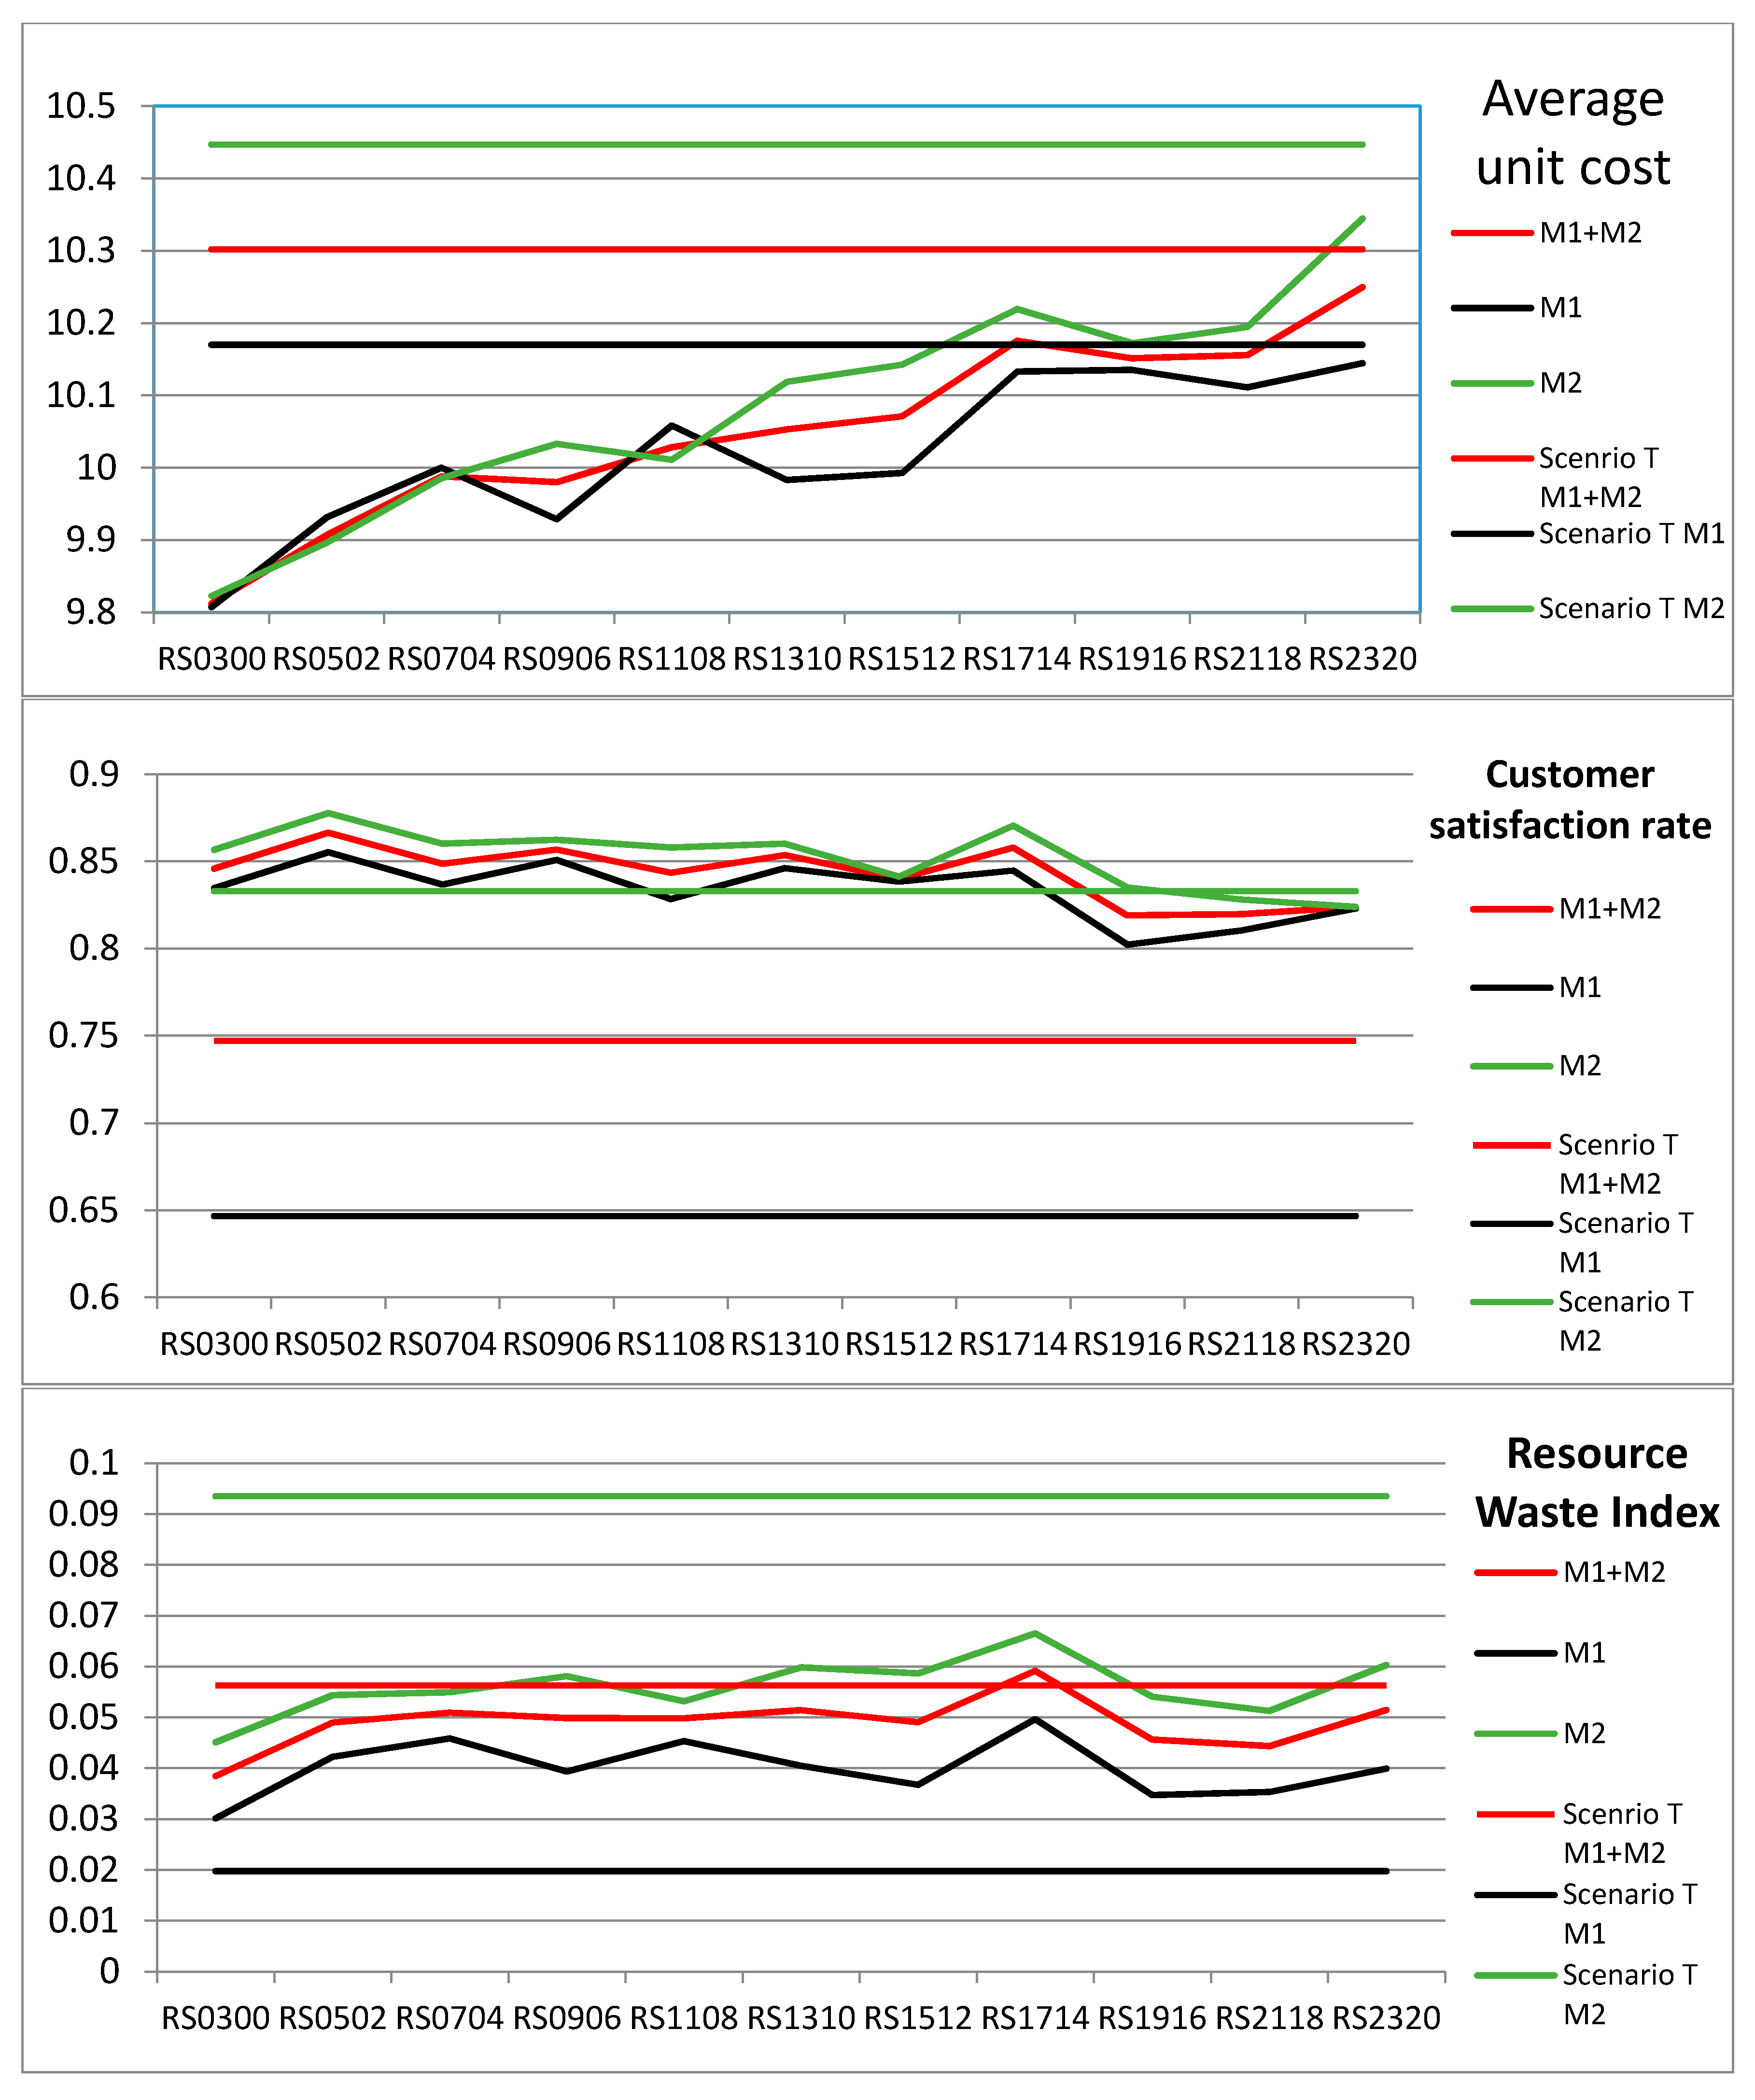
According to
Figure 4, we can see the influence of increased
kn on four defined sustainable production KPIs. In general, as
kn increased, all checked KPIs became gradually worse in M1, M2 and the whole cluster. If we calculated the increasing percentage of the last generated scenario (RS2320) compared to the first scenario (RS0300) in terms of all KPIs, the resource waste index increased the most with over a 30% increase in both M1, M2 and the whole cluster. The customer satisfaction index was the least influenced indicator with a 1.4% decrease in M1, 3.8% decrease in M2, and 2.6% decrease in the whole cluster. For lead time, the increasing percentage between RS2320 and RS0300 varied between 9.3% and 13.8%. For average unit cost, the percentage varied between 3.4% and 5.3%. For manufacturers who are more sensitive to resource waste, they should pay more attention to quality control when applying the RS mechanism. For manufacturers who are more sensitive to customer satisfaction, they can ignore to some extent the influence of increasing failure rate when applying the RS mechanism.
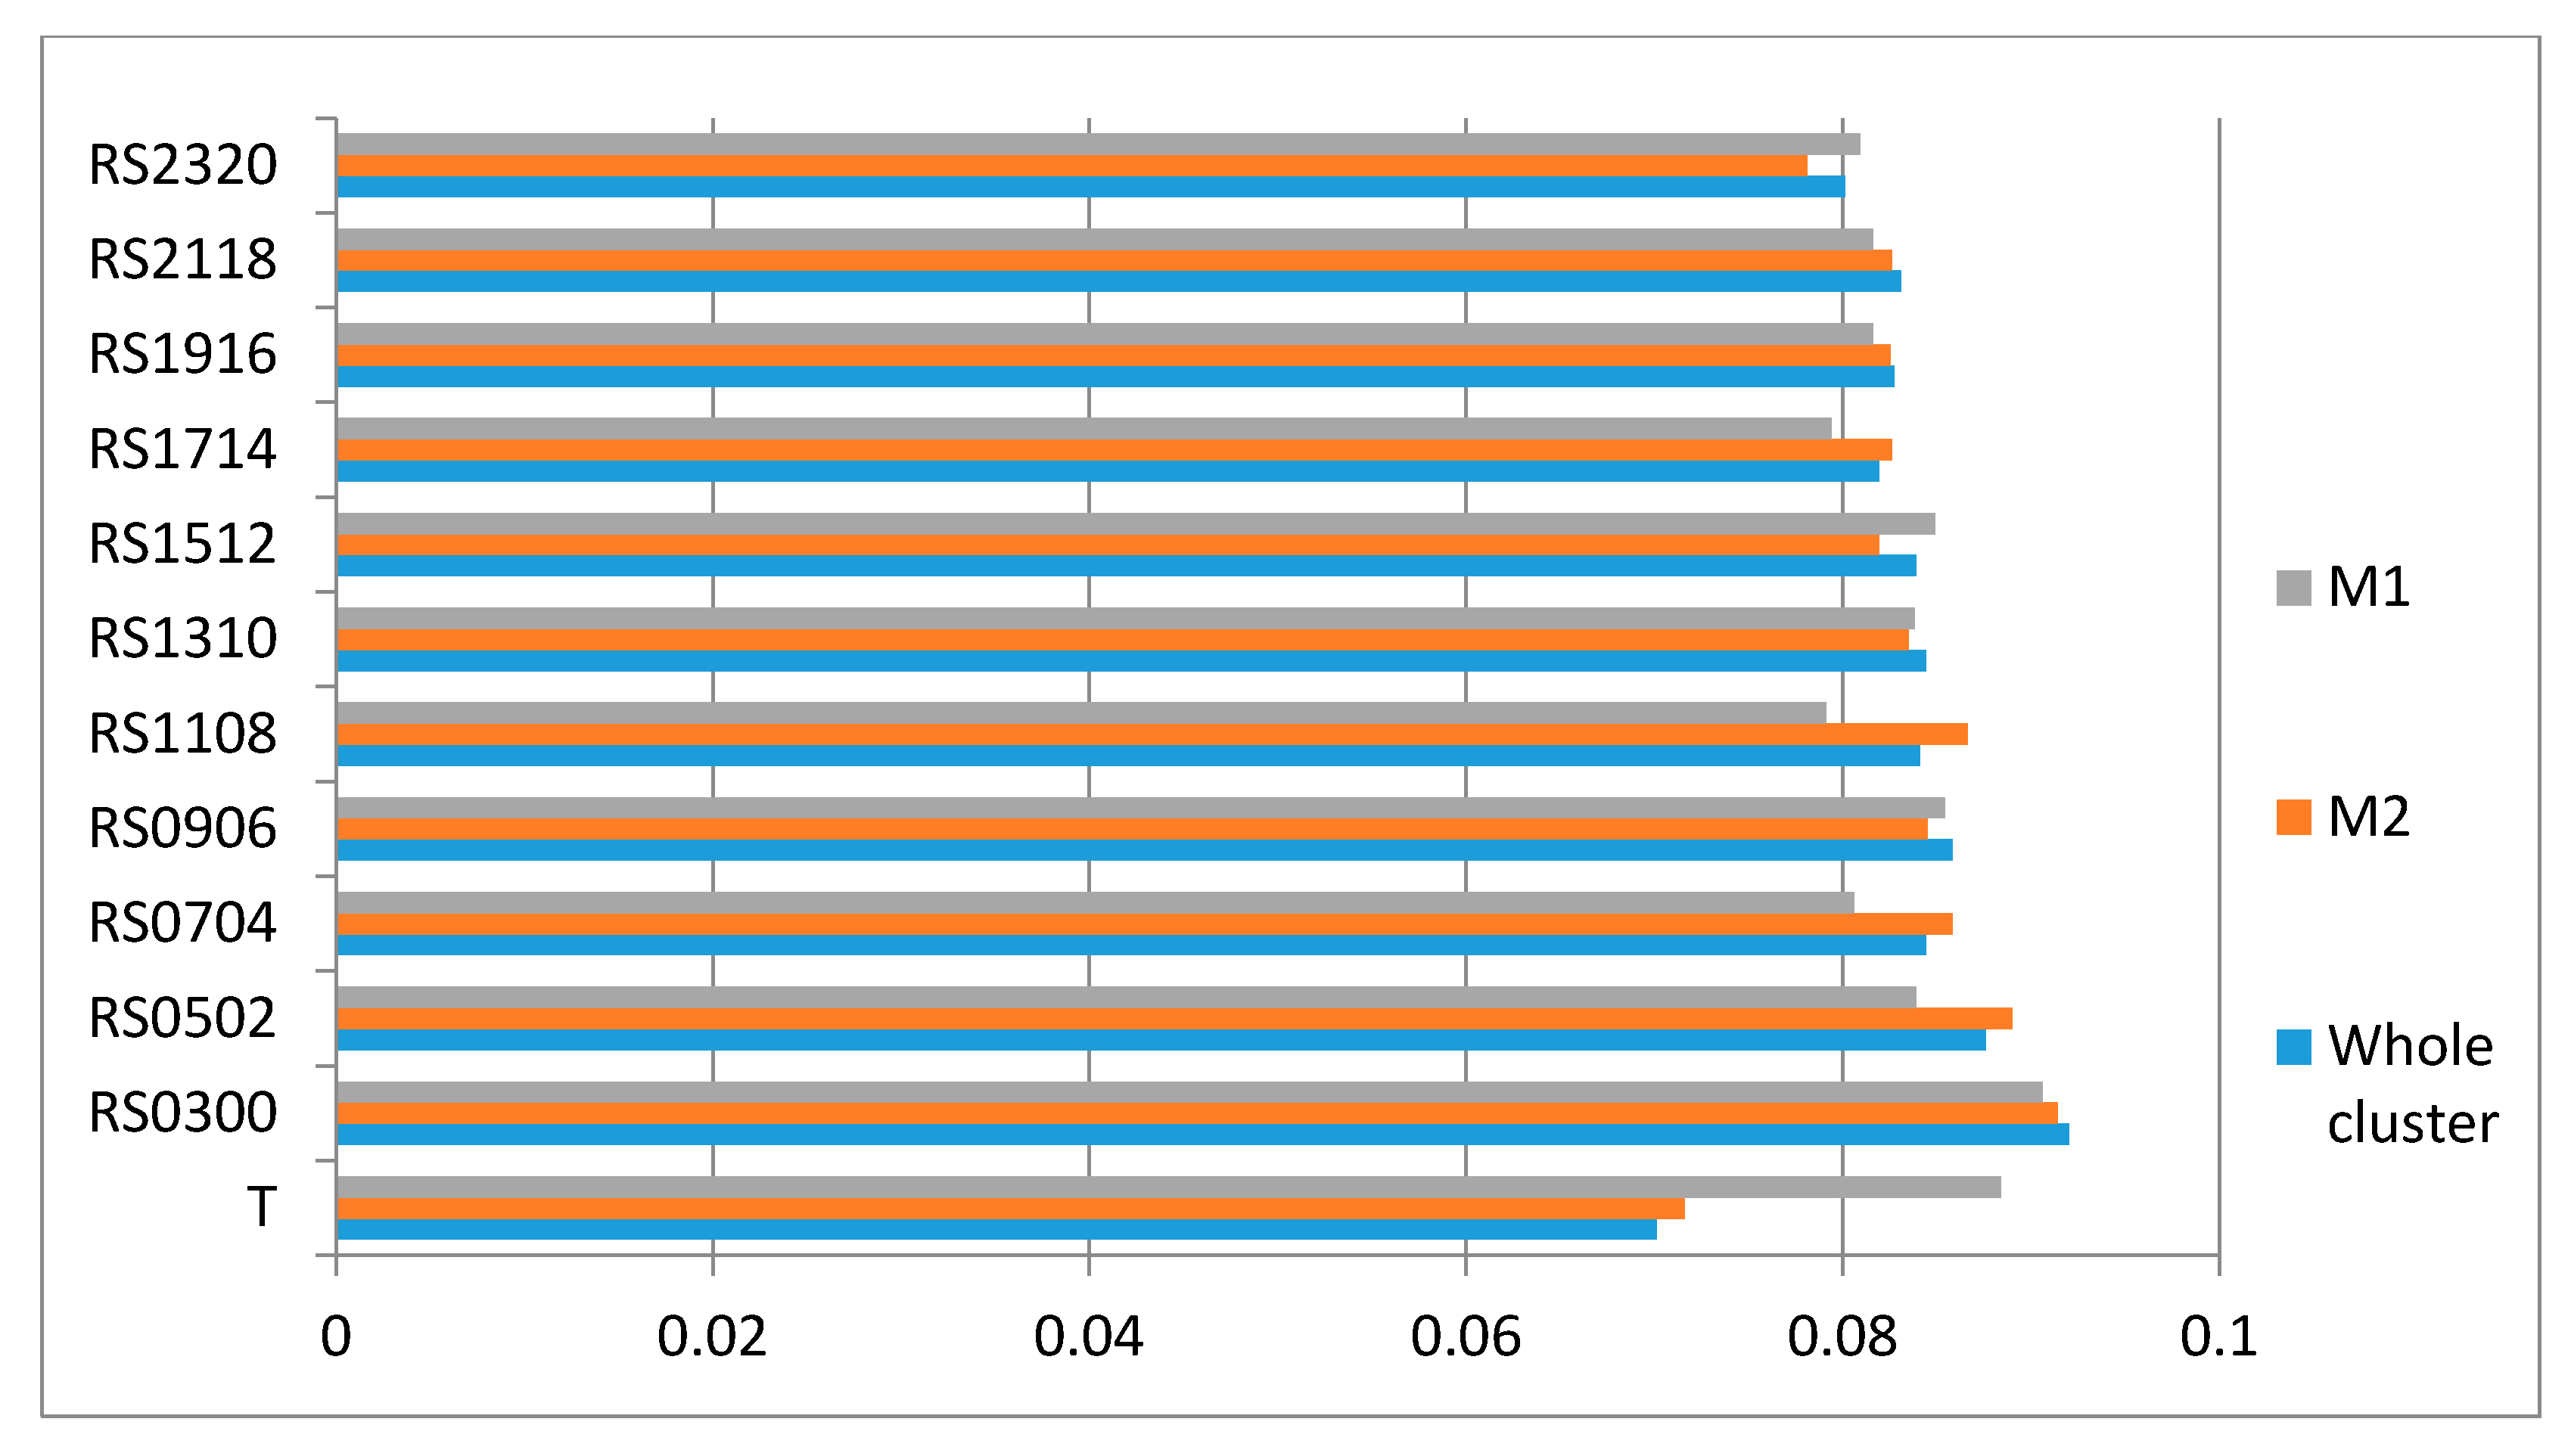
To evaluate the overall sustainable performance of each scenario, we calculated the OSPI for each scenario (
Figure 5) based on the ANP approach introduced in
Section 3.1.5. For the whole cluster, all RS scenarios obtained a higher OSPI than scenario T, which means that the RS mechanism can bring comprehensive benefits to sustainable production in the garment industry if the increasing failure rate can be maintained within a normal range. We found the same pattern regarding OSPI for M2; therefore, the same conclusion can be applied for manufacturers with relatively more resources in the whole cluster. For M1, only scenario RS0300 had a higher OSPI than scenario T. This means that, for manufacturers with relatively fewer resources compared to the whole industry cluster, the proposed RS mechanism could bring overall sustainable benefits but they should pay attention to quality control. If these manufacturers cannot guarantee high quality production, it is not a good option to apply the RS mechanism to improve sustainable production performance.
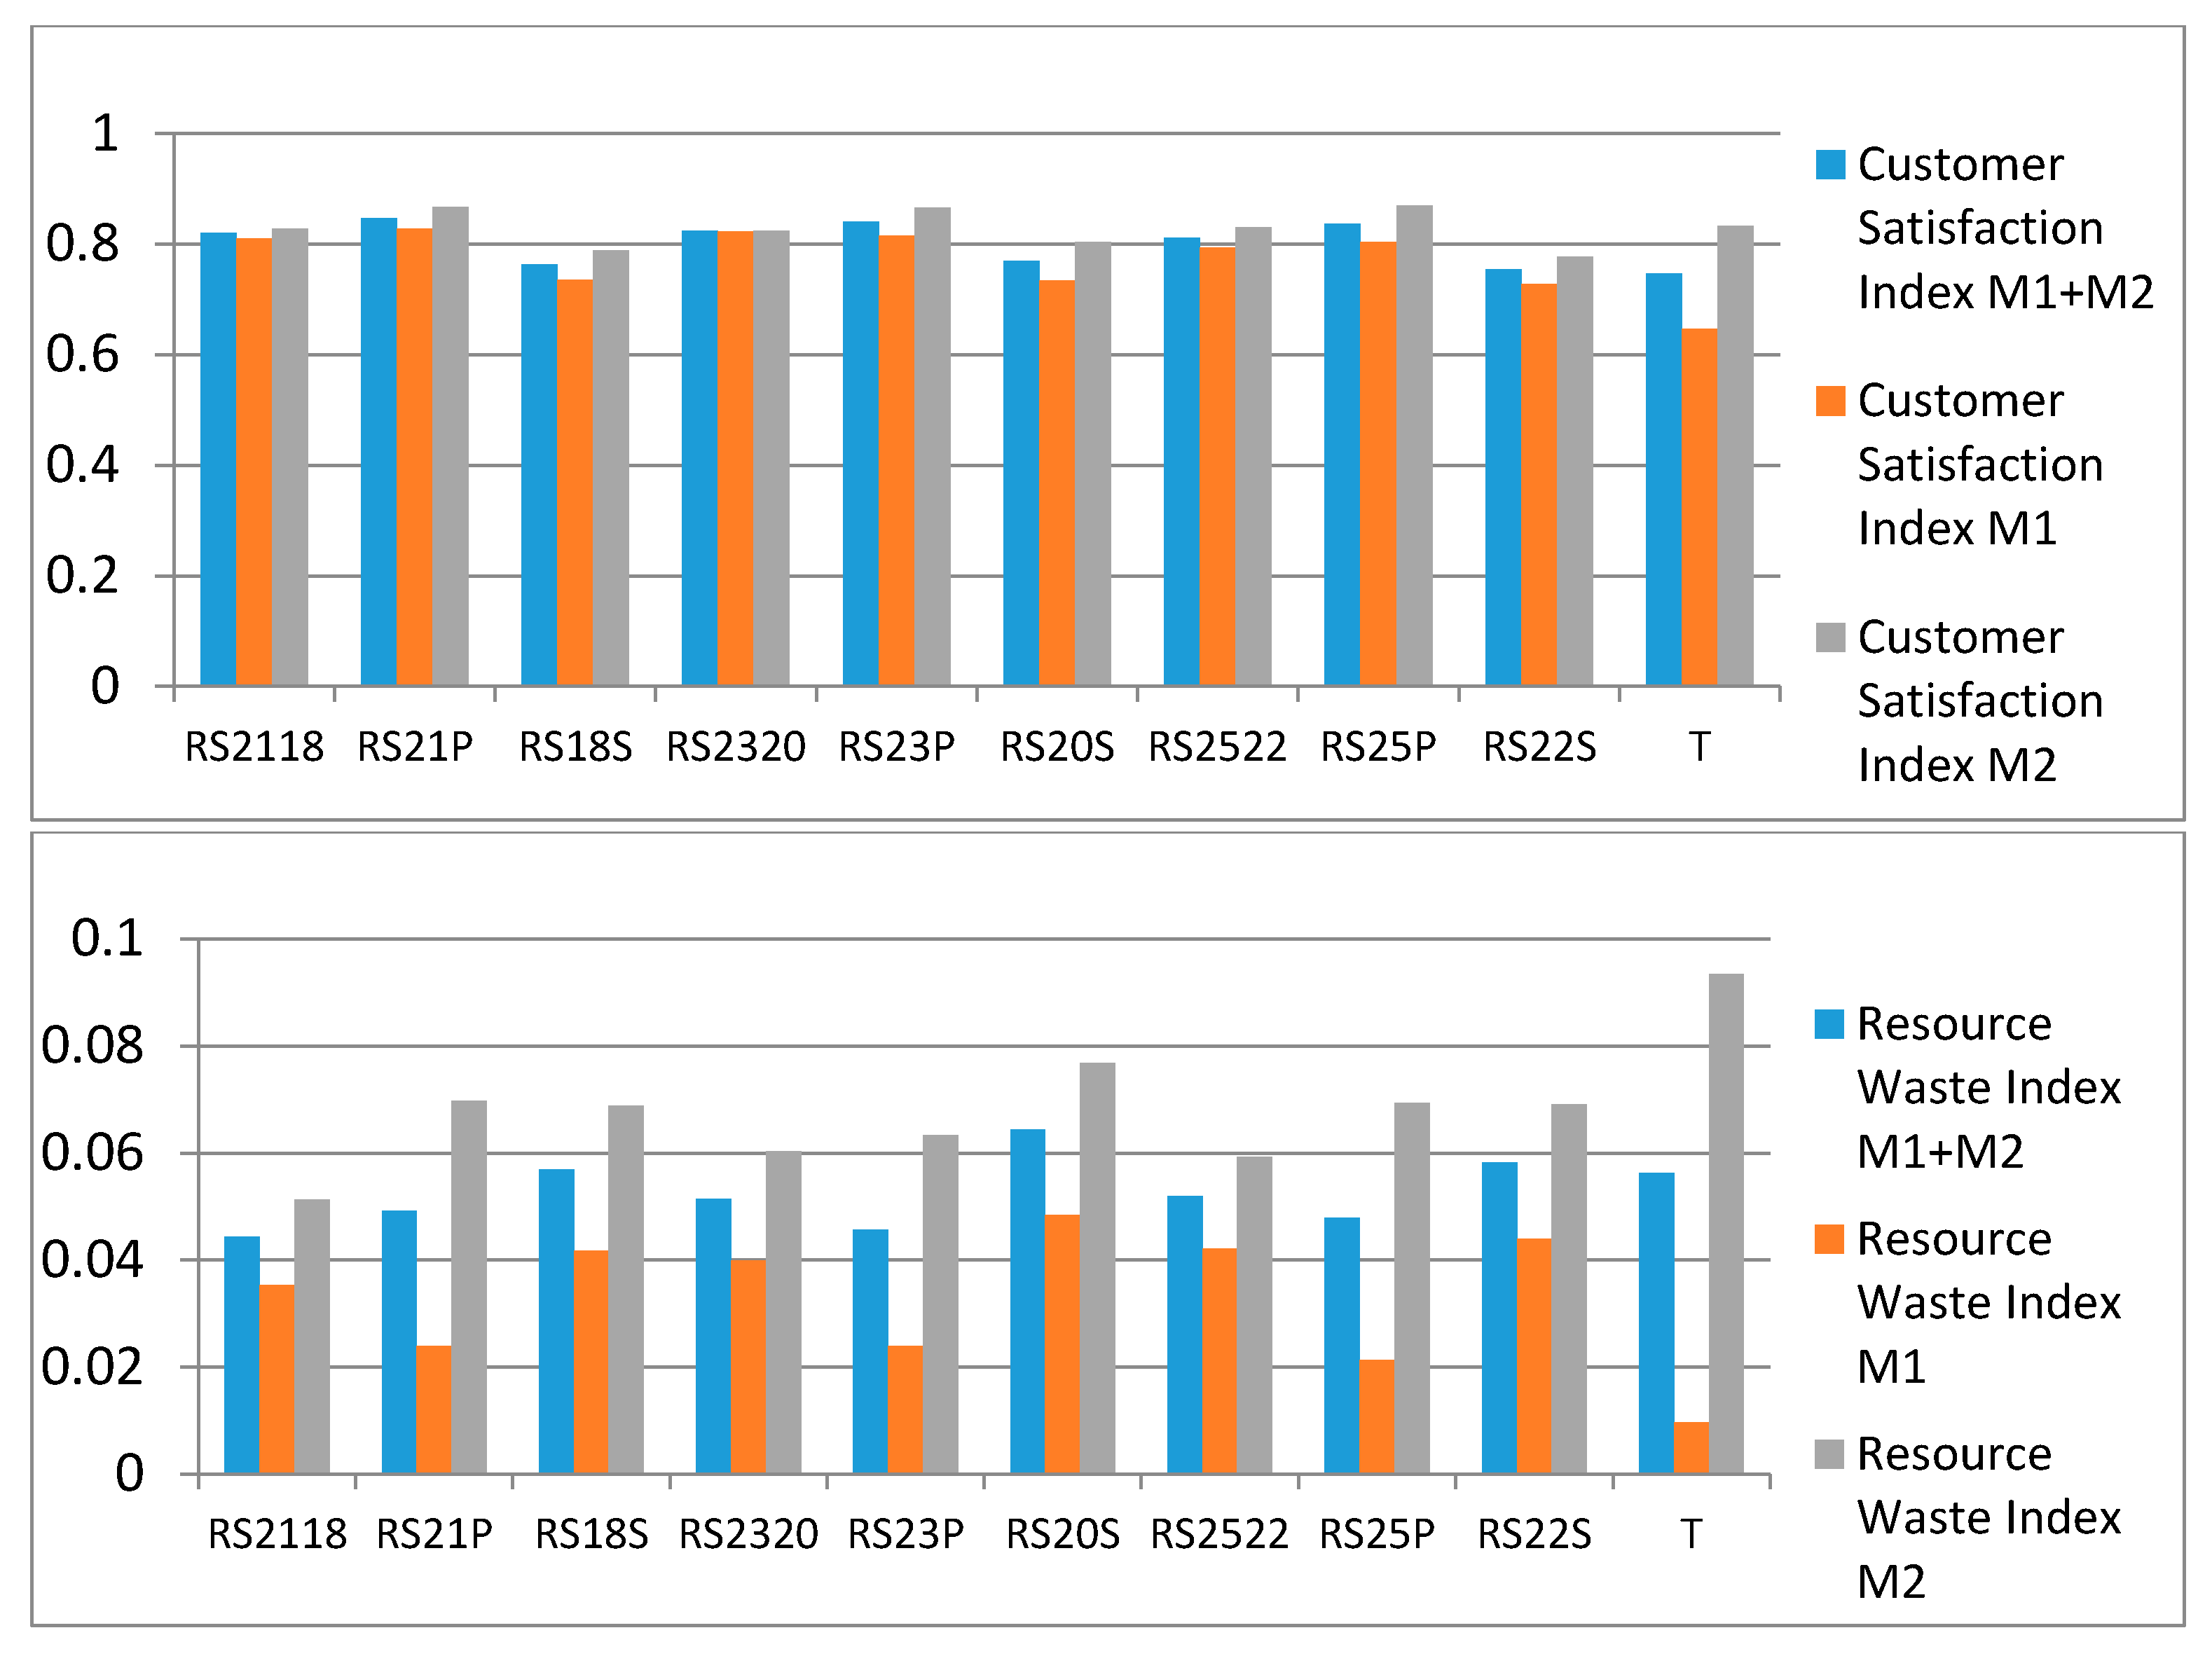
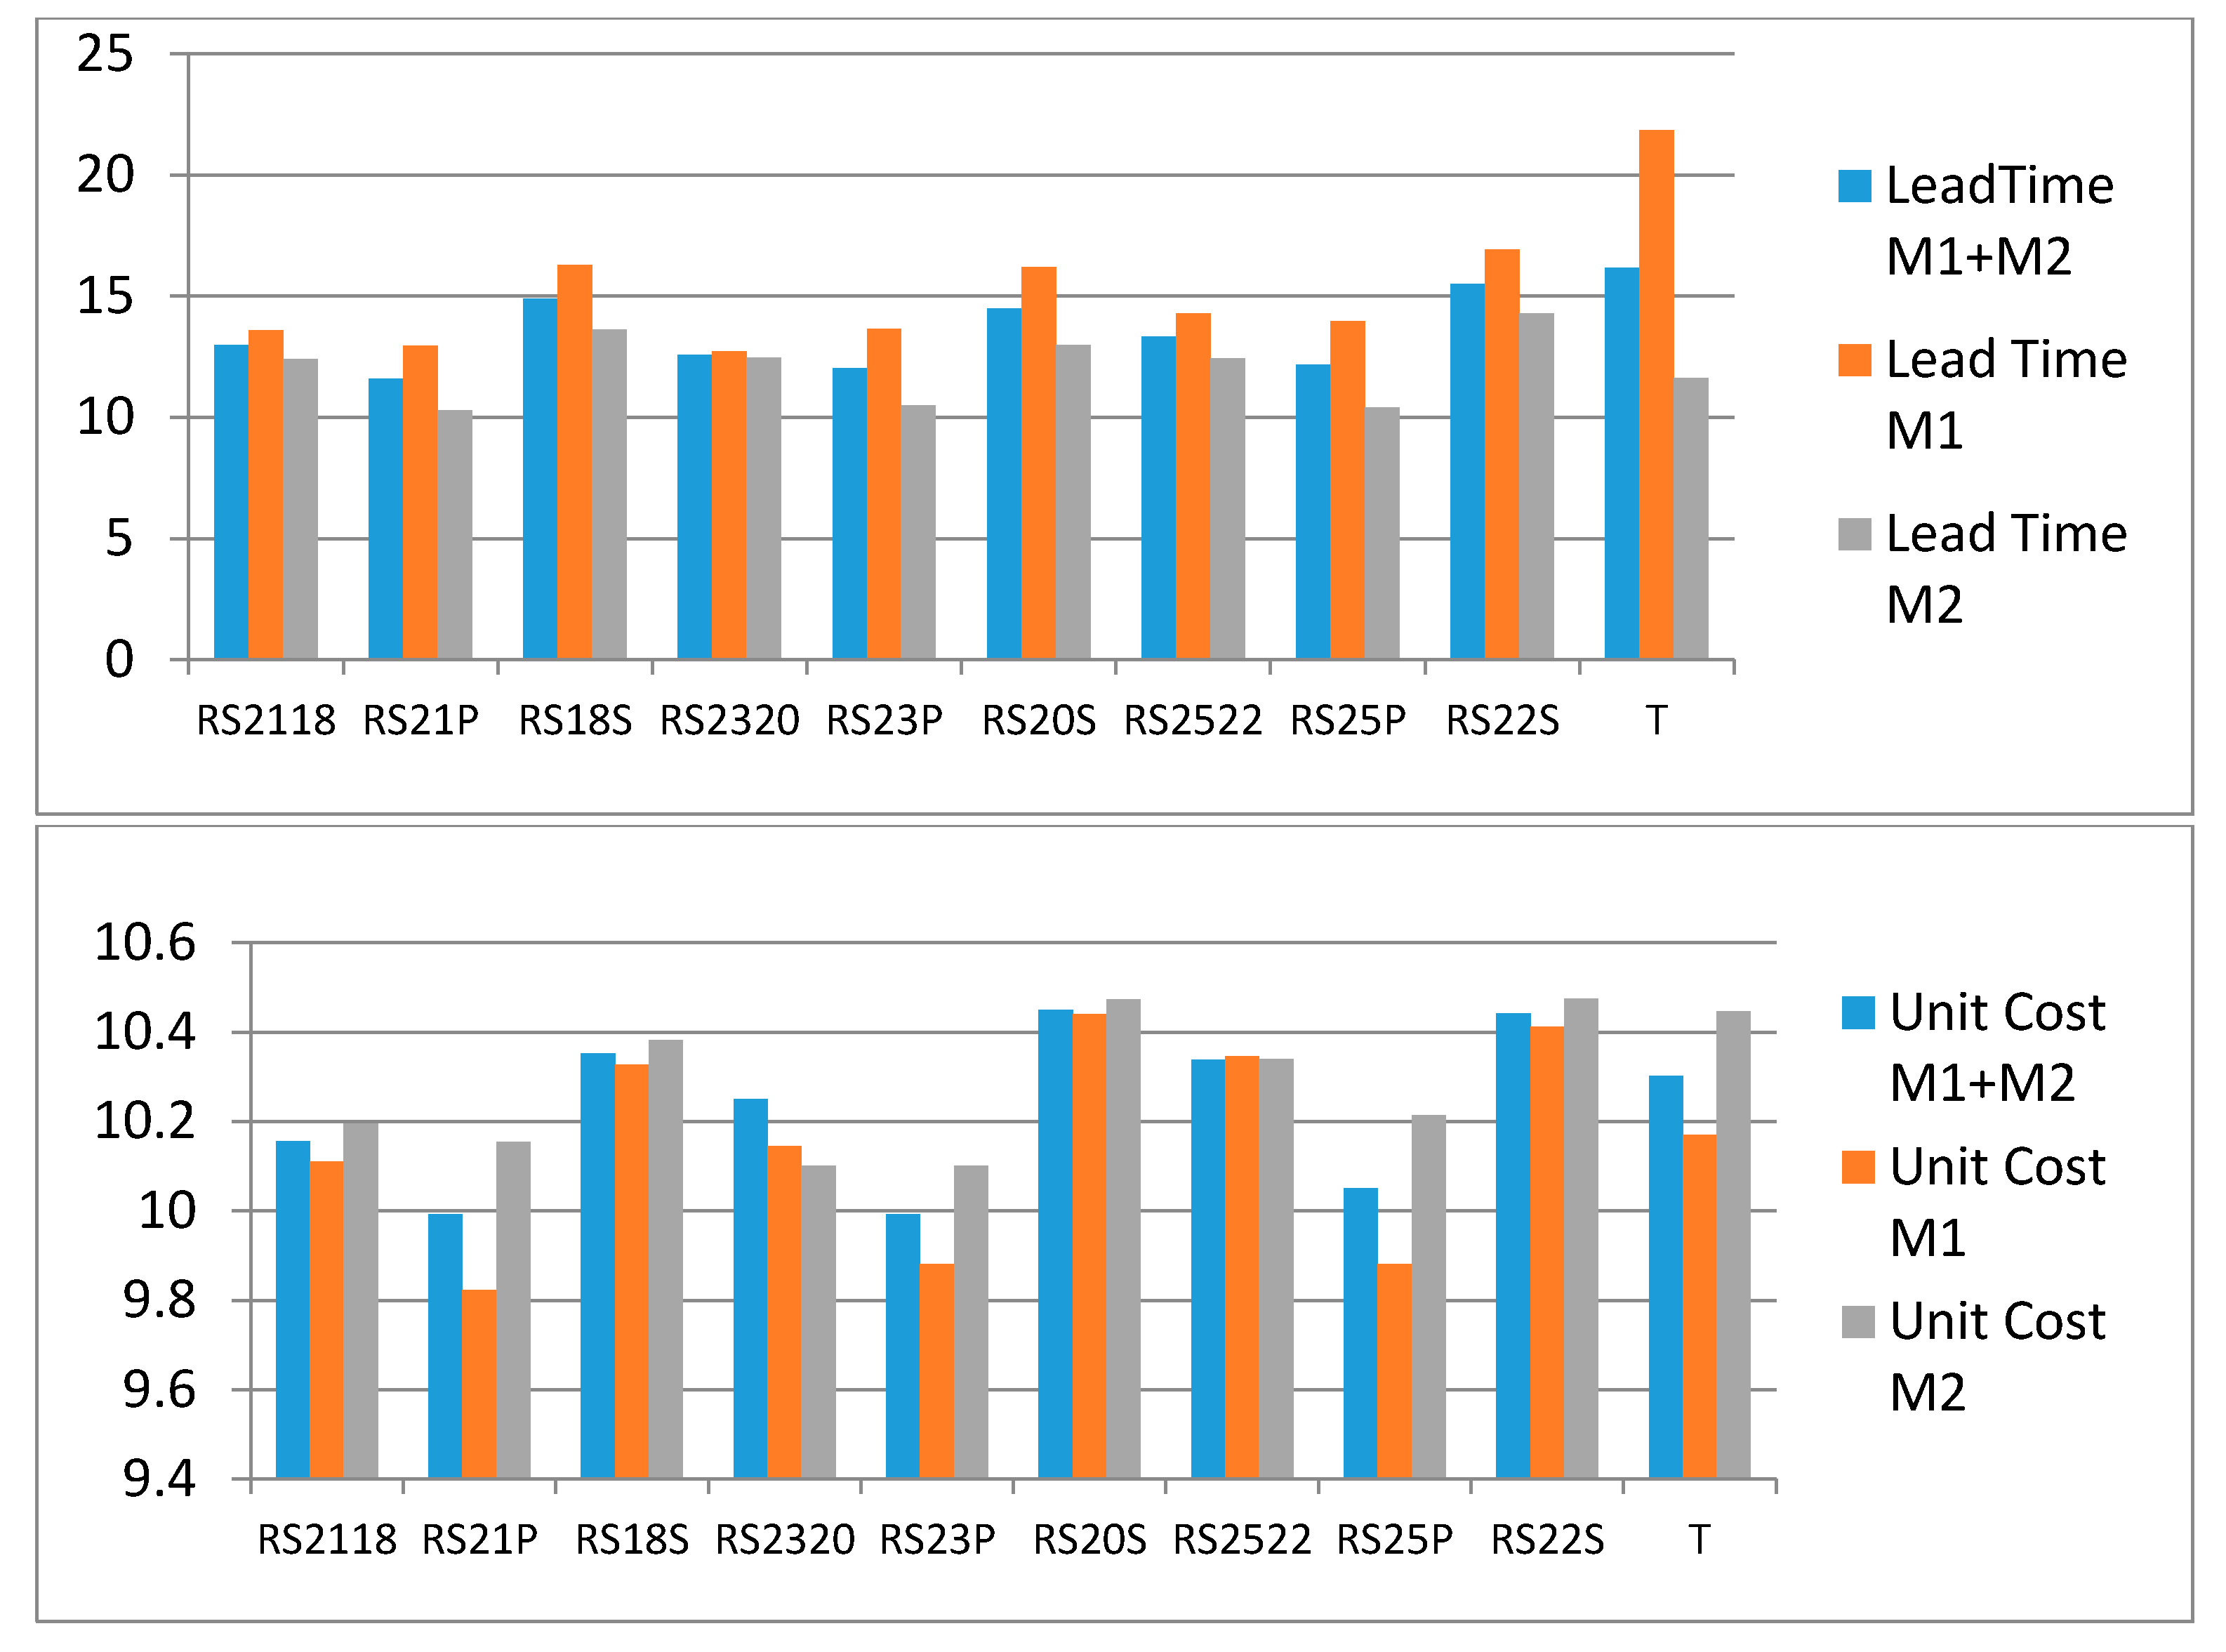
Finally, to explore the influence of RS on the production of premier fashion type orders and standard daily-basic type orders, we designed six new scenarios: RS21P, RS18S, RS23P, RS20S, RS25P, RS22S (RSk
nP: RS is only applied to the production of premier fashion type orders; RSk
nS: RS is only applied to the production of standard type orders). These six scenarios were also run in the simulation experiment for 50 replications respectively. The comparison of their mean values for four KPIs is illustrated in
Figure 6. We found an unexpected pattern where the proposed RS mechanism performed better on scenario RSk
nP than the corresponding scenario RSk
nS, although RSk
nP had a higher
kn. Under most circumstances, scenario RSk
nP performed even better than when RS was applied on all types of orders. Therefore, premier fashion garments are more suitable for applying the RS mechanism in production.
5. Conclusions
In the present study, we developed a resource sharing mechanism for sustainable production in the garment industry. We defined four sustainable production KPIs and also defined an overall sustainable performance index based on an ANP approach. We built a discrete-event simulation model to explore the sustainable production performance of the proposed RS mechanism under different conditions, including different increasing failure rates and target order types. A total of 18 scenarios were generated and simulated. Based on simulation experiment results, we demonstrated the comprehensive sustainable advantages of the RS mechanism and obtained the precise benefit of the RS mechanism for individual garment manufacturers and the whole garment industry cluster, in several sustainable production aspects. We derived several conclusions:
Although there is a higher failure rate for the production of premier fashion garments, much better KPIs will be achieved if the proposed RS mechanism is implemented for the production of premier garments compared to if RS is implemented for the production of standard daily-basic garments. It is recommended to apply the RS mechanism for the production of premier fashion garments.
It is easier for garment manufacturers with more capacity than the others in the industry cluster to obtain overall improvements in sustainable production performance. For manufacturers with relatively less capacity, the proposed RS mechanism could bring overall sustainable benefits. However, such manufacturers should pay attention to quality control. If they cannot guarantee high quality in production, the RS mechanism will not be a good option to improve sustainable production performance.
Based on our results, for the RS mechanism to have a positive effect, 21% is the threshold of increasing production failure rate. When the increasing failure rate is over 21%, unit cost under the RS mechanism starts to become higher than traditional garment production models.
For garment manufacturers whose main objective is reducing resource waste, they should pay more attention to quality control when applying the RS mechanism. For garment manufacturers who treat service as their main objective, the requirement for quality control is less strict to some extent when applying the RS mechanism.
Although our study is based on garment manufacturing, the conclusions of this study may have implications for other industries, especially those that need mass customization and have similar production procedures. The proposed RS mechanism can have a positive influence on other industries in terms of sustainable performance. It is recommended that company managers and policy makers consider the idea of RS as an important method to improve supply chain sustainability. The definition of four sustainable KPIs and an ANP-based overall sustainable performance index can also be applied in future sustainable supply chain research. Our study concentrated on collaborations between small garment companies. It will be interesting for researchers to explore the influence of RS on organizations with different scales and under different conditions, such as joint raw material inventories. It will also be interesting to develop more complex collaborative models to optimize order and resource distribution. This is an expected direction for future research.

