1. Introduction
In recent years, global urbanization has promoted rapid economic development. According to the recent demographic statistics from the UN, global urbanization rate has reached 54% and this percentage will reach 66% by 2050 [
1]. The thermal environment problem has attracted significant attention with the progress of urbanization [
2,
3] and it has received extensive attention from scholars for both indoor and outdoor thermal environment [
4,
5,
6]. Thermal environment problem affects human health, economic development, leisure activities and well-being of urban dwellers [
7,
8,
9], especially the health of vulnerable people [
10,
11] and it causes air pollution [
12]. In addition, urban thermal environment has a dominant influence on precipitation [
13] and global warming [
14]. In many tropical countries where rapid urbanization is experienced, the intensity and its negative impacts are likely to be substantial [
15,
16].
The forming mechanism and simulation of urban thermal environment are the key and difficult points in this study. From small scale, the formation of urban thermal environment is closely related to urban planning and design elements. Therefore, researchers have mainly investigated the influence of architectural design elements (i.e., building height, density, layout and green ratio) on urban thermal environment in residential areas in recent years and the effects have been simulated by computational fluid dynamics technology.
Considerable researches have investigated the influence of green on thermal environment in residential areas in terms of number [
17,
18], type [
19,
20], shape, location and layout [
21,
22] of green space [
23,
24,
25]. In addition, several studies have shown that the main reason for thermal environment deterioration is the expansion and transformation of a city, in which the influence of buildings cannot be ignored; factors include building height, density [
26], layout [
27,
28], materials [
29,
30], aspect ratio [
31] and sky view factor (SVF) [
32,
33,
34]. A significant linear negative correlation was found between urban thermal environment and SVF. However, urban thermal environment was positively correlated with height/width (H/W) [
35,
36]. Unger calculated the correlation coefficient between urban heat island intensity and SVF as −0.43. Algeciras claimed that the aspect ratio between 1 and 1.5 provided a relatively lower air temperature (Ta). Fazia found that building direction affected the thermal comfort of a residential area and that the surface temperature of buildings in south and west directions was higher than that of the east and north [
37]. The buildings located in dominant wind direction should be constructed with an open layout to have more superior thermal environment with staggered pattern than parallel pattern. A larger building spacing generally indicates a better outdoor thermal environment in residential areas.
At present, high-rise buildings have become the major option for urban construction to cope with rapid urbanization. Studies have shown that unplanned high-rise buildings have caused discomfort in cities [
38]. Colombo found that outdoor conditions were poor in existing wide streets with low-rise buildings and no shade trees. Narrow streets with tall buildings and shade trees were regarded as the most comfortable conditions [
39]. However, current studies about the influence of building density on thermal environment in residential areas are limited. General studies have considered that high building density caused high temperature [
40]. However, Ewing insisted that the increase in building density contributed to thermal environment improvement because high building density had small areas and exterior walls in each household; this condition improved energy storage efficiency and reduced energy consumption and carbon emissions [
41]. Therefore, no unified conclusion has been reported about the relationships among building height, density, layout and thermal environment. Considerable researches should be conducted to analyze the interaction mechanism between those factors and thermal environment.
The main evaluation indices of urban thermal environment are Ta, land surface temperature and thermal comfort. Among them, Ta and land surface temperature are utilized more in analyzing spatial distribution difference of temperature. However, the index of thermal comfort can further evaluate the effects of different thermal environments and climates on human health, comfort and performance [
5]. From the developmental stage and scientific basis, the indices of thermal comfort assessment are divided into empirical and mechanism indices. Empirical indices include heat index, wet bulb globe temperature (WBGT) and apparent temperature [
42]. However, these empirical indices do not have sufficient scientific basis for lack of consideration to heat transfer of the human body. Moreover, the assessment results of different indices lack comparability [
43]. Mechanism indices include standard effective temperature (SET), predicted mean vote (PMV) [
44], outdoor SET (OUT_SET) [
45], physiological equivalent temperature (PET) [
46], universal thermal climate index (UTCI) [
47]. However, PMV and SET are initially used in indoor assessment; hence, errors will occur when they are directly used in outdoor thermal comfort assessment [
48,
49], given that outdoor thermal environment is more complicated than indoor thermal environment. Pickup et al. [
45] improved SET and proposed the index of OUT_SET for outdoor thermal comfort assessment. PMV has been extended for application in outdoor conditions by adding solar radiation and the present modified PMV can be used to calculate outdoor thermal comfort [
50]. The above outdoor mechanical comfort indices are commonly used; however, they have not become the international universal indices of thermal comfort assessment because the scientific bases of PMV, PET and OUT_SET are considerably different. The COST Action 730 combined multidisciplinary expertise and established UTCI in 2002 [
47]. The indices of PMV, PET and UTCI are considered to be suitable and exact indices to assess outdoor thermal comfort [
43], which are used by many software programs. The free version of ENVI-met can output PMV value and has been used by several researchers. The research results show that PMV can accurately characterize outdoor thermal comfort in a local region [
6,
51].
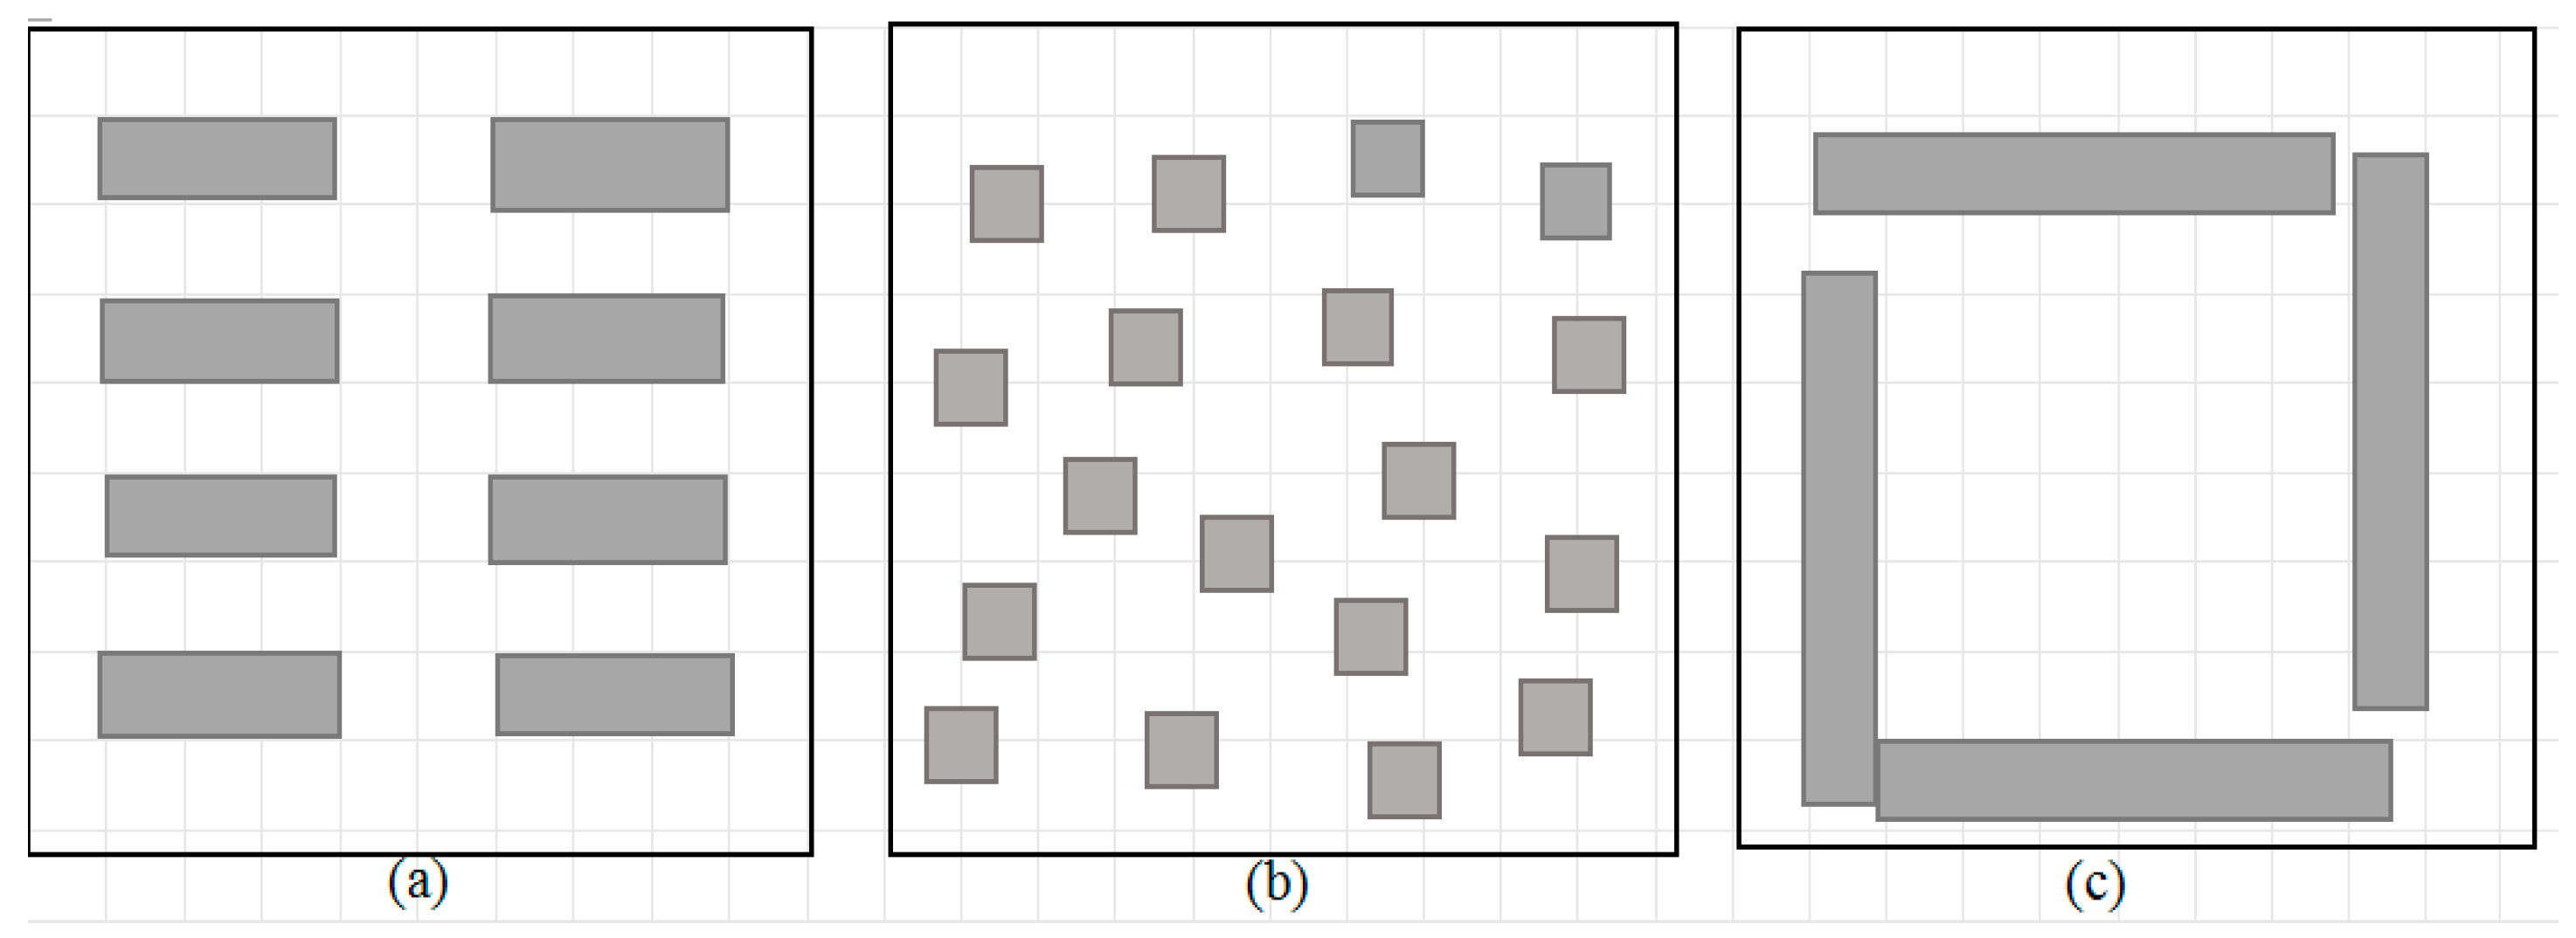
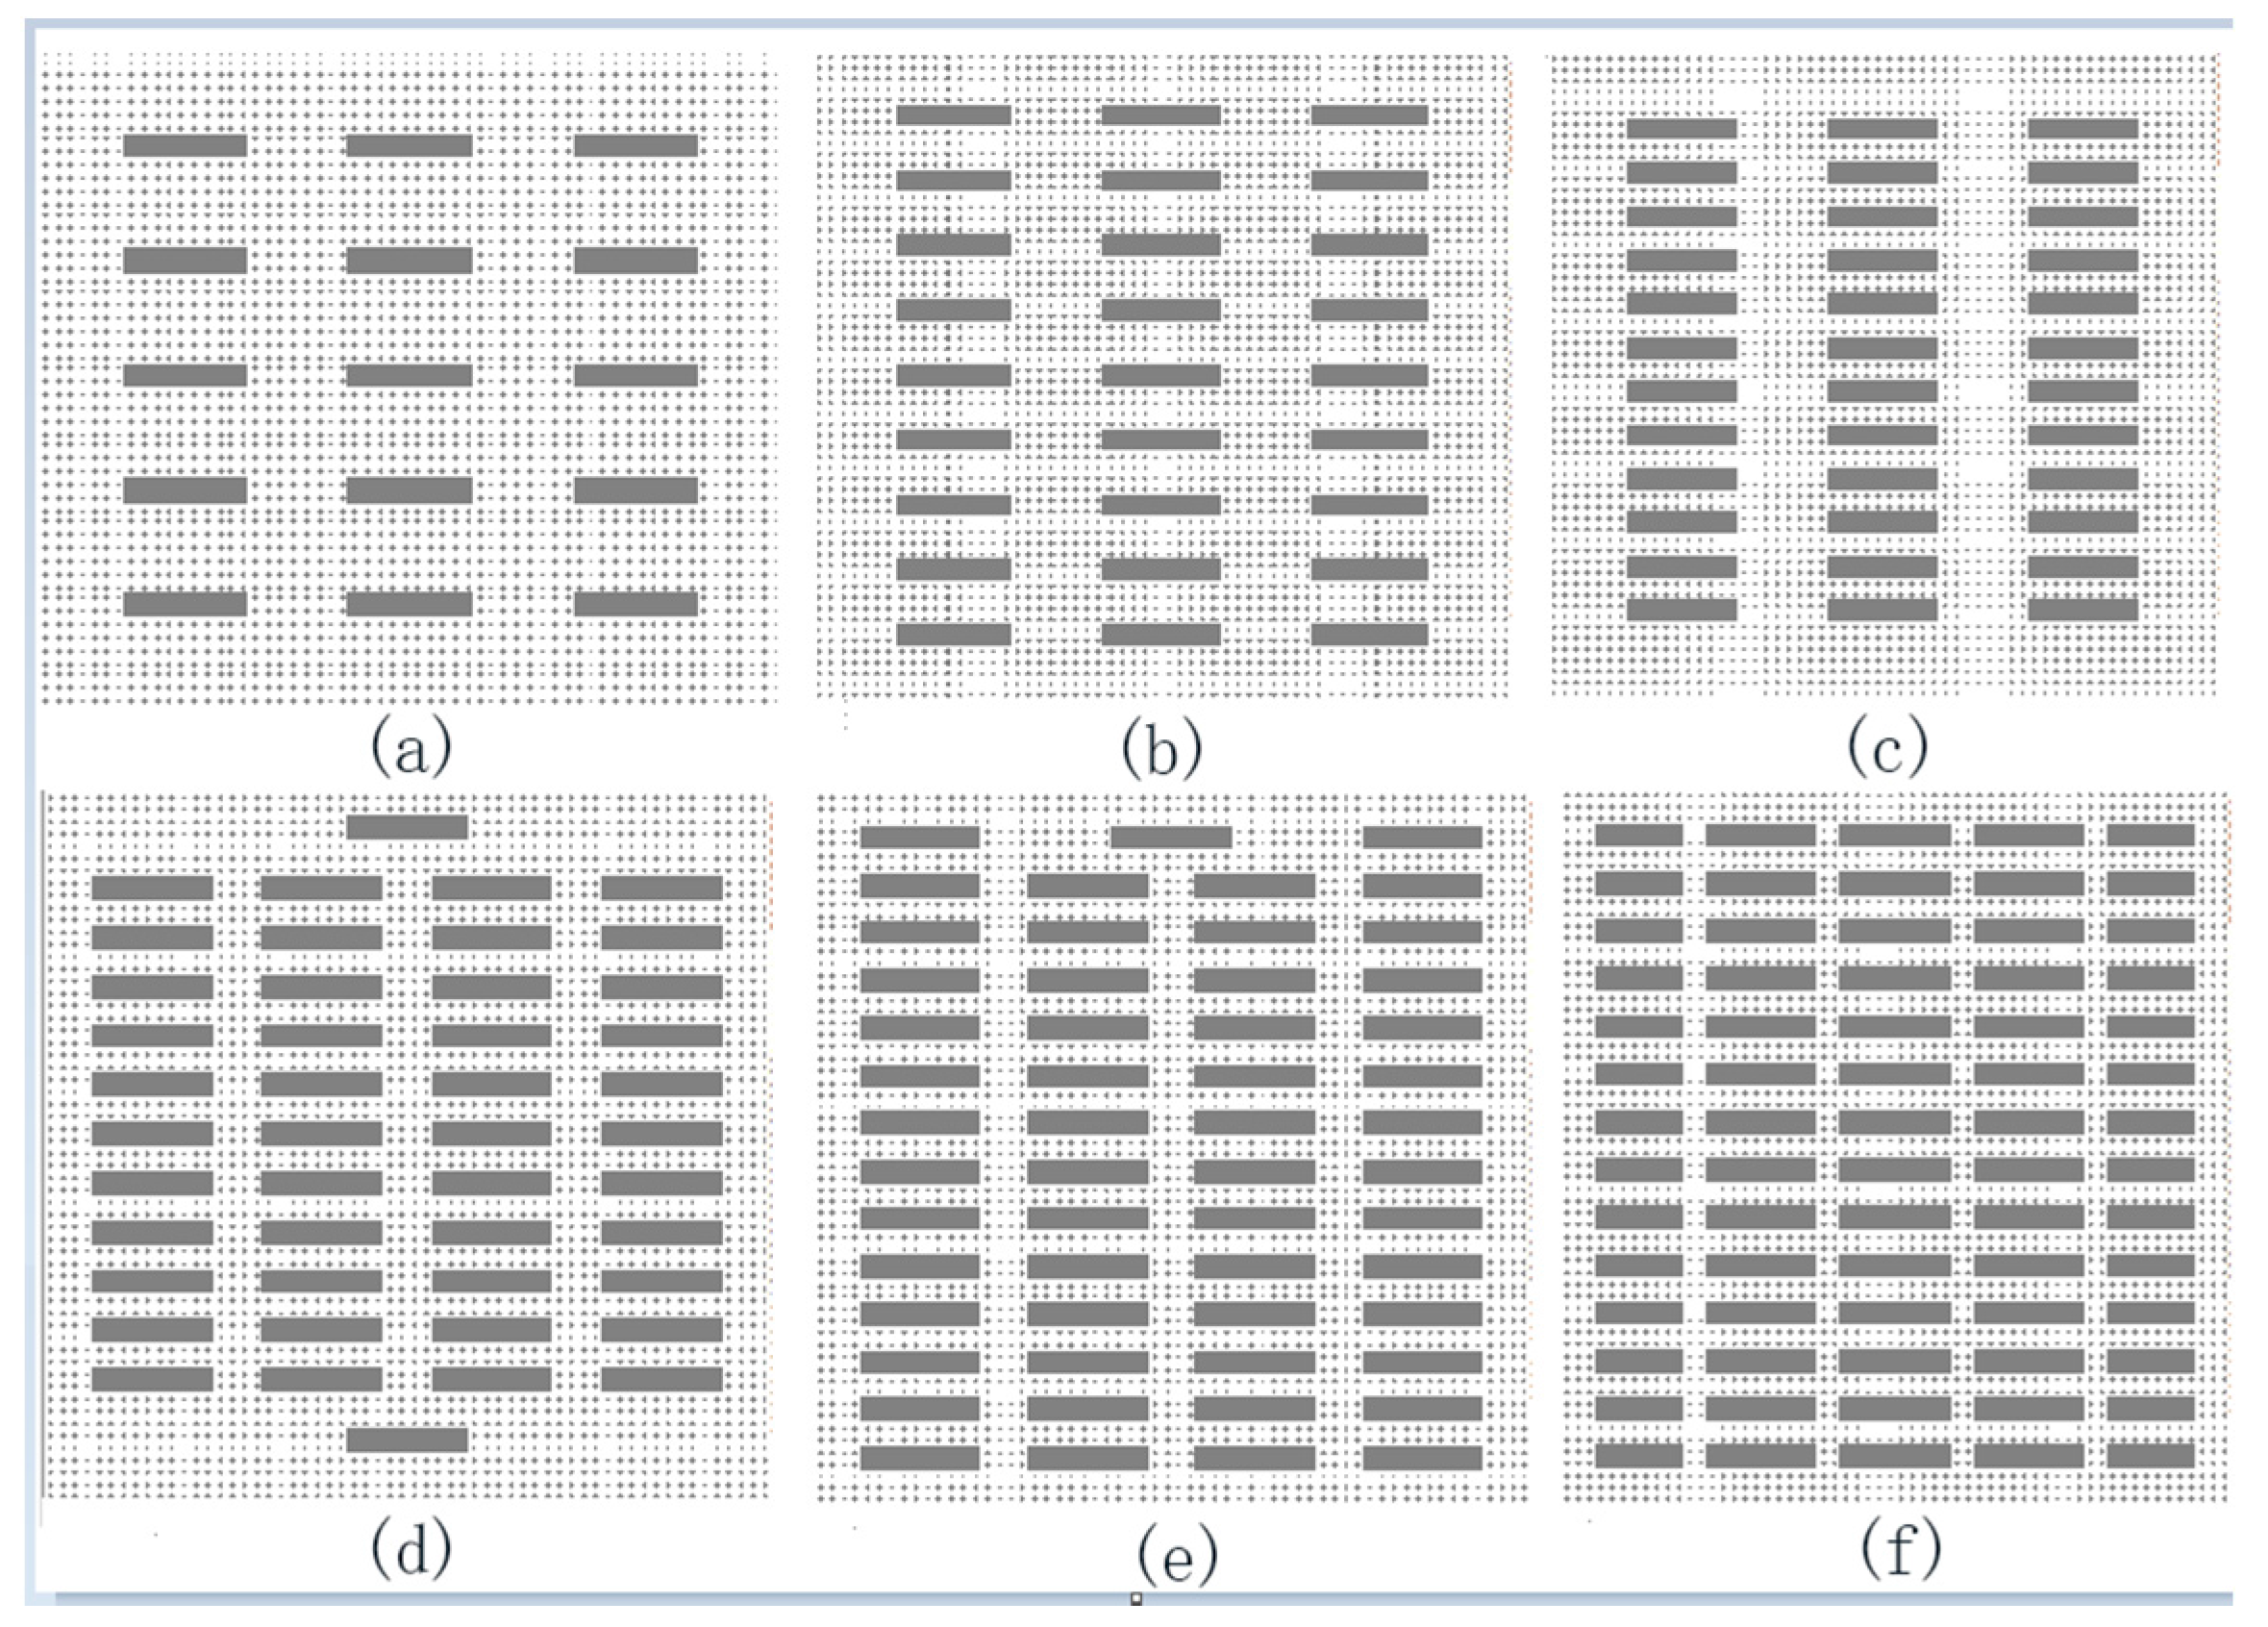
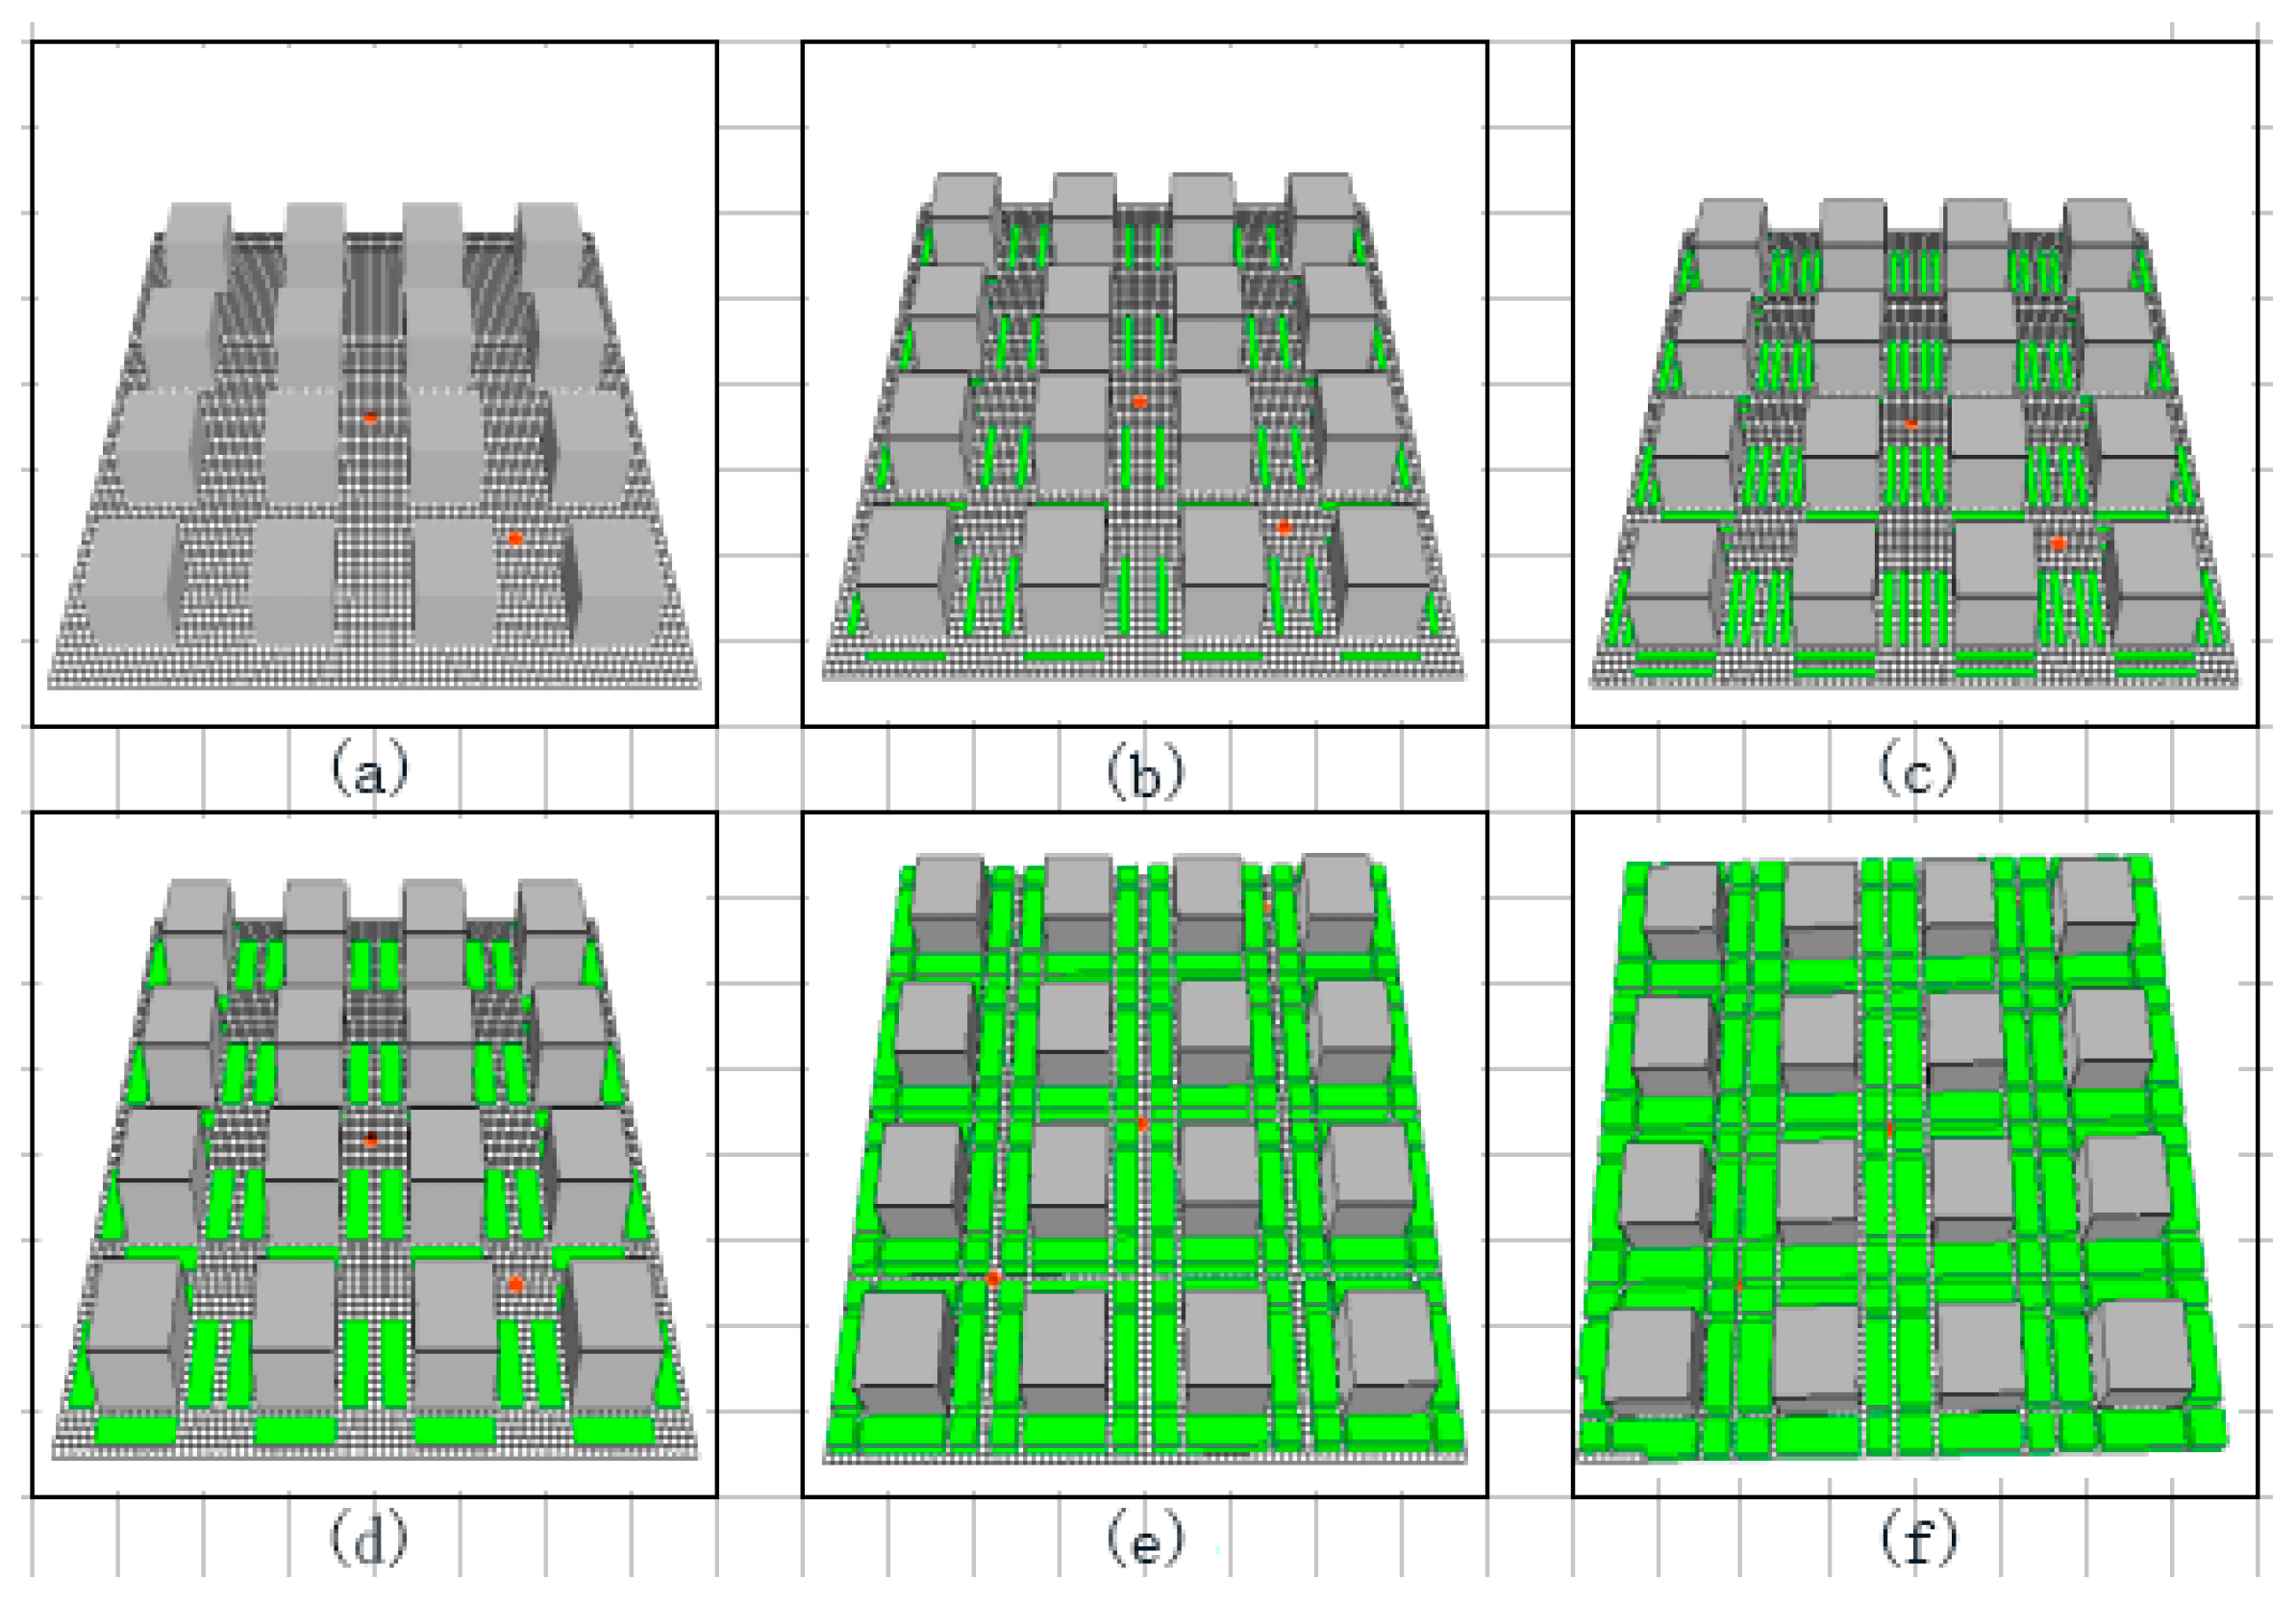
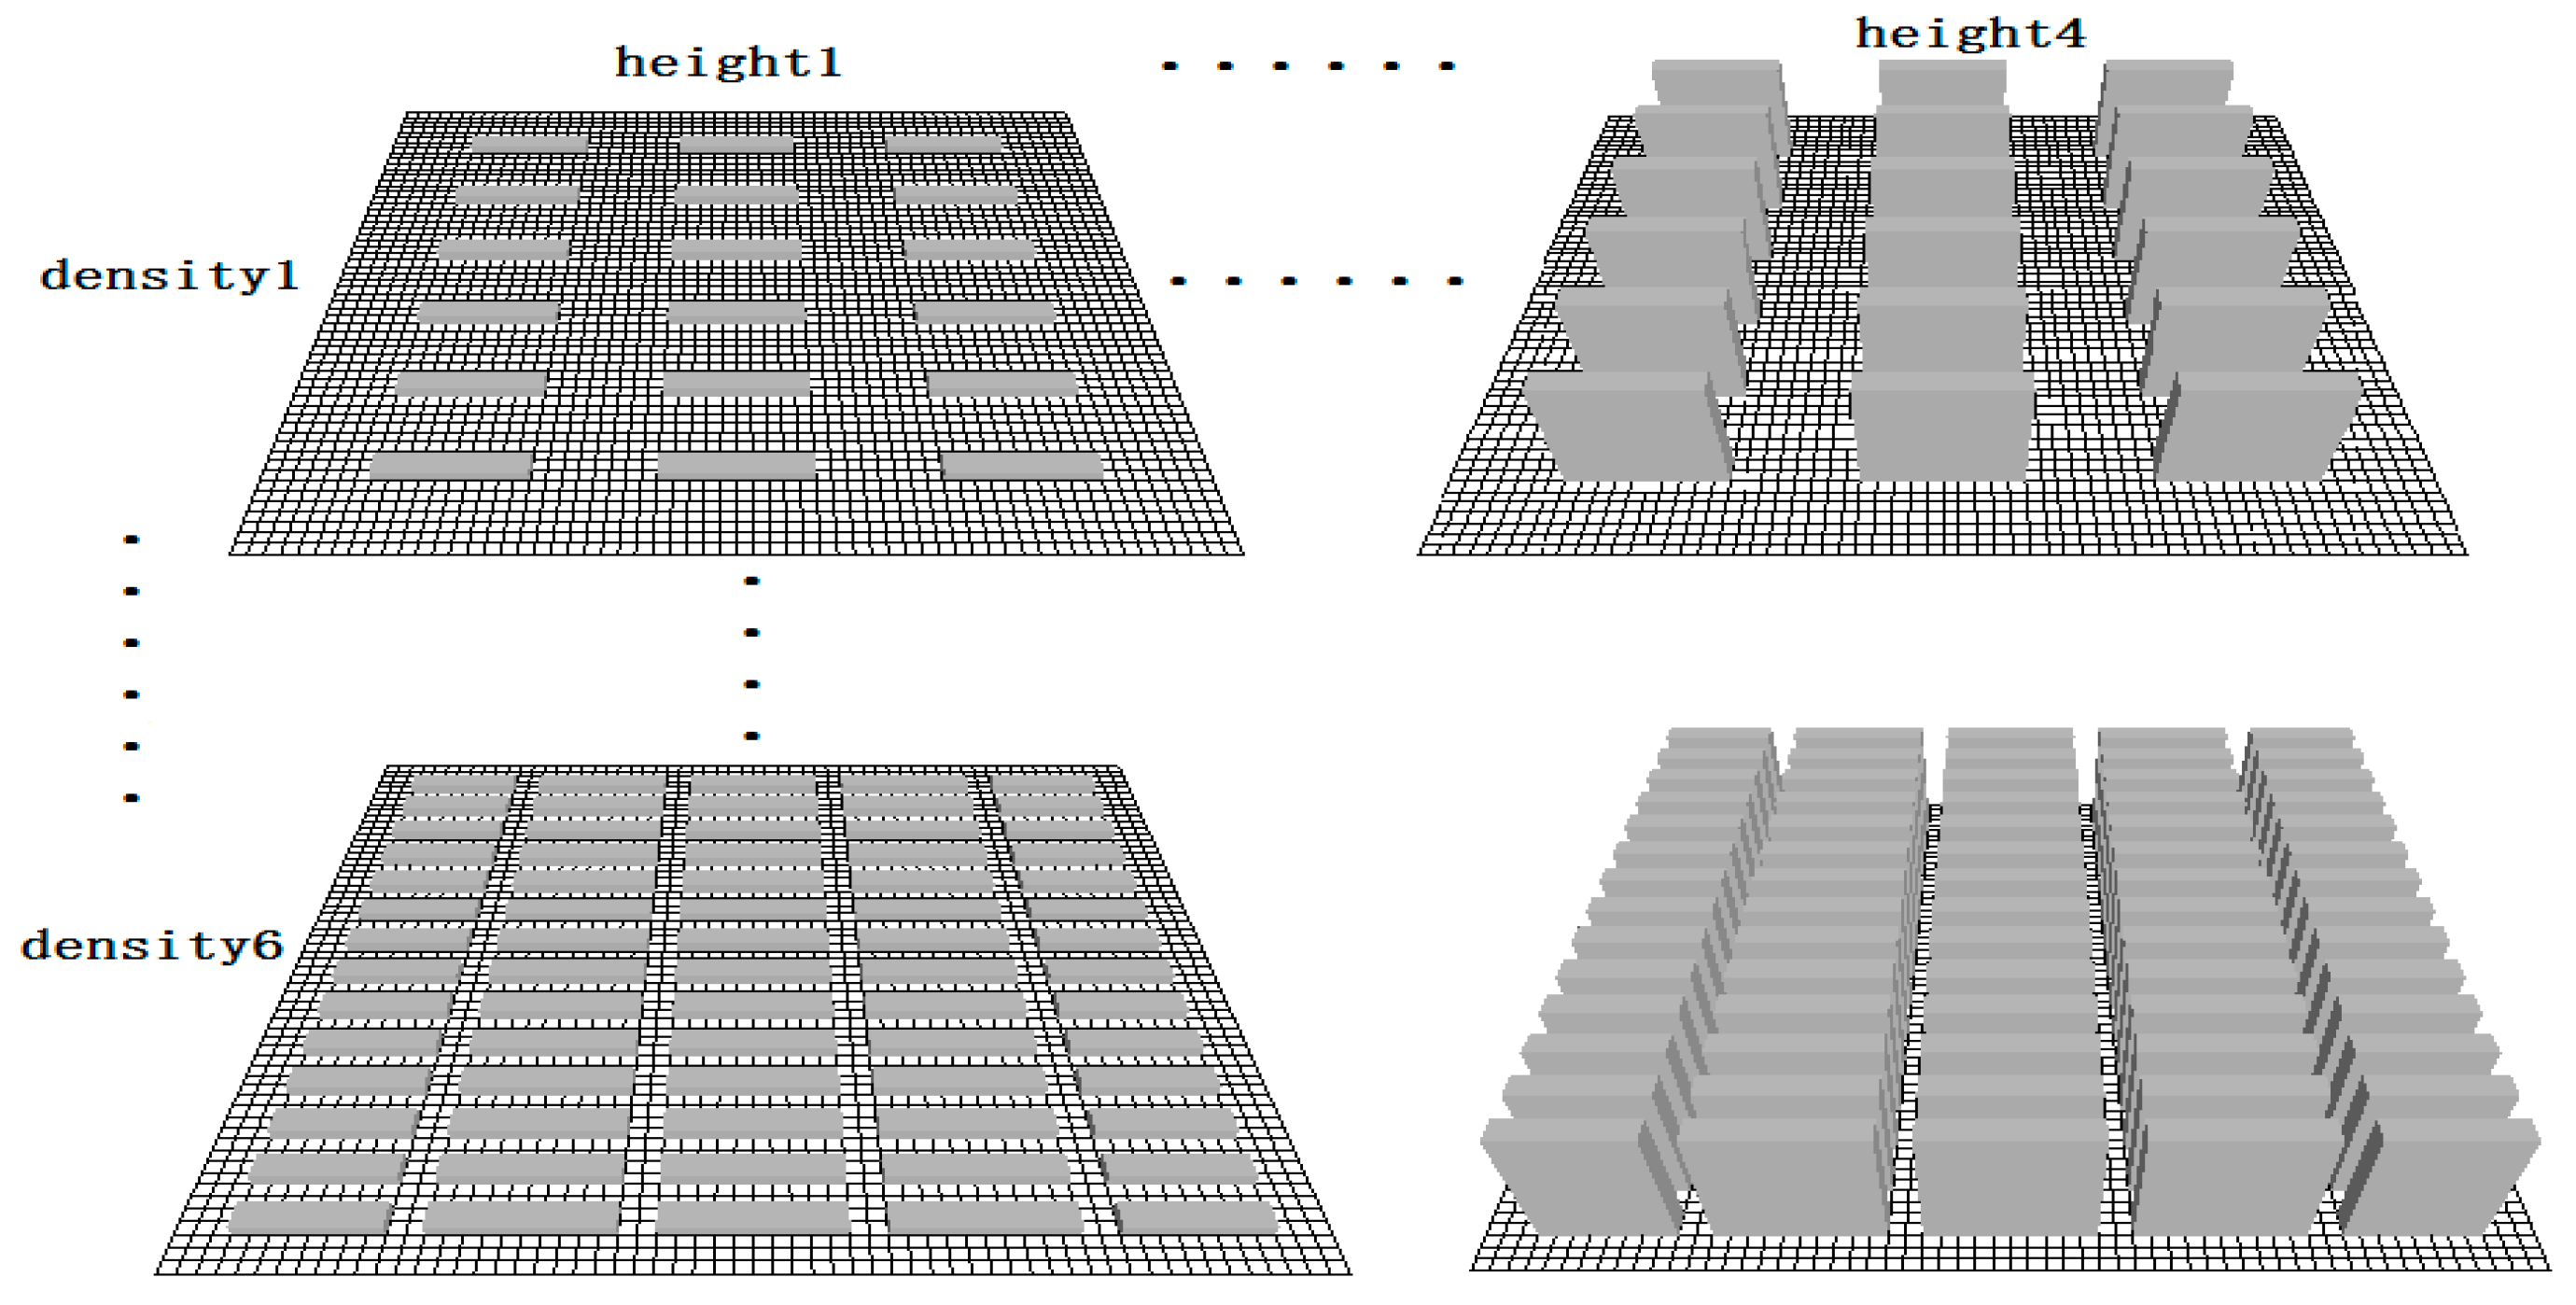
This study aimed to simulate and analyze the relationship between the four elements (i.e., building density (% of building area), height (canyon effect), layout (building arrangement) and green ratio) and the thermal environment in residential areas by designing various simulated cases. The key factors affecting the thermal environment of residential area were investigated, which could provide theoretical basis for the improvement measures of urban thermal environment from the residential area scale.
4. Conclusions
This study simulated the relationships among building density, height, layout, green ratio and city microclimate by ENVI-met to investigate the effects of these factors on the thermal environment of residential areas quantitatively. The conclusions are summarized as follows.
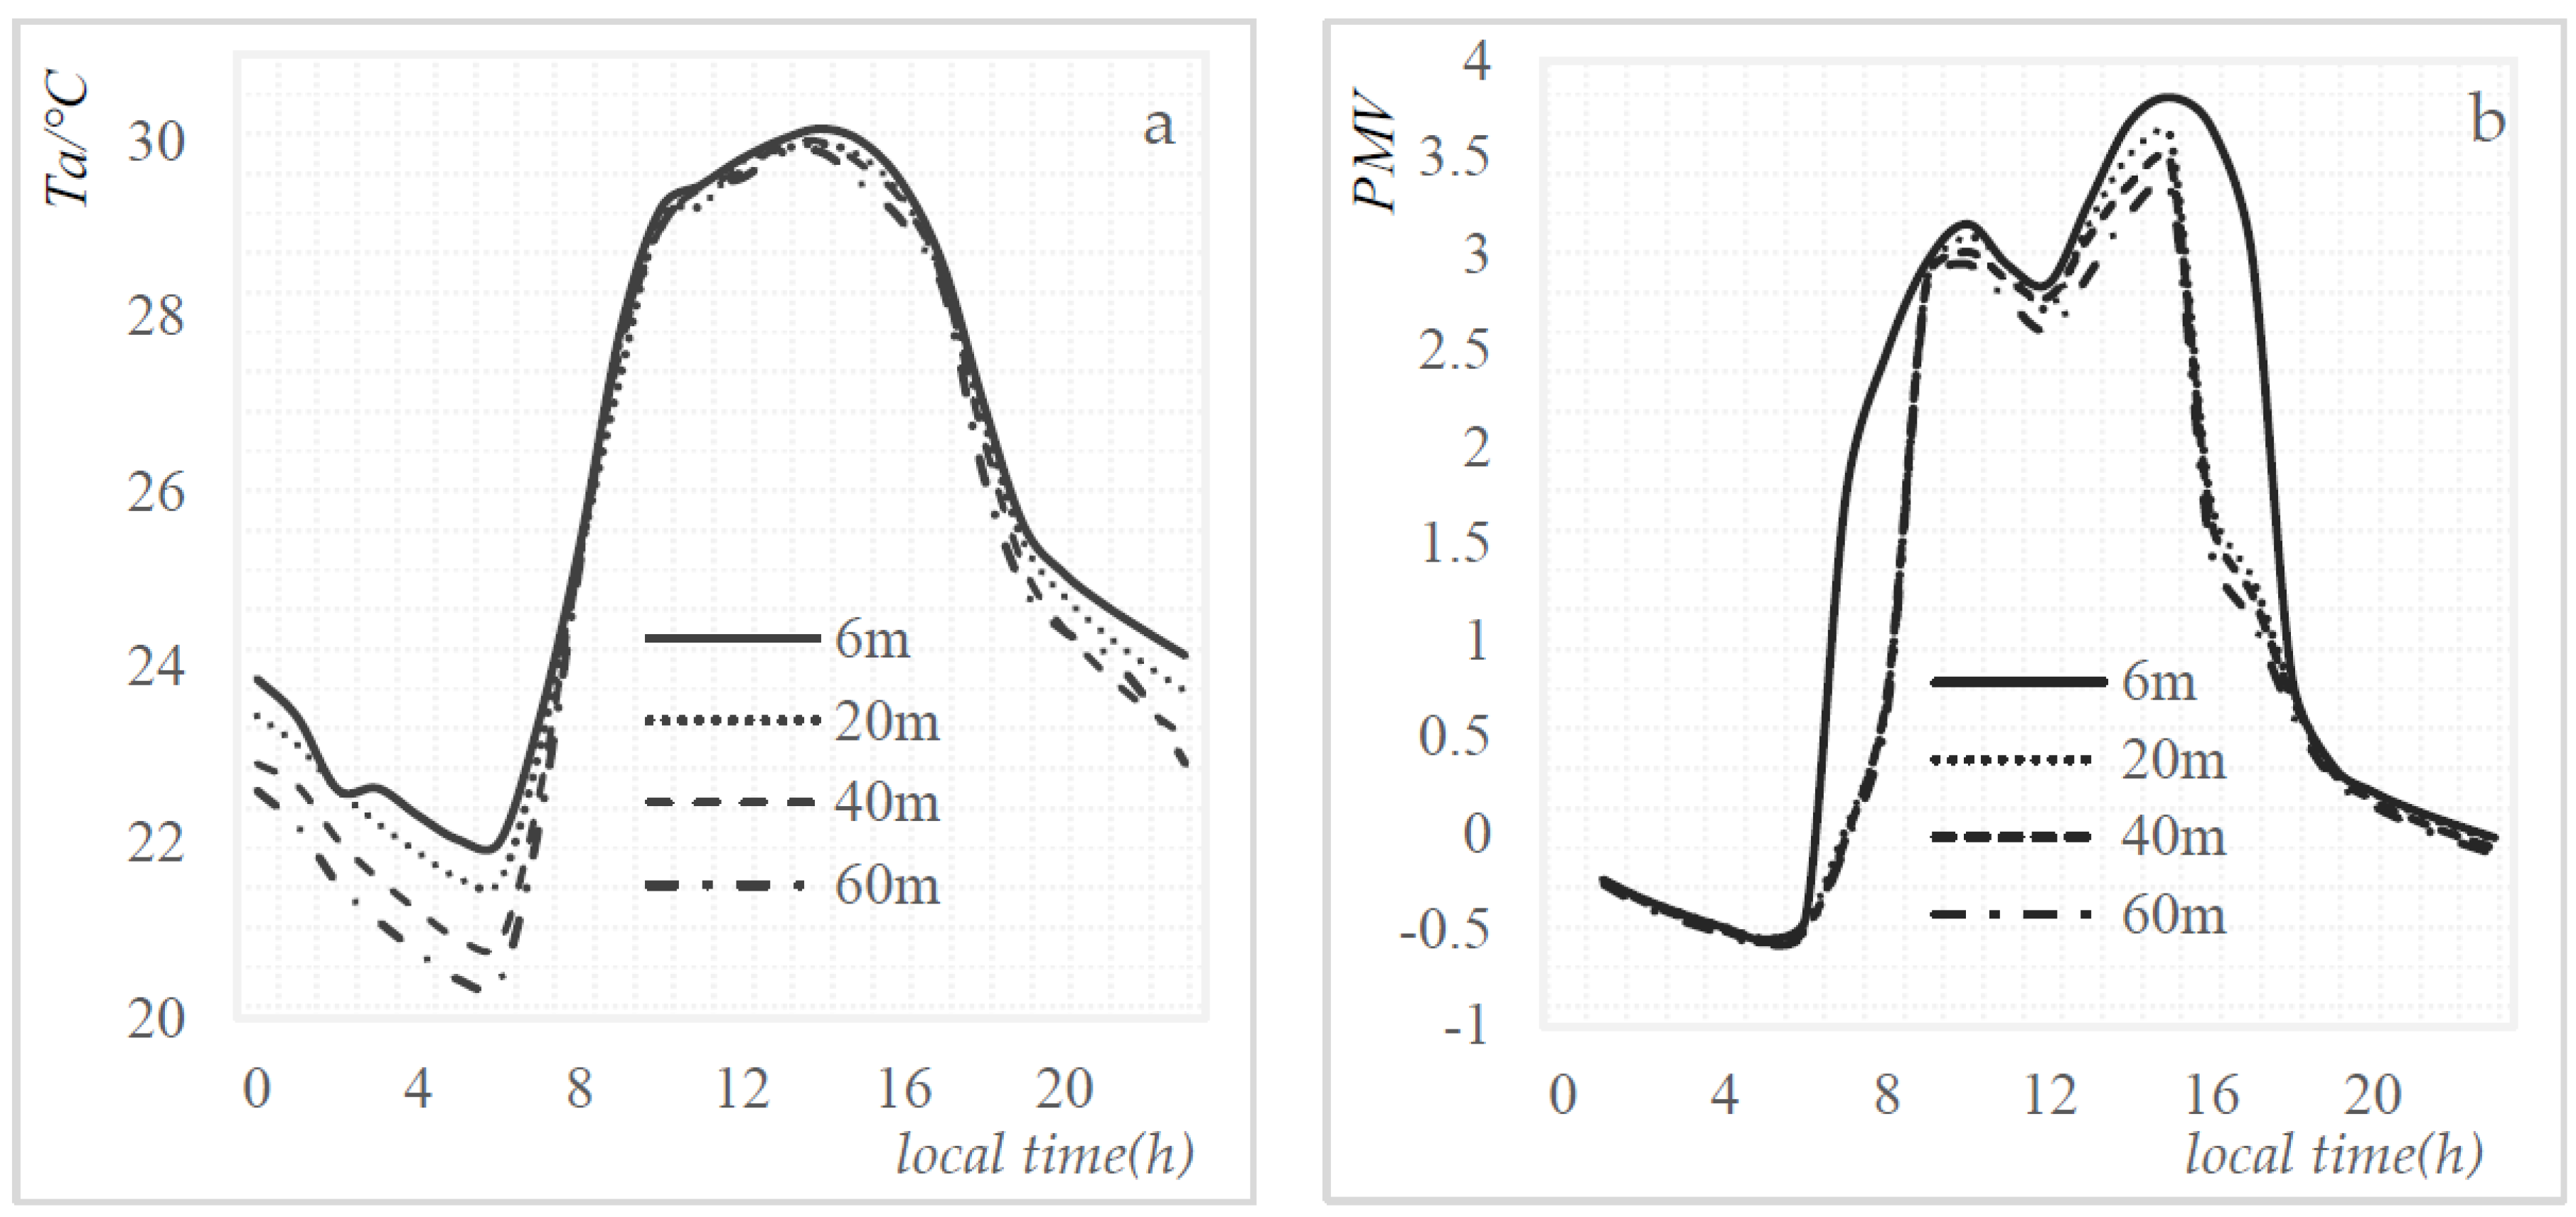
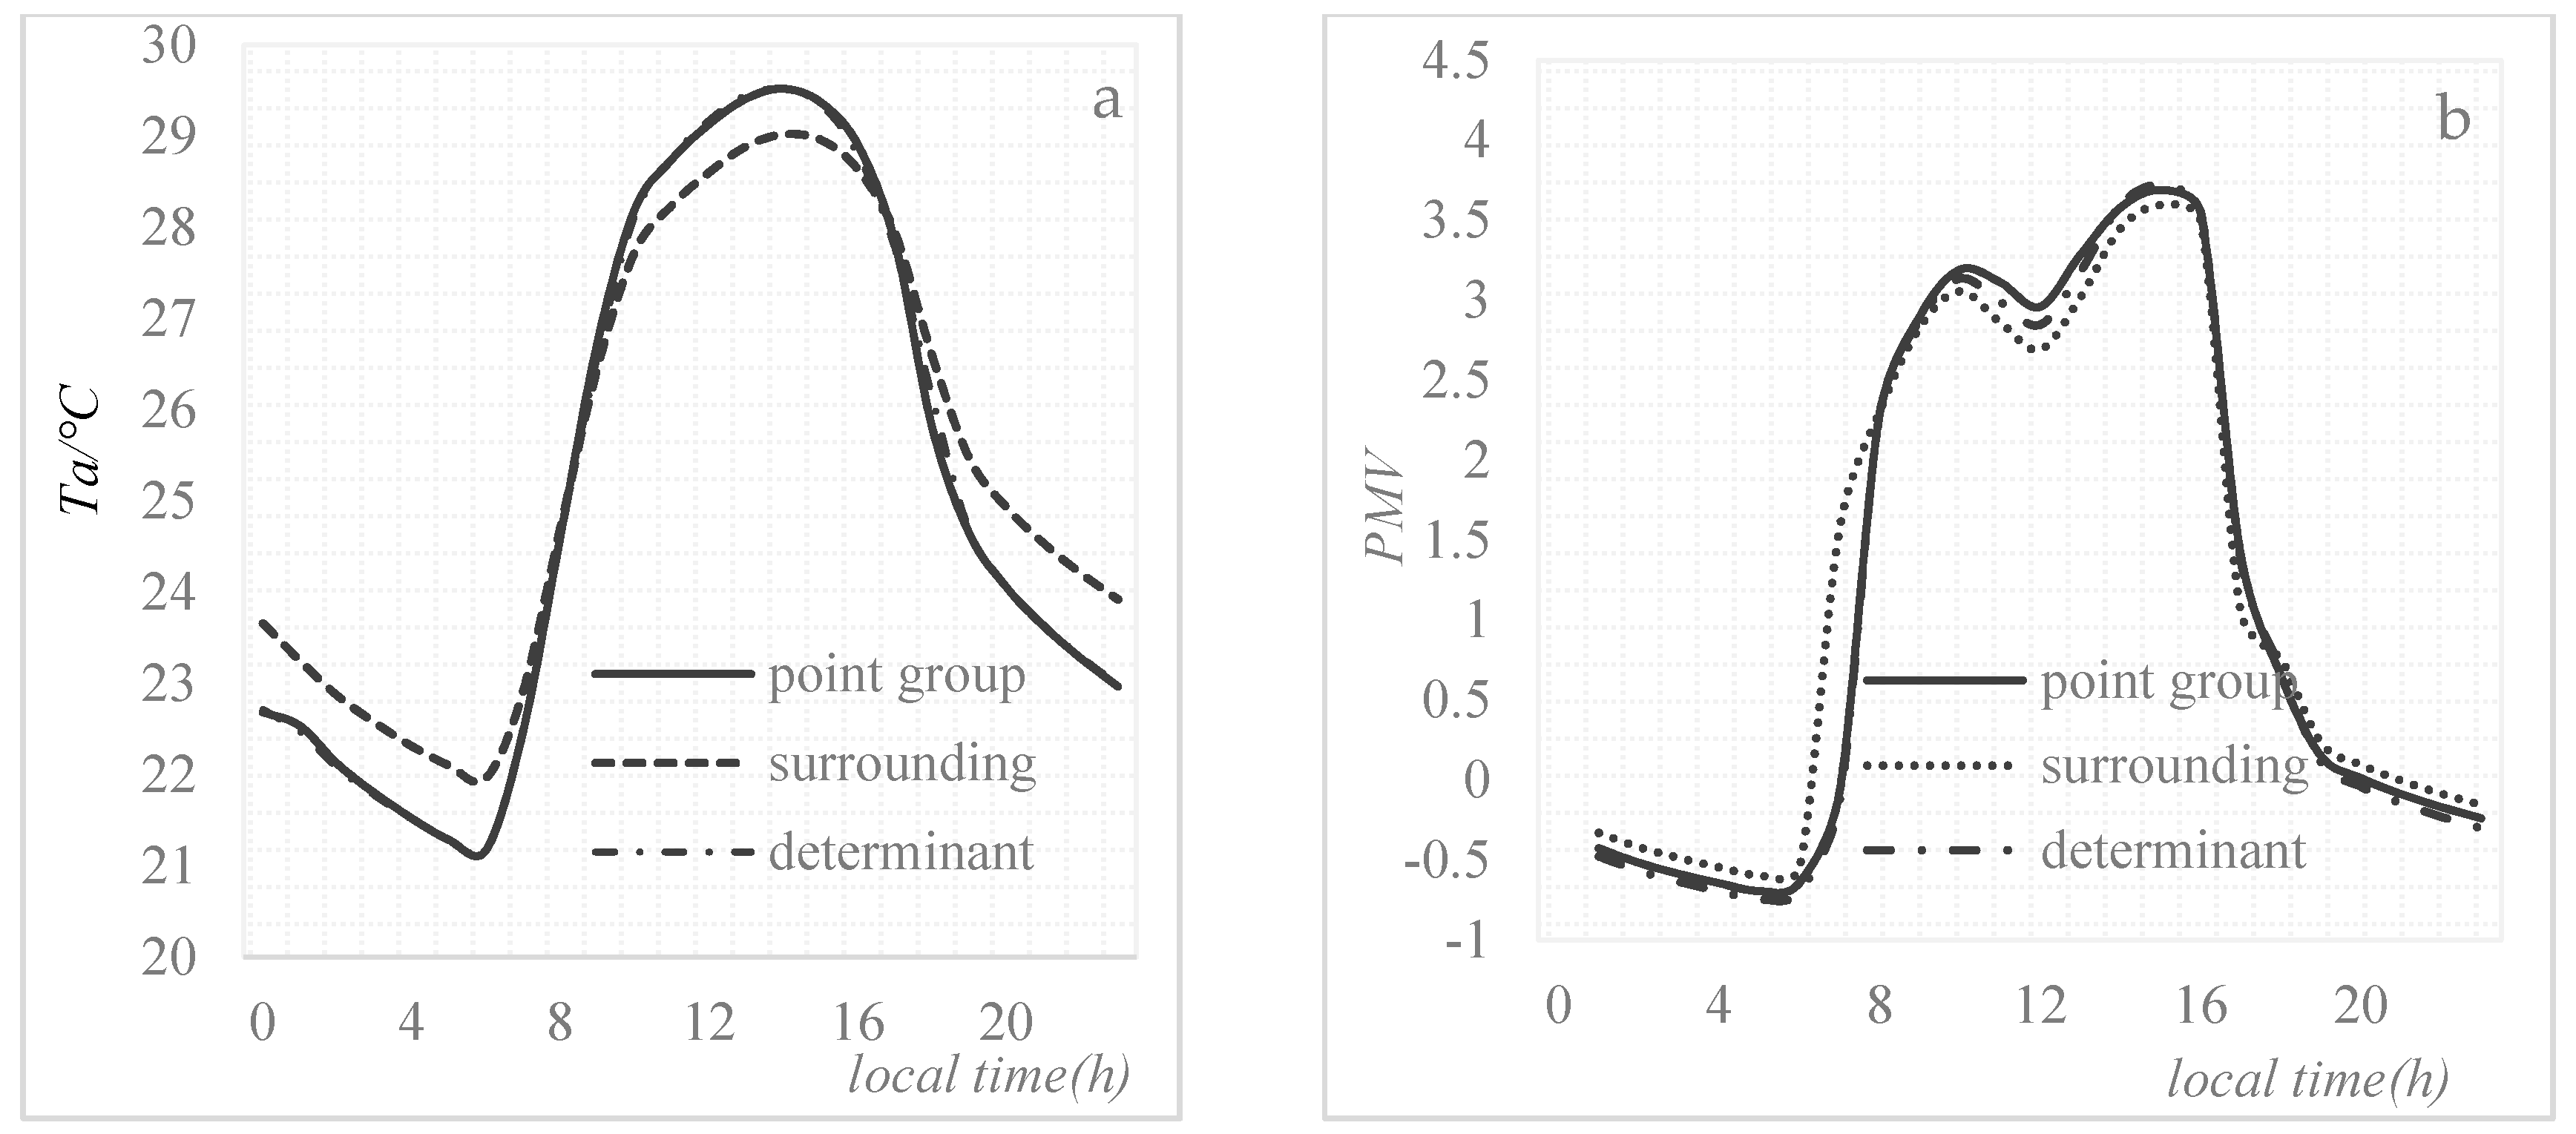
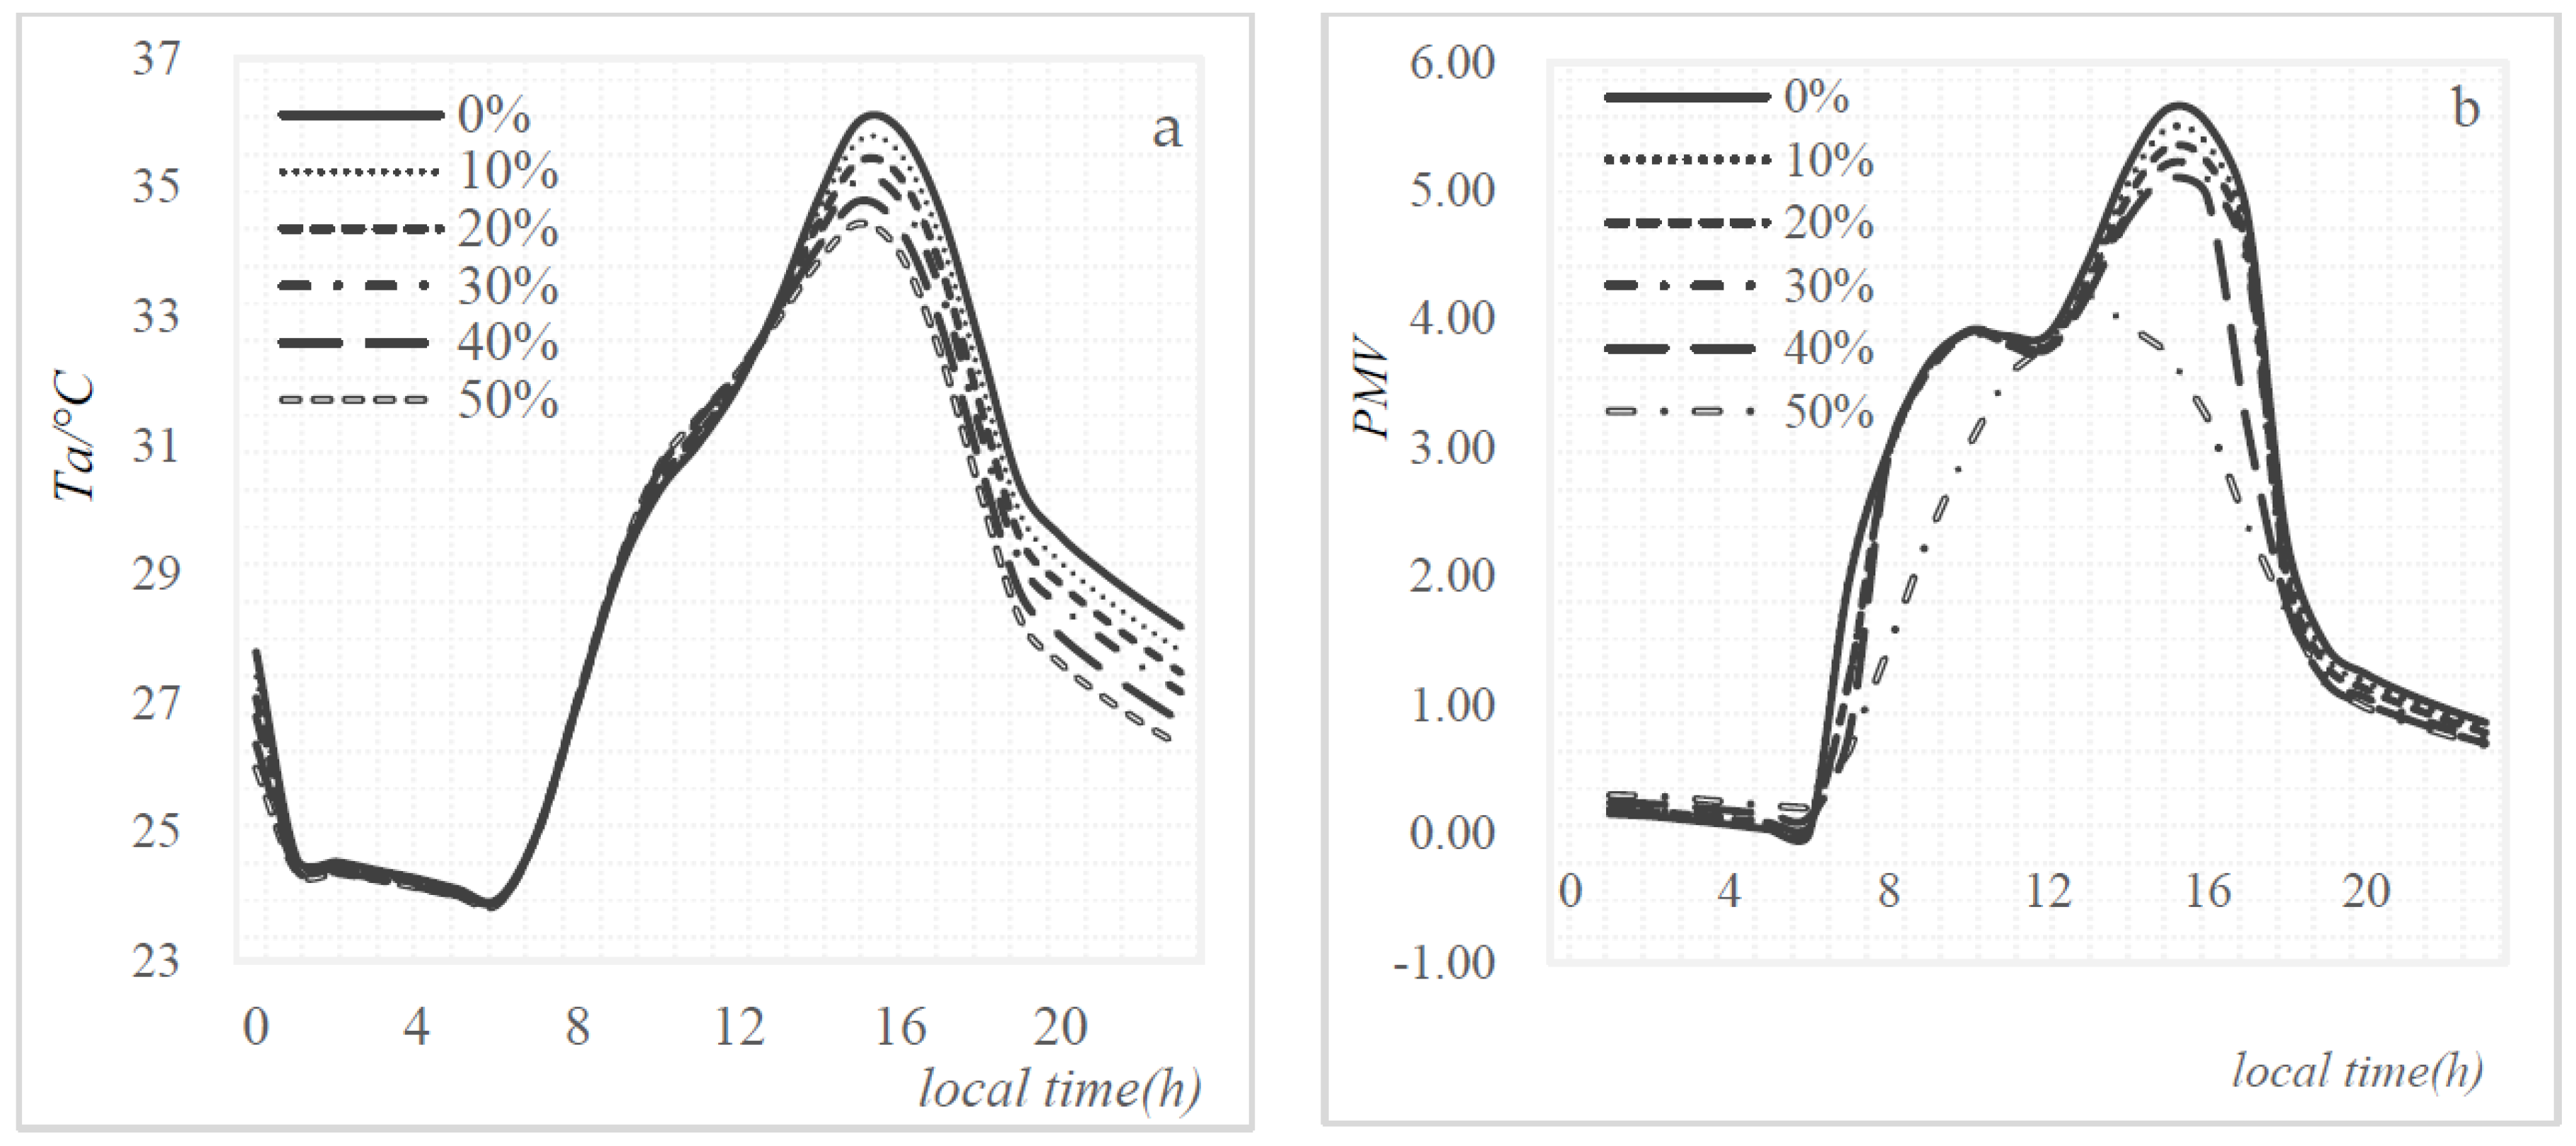
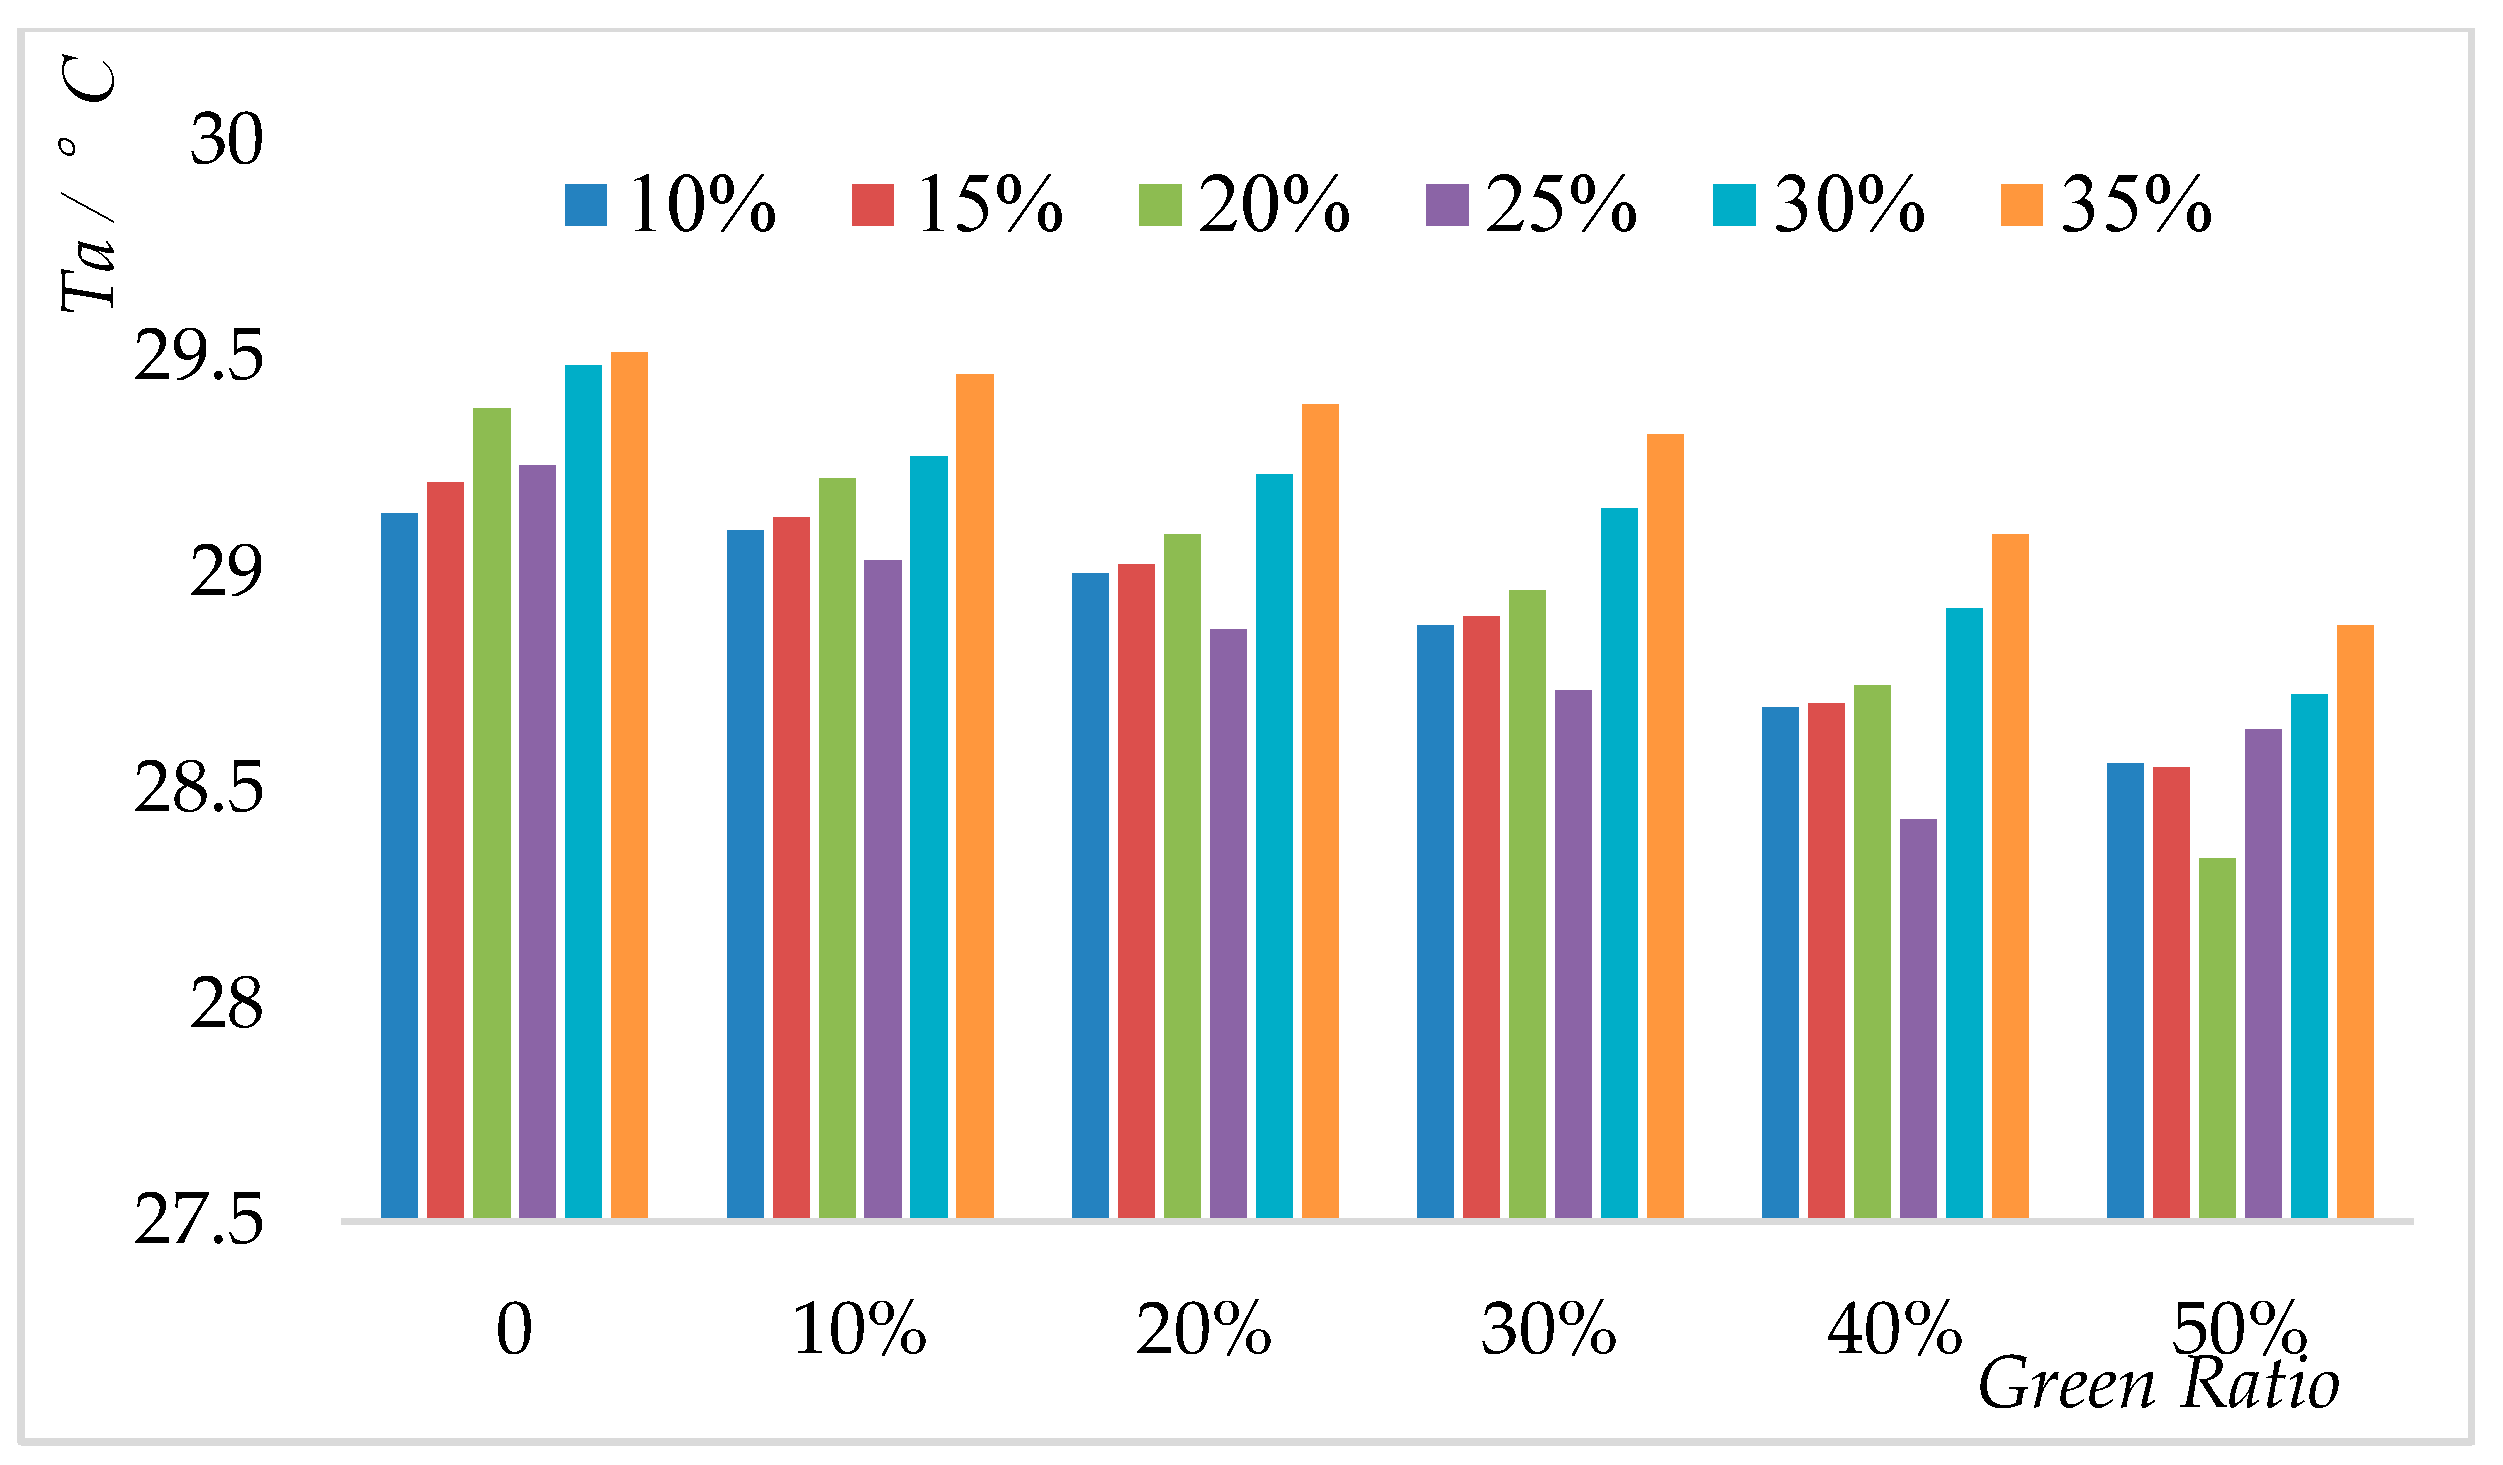
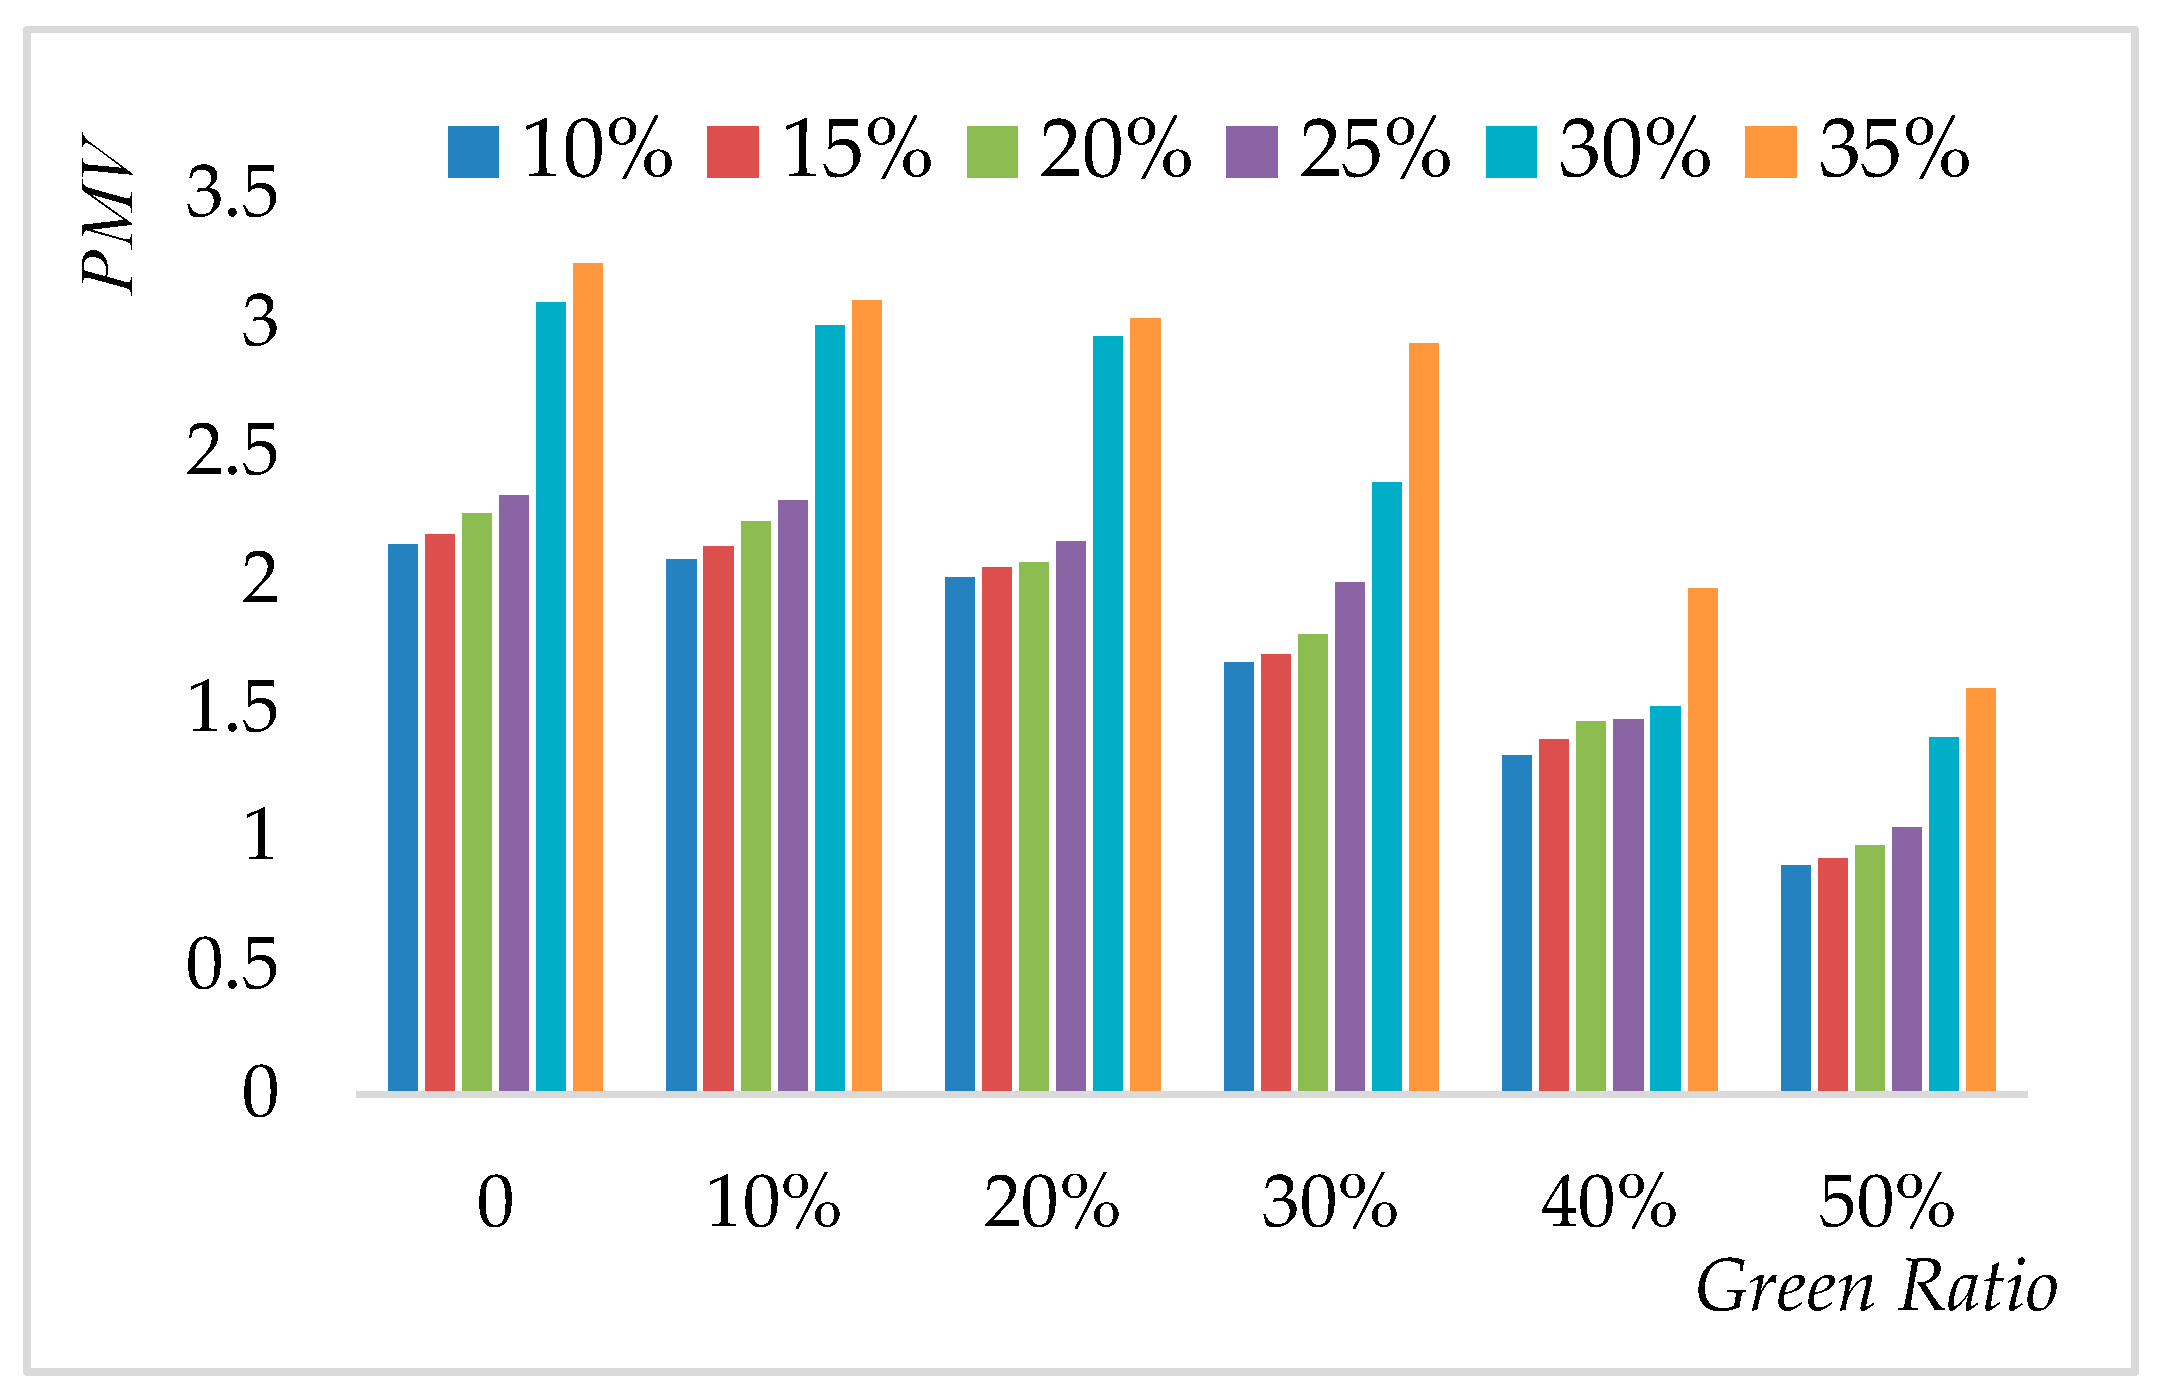
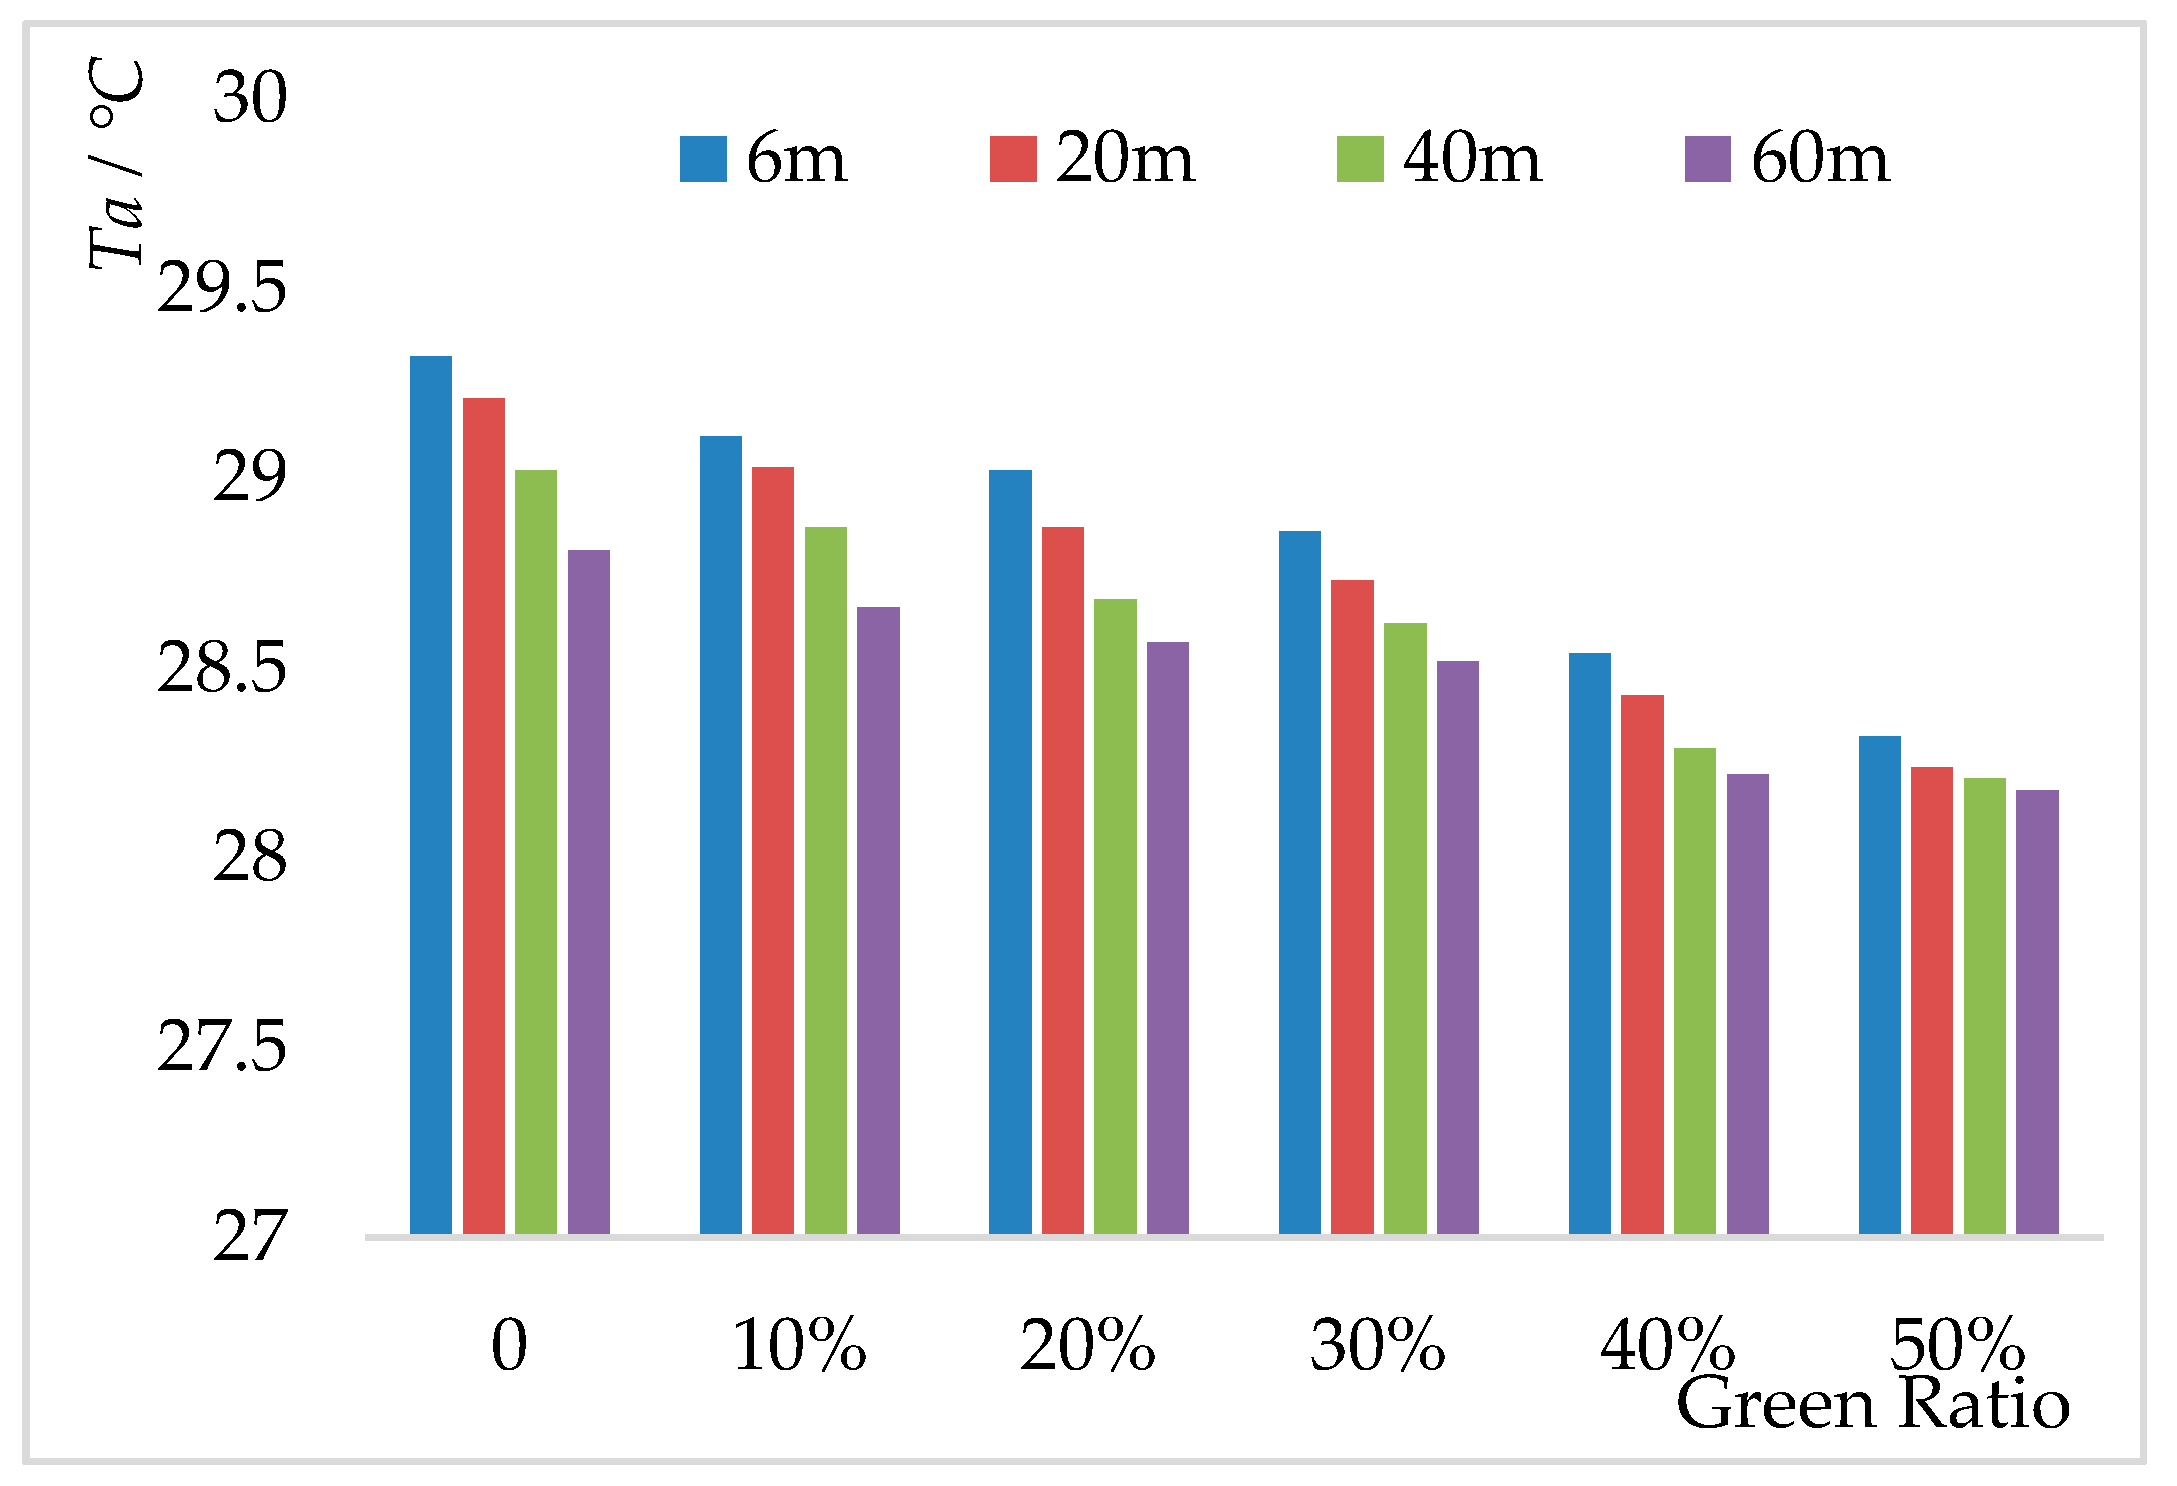
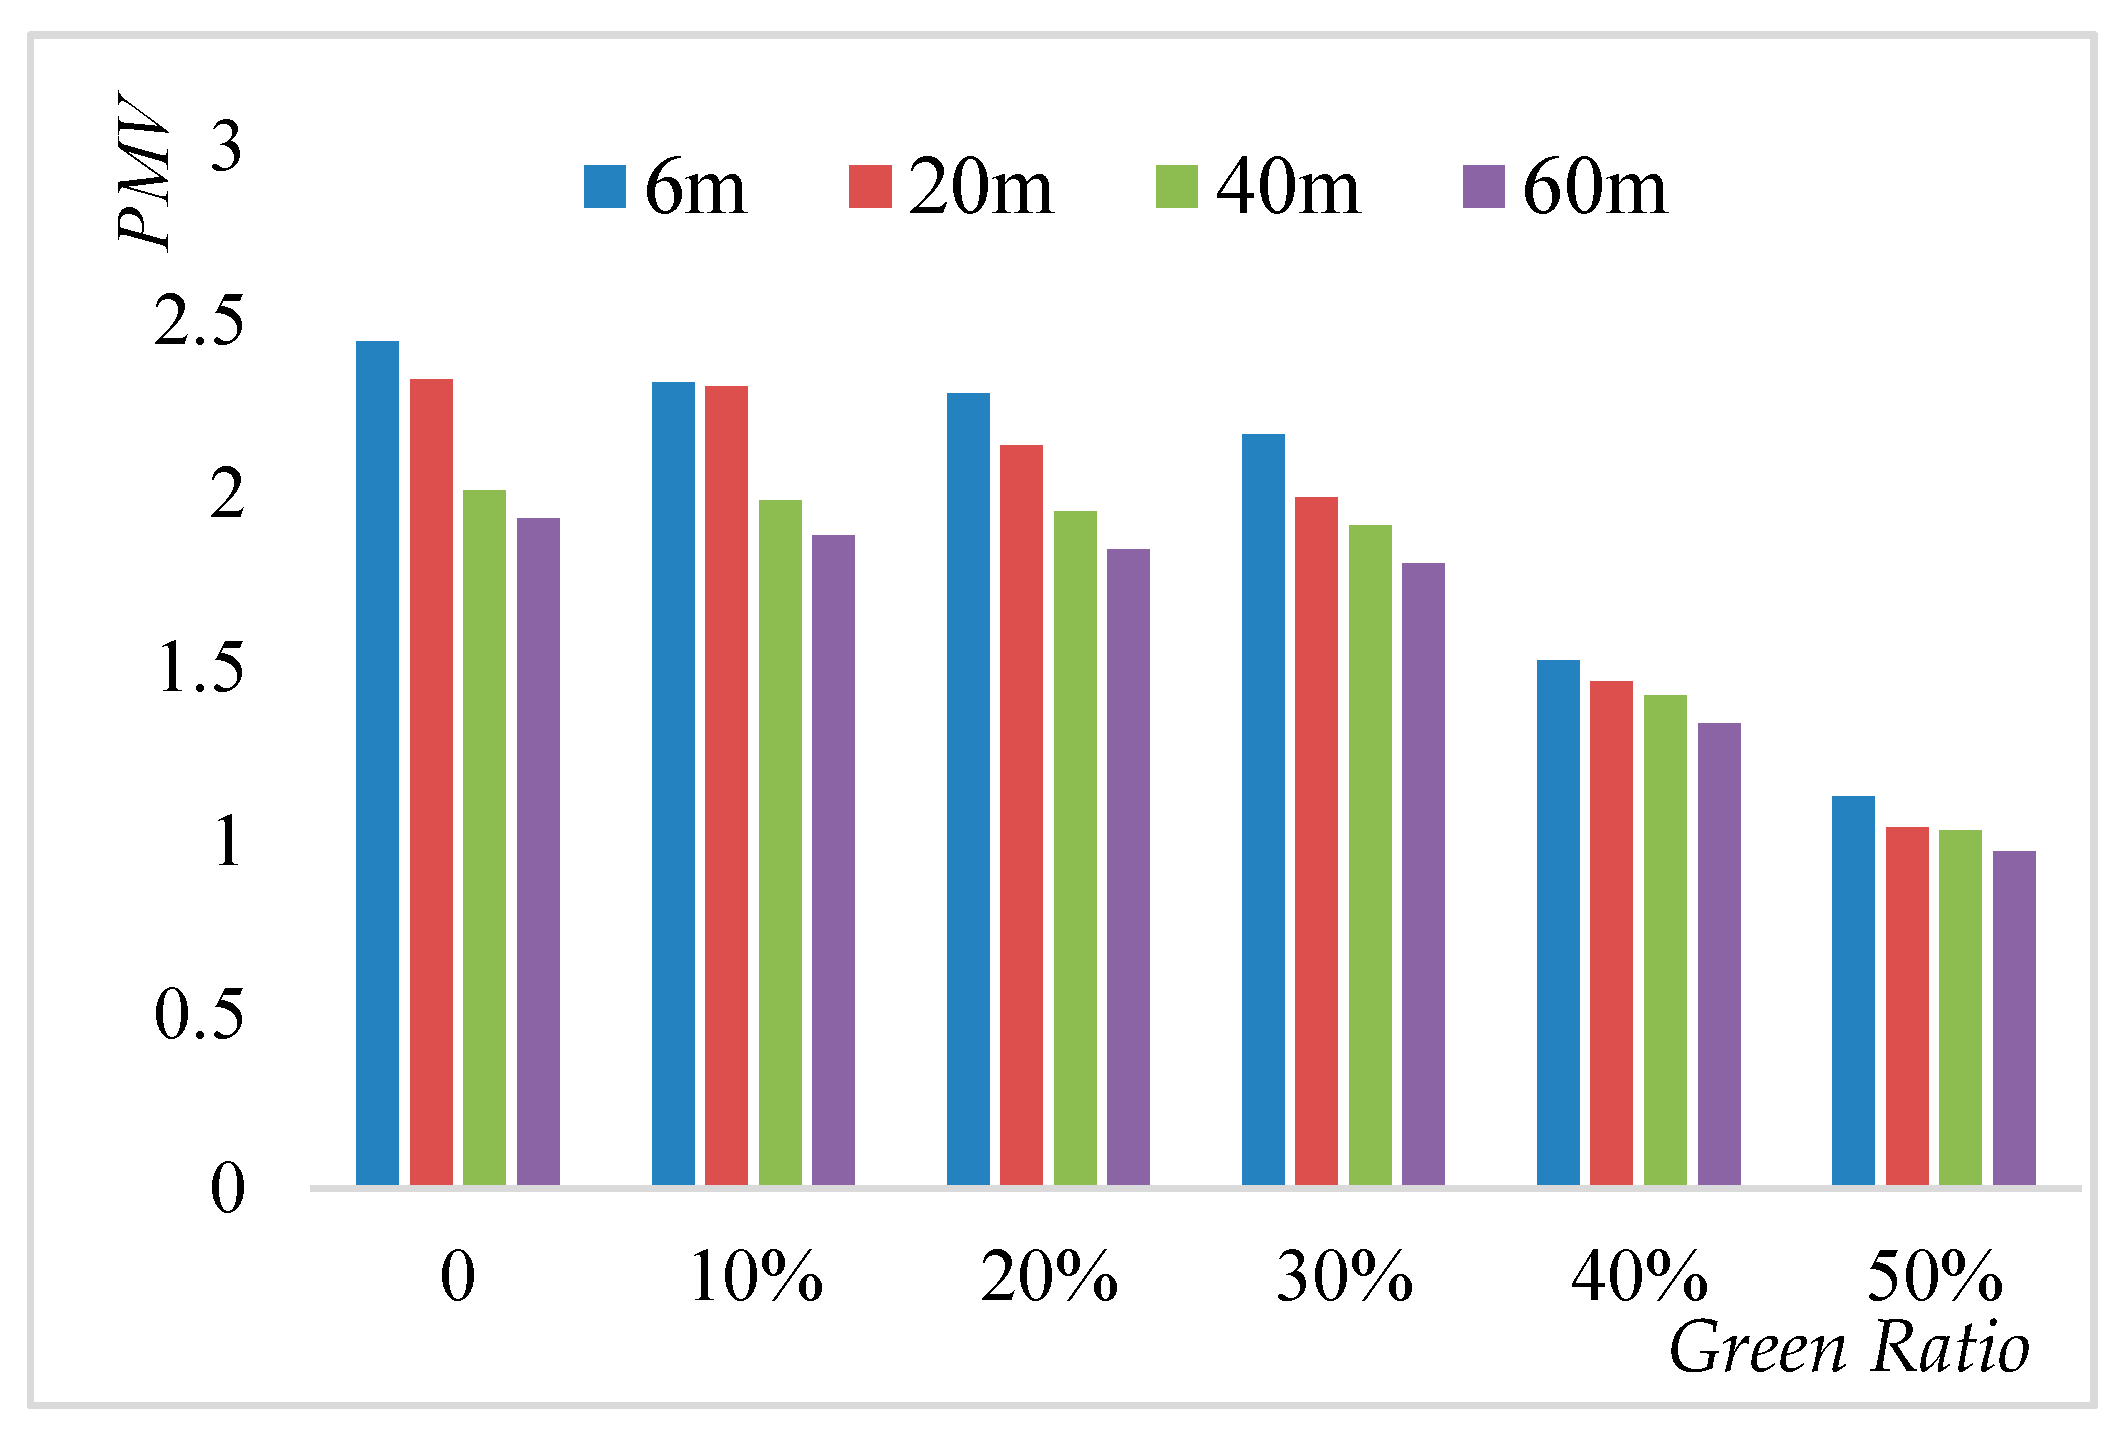
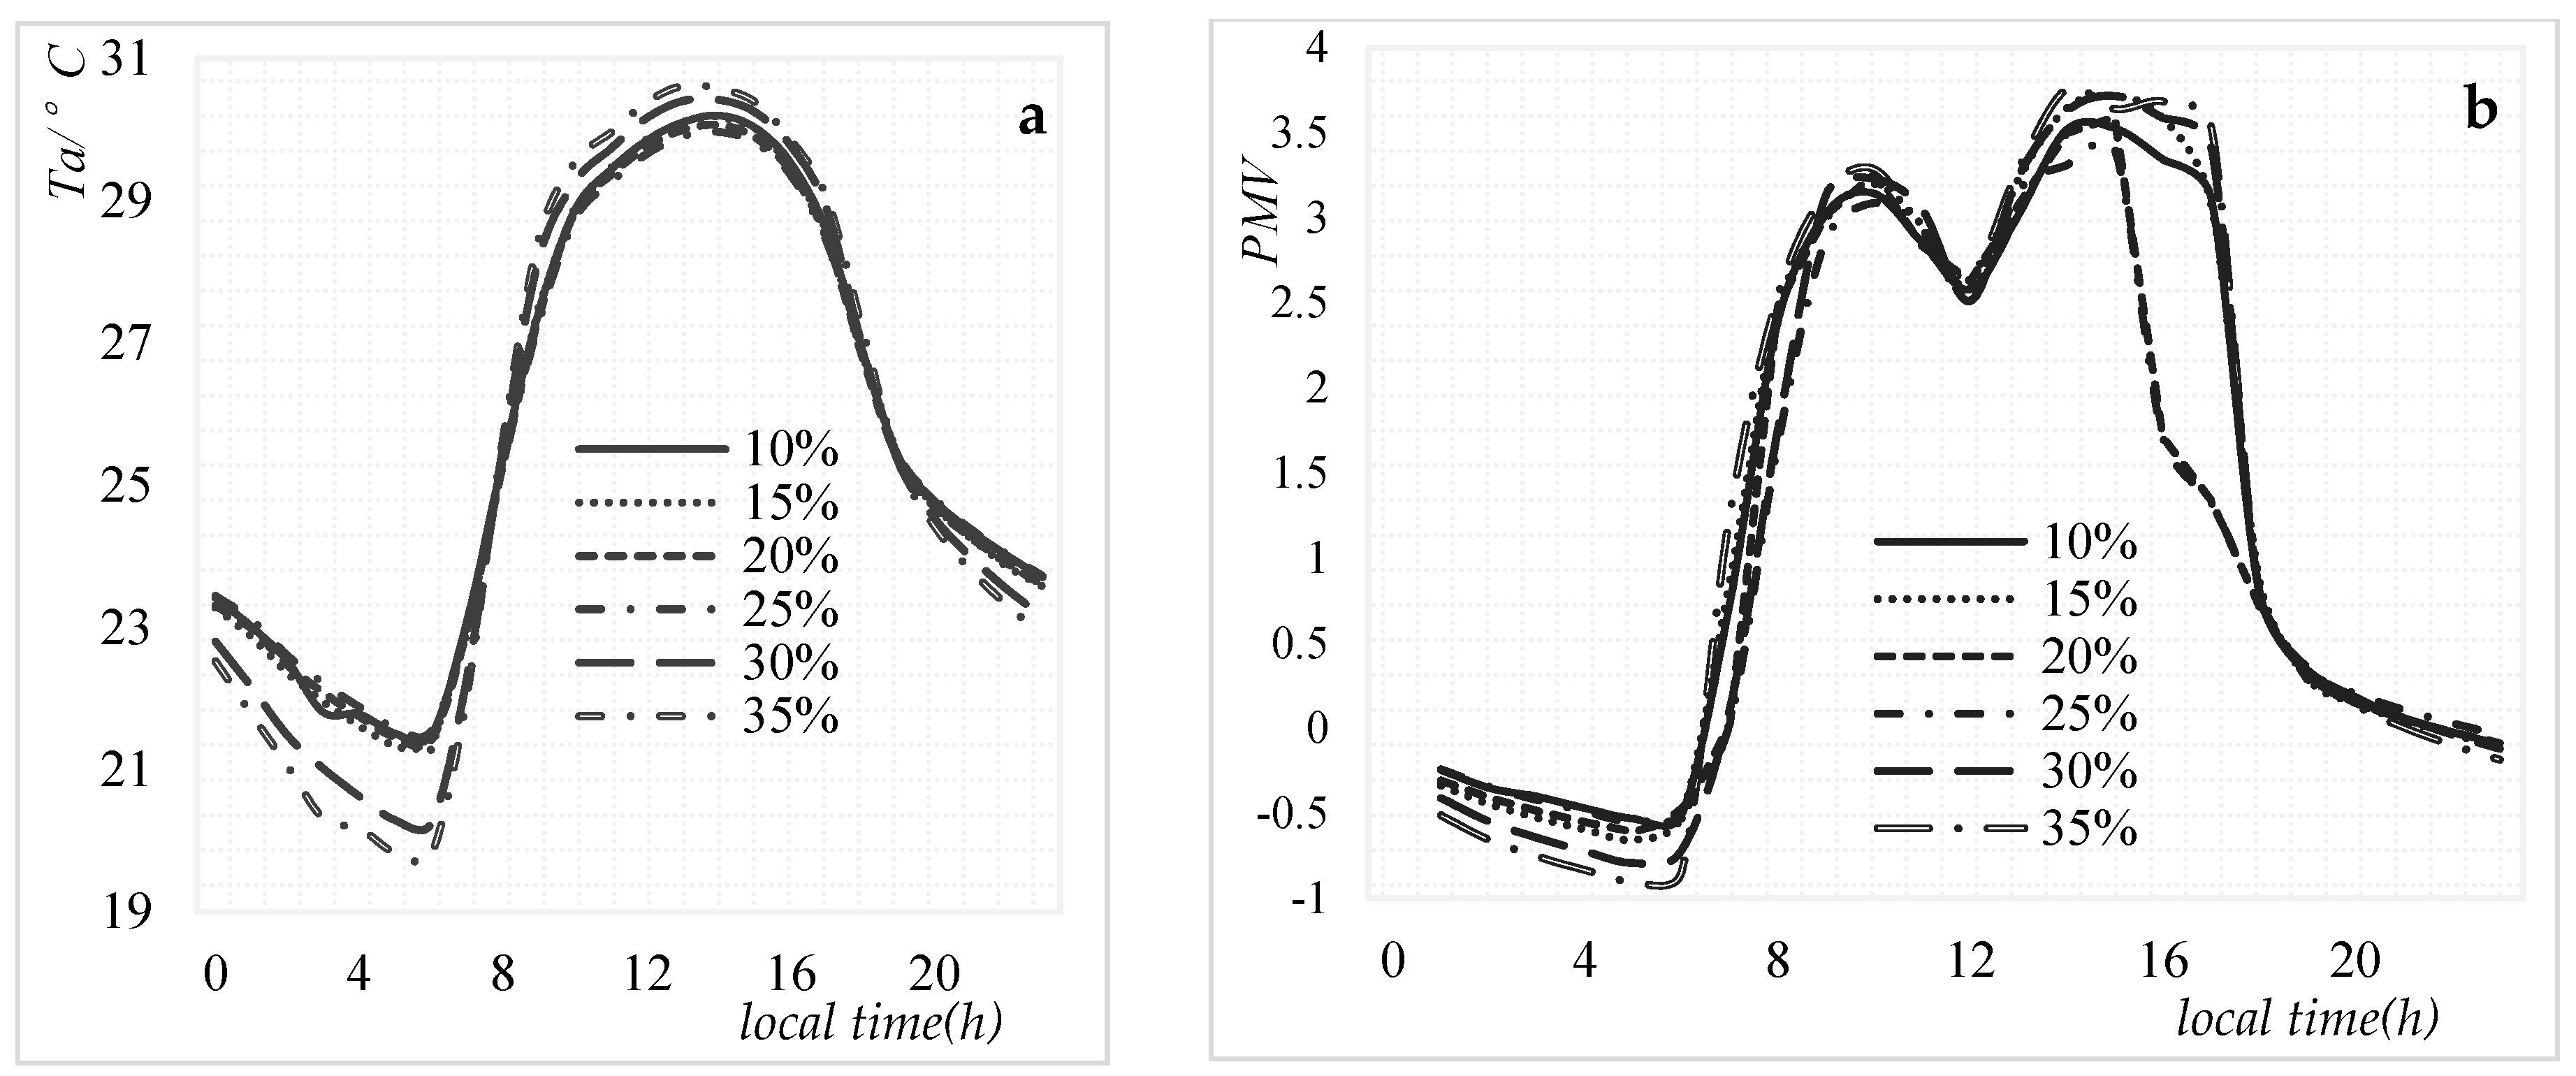
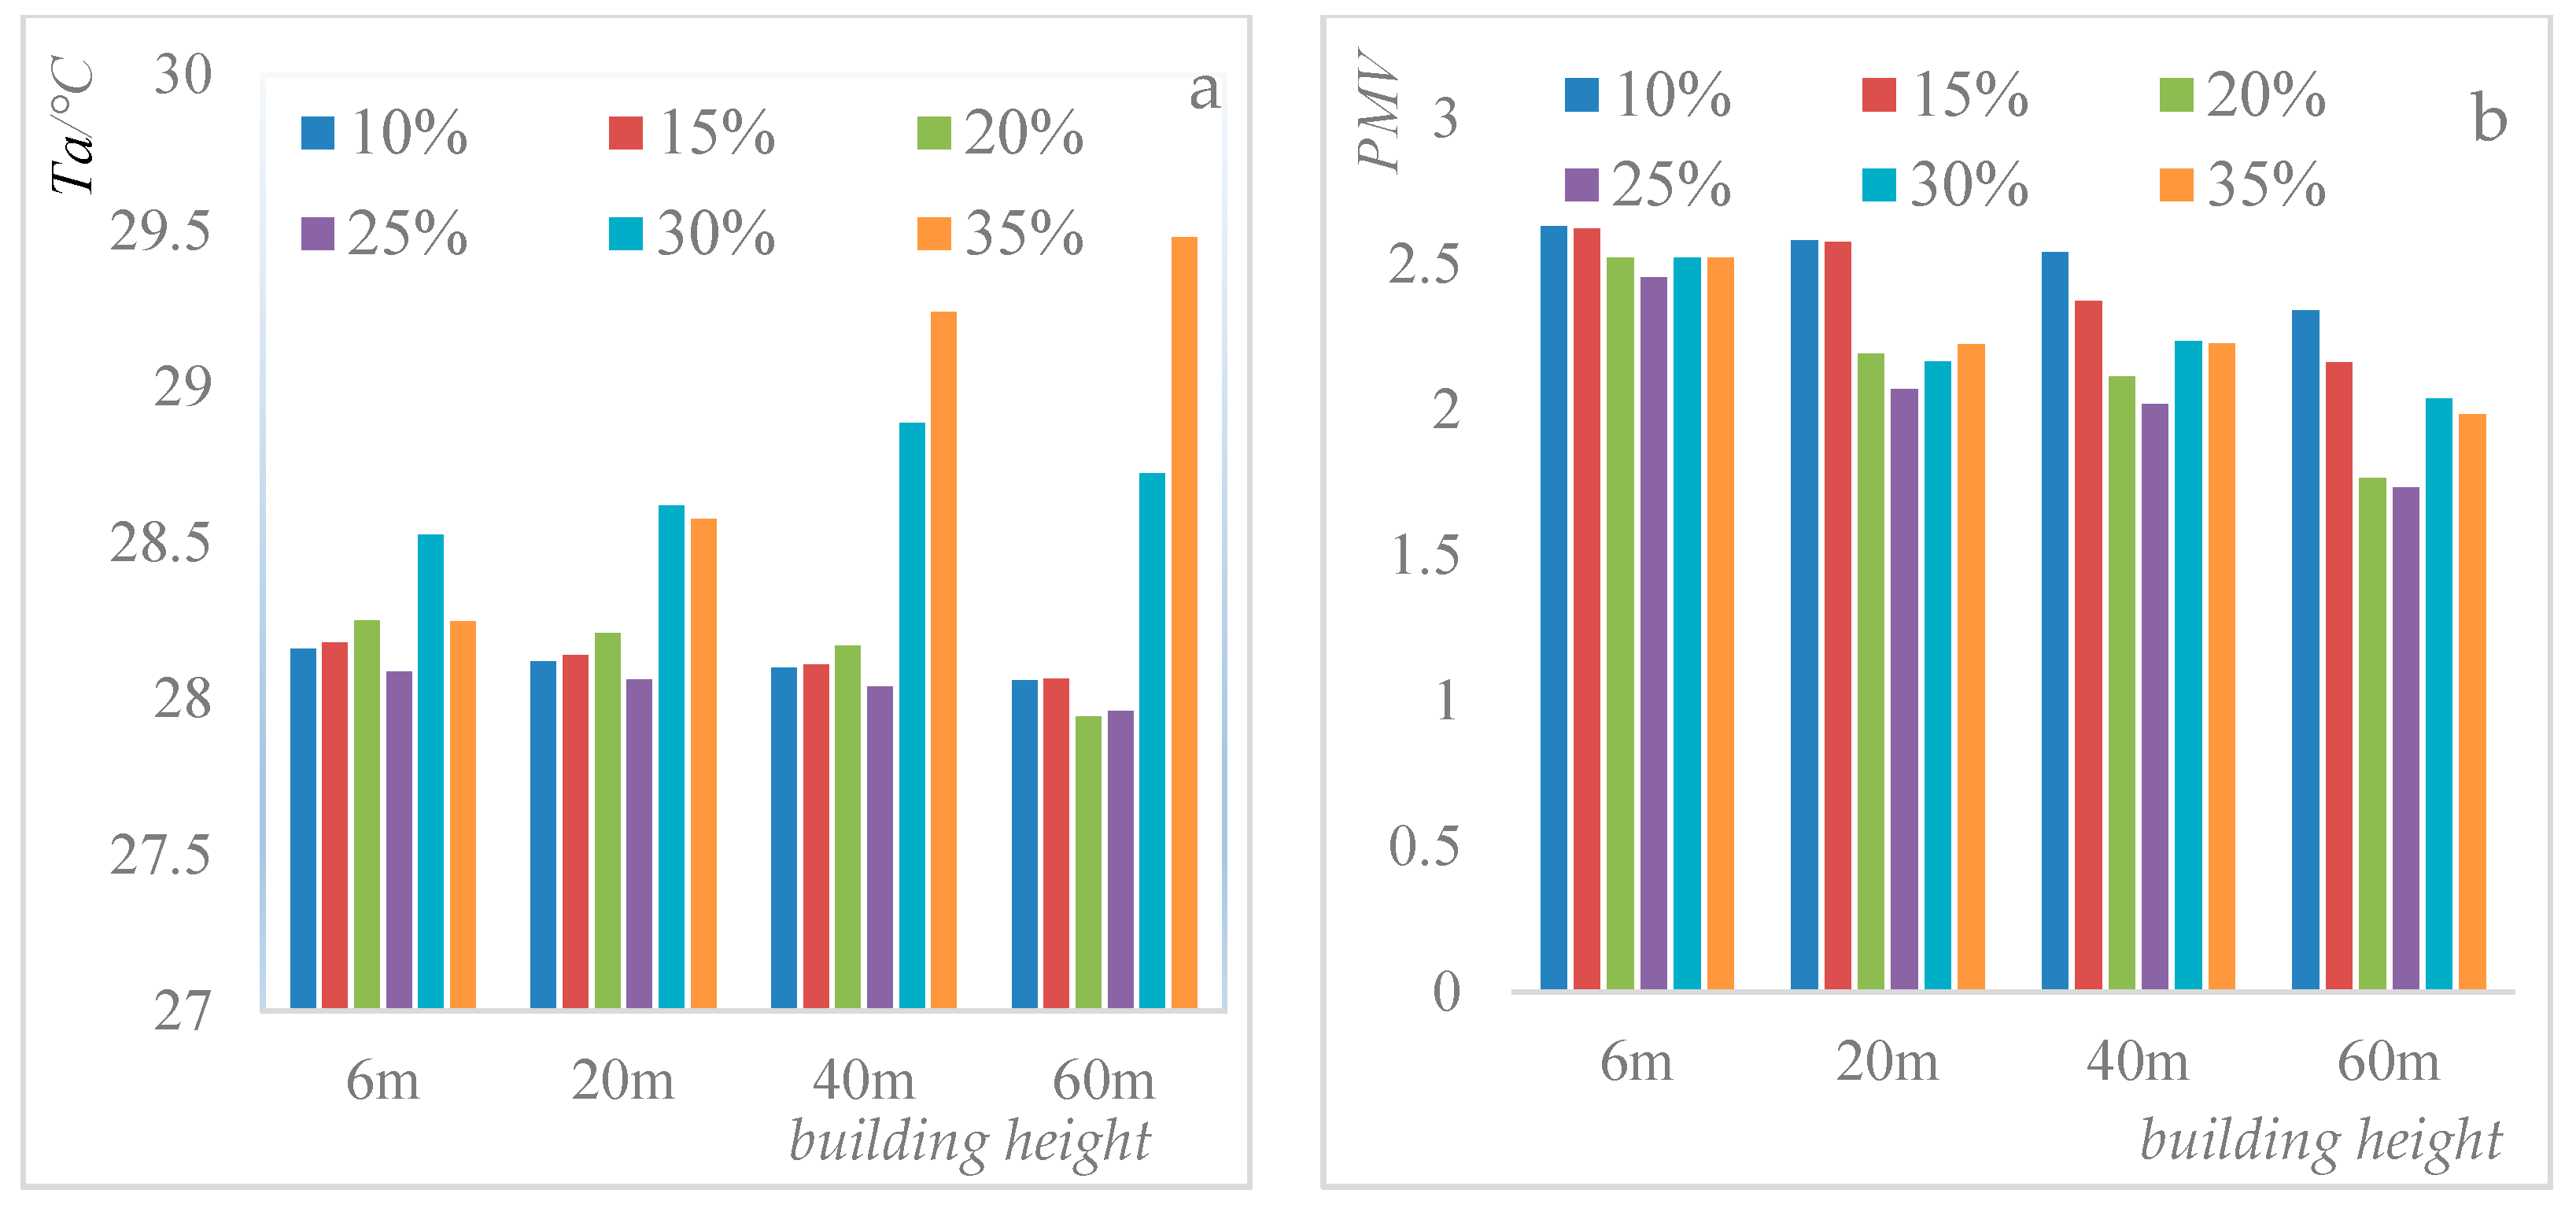
The ATa and APMV in residential areas initially decreased and then increased when the building density ranged from 20% to 50%. The 25% building density obtained the lowest ATa and APMV. As the building height increased from 20 m to 60 m, ATa decreased by 0.6 °C, APMV declined by 0.61. Peripheral layout had the lowest ATa and APMV, followed by determinant and point group layouts. Compared peripheral layout with point group layout, the former is 0.6 and the PMV is 0.12 lower than that of the latter. Green ratio improved the thermal environment of residential areas. The green ratio increased from 0% to 50% with a 10% step, the ATa and APMV decreased gradually. However, when the green ratio increased from 30% to 40%, ATa and APMV decreased most.
The relationships between building density and thermal environment in residential areas were affected by building height. Ta and PMV were the lowest (day time) for 25% building density if building height is lower than 60 m but for 60 m building height, Ta and PMV were the lowest for 20% building density. The effects of green on thermal environment were also affected by building height and density. If the green ratio increased from 10% to 50% when building density was 10%, ATa and PMV decreased by 0.6 °C and 1.19, respectively. ATa and PMV decreased by 0.9 °C and 1.51, respectively, for 35% building density. If the green ratio increased from 10% to 50% when building height was 6 m, ATa and PMV decreased by 1.4 °C and 0.8, respectively. ATa and PMV reduced by 0.9 °C and 0.48 for 60 m building, respectively. Building layouts had minimal influence on the relationships among building density, height, green ratio and thermal environment of residential areas.
The daytime effects of building density, layout and green ratio on the thermal environment in residential areas varied from these factors during night time. In daytime, Ta and PMV initially decreased and then increased with the increase of building density. This condition was opposite during night time. Ta and PMV of the peripheral layout were lower than those of the determinant and point group layouts in daytime but higher at night time. Furthermore, the ATa and APMV of the determinant layout were lower than those of the point group layout during daytime and night time. No difference was found about the effects of building height on Ta and PMV between daytime and night time. These research results could provide theoretical guidelines for the improvement of urban thermal environment in the residential area scale.
The main contributions of this study are as follows. Firstly, the relationships among building density, building height, building layout, green ratio and thermal environment in residential areas have been investigated. Secondly, the thresholds of some effect factors that can better reduce the ATa and APMV values in residential areas, such as 40% green ratio and 20% and 25% building density, have been determined. Finally, the comprehensive effects of building density, building height, building layout and green ratio on the thermal environment of residential areas have been discussed. The above results can provide theoretical guidance for the improvement of residential thermal environment.
In future researches, some issues should be further explored. (1) The relationships among building density, building height, building layout, green ratio and thermal environment of residential areas will be investigated for different climate zones. (2) Better indicators, such as Ta, surface land temperature, mean radiant temperature and thermal comfort, should be identified to characterize the thermal environment of residential areas more accurately. (3) How anthropocentric heat affects the outdoor thermal environment in residential areas should be further investigated. (4) More suitable outdoor thermal comfort indices should also be compared to analyze their adaptability and sensibility.


