1. Introduction
In recent years, the accumulation and application of big data have attracted much attention. Both academics and executives have emphasized the importance of big data. Many firms have invested heavily in big data with the aim of deriving important insights to gain sustainable competitive advantages. Recent literature has suggested that the innovation process need to create sustainable new capabilities such as big data analytics capability (BDAC) [
1,
2,
3,
4]. BDAC can help companies process the enormous amounts of available data to identify market opportunities, predict customer needs, and analyze customer purchase decisions [
5,
6]. Indeed, the role of BDAC in the innovation process is becoming increasingly prominent in practice and acknowledged in the literature. Past studies suggest that BDAC capabilities are new sustainable capabilities [
5,
7,
8,
9,
10]. Despite the hype surrounding big data, limited attention has been paid to the mechanisms and processes through which big data and BDAC add value to firms.
Sustainable organizational growth and performance is becoming a hot topic in the literature. The literature has suggested that sustainable organizations need to create sustainable new capabilities such as BDAC [
1,
2,
3,
4]. Prior studies have suggested that big data is an important sustainable resource for enterprises because they need new technologies to manage and analyze massive data and information [
3]. The emergence of BDAC has changed the original production and operation mode of enterprises. Many large enterprises wish to develop sustainable big data analysis capability to improve their market competitiveness in order to survive [
11]. Since BDAC can help enterprises to use advanced analytical skills to extract valuable information from big data, it can help enterprises obtain high operational efficiency and sustainable performance. However, past studies suggest that if organizations do not pay attention to the sustainability of BDAC, the social impact will be temporary [
2]. BDAC can promote sustainable development in many fields including the Internet of Things, social networks, sustainable development [
1], and sustainable investment in supply chain [
3].
Although literature suggests that big data and BDAC are new sustainable competitive advantages that enhance sustainability of organizational development, empirical research is still lacking and the limited research has provided conflicting results on the value of big data for sustainable innovation and organizational development. The issues of whether and under what conditions investments in big data can enhance firm performance remain unsettled [
12]. There is very little empirical evidence to guide managers on how to leverage big data resources to achieve sustainability of organizational development and performance. We aim to fill the literature gap by investigating how big data relates to sustainability of innovation and organizational development and how big data analytics capability (BDAC) may moderate this relationship. Thus, four research questions are developed.
RQ1: Does big data have an inverted U-shaped relationship with sustainability of innovation and organizational development?
RQ2: Does BDAC strengthen or weakens the effects of big data on sustainability of innovation and organizational development?
To answer these research questions, we build on two of the most important theories of organizational development: the resource-based theory and the organizational inertia theory. We propose that big data may have an inverted U-shaped relationship with sustainability of innovation and organizational development. That is, a moderate level of big data resources is optimal, but a high level of big data resources actually decreases sustainability of innovation and organizational development. BDAC may help managers better leverage big data resources and overcome the inertia in resources and routines. As a result, BDAC has the potential to strengthen the positive effects of big data on sustainability of innovation and organizational development.
We test these hypotheses using data from 477 U.S. and 632 Chinese service innovation projects as part of a multi-year panel study of international innovation projects. From the database, we selected service innovation projects from each participating company in five industries (hotel, traveling, and tourism services; banking, insurances, securities, financial investments, and related activities; information and semiconductor; Internet-related services; and health care services) in two countries (the United States and China). The data reported in this study included only the projects with sales growth rate and project gross margin for first three years of the commercialization of the innovation projects.
There were three parts to our research design. First, to ensure the suitability of the research scales and methods for a cross-national comparative study of the theoretical model, we followed the procedures recommended by [
13] and extended by [
14]. Second, to test the causal relationships between variables, we collected data on big data resources and BDAC. Finally, after commercialization of each project, we collected track sales and gross profits data for three years.
This study makes several contributions to theory and practice in the fields of big data and sustainability of innovation and organizational development. First, this study enriches our knowledge of big data by revealing the linear and curvilinear relationships between big data and sustainability of innovation and organizational development. Second, by examining the moderating role of BDAC, this study responds to the recent call for uncovering the conditions under what big data enhances sustainability of innovation and organizational development. Third, the research findings of this study suggest how firms can realize the full potential of their big data resources.
Our study findings also provide some practical insights for innovation project leaders regarding big data resources and BDAC. It is suggested that project leaders in both U.S and Chinese countries can increase innovation project performance by ensuring that the project teams have adequate big data resources on customer needs, user behavior, competitive intelligence (e.g., marketing, products, services, etc.), and technology development intelligence.
Although big data can indeed increase sustainable sales growth and sustainable gross margin, managers in U.S. service innovation teams must be aware of the limitations of their big data resources and understand that too much investment in big data may actually hurt sales growth. The innovation teams also need to build their BDAC to enable them to harness the potential of their big data resources. For U.S. innovation teams, devoting resources to BDAC is preferable to additional investment in big data. The stronger this capability is, the greater effect big data can have in improving sales growth and gross margin.
Managers of Chinese innovation projects should be aware that developing BDAC might have its downsides. When investment in big data is low, promoting BDAC can increase sales growth and gross margin. However, after a certain point, allocating further resources to BDAC may inhibit sustainability of innovation and organizational development. Chinese managers may also use the suggested tactics to increase big data analytics capability.
3. Materials and Methods
To test our model, we collected data as part of a multi-year panel study. From the database, we selected service innovation projects from each participating company in five industries (hotel, traveling, and tourism services; banking, insurances, securities, financial investments, and related activities; information and semiconductor; Internet-related services; and health care services) in two countries (China and the United States). The data reported in this study included only the projects with sales growth rate and project gross margin for the first three years after the commercialization.
3.1. Overall Research Design
There were three parts to our research design. First, to ensure the suitability of the research scales and methods for a cross-national comparative study of a theoretical model, we followed the procedures recommended by [
13] and extended by [
14]. Second, to test the causal relationships between variables, we collected data on big data resources and big data analytics capabilities. Finally, we tracked the projects over time and collected sales and gross profits data for the first three years after the commercialization.
3.2. Measurement Development Procedures
We developed the measurement scale using the procedures reported by Song and Parry [
14]. We conducted in-depth case studies and focus group interviews with service innovation teams in China and the United States, follow-up interviews with team members, and consultations with academic experts from two national business administration schools. We used our findings to improve measurement scales from the literature on big data and big data analytics capabilities.
In the focus group interviews, we included open-ended and semi-structured questions. We examined the conceptual equivalence of the constructs with the first set of questions. Team members were requested to define the key constructs of big data and big data analytics capabilities [
13,
14]. We assessed the functional equivalence of the constructs with the second set of questions [
13,
14]. Team members evaluated how well our theoretical model describes their won service innovation experience [
13,
14]. We assessed the category equivalence of the constructs with the third set of questions, which addressed the team members’ perceptions of the relevance and completeness of the scale items from the literature and previous case studies [
13,
14]. The results of these case studies and interviews indicate that several scales that have been used in academic research should be modified for cross-national comparative research on the service innovation process.
Following Churchill’s procedures for developing better measures [
27], we asked academic experts and service innovation project managers in two countries to review a list of our constructs and corresponding measurement items and provide critical assessments and recommendations for additional measurement items [
14]. After a small modification and a second review of the items by the scholars and managers, we constructed the questionnaires.
3.3. Variable Measurement
Our study variables include big data, big data analytics capabilities, and project performance. Except for project performance, which was measured using objective data, the other variables were assessed using scales we adopted from the literature or developed based on our measurement development as described. Prior studies suggest that a 0–10 rating scale reflects the metric system in structure and is thus easier to understand in international surveys than 1–7 or 1–5 rating scales [
14,
15,
28]. Therefore, we directed the participants in this study to respond to all survey measures using a 0–10 scale, as shown in the
Appendix A.
Our measurement scale for big data resources includes five items that assess how adequate the project team has the big data resources on customer needs, user behavior, competitive intelligence (e.g., marketing, products, services, etc.), technology development intelligence, and product usages. Project team leaders were requested to provide assessment of the team’s big data resources in these areas (0 = not adequate for this development project; 10 = much more than adequate for this development project). These measures were developed based on the measurement development described earlier.
Our measurement scale for big data analytics capabilities included five items: (1) we have advanced tools (analytics and algorithms) to extract value from big data [
10,
29]; (2) we have the capability to discover relationships and dependencies from big data; (3) we have the capability to perform predictions of outcomes and behaviors from big data [
10]; (4) we have the capability to discover new correlations from big data to spot market demand trends and predict user behavior [
5,
9]; and (5) our big data analytics staff has the right skills to accomplish their jobs successfully [
10]. Project team leaders were requested to provide assessment of the team’s capabilities in these areas (0 = no capability; 10 = very high level of capability).
The measure for the average sales growth rate was adopted from [
30]. The scale for the average gross margin was adopted from [
31]. These variables are calculated using following formulas:
Average Sales growth rate (%; adopted from [
30])
where,
Average gross margin (in %; adopted from [
31])
where
3.4. Data Collection Procedures
To ensure that the participants in both countries would have the same understanding of the scale items, we used the double translation method to translate the questionnaire [
14]. Two translators translated the English version into Chinese and then two other translators independently translated the Chinese version into English. The four translators discussed and resolved inconsistencies they found and also consulted with several case study participants to determine the appropriateness of the Chinese questionnaire. We then conducted two pretests of the questionnaire, one in which participants completed the questionnaire in our presence and raised questions about unclear wording and another in which a professionally drafted questionnaire surveyed participants in the case study [
14]. As a result of this preliminary research, we made minor modifications to create the final survey.
We administered the survey by express mails and emails. We first sent a package/email that included a personalized letter, the survey, and a prepaid return envelope. Each participating company was requested to provide data on a recent service innovation project, a typical service innovation project, a successful, and a failure service innovation project. A week later, we mailed a follow-up letter/email to each company to encourage their participation. After that, we sent two follow-up letters/emails and made phone calls to nonresponding companies in an attempt to improve the response rate. The final data in each country is described below.
3.4.1. U.S. Data
We selected our U.S. sample of 1000 companies from the Dun and Bradstreet database. Over three years, we used the data collection procedures described earlier and ultimately obtained complete data for 477 service innovation projects, with industry representation of 46 from hotel, traveling, and tourism services; 146 from banking, insurances, securities, financial investments, and related activities; 99 from information and semiconductor; 95 from Internet related-services; and 91 from health care services.
3.4.2. Chinese Data
The initial Chinese sample frame comprised all 524 initial public offerings (IPOs) from 2004 to 2014 in the Small and Medium Enterprise (SME) and Growth Enterprise Market (GEM) boards in the Shenzhen Stock Exchange, China. The sample was reduced to 482 IPOs due to missing data.
Using the procedures described earlier, we ultimately collected complete data for 632 service innovation projects from 278 companies. The industry representation of the projects included 40 from hotel, traveling, and tourism services; 217 from banking, insurances, securities, financial investments, and related activities, 120 from information and semiconductor; 91 from Internet-related services; and 164 from health care services.
4. Results
Cronbach’s alpha was used to assess construct reliability for big data and BDAC. The alpha coefficients of big data and BDAC, respectively, are 0.891 and 0.803 for the U.S. sample and 0.814 and 0.767 for the Chinese sample. Therefore, our study measures for these two theoretical constructs have high reliability.
We presented the construct median, means, standard deviations, and correlations in
Table 1. Exploratory factor analysis was performed to evaluate the construct validity. The factor loadings presented in
Table 2 ranged from 0.746 to 0.901 in the U.S. sample and 0.656 to 0.838 in the China sample. These results suggested that the study measures correctly loaded onto the corresponding factor. All retained measures have no double loadings of greater than 0.40. Thus, the constructs possessed convergent validity.
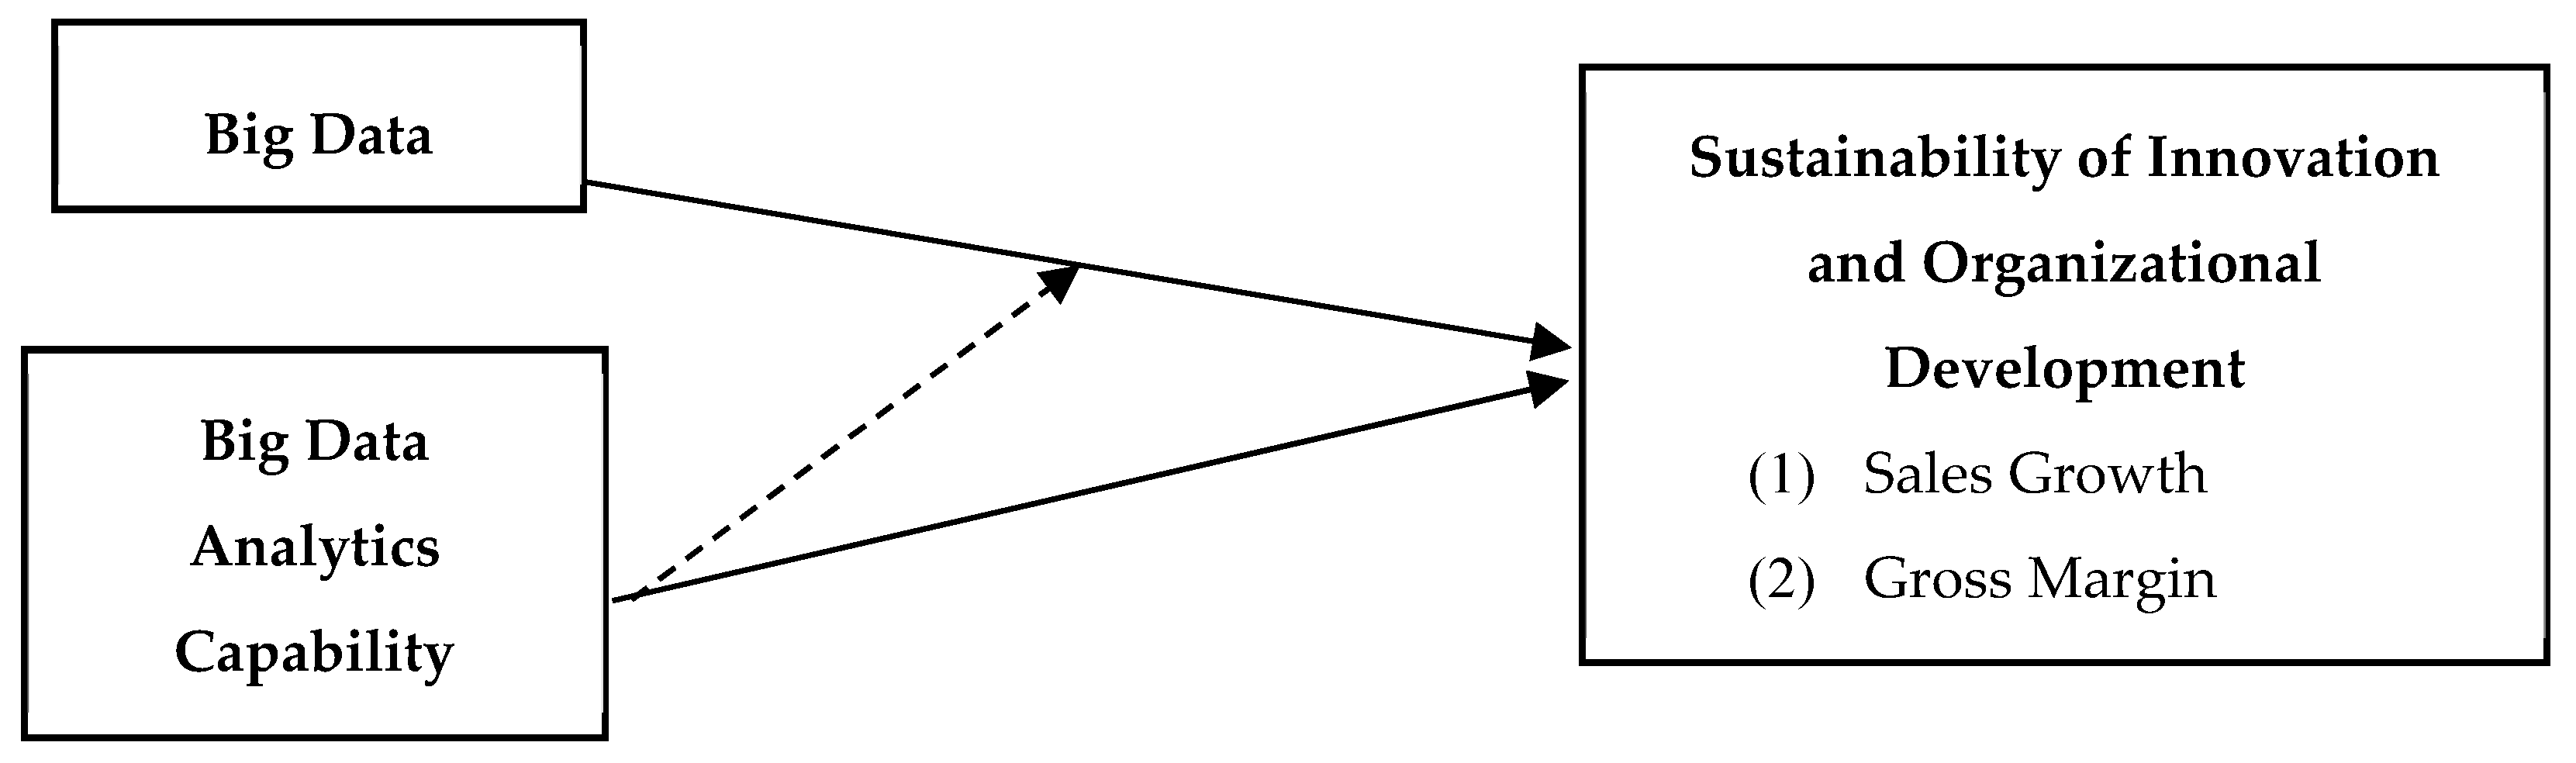
Our theoretical model in
Figure 1 includes following two equations:
To test the hypotheses, the above two equations are estimated for each country separately using Proc Reg in SAS 9.4 program. We performed multiple ordinary least square (OLS) regression analyses for each country using project performance measures: project’s three-year average sales growth rate and gross margin data. We presented results for the three-year average growth rate in
Table 3 and the three-year average gross margin in
Table 4. We also estimated the same equations using data for each year and found the major conclusions do not change. Therefore, we reported only the results of the average sales growth and the average gross margin.
4.1. Research Hypothesis 1: Direct Effects of Big Data and Innovation Performance
Hypothesis 1 predicts an inverted U-shaped relationship between big data and sustainability of innovation and organizational development. The results vary according to the performance measure being considered. For the average sales growth,
Table 3 shows that for the U.S. sample, big data had a significant positive relationship (b = 5.853,
p < 0.01) whereas (big data)
2 had a significant negative relationship (b = −0.700,
p < 0.10). These results indicate that big data had an inverted U-shaped relationship with sustainability of innovation and organizational development as measured by the average sales growth in the U.S. sample, in support of Hypothesis 1.
For the Chinese sample, the relationship to big data was again significantly positive (b = 6.473, p < 0.01) whereas (big data)2 had a negative but not significant relationship (b = −0.087, p > 0.10). In contrast to the U.S. sample, big data had a positive effect on the average sales growth, but did not have an inverted U-shaped relationship with the average sales growth. Thus, H1 was not supported by the Chinese sample.
For the three-year average gross margin,
Table 4 shows that for the U.S. sample, big data had a significant positive relationship (b = 5.775,
p < 0.01) whereas (big data)
2 had a negative but not significant relationship (b = −0.522,
p > 0.10). For the Chinese sample, big data again had a significant positive relationship (b = 4.194,
p < 0.01) and the relationship with (big data)
2 was also positive but not significant (b = 0.111,
p > 0.10). Thus, counter to H1, these results indicate that for both U.S. and China, big data had a positive linear relationship with sustainability of innovation and organizational development as measured by the average gross margin.
4.2. Research Hypothesis 2: The Moderating Effects of BDAC
To test Hypothesis 2, we needed to evaluate the coefficient estimates of (big data) × BDAC and (big data)
2 × BDAC. Results in
Table 3 and
Table 4 indicate that for the U.S. sample, both (big data) × BDAC and (big data)
2 × BDAC had a significant positive relationship with the average sales growth (b = 2.860,
p < 0.01; b = 0.733,
p < 0.01) and the average gross margin (b = 2.940,
p < 0.01; b = 0.831,
p < 0.01). For the Chinese sample, (big data) × BDAC had a positive, but not significant, relationship with both the average sales growth (b = 0.419,
p > 0.10) and the average gross margin (b = 0.153,
p > 0.10) whereas (big data)
2 × BDAC had a significant negative relationships with both the average sales growth (b = −0.353,
p < 0.01) and the average gross margin (b = −0.171,
p < 0.05). These results thus indicate that in the U.S., with the interaction of BDAC, big data had a U-shaped relationship with sustainability of innovation and organizational development. Yet, for the Chinese sample, there was an inverted U-shaped relationship.
To further illustrate these interesting relationships, we presented
Figure 2 and
Figure 3 to show the specific relationships.
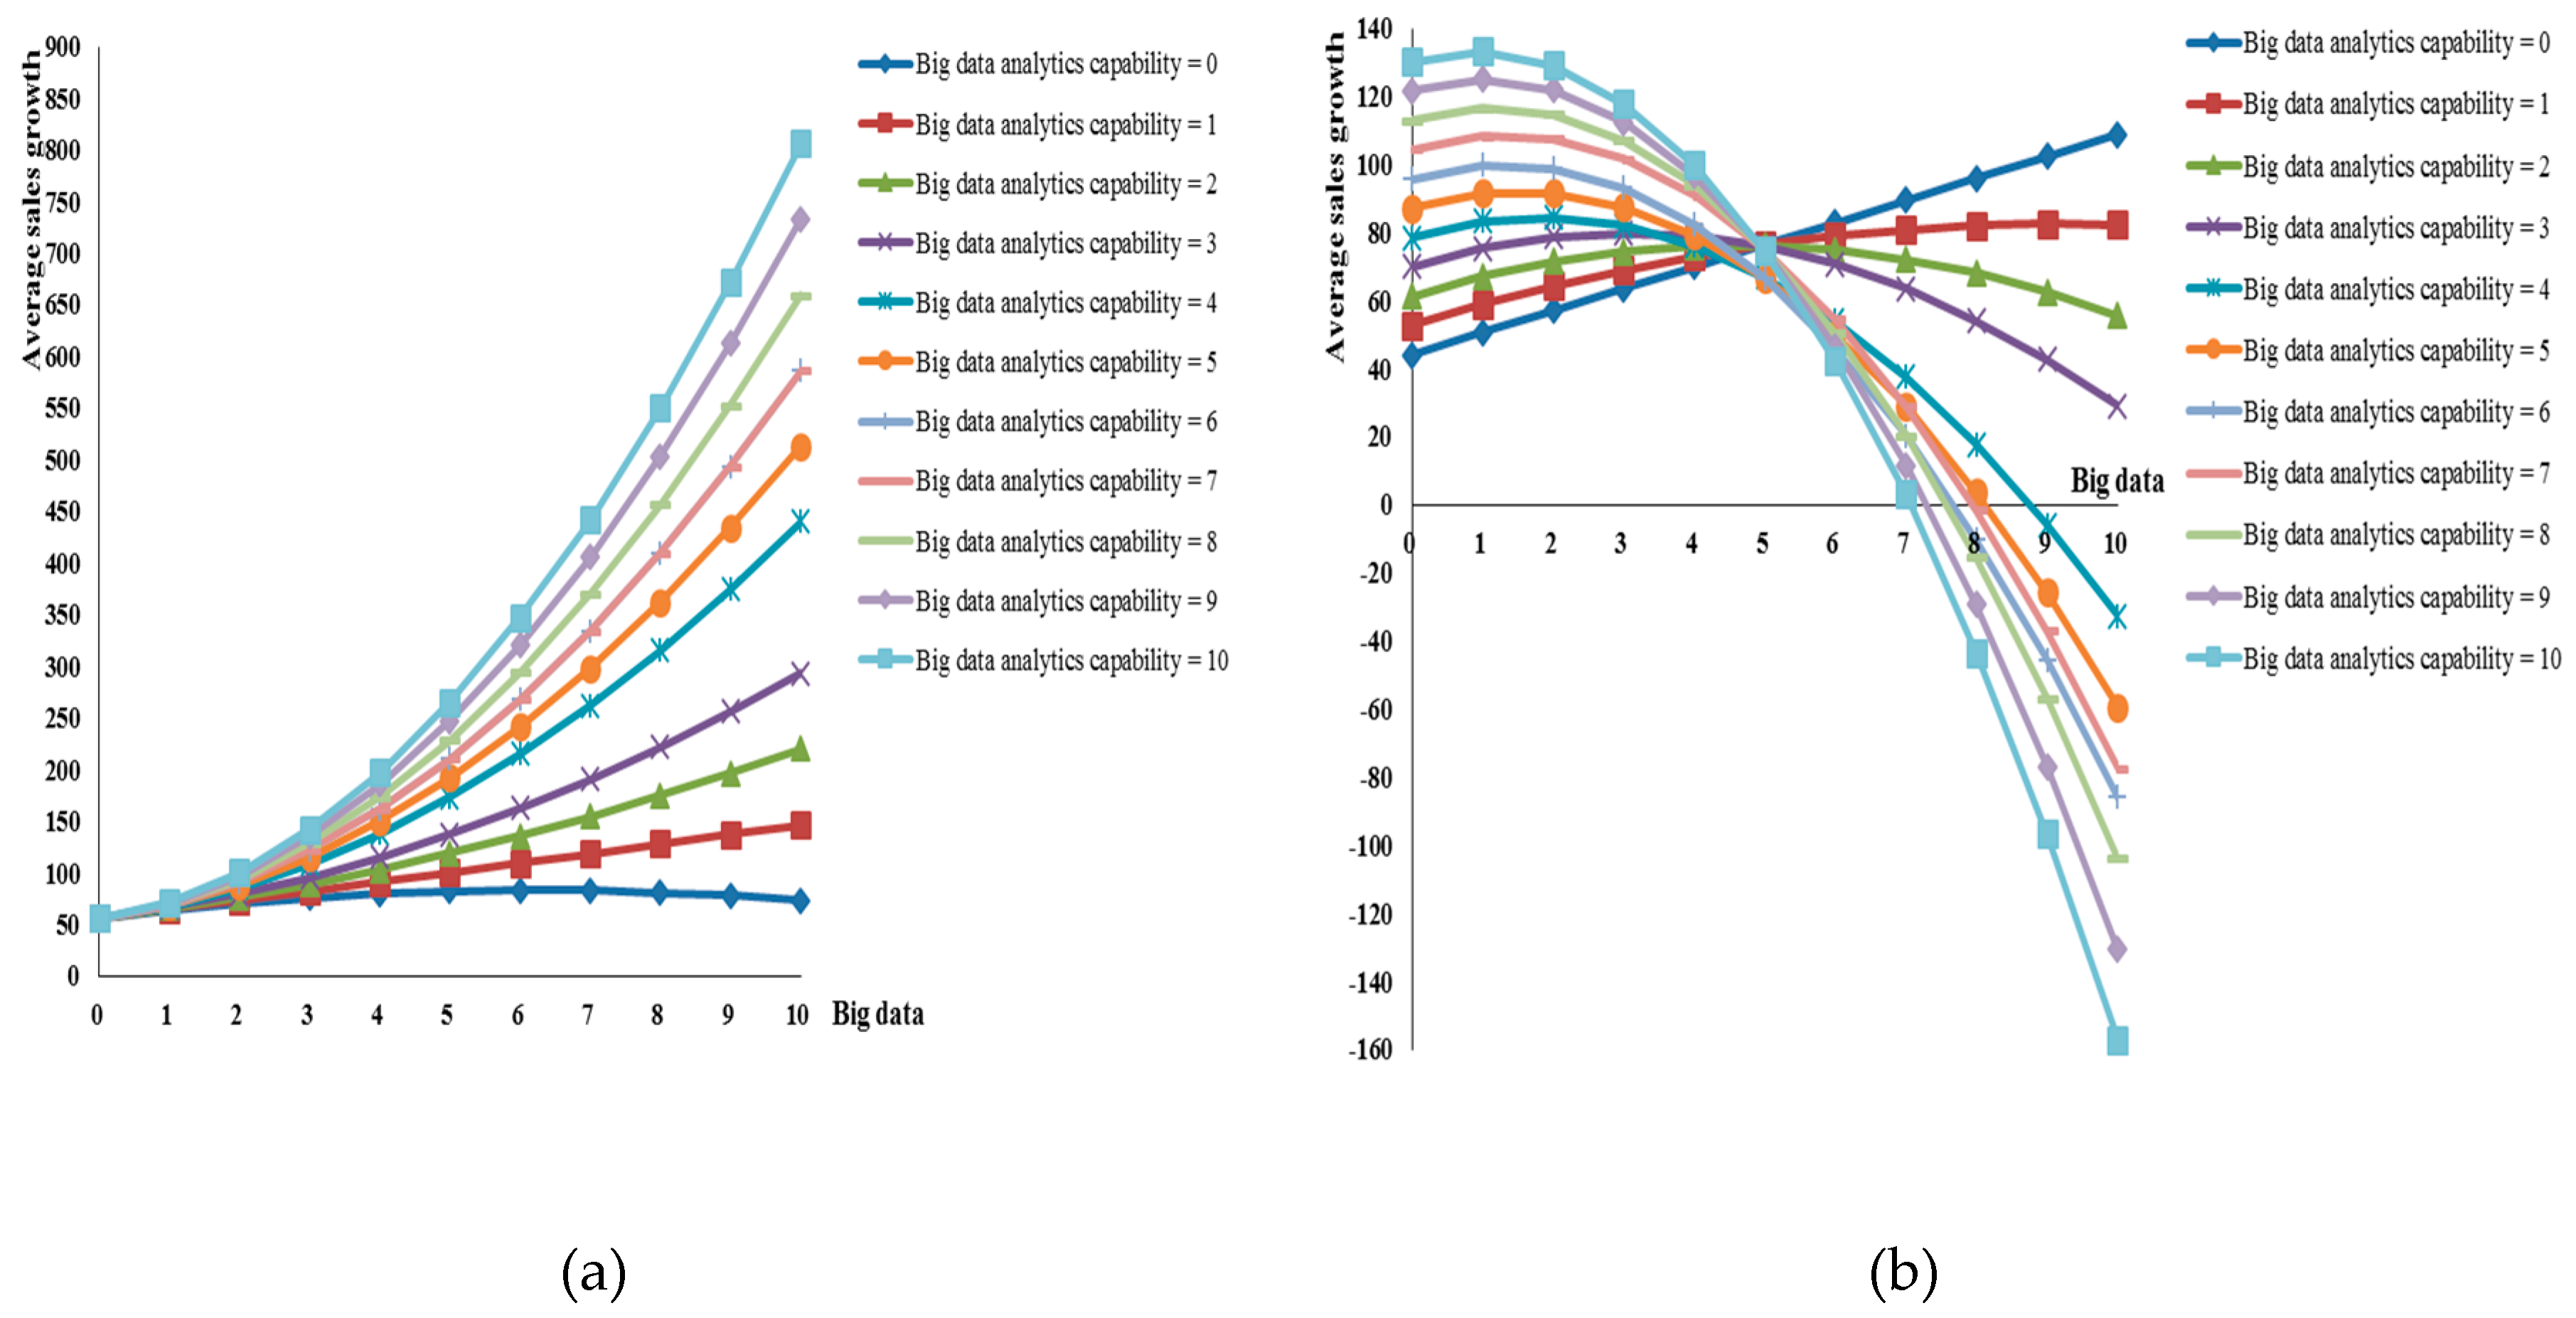
Figure 2a shows the relationship between big data and the average sales growth at different levels of BDAC for the U.S. service innovation projects. As we can see from
Figure 2a, when BDAC was 0, big data had an inverted U-shaped effect on the average sales growth. When BDAC was 1 or higher, there was a half U-shaped relationship between big data and the average sales growth; further increases in big data increased the average sales growth. These findings provide empirical supports for Hypotheses 1 and 2.
For Chinese service innovation projects,
Figure 2b shows that when BDAC was 0, big data had a positive linear relationship with the average sales growth. When BDAC was 1 or higher, this relationship between big data and the average sales growth became an inverted U shape. Before a certain point (big data level of 5), BDAC strengthened the effect of big data on the average sales growth; after this point, BDAC exerted a negative moderating effect. These results provided partial support for Hypothesis 2.
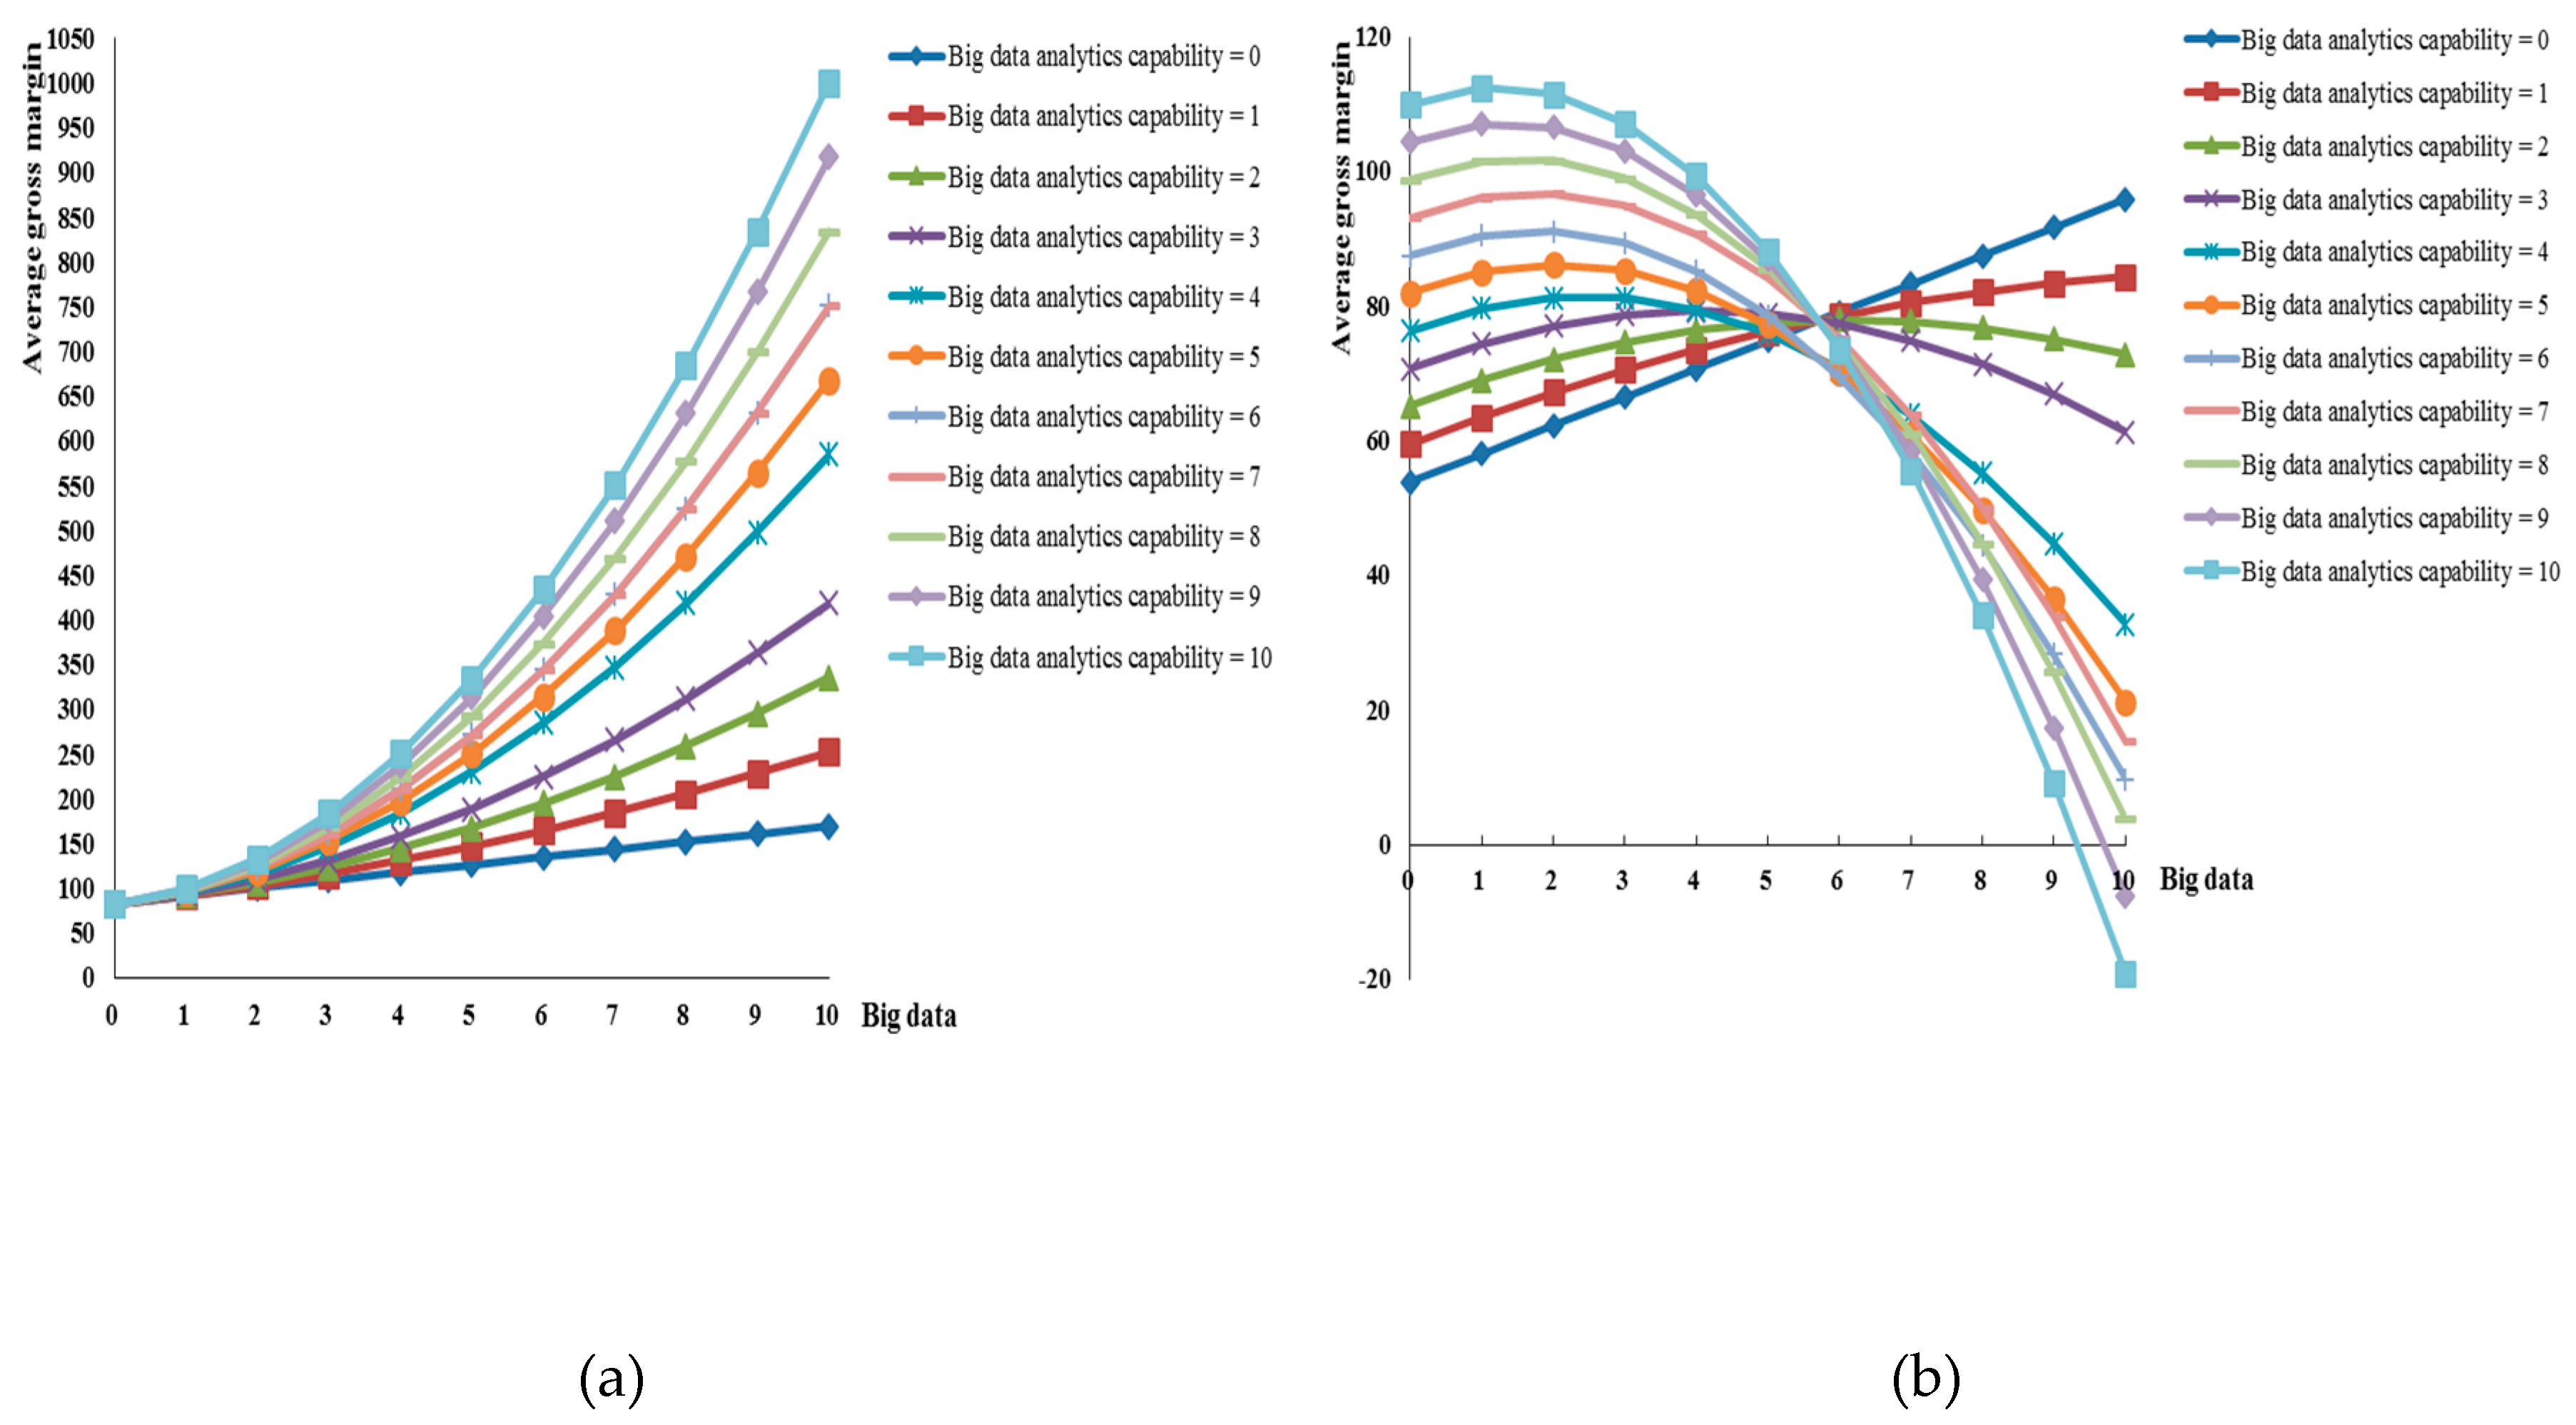
Figure 3a shows the relationship between big data and average gross margin at different levels of BDAC for U.S. innovation projects. When BDAC was 0, big data had a positive linear relationship with gross margin, that is, increases in big data positively affected gross margin. When BDAC was 1 or higher, there was a U-shaped relationship between big data and gross margin; further increases in big data positively affected sale growth. These findings fully support Hypothesis 2.
Figure 3b shows that when BDAC was 0, big data had a positive linear relationship with gross margin. When BDAC was 1 or higher, the relationship between big data and gross margin became an inverted U shape. Before a certain point (big data level was 6), BDAC strengthened the effect of big data on gross margin: whereas after this point, BDAC exerted a negative moderating effect. These results provide partial support for Hypothesis 2.
5. Discussion
Building on the resource-based view and organizational inertia theory, we presented a model that specified how big data could be leveraged by innovation teams to achieve superior performance. Using samples from the United States and China, we empirically tested the model and found two interesting and surprising results.
First, our findings provided a more nuanced understanding of the impact of big data on sustainability of innovation and organizational development. Previous research has highlighted the role of big data in attaining sustainable competitive advantage. Consistent with this logic, we found that big data enhanced sales growth and gross margin. More interestingly, for U.S. service innovation projects, we found that big data had an inverted U-shaped relationship with sales growth: a moderate level of big data related to the highest degree of sales growth whereas a high level of big data actually inhibited sales growth (see
Figure 2a). An explanation for this might be that resource and routine inertia [
16] might cause the innovation teams to depend too much on big data resources to gain information and knowledge, thereby overlooking other resource allocation patterns necessary to increase sales growth and increase innovation successes. These findings contribute to the extant literature by demonstrating and explaining the limited benefit of increasing investment in big data.
Second, we extended the existing literature by presenting and confirming empirically that BDAC strengthened the positive impact of big data on the sustainability of innovation and organizational development. As shown in
Figure 2a and
Figure 3a for the U.S. sample, increased big data investment was a more important precursor to innovation projects sales growth and gross margin if there was a moderate to high level of BDAC. Thus, innovation teams would gain more from their investment in big data if they also devote resources to building their BDAC. As shown in
Figure 2b and
Figure 3b, the findings for the Chinese sample were more complicated: BDAC strengthened the effects of big data on sales growth and gross margin only before a certain point (big data level of 5 or 6), but beyond this point, BDAC exerted a negative moderating effect.
6. Managerial Insights
Our findings provided some practical insights for innovation project leaders regarding big data resources and BDAC. It is suggested that project leaders in both U.S and China can increase service innovation project performance by ensuring that the project teams have adequate big data resources on customer needs, user behavior, competitive intelligence (e.g., marketing, products, services, etc.), and technology development intelligence.
Although these big data resources can increase sales growth and gross margin, managers in U.S. service innovation teams must be aware of the limitations of their big data resources and understand that too much investment in big data may actually hurt sales growth of the service innovation projects. The innovation teams also need to build their BDAC to enable them to harness the potential of their big data resources.
For U.S. service innovation teams, devoting resources to BDAC is preferable to additional investment in big data. The stronger the BADC is, the greater effect big data can have in improving sales growth and gross margin. Using the variables in our data, U.S. innovation teams should do the following to achieve a high level of BDAC:
- (1)
Use more advanced tools (analytics and algorithms) to extract values from big data;
- (2)
Develop the capability to discover relationships and dependencies from big data;
- (3)
Develop the capability to perform predictions of outcomes and behaviors from big data;
- (4)
Develop the capability to discover new correlations from big data to spot market demand trends and predict user behavior; and
- (5)
Employ and cultivate big data analytics staff who have the right skills to accomplish their jobs successfully.
Managers of Chinese service innovation projects should be aware that developing BDAC might have its downsides. When investment in big data is low, promoting BDAC can increase sales growth and gross margin. However, after a certain point, allocating further resources to BDAC may inhibit sustainability of innovation and organizational development. Chinese managers may also use the suggested tactics to increase big data analytics capability.
Our findings thus provided insights to U.S. and Chinese innovation teams on the subtle ways in which big data could lead to superior performance and might help them to maximize their use of big data.


