1. Introductions
In the past 100 years, the average surface temperature of the earth has risen by 0.4–0.8 °C. Many scientists believe that this is unique compared to any previous increase in surface temperature in the past, i.e., this rise is not a natural phenomenon. The extensive usage of fossil fuels by humans has led to massive emissions of greenhouse gases such as carbon dioxide, which have intensified the greenhouse effect and increased the earth’s surface temperature. Furthermore, the rate of change is increasing. The Intergovernmental Panel on Climate Change forecasted that the average temperature will rise by a further 1.4–5.8 °C by 2100 [
1]. Increases in surface temperature are causing polar icecaps to melt, sea levels to rise, severe weather events to occur, and so on. Such hazards are interfering with and damaging the natural ecosystem and threatening the survival of human beings. Sulfur dioxide, nitric oxide, solid particulates, and other substances emitted from the burning of fossil fuels have been polluting the atmosphere since the beginning of the industrial age. Past hazardous events caused by severe air pollution, such as photochemical smog in Los Angeles [
2], the London Smog Disaster of 1952 [
3], and Japan’s Yokkaichi asthma event of 1961, could occur again in the future. Balancing between the demands of economic development and environmental protection is a challenge, not only for developing countries, but for the entire human race [
4]. Therefore, policy makers should understand the sustainable development concept and follow sustainable development goals [
5,
6].
Greenhouse gases and air pollutants have similar origins; they are primarily emitted from the burning of fossil fuels. By synchronizing the creation and execution of climate policy and air pollution management, the cost of reducing emissions may significantly decrease, and some side benefits may occur simultaneously (e.g., improvements of public health) [
7]; the benefits of addressing multiple problems with similar origins in policy making and execution are called “co-benefits”, and are the primary focus of this study.
In the research onco-benefits, Western countries hold the lead, in both the number of quantification studies and in the diversity of study subjects. Quantification studies have covered topics such as modeling predictions and monetization. The study subjects vary between global, national, and regional schemes. Wagner etal. evaluated the cost and potential of greenhouse gas emissions for the years 2020 and 2030 for the countries listed in Annex I of the United Nations Framework Convention on Climate Change [
8]. A greenhouse gas–air pollution interactions and synergies model (GAINS) was applied using a scenario analysis method from the study. It was determined that it is possible to reduce greenhouse gas emissions at a relatively low cost. The study also found differences in cost for different countries and departments. Chen etal. developed four scenarios to estimate the energy demands and carbon emissionsfrom2020 to 2050 in China; the authors argued that itis vital for sustainable development to keep global warming to well below 2 °C [
9]. The health co-benefits associated with the reduction in different pollutants were also estimated; the results show that industry and the electricity conversion and transportation sectors will reap the greatest health co-benefits in China, as NOx reduction plays a dominant role in maintaining a good standard of air quality. Jiang et al. focused on the two main categories of biomass pellet production, showing that strew pellet production not only contributes to regional sustainable development and localized energy transition, but also that it helps to mitigate global greenhouse gas emissions [
10]. The amount of research on co-benefits in China has been increasing since 2000. However, most studies have focused on a single micro aspect, i.e., one specific engineering technology for reducing emissions. For example, Alimujiang et al. analyzed the synergy and co-benefits of reducing CO
2 and air pollutant emissions by using electric and plug-in hybrid electric private cars, taxis, and buses in Shanghai [
11].Mao et al. evaluated the cost-effectiveness and sensitivity of the technology and structural emission reductions in the electricity industry [
12]. They found that it would be possible to achieve reductions in sulfur dioxide, nitric oxide, and carbon dioxide emissions by implementing energy conservation-prioritizing, technological emission reduction measures, front-end and production process control measures, and new power-generating technology structural reduction measures. Ma and Chen selected 22 energy-saving and emission-reduction measures to evaluate mission reduction potential, cost reduction and co-benefits, in order to shed light on the best means to mitigateCO
2emissions by the iron and steel industry in China [
13]. Sun et al. applied a new analytical method to study the environmentally sustainable development in Guangxi and its economic zone, i.e., the co-benefit approach combined with the Environmental Kuznets Curve [
14]. Their research showed that further measures to control the amount of energy consumption and adjust energy consumption structures are needed. Currently, researchers in China still have not progressed past using the quantity of emission reductions as the evaluation criterion. This has resulted in descriptions of the co-benefits of single techniques within single sectors in most research studies.
Cities are the engines and foundations of national economic development in China. Many cities in China have concentrated on industries, high resource consumption, and a high population density [
15]. Coal, which is the most consumed resource in China, is crucial to urbanization and industrial development, and it also causes very high carbon emissions and pollutants. Cities are the main sites where greenhouse gases and air pollutant gather [
16]. Furthermore, megacities (cities with residential populations higher than 10 million) emit more carbon and air pollutants than smaller ones. In the current research progress worldwide, although the importance of co-reductions in air pollutants and greenhouse gases has been recognized, the related studies have generally only focused on one specific industry or field, instead of comprehensive areas.
This research study attempted to formulate a co-benefits index (CBI) system for evaluating a degree of co-benefit implementation and for further establishing suggestions for the co-management of greenhouse gases emission and air pollution from the perspective of a megacity. Shanghai, as the most representative and the most urbanized megacity in China, was selected as the object of study.
2. Methodology
The CBI system established for megacities is fundamentally a comprehensive assessment system, in contrast to previous (individual) studies. This approach was chosen for its ability to describe the co-benefit effects of cities from multiple aspects, and to formulate a comprehensive and summarized evaluation. Therefore, the critical indexes were selected based on the driver-pressure-state-impact-response (DPSIR) research context, to calculate the weight of each index and obtaining the comprehensive evaluation index.
2.1. Driver-Pressure-State-Impact-Response (DPSIR) Research Framework
The DPSIR research framework was invented by the European Environment Agency. It can describe the relationships between environmental problems and human interferences well [
17]. In the DPSIR model, driver represents the demand induced by social and economic developments, such as economic activities. Pressure represents the environmental pressure induced by the developments, such as the excessive release of industrial exhausts and wastewater. State represents the phenomena regarding physical, biological, and chemical quantity and quality changes induced by the environmental pressure, such as the conditions of cities under such pressure. Impact represents the effect of the state on the resources, environment, society, economy, and human activities. Response represents the management by government, human groups, and individual persons to reduce, dampen, and/or adapt to the environmental changes. Currently, DPSIR research frameworks are mostly applied to evaluations of multiple types of ecosystems, the sustainable utilization of resources, environmental management abilities, agricultural sustainability, and soil and water conservation [
18,
19,
20]. DPSIR has become an effective tool for determining the relationships between environmental states and environmental problems [
21].
Figure 1 shows the framework of DPSIR.
Based on the DPSIR framework, a system of nine major levels of CBI for measuring the environmental sustainability of megacities was established, as follows. The drive (D) is induced by the economic development within a city, and its population growth; the pressure (P) is induced by the same factors. The states (S) of the air pollution level, greenhouse gas emission level, and industrial structure, etc. are induced by the intensity of energy consumption. The impacts (I) on the air, water quality, and other environmental indexes are also induced by the intensity of energy consumption. The reaction (R) is taken in response to such effects (e.g., by the government). The drive, pressure, and state are induced in the modified co-benefit after the reaction, formulating a two-way response mechanism. Specific indexes for each level were selected from multiple sustainable development index systems, city development indexes with low carbon emissions, and other ecological indexes.
2.2. Entropy Method
Weight is a relative concept, and indicates the relative importance of one index to the entire system in comprehensive evaluations. The determination of the weight of an index can be based on subjective and/or objective assignment. Subjective assignment relies more on the importance of each index to the evaluator assigning the weight, and thus results in differences in weight among different evaluators. Examples of the most common subjective assignment methods are the expertise evaluation method and the analytic hierarchy method. Objective assignment relies on a statistical analysis of data to calculate the weight of each index and includes methods such as factor analysis, entropy, and multiple correlation coefficients [
22]. Thus, the objective assignment method was selected for determining the weight for each index in this research study.
Based on the DPSIR framework, the CBI systems for megacities were divided into a framework level, element level, and index level. Details can be found in
Table 1. Therefore, the calculation of co-benefit effect indexes was subdivided into two steps: the weight calculation of each index in the index level using the entropy method and a comprehensive index calculation of the CBIs, using a weighted average method.
The entropy method effectively avoided the overlapping in the accessed information of each index, and the subjectivity in the weight determination. The effective value of each index can be determined relatively objectively and accurately. The entropy method does not have any limitations on the distribution of data, and therefore fits multi-index systems [
23]. Currently, it is widely applied for comprehensive analysis in many economic and social systems, such as in assessments of city sustainability [
24,
25], intensive land-use [
26,
27,
28], and urbanization progress [
29,
30,
31]. The fundamental concept of the entropy method concerns determining an objective weight for each index based on its variability. Assuming that there are n indexes and that the time span of the research is m years, a matrix
can be formulated from all data [
32]. For a given index
, the higher the variability of each index value
, the more information it assesses, and the smaller the respective information entropy
.If the variability of
for a given index
is small, it indicates that less information is assessed by the index, its importance in the comprehensive assessment system is less, and its information entropy is larger. Thus, the weight of the index is smaller.
As the calculations for the entropy method involve theories such as logarithms and entropy, negative values cannot be directly used as inputs. For certain extreme values, relative changes were made. For example, transformations of the base unit, order of magnitude, and positive/negative orientations of each index were required, owing to the existence of discrepancies. Therefore, an extreme classification method was used for normalizing the raw data before the application of the entropy method [
33].
(1) Normalization of indexes
When index is positive (benefit indexes)
When index is negative (cost indexes)
where
is a normalized index value.
is the current value of an index.
is 1.05 times the maximum value of an index during the time span of the research.
is 1.05 times the minimum value of an index during the time span of the research.
(2) Weight determination
Converting normalized index values
to weight
Calculating the entropy
of index
Calculating the effectiveness value
of index
Calculating the weight
of index
2.3. Comprehensive Index Calculation
By referring to previous sustainability studies including city sustainability evaluations [
34,
35,
36], evaluations of low-carbon emission city developments [
37,
38,
39], and evaluations of ecofriendly city developments [
40,
41], and after weighting each parameter, the comprehensive index can be calculated through the weighted average method, as follows:
In the above, CBI is the co-benefits index. is the weight of ith index. is the value of the ith index in the jth year.
A description of co-benefits indicator system and a special introduction of the index level are provided in
Table 1 and
Table 2, respectively.
2.4. Case Study
This research aimed to establish a CBI system for ecological development for megacities in China, and selected Shanghai as a typical case. The term megacity refers to cities with residential populations higher than 10 million. Shanghai has become ideal in this regard, owing to its relatively better progress in urbanization, and its complex economic, social, and ecological development problems. It not only faces transformation problems in regard to energy and industry structures, but is also under pressure from population growth, pollution, and other cumulative issues arising from long-term development. By selecting Shanghai as a representative case study and using the co-benefits index system, the current measures and policies can be evaluated, and the results of the study can provide references and recommendations for promoting environmentally sustainable development in Shanghai. More importantly, the results of this study can also be disseminated and replicated to other megacities in both China and other developing countries for long-term sustainable development.
2.5. Data Collecting and Processing
After the indexes were determined, the research data for Shanghai for the 14 year research time span (2005–2018) were collected from the following sources: (1) the Shanghai Statistical Yearbook; (2) the Bulletin of Shanghai Environmental Situation; (3) the China Energy Statistics Yearbook; and (4) the thematic data sheets of the National Bureau of Statistics of China-Environmental Statistics [
42].
The carbon emission data were calculated using Kaya’s formula as follows [
43]:
where C is the carbon emission, E is the energy consumption per use, and P is the population. The emission coefficient is different for different energy source. The above formula can be transformed as follows [
44]:
In the above, Ei and Ci are the energy consumption and carbon emissions of different energy sources per use, respectively.
The above can be further simplified as:
where
is the carbon emission coefficient. This can be found in the 2006 Intergovernmental Panel on Climate Change (IPCC) National Guide of Green House Gas Emissions [
45], and its unit can be transformed as shown in
Table 3.
3. Results
3.1. Introduction of Shanghai
Shanghai as one of the four municipalities in China and as one of the first 14open Chinese ports, itis the center of economy, finance, trade, and shipping in China. Recently, revolutionary policies such as replacing business taxes with value added, tax free trading have been implemented in Shanghai. The implementation of free trading indicates that Shanghai is becoming a new test ground for upcoming reforms and “opening-up” acts, and will represent China in global competitions. Thus, in the new round of city comprehensive planning, Shanghai is set to become the most globally competitive and influential city with global resource allocation capabilities in 2040. This requires Shanghai to be developed as a center of global transportation and allocation, with critical influence over the price of global production factors, and critical attraction to global business and investments, Thus, Shanghai can eventually become a global pivot, similar to New York, London, and Tokyo. To become a global pivot, Shanghai must not only catch up to the highest pace of ecological development in the global scheme but must also be able to attract and retain excellent companies and individuals. To meet such requirements, the social state and ecological quality of the city itself are also crucial. In the 13th5-year Plan of Environmental Protection and Ecological Construction for Shanghai, ecofriendly development and environmental quality improvement were emphasized as priorities, targeting a globalized livable standard. Therefore, low carbon emissions and pollution control are also a critical part of the tactical plan for Shanghai to become a global pivot. Accordingly, whether a city is livable has become an indication of the city’s soft power in global competitions. Furthermore, Shanghai is a listed nexus in the Belt and Road Initiative, but the key functions of global transportation still need to be developed. It still faces the challenges in regard to global airline business rules regarding low carbon emissions adaption, transportation intensification, transportation system energy consumption, and carbon emissions optimization. Thus, selecting Shanghai as the case for research on the megacity CBI system is very practical.
3.2. Index Weight
Based on the 23 indexes included in the CBI system for megacities, and by collecting and processing data for Shanghai from 2005 to 2018, the weight of each index was determined using the entropy method. The results are given in
Table 4. In the drive level, the weight of the regional GDP (0.0649) which counts for the total is slightly lower than, but almost the same as, the regional GDP per person (0.068), which counts for the intensity. However, in the pressure level, the weight of the index that counts for the total, i.e., the energy consumption weight (0.0409), is higher than the weights of the indexes that count for the intensity, which are the weight of the energy consumption per 10k GDP (0.0388) and the weight of the energy consumption per person (0.0146). In the state level, the weight of the carbon emission index (0.0298) is lower than the weight of the carbon emission per 10k GDP, but is higher than the weight of carbon emissions per person (0.0259). This indicates that during the 15 years from 2005 to 2018, the regional GDP growth in Shanghai was approximately the same as the regional GDP growth per person. However, it also shows that carrying the benefits from regional GDP growth to individuals, which means improving the quality of life for individuals, is still a significant challenge. As for the energy consumption and carbon emissions, the gross change (mostly increasing) is higher than the change per person and per 10k GDP (mostly decreasing), indicating that China has been emphasizing lowering the intensity rather than controlling the total amount of emissions for a long time. This has resulted in fast growth in regard to the total emissions, while also achieving emission intensity reduction goals.
Overall, the weight of the tertiary industry production proportion in the GDP was the highest, with a value of 0.104. This is closely related to government promotional policies. Its GDP contribution is on a growing trend, and increased by 35.7%, from 51.51% in 2005 to 69.9% in 2018. The weight of the annual average temperature is the smallest, with a value of 0.0075. It was not emphasized, as global warming only becomes significant when the time span is much longer. In such a short time span (14 years), the change in the annual average temperature is relatively less significant. The information entropy was relatively high, whereas the weight was slow. However, it may become more significant in the future, as global warming becomes increasingly severe.
3.3. Co-Benefit Index
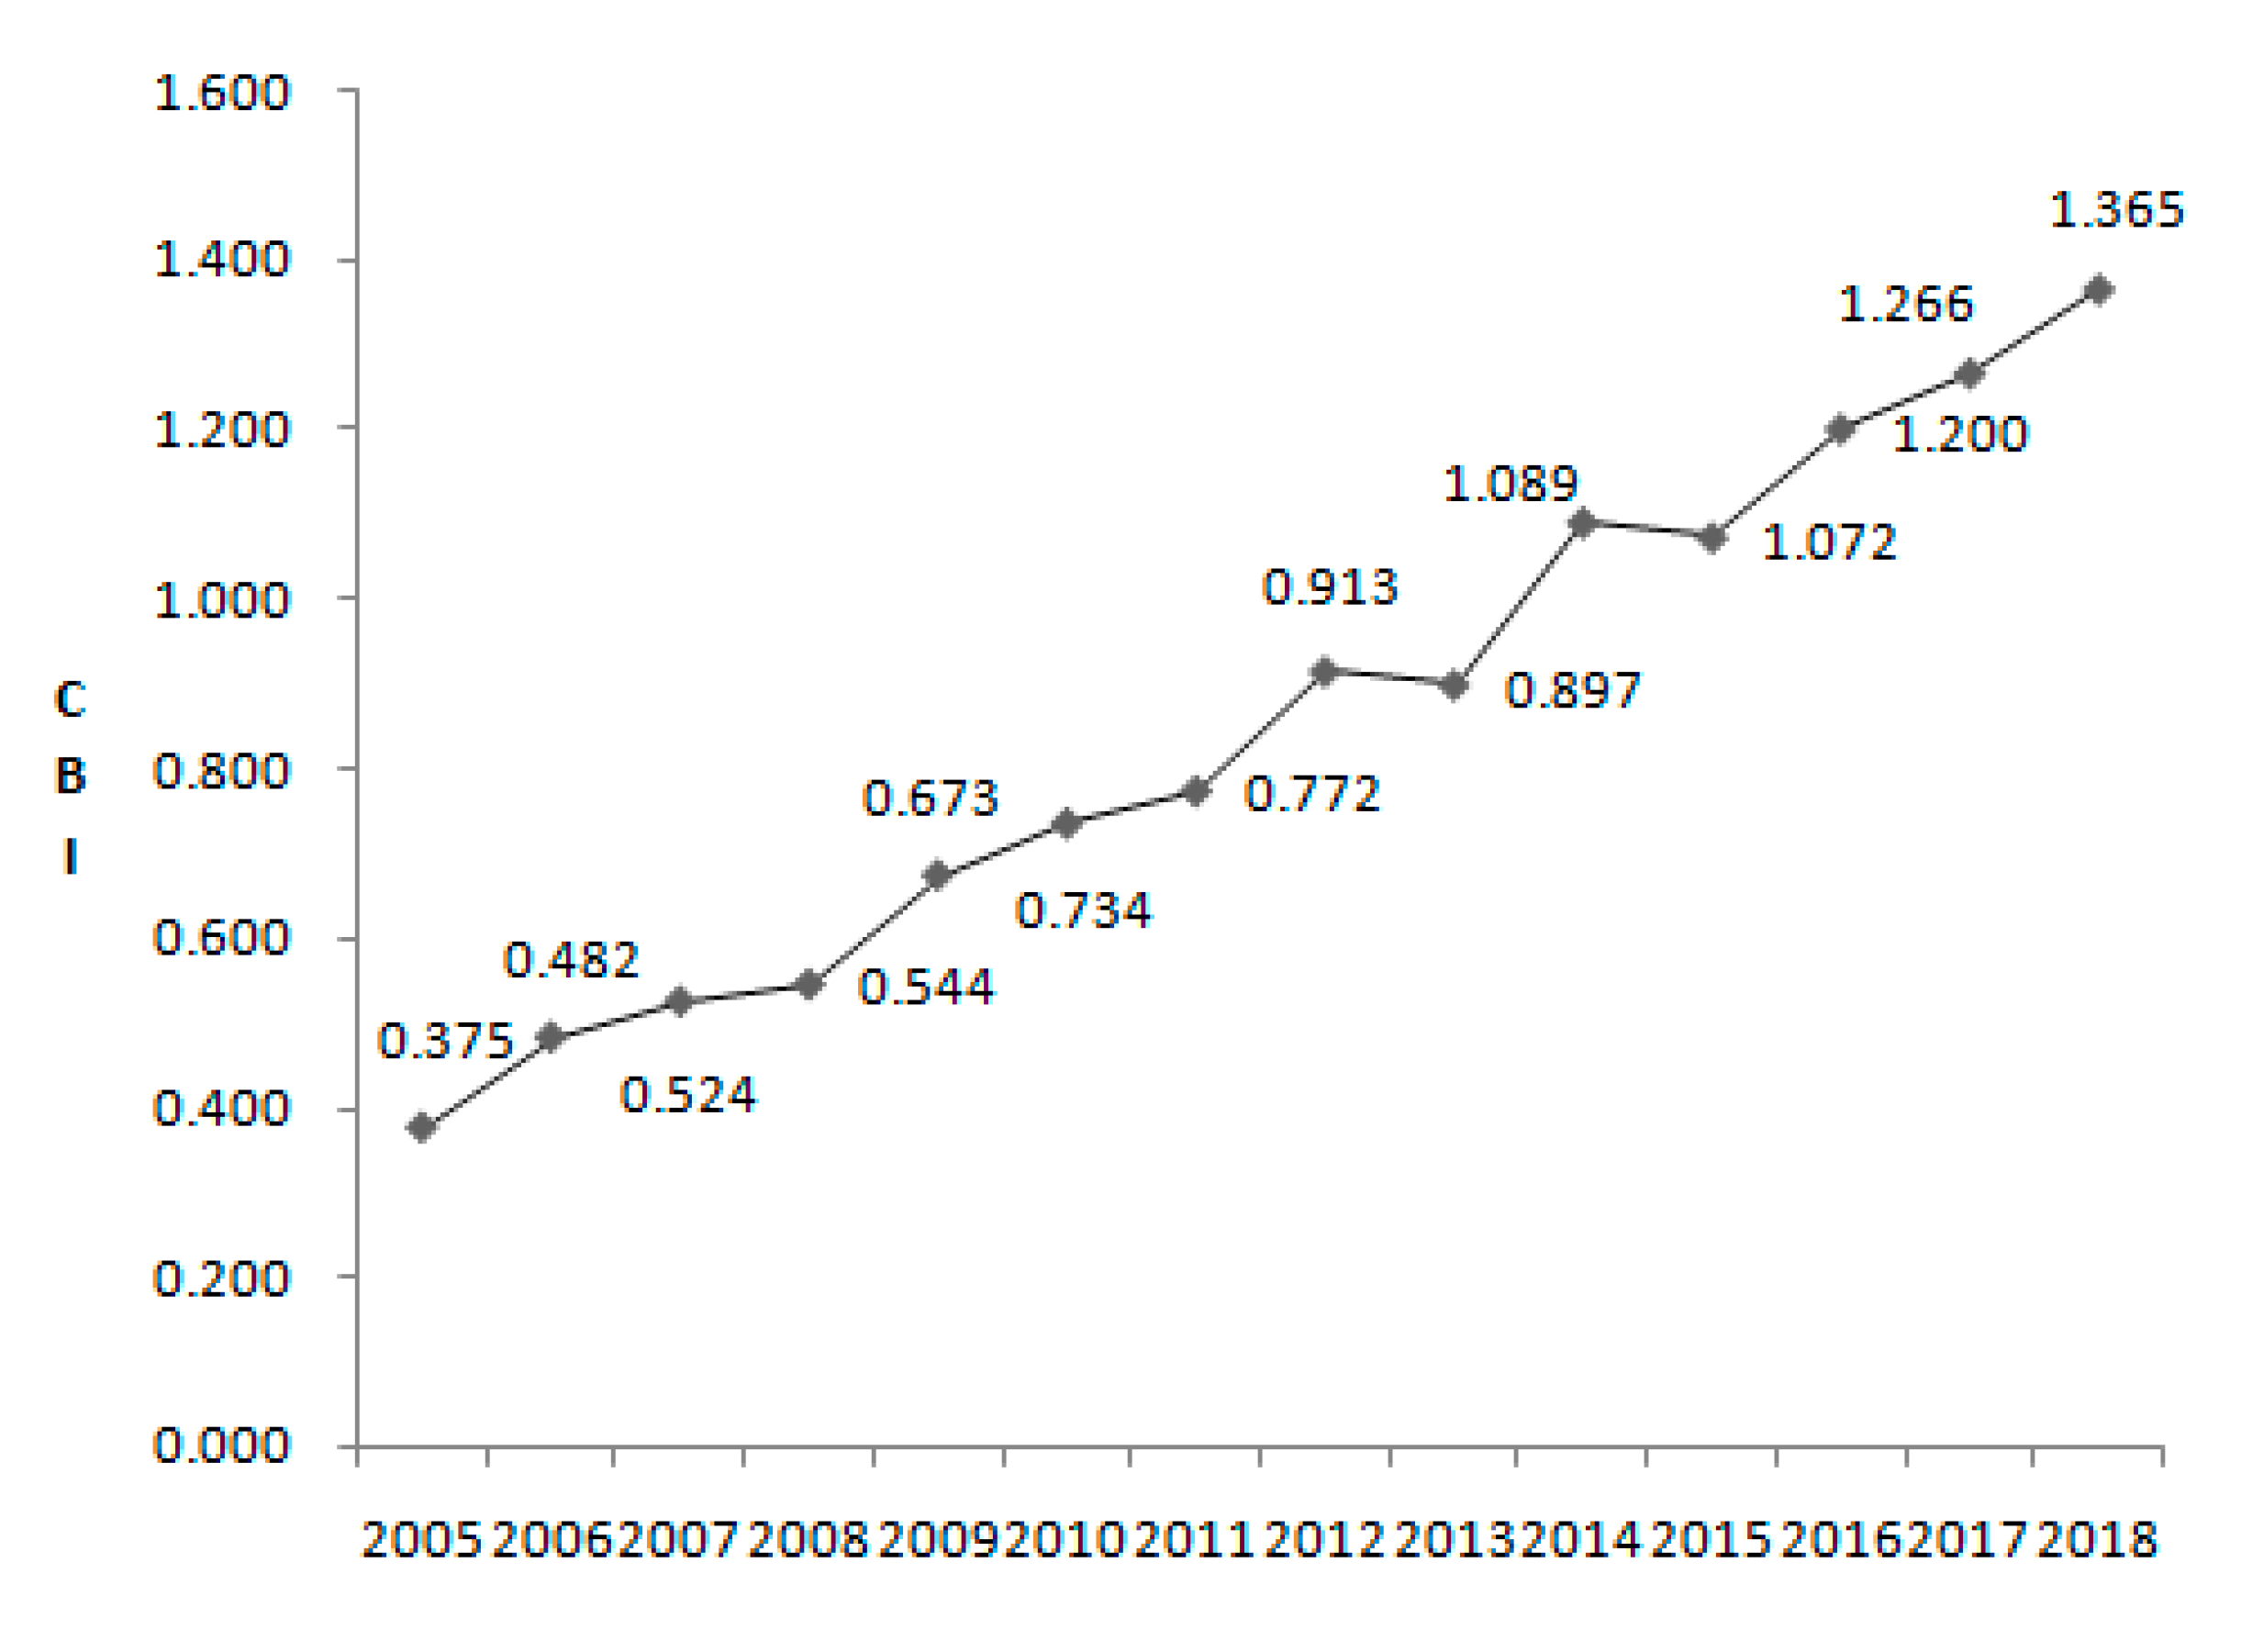
The CBI for each year during the 14 years of the research time span (2005 to 2018) was further calculated based on the weight calculations and is shown in
Table 5 and
Figure 2. The CBI was on a growing trend during the 14 years and increased from 0.375 in 2005 to 1.365 in 2018 (a 264% increase). This indicates that the efforts taken in Shanghai and their effects were positive overall. With the exception of 2012–2013 and 2014–2015, the CBI values grew in all other years, with an average growth rate of 18.86%.
The CBI values were on a decreasing trend in 2012–2013 and 2014–2015, with a high increase on the previous year (2011–2012 and 2013–2014). This is possibly because the government did not facilitate as many initiations as in the beginning years of the five-year plan. For many cities in China, the five-year plan is a long-term goal, and local governments tend to slow down the progression on the following year if the goal for the previous year was achieved or was overly complete, to thereby focus on goals in other fields. Thus, the CBI suffered a slight decrease in carbon emission reduction and air pollution controls in 2012–2013 and 2014–2015. Owing to limitations in obtaining data, this conclusion cannot be confirmed to repeatedly appear at the end of each five-year plan period. This research can be further developed by including data from the next five-year plan and adding analysis based thereon.
3.4. Evaluation
Based on the analysis of CBI values of energy consumption and carbon emission at the pressure and state levels in the co-benefit system for ecological development in Shanghai, and knowing that the measures in controlling total emissions were less effective than controlling per 10k GDP emissions during the research time span, several suggestions can be formulated. A requirement for total emissions should be included and emphasized in policy marketing. In fact, this suggestion has already been addressed and employed in the newest policy. The total energy consumption was listed as a control index in the Shanghai energy conservation and climate change act of the 12thFive-Year Plan [
46], but no specific target was provided. It was later specified in the Shanghai 2018 conservation Plan in the context of emissions reduction and key work planning for the climate change act [
47]. The total energy consumption, carbon emissions increase, and coal consumption were listed in detail as control targets, and were limited to 2.4 million, 5.15 million, and 4.4 million standard coal equivalents, respectively. Additionally, the specific year of the peak total carbon emissions was required to be clarified in the 13th Five-Year Plan.
The ranking of each index in the ecological development CBI system is listed in
Table 6. The index for the tertiary industry production proportion of the GDP held the highest weight, indicating that it is the most significant index for co-benefit development in Shanghai. Thus, the most effective way to boost the comprehensive CBI of Shanghai is to further promote industry structure transformations and upgrades, more specifically for tertiary industries, e.g., service and high technology industries. Additionally, the low energy costs of tertiary industries can reduce fossil fuel consumption and increase CBI from the root.
In the pollution management field, the indexes for investment in eco-protection was the most heavily weighted index, and had major impacts on the final CBI of the city. As shown in
Figure 3, the change trends for both the investment in the eco-protection index and CBI from 2006 to 2018 were identical, confirming that the annual investment in eco-protection had a significant impact on the CBI of Shanghai. Further enhancement of the investment can be suggested. Roughly, it can be estimated that the investment in eco-protection will be further increased by 440 billion Yuan or 37.5% in the period of the 13th Five-Year Plan, as compared to the 12th Five-Year Plan. The CBI of Shanghai will be further boosted once the 13th Five-Year Plan is implemented.
Measures aiming at managing acid rain could be beneficial to the CBI of Shanghai. In 2014, the acid rain frequency was as high as 72.4%, i.e., significantly more frequent than in 2005 (40%). In 2018, the frequency dramatically dropped to 53.8% but remained higher than in the first year. The formulation of acid rain is caused by multiple factors, such as massive emissions of SO
2 and NO
2, regional transport, and climate effects [
48]. As Shanghai is within one of the three top acid rain regions, and in consideration of the importance of regional transport in the acid rain formulation, measures that lower the emissions of SO
2 and NO
2 are suggested. Regional coordinated acid rain pollution reduction measures are also suggested.


