1. Introduction
The Paris Agreement, which came into effect in 2015, requires countries to report on the long-term strategy for low-carbon development in 2050 [
1]. Based on this, China proposes to achieve CO
2 emissions peak around 2030. As far as China is concerned, the proportion of energy consumption in the industrial sector has always been above 70% [
2]. Therefore, all of the provinces are actively engaged in industrial CO
2 reduction to accomplish the target of CO
2 emissions peak of China. However, due to the different levels of economic development and industrial structure, the strategies of industrial CO
2 emissions reduction should vary among different provinces and regions in China.
In the process of China’s industrial development, northeast China, as the base of heavy industry, made a distinguished contribution to the country’s modernization before the 1970s. Today, however, the northeastern region’s economic growth gradually falls behind that of the eastern coastal regions, because resource-based industries has been declining since 1990. Thus, the northeast region faces a dilemma of promoting social and economic development with industrial transformation. So, the strategies and models of industrial CO2 reduction in these regions are obliged to be distinct from developed regions such as China’s eastern coastal provinces. Otherwise, inappropriate carbon reduction strategies and models will impact the economic development of northeast China. In order to realize the strategies of CO2 emission reduction in northeast China, this study explores the following two questions. What should be done to reduce industrial CO2 emissions in such areas? How do such areas achieve the CO2 emissions peak of industrial energy consumption? To solve these two questions, first, this research should analyze the influencing factors of industrial CO2 emissions and quantify their impact on the peak of CO2 emissions. Second, this research should propose paths to reduce CO2 emissions in such typical regions and study the CO2 emission reduction mechanism of industrial energy consumption.
Existing literature shows that CO
2 emission researches in the industrial field mainly focus on the analysis of influencing factors and the peak prediction of CO
2 emissions. For the first question, using Kaya identity, LMDI, STIRPAT and SDA model, numerous previous studies elucidate that the influencing factors of industrial CO
2 emissions including economic scale, industry structure, energy structure, energy intensity, population, urbanization and openness. Liu et al. [
3] indicated that the economic output, R&D intensity, investment intensity, and energy structure were the driving factors for the increase of carbon emissions in the whole period applying LMDI approach to decompose industrial energy-related carbon emissions into eight factors during 2001–2015 for Henan Province. Wu et al. [
4] divided the industrial carbon emission effected into five categories for 39 industrial sectors in Inner Mongolia from 2003 to 2012. The result reveals that the energy intensity effect was the crucial drivers of the decrease of carbon emissions while the industrial growth effect and population effect, critical driving forces, increase industrial sector carbon emissions. Lin et al. [
5] and Cui et al. [
6] suggested that industrial-scale was the leading force of carbon emission increase, while energy intensity had a negative impact on carbon emission, through Kaya identity and LMDI method in China’s major energy-intensive industries. Zhang et al. [
7], in Anhui, applying STIRPAT model to decompose industrial carbon emissions into five factors such as out-of-province investment, energy structure, per capita income, industrial structure and actual utilization of foreign capital during 2000–2015, proved that energy consumption structure was the main factor to increase carbon emissions. Liu et al. [
8] proposed an extended STIRPAT model to investigate the six factors driving industrial carbon emissions in China. The results suggested that the direct effects of energy intensity and energy structure were positive to increase industrial carbon emissions, and the direct effects of investment scale, industrial economy, energy price and openness are non-significant. Deng et al. [
9], using the SDA model to find the drivers behind the industrial energy-related carbon emission changes during the years 1997–2012 in Yunnan, illustrated that the sharp increase in exports of high-carbon products from metal processing and electricity sectors rose carbon emissions. According to existing research, influencing factors such as population, economic output, investment intensity, and energy structure are the drivers for the increase of CO
2 emissions, and only the positive effect of energy intensity on CO
2 emissions reduction is almost unanimously recognized. However, previous studies have not addressed how the factors drive the peak volume and peak times of CO
2 emissions.
For the second question, the studies could be classified into two fields, namely, predicting CO
2 emission peak, and analyzing the scenarios of peak. In the field of predicting CO
2 emission peak, based on historical data, some scholars estimated the trend of industrial carbon emissions via different predicting methods to testify the existence of the emission peak within the planned target. For example, Yu et al. [
10] analyzed China’s emission trajectory with different methods and proposed a new economic-carbon emission-employment multi-objective optimization model. The results of the model indicated that China’s industrial energy-related carbon emissions would peak between 2022 and 2025. In the field of analyzing the scenarios of peak, some researchers simulated the CO
2 emission peak by setting various scenarios for future development on the premise that carbon emission peak exists. Zhang et al. [
11] introduced influencing factors into the decomposition model and combined dynamic Monte Carlo simulation with scenario analysis to identify whether and how the 2030 carbon emission-reduction targets would be realized from China’s industrial sector perspective. The results revealed that three scenarios in the research would realize the 2030 emission-peak target. Zhu et al. [
12] analyzed the driving factors of industrial energy-related CO
2 emissions of 17 cities in China’s Yangtze River Delta region from 2005 to 2014 using LMDI and predicted the carbon emission-reduction potential of these cities from 2015 to 2020. The results showed that there would be a carbon emissions peak in the moderate and aggressive scenarios. Based on the analysis of the CO
2 emissions caused by industrial energy consumption in Tianjin from 2005 to 2012, Ge et al. [
13] employed the STIRPAT model, logistic regression model, and grey model to predict the carbon emissions in the future respectively. According to existing research, diverse models were utilized to predict the industrial carbon emission peak, and various scenarios were analyzed to reveal the scenario situation of different peaks and the CO
2 emission reduction measures in this scenario. However, previous studies lack a further discussion on the pathway of transitions between scenarios.
Taking northeast China as the research area, some scholars have carried out relevant studies to analyze the influencing factors of CO
2 emissions in old industrial bases, CO
2 emissions peak prediction, and CO
2 emissions reduction countermeasures. Chen et al. [
14], showed that the increase of carbon emissions was primarily launched by growth in per-capita final demand in Heilongjiang during 2002–2012, adopting the SDA. Wen et al. [
15] found that economic growth, investment structure, investment dependence, and energy structure are the main factors to promote the growth of industrial energy Carbon emissions in Liaoning via the LMDI model. In addition, our research group took Jilin Province as an example to do some relevant researches. In 2016, based on the application of the LEAP system, we predicted that the peak time of carbon emissions would appear in 2045, 2040, 2035 and 2025 via setting four scenarios to predict energy-consumption carbon emissions [
16]. In 2019, we took advantage of the LEAP system to predict carbon emissions peak and analyze the reduction pathway in buildings during operation in Jilin Province [
17]. The above research is the foundation of this paper.
Overall, what should be done to achieve the CO
2 emissions peak of industrial energy consumption by reducing the CO
2 emissions in typical transformation regions such as northeast China? The question has not been well studied and solved in previous studies. In order to fill in the gap, this study empirically explored the main driving path and mechanism of CO
2 emissions peak in industrial energy consumption from the perspective of peak by associating taking Jilin Province as the target area from 1995 to 2015. Based on the results of the analysis, we provide practical and effective recommendations for reducing industrial CO
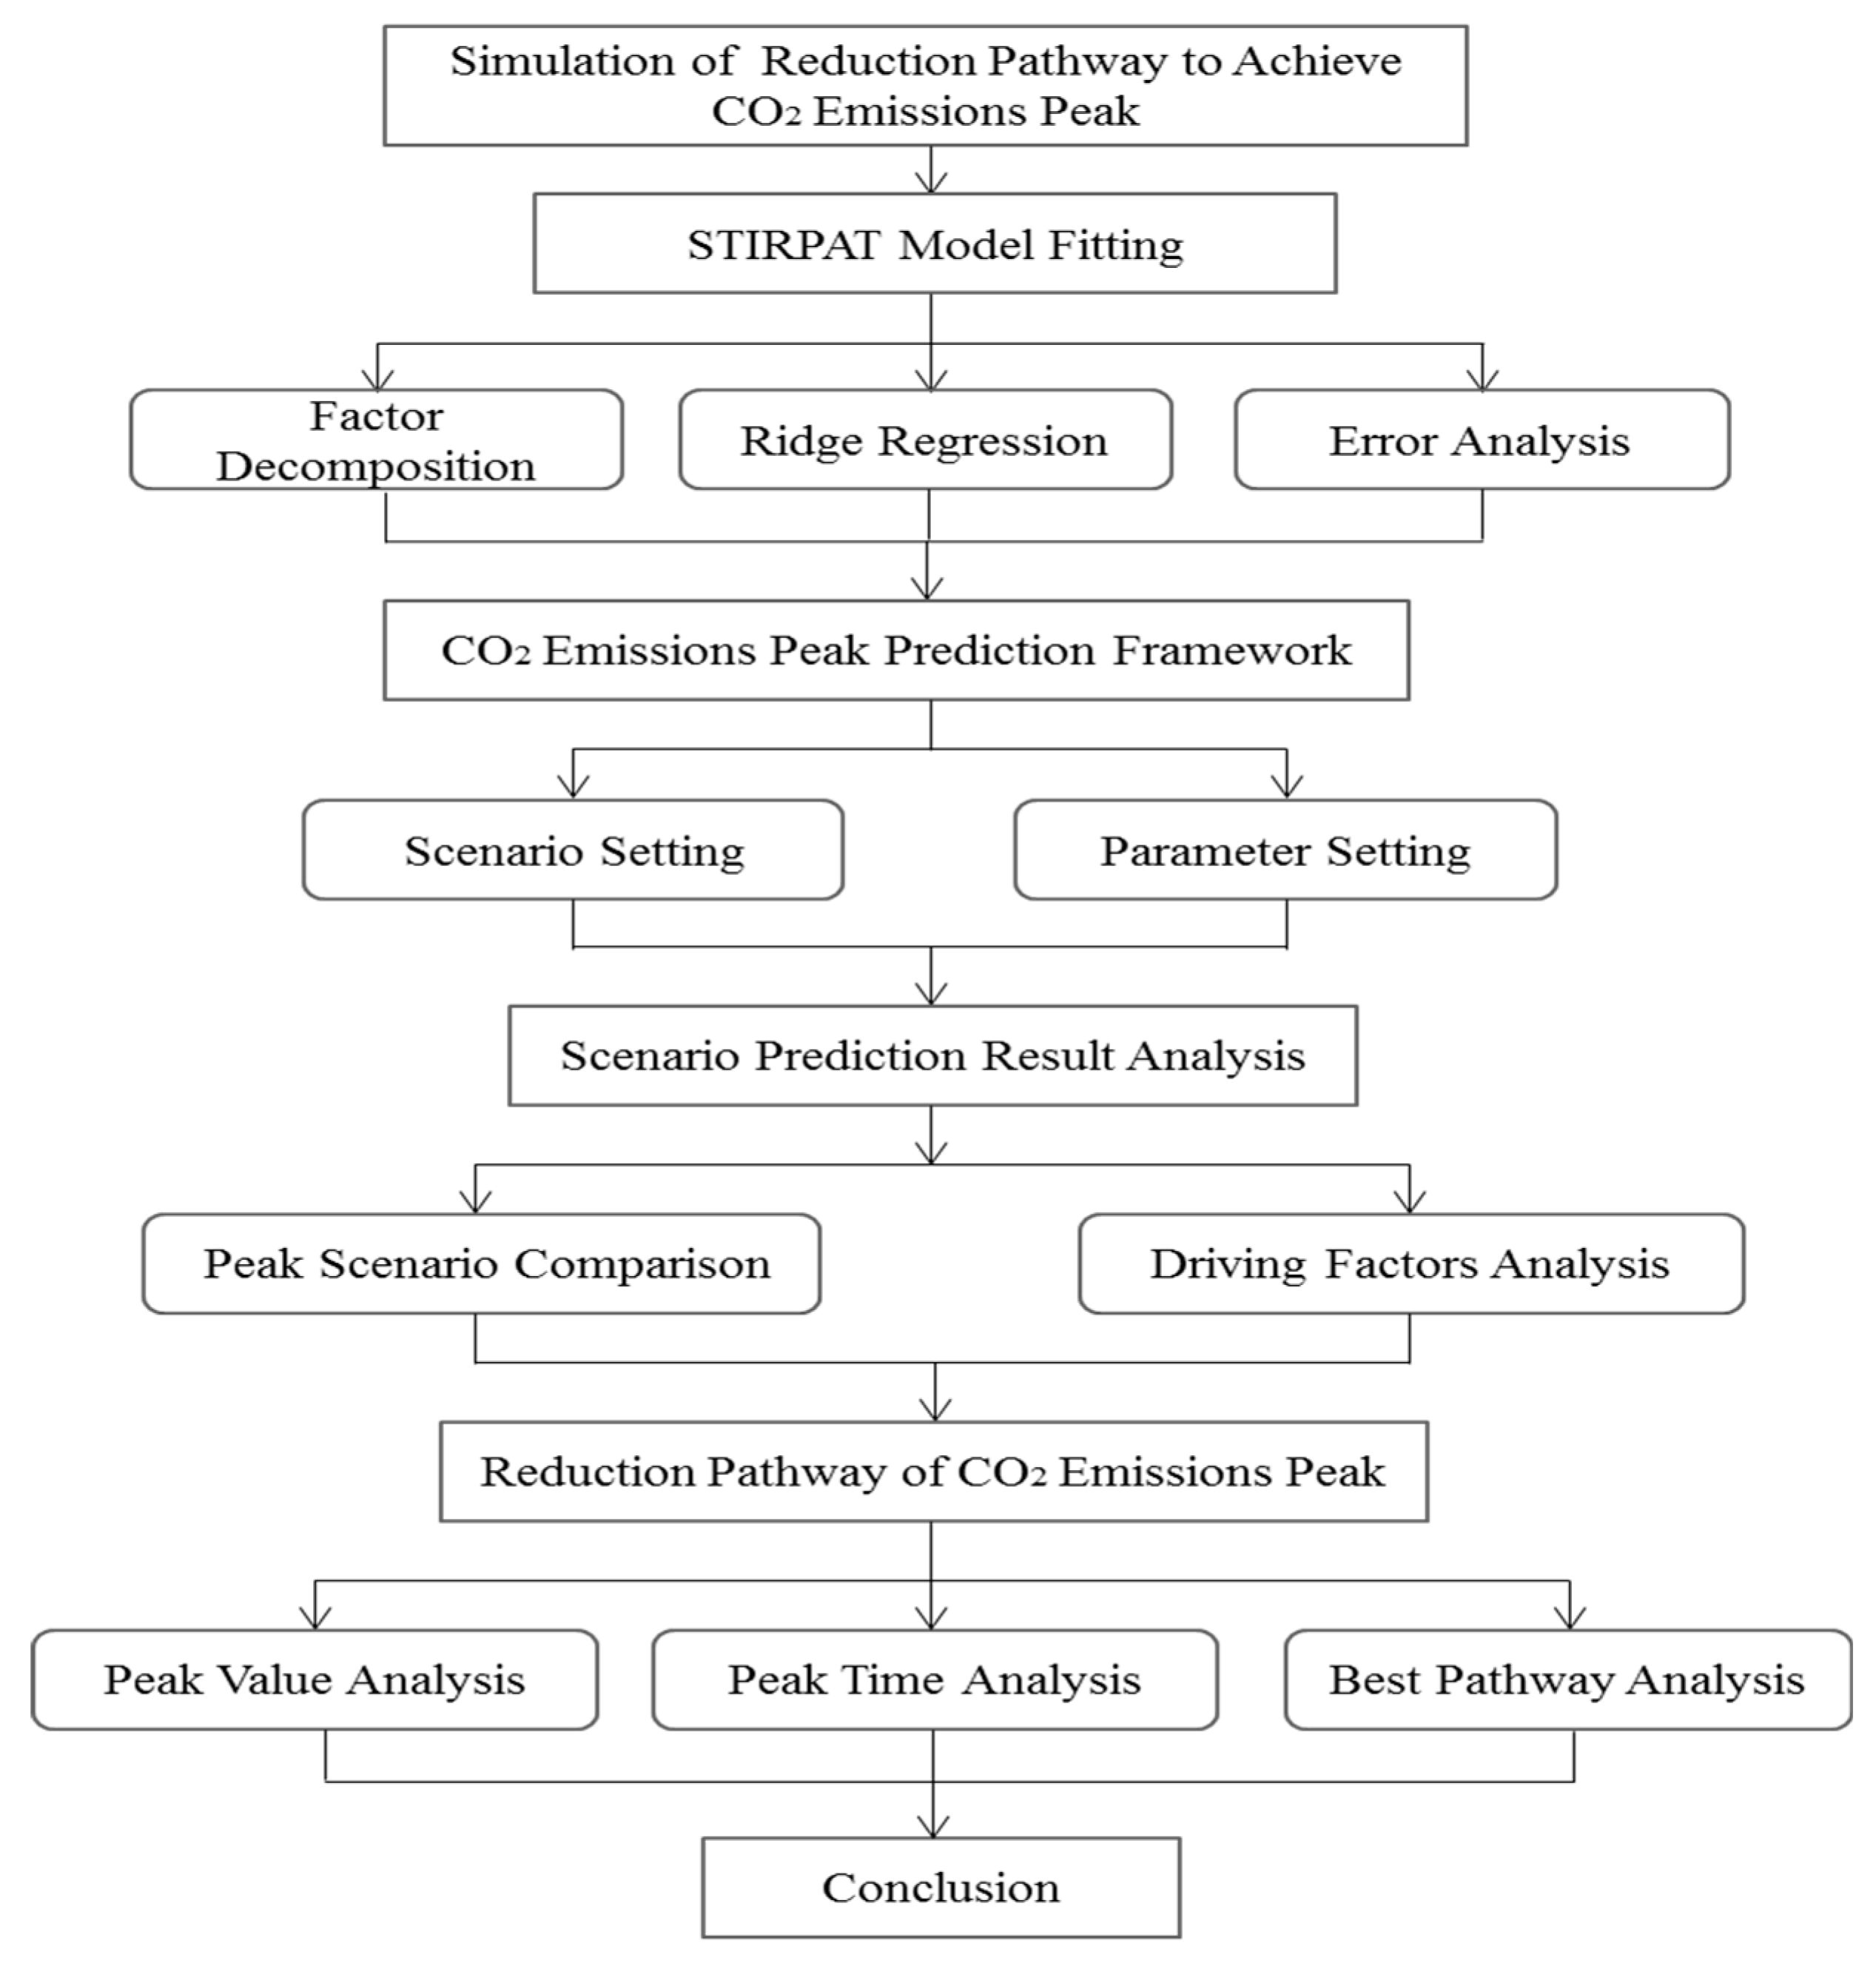
2 emissions. The remainder of the paper is organized as follows:
Section 2 describes the method and data.
Section 3 describes the scenarios and coefficient settings of variables. The results and discussion of the empirical case study are provided in
Section 4. The conclusions are drawn in
Section 5.
4. Results and Discussion
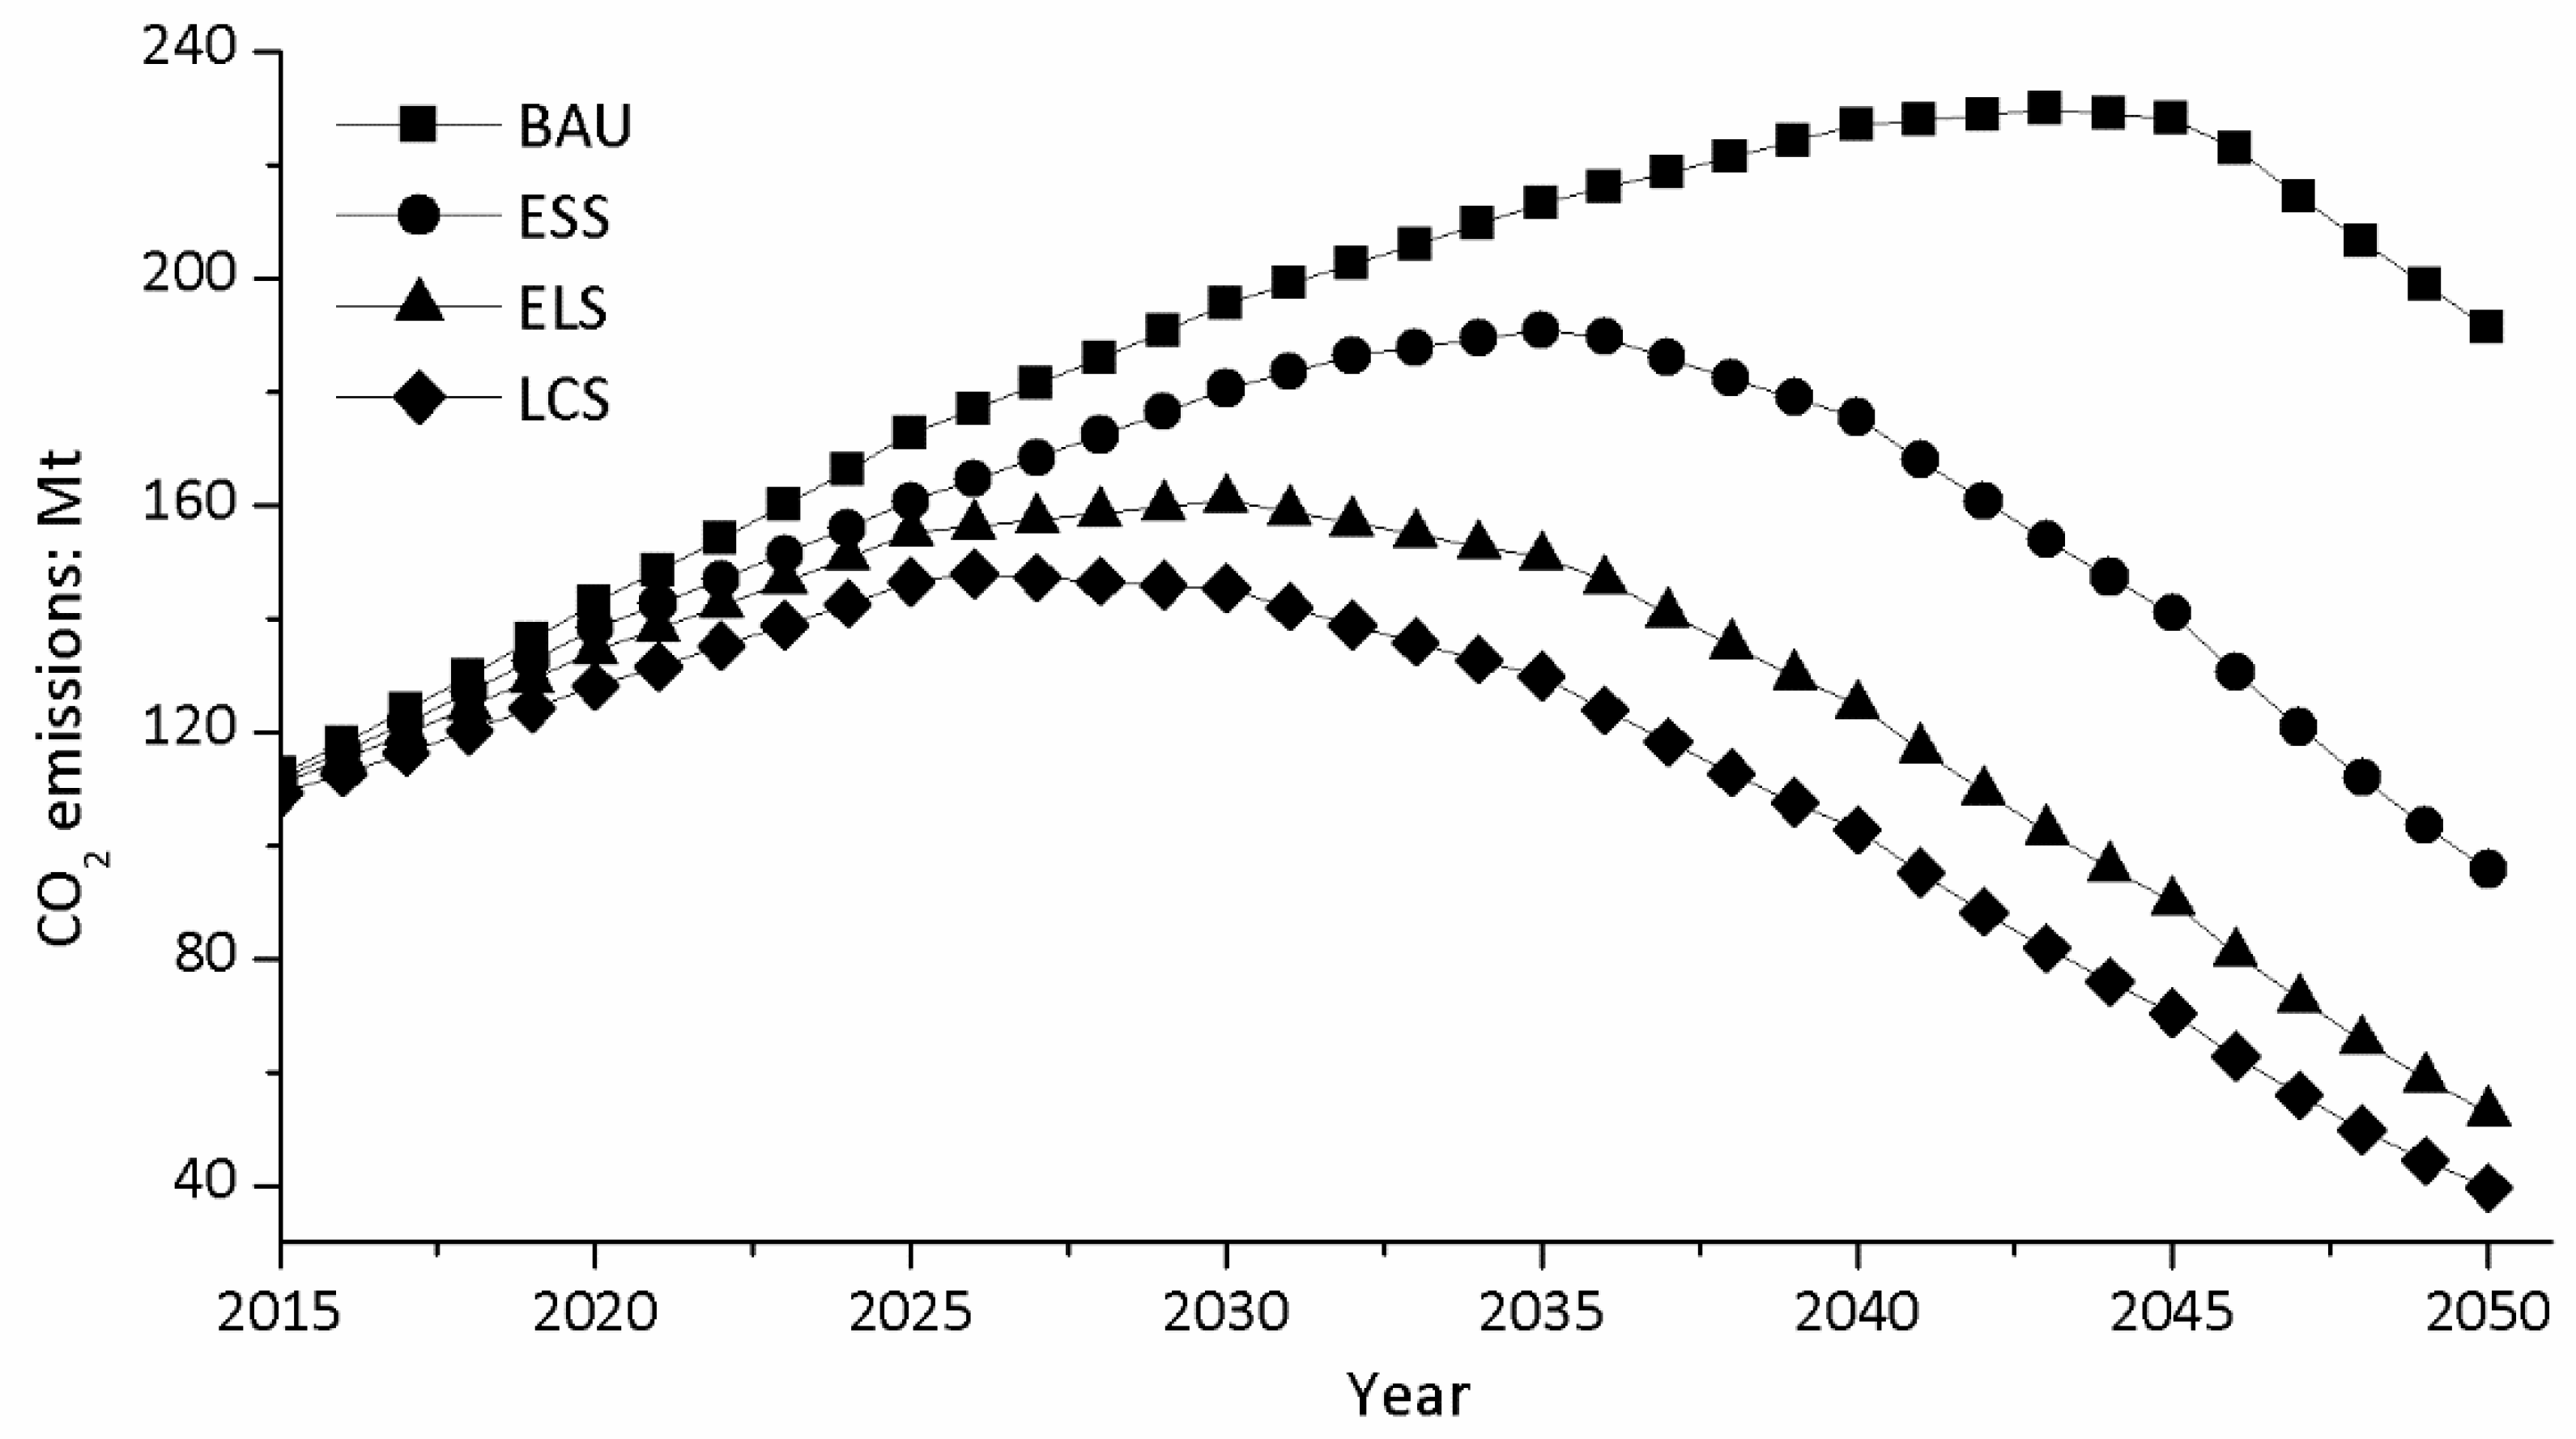
The results show that CO
2 emissions from industrial energy consumption in Jilin Province increase first and then decrease in different scenarios, which is basically consistent with most research results. The peak value ranges from 147.87 Mt to 229.73 Mt, and the peak time ranges from 2026 to 2043. According to the tendency under the BAU, the peak time will occur in 2043 with a peak value of 229.73 Mt. Compared with studies in other regions, the peak time of this scenario appears significantly later [
10,
11,
12]. Due to factors such as advanced low-carbon technology, LCS will peak earlier than any other scenarios, at 147.87 Mt in 2026. ESS and ELS will peak in 2035 and 2030 with the peak value of 190.89 Mt and 160.94 Mt respectively, as shown in
Figure 5. CO
2 emissions from industrial energy consumption exhibit a trend of slow growth before reaching the peak due to technological progress and energy-saving and emission-reduction policy. After the peak, carbon emissions show a rapid decline due to the innovation of industrial technology and the strengthening of relevant policies.
The peak value of BAU is 229.73 Mt in 2043, which is 38.84 Mt, 68.79 Mt, and 81.86 Mt higher than ESS, ELS and LCS respectively, and the peak time of BAU also lags behind ESS, ELS, and LCS by 17 years, 13 years and 8 years severally. In addition, in the view of the total CO2 emissions from 2015 to 2050, the cumulative carbon emissions from BAU, ESS, ELS and LCS are 6.81 billion tons, 5.55 billion tons, 4.56 billion tons and 4.05 billion tons respectively. Among them, the carbon emission of BAU is 1.7 times that of LCS, indicating that the later the peak time comes, the greater the cumulative CO2 emission of industrial energy consumption will be. According to the model fitting result, if Jilin Province further optimizes the energy structure, industrial structure and energy efficiency in the industrial field, the peak time will come early and the peak value will be reduced significantly.
4.1. Analysis of the Optimal Scenario
Different scenarios characterize the diverse development trend of Jilin Province in areas of economy and technology. The judgment and selection of the optimal scenario is carried out based on reference to the corresponding indicators of the peak from CO
2 emissions of industrial energy consumption in developed countries and regions. Taking industrial energy intensity as an example, the energy intensity of BAU, ESS, ELS and LCS at the peak are 0.20 tec/10
4 Yuan, 0.18 tec/10
4 Yuan, 0.15 tec/10
4 Yuan and 0.14 tec/10
4 Yuan respectively. Statistics show that the average energy intensity level of EU reached the peak is 0.16 tec/10
4 Yuan [
27], which is close to ELS. From the perspective of peak value, the industrial energy consumption CO
2 emissions peak value of BAU and ESS are approximately 1.6 times as much as the value in 2014, which is inconsistent with the requirement of the total national energy consumption control. The energy consumption and CO
2 emissions are both the least in LCS because of the improvement of industrial energy intensity, industrialization rate, the share of renewable energy and other aspects. However, its low-carbon technical requirements are so high that the technical level is difficult to achieve in a short period, otherwise, it may need to pay a higher social cost to meet the requirements of low-carbon development. In a stage of transition from ESS to LCS, the prediction results of ELS are basically in line with the general laws of industrial development, and the peak of CO
2 emissions in 2030 coincide exactly with the year in which China promise to the world.
4.2. Analysis of the Driving Factors of the Peak Value and Time
In this paper, we used the method of control variables which only change the single-factor rate in turn under the premise of remaining other factors rate unchanged to quantitatively analyze the influencing direction and degree of driving factors to the CO
2 emissions peak. The results are shown in
Table 5.
4.2.1. Industrial CO2 Emissions Efficiency
In the four scenarios, Jilin Province’s peak value of industrial energy consumption with a low rate of CO2 emissions efficiency is 30.93 Mt to 64.21 Mt, which is higher than the peak value with a high rate. That is to say, the industrial energy consumption CO2 emission efficiency is an effective CO2 reduction factor affecting the peak of CO2 emissions. The higher the CO2 emissions efficiency change rate of industrial energy consumption is, the earlier the peak appears. Taking ELS as an example, the peak time with a high rate of industrial energy consumption CO2 emissions efficiency is 2030, and the peak time with a low rate is 2040, 10 years in advance. The result is in line with the ridge regression equation fitted with a high elasticity coefficient of 1.38, which shows that the industrial energy consumption CO2 emissions efficiency has a significant effect on the peak time and value. The result shows that the industrial energy consumption CO2 emissions efficiency is a significant factor to push carbon reduction. The essential driving factors to change the CO2 emissions efficiency lies in the improvement of energy-efficient and exploitation of renewable energy.
4.2.2. Industrial Energy Intensity
During the period of 2001 to 2015, the average change rate of industrial energy intensity is −8% in Jilin Province, while the average change rate of industrial energy intensity is −9% during the period of 12th Five-Year Plan, which presents the trend of continuous decline. The higher the rate of decline in industrial energy intensity is, the smaller the peak value is. By changing the rate of industrial energy intensity, Jilin Province’s peak value of the industrial energy consumption CO2 emissions with a low rate is 3.38 Mt to 10.12 Mt, which is higher than the peak value with a high rate in the four scenarios. The comparative analysis shows that the industrial energy intensity at the present stage is a factor of CO2 emission reduction, but the effect degree on peak value is significantly less than that of the CO2 emission coefficient of industrial energy consumption and the minimum value is only one-tenth of it. Compare to the CO2 emissions coefficient, the industrial energy intensity has no effect on the peak time and has a relatively small impact on the peak value.
4.2.3. Industrialization Rate
In the four scenarios, the peak with a high rate is 11.91 Mt to 43.65 Mt, which is higher than the peak value at a low rate. That is to say, the industrialization rate is an obvious carbon increase factor. The industrialization rate has a greater impact on peak time. However, in contrast to the effect of CO2 emission efficiency of industrial energy consumption, the higher the industrialization rate is, the later peak time is. Taking ELS as an example, the peak time with a high rate of industrialization rate is 2030, but the peak time with a low rate is 2026, a gap of 4 years. In addition, the coefficient of the standard ridge regression equation demonstrates that the industrialization rate has a higher degree of influence on the industrial energy consumption CO2 emissions in Jilin Province, which also reflects the industry is the main sector of energy consumption. With other factors remaining unchanged, the change rate based on the original industrialization rate is basically consistent with the elastic coefficient (0.83).
4.2.4. GDP
The results show that the peak value with a high rate of GDP is 7.00 Mt to 20.69 Mt, which is higher than the peak value at a low rate by changing the rate of GDP. GDP is a typical carbon increase factor. Besides, GDP has a significant impact on the peak. Taking ELS as an example, the peak value at the high rate of GDP is 13.28 Mt, which is higher than the peak value with a low rate, indicating that GDP is the carbon increase factor for industrial energy consumption in Jilin Province. Compared to the industrial energy intensity, GDP does not affect peak time in four scenarios no matter how much the rate changes.
4.2.5. Urbanization Rate
The peak value with a high rate of Urbanization rate is 4.22 Mt to 11.80 Mt, which is higher than the peak value with a low rate, demonstrating that the development stage of urbanization is accompanied by people from rural production and lifestyle to urbanization production and lifestyle. Energy consumption of infrastructure construction and demand for household electrical appliances directly or indirectly affect the CO2 emissions change of industrial energy consumption. By contrast, the impact of urbanization on CO2 emissions of industrial energy consumption is not as significant as the industrialization rate. In addition, the urbanization rate changed to three different rates and the peak time in four scenarios are all the same year, indicating that the urbanization rate has no effect on the peak time of industrial energy consumption carbon emissions.
4.2.6. The share of Renewable Energy
The results show that the share of renewable energy is the carbon reduction factor, but the effect is not significant. The peak value with a low rate is 1.27 Mt to 2.69 Mt, which is higher than the peak value with a high rate. The peak time of each scenario is the same year even if the ratio of renewable energy consumption is changed. Taking ELS as an example, the peak time of industrial energy consumption CO2 emissions in Jilin Province is 2030, no matter how the renewable energy ratio changed, the renewable energy ratio does not affect the peak time. As Jilin Province is still in the stage of rapid economic development, fossil energy consumption accounts for a large proportion of total energy consumption, and there is less consumption of renewable energy due to the constraints of cost and technology conditions.
4.3. Analysis of the Reduction Pathway of CO2 Emissions Peak Value and Time
4.3.1. Analysis of the Reduction Pathway of Peak Value
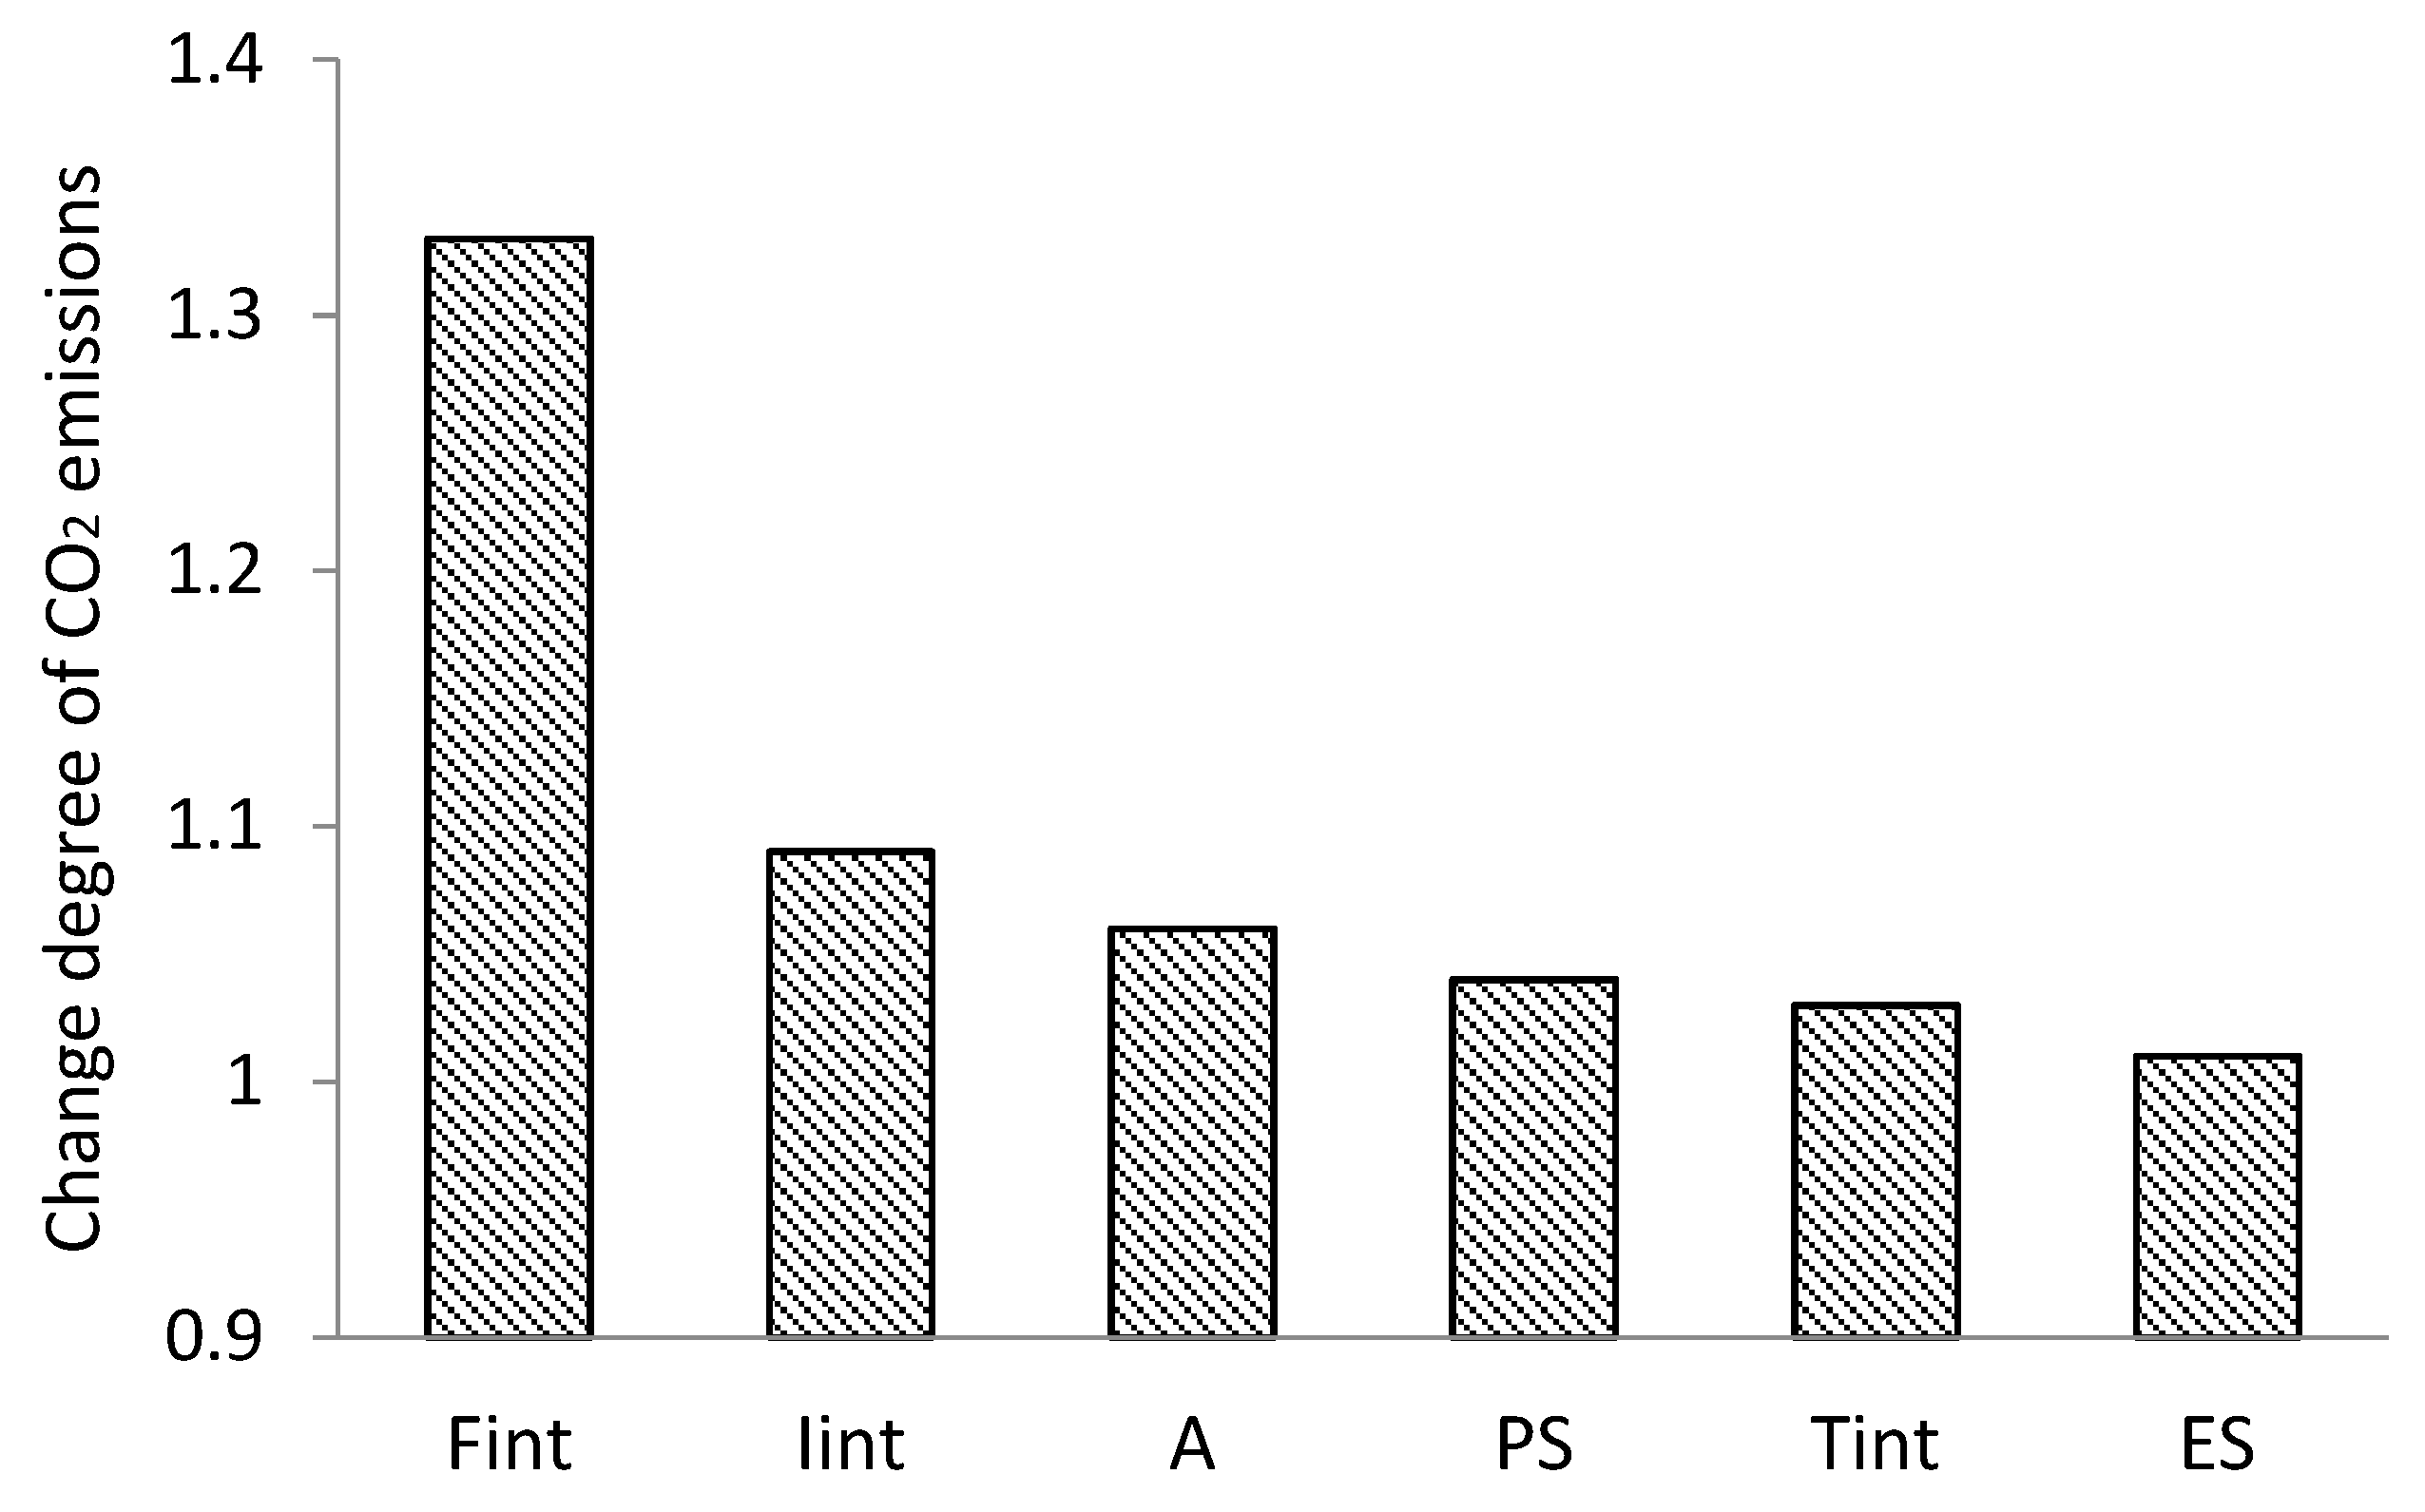
The six factors, including industrial energy consumption CO
2 emissions coefficient, GDP, industrialization rate, urbanization rate, industrial energy intensity and share of renewable energy, have diverse degrees of influence on industrial carbon emissions peak value. Taking ELS as an example, the influencing degree of six factors in ELS are: industrial energy consumption CO
2 emission efficiency (1.33) > industrialization rate (1.09) > GDP (1.06) > urbanization rate (1.04) > industrial energy intensity (1.03) > the share of renewable energy (1.01), as shown in
Figure 6, which is also consistent with the result in
Table 5. The CO
2 emissions coefficient of industrial energy consumption has the most significant influence on the peak value, displaying of the effectiveness of the industrial energy structure adjustment and clean-coal and low-carbon technology development on the peak value. Followed by the industrialization rate, it is an effective measure to control carbon emissions by steadily promoting the development of industrialization and industrial upgrade. In addition, the contribution of other factors to the peak value has little difference. This result is quite different from the results of previous studies such as Zhang et al. [
7] and Liu et al. [
8] which shows that economic growth and energy structure have a more significant effect, indicating that the transition region has special characteristics in the transition stage.
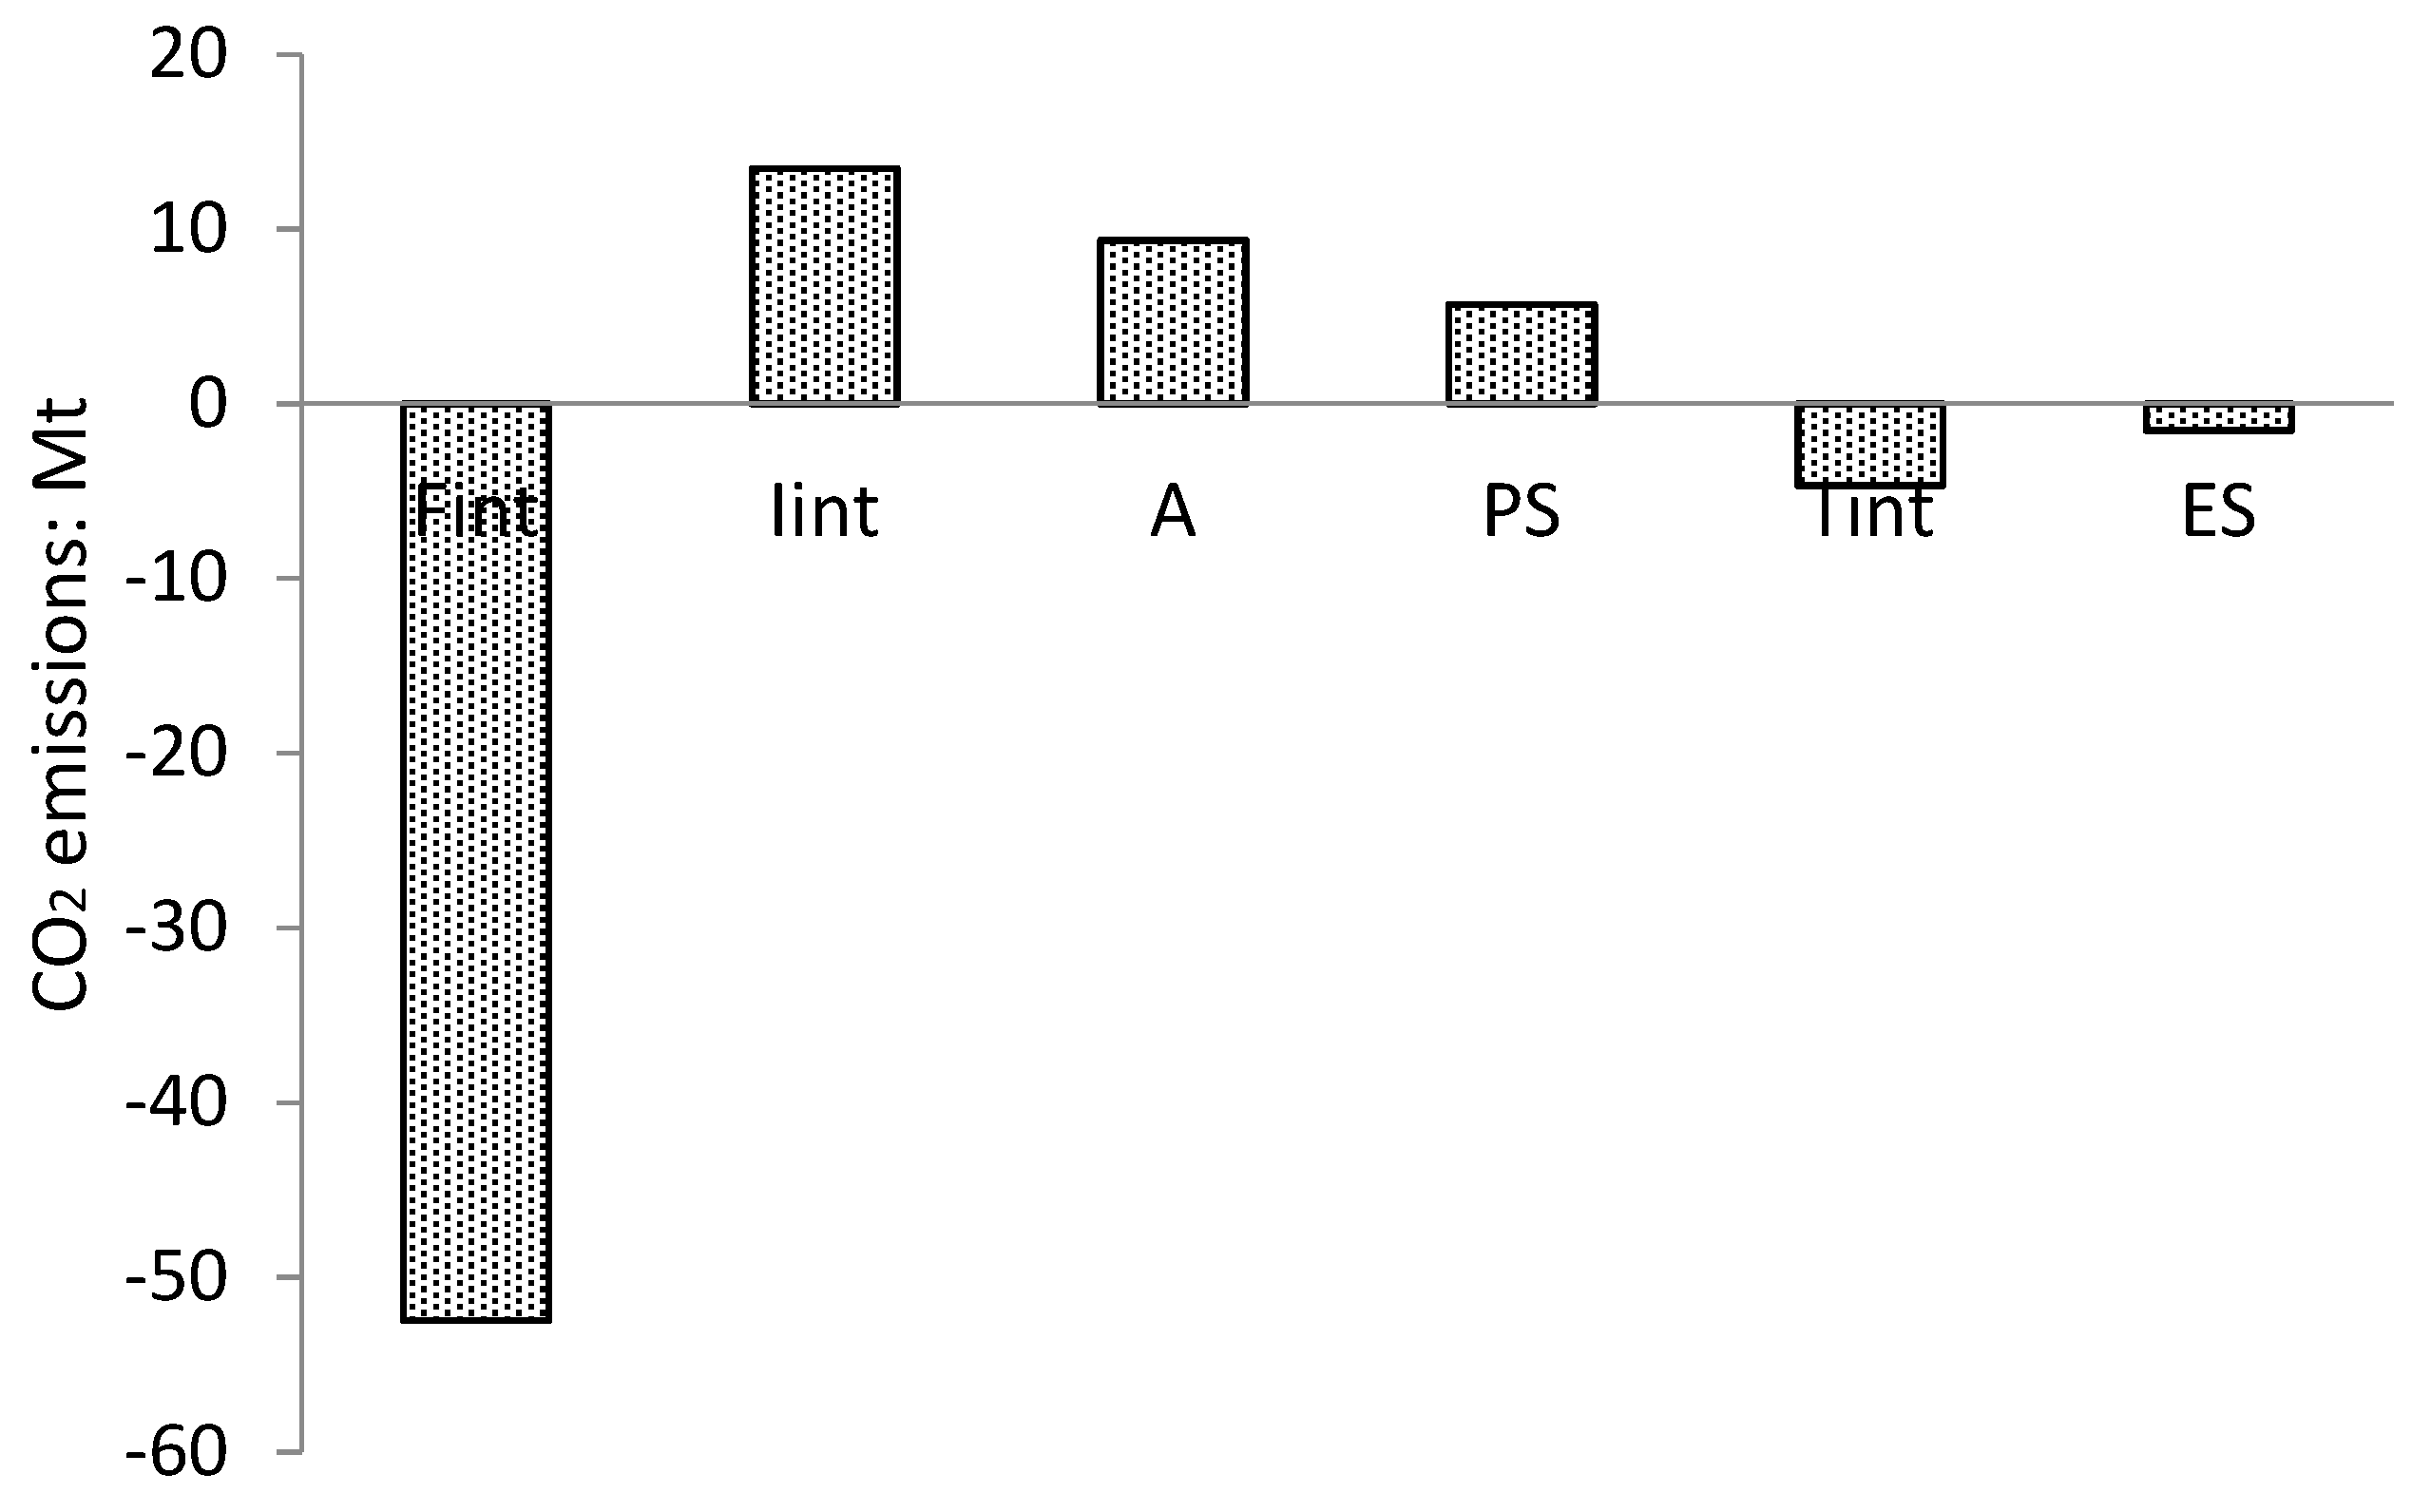
In ELS, the peak value of the influencing factors from low to high rate shows that the value decreases from 213.39 Mt to 160.93 Mt when the industrial energy consumption CO
2 emission efficiency fluctuates from low mode to high mode. The change in peak value is −52.46 Mt, which represents the drive of the negative. When the industrial energy intensity changes from low mode to high mode, the peak value decreases from 160.93 Mt to 156.25 Mt, and the change is −4.68 Mt. Similarly, when the share of renewable energy changes from low mode to high mode, the peak value decreases from 161.81 Mt to 160.27 Mt and the change value is −1.54 Mt. The influence degree of this factor is 2.93% of the industrial energy consumption CO
2 emissions efficiency. In addition to the above two factors, the other three factors are all positive driving factors. The peak change value of industrialization rate, GDP and urbanization rate from low mode to high mode are 13.46 Mt, 9.36 Mt and 5.69 Mt respectively and the influence degree of these factor are 25.68%, 17.85% and 10.85% of the industrial energy consumption CO
2 emissions efficiency. As shown in
Figure 7.
4.3.2. Analysis of the reduction pathway of Peak Time
Analysis of the influencing degree of industrial energy consumption CO
2 emissions from the perspective of the peak proves that the peak will occur when the carbon increase effect and the carbon reduction effect of the influencing factors in each scenario. When the rate of factors changes, the new balance will replace the previous balance, and the peak time also changes accordingly. Only two main factors do effect on the peak time including industrial energy consumption CO
2 emission efficiency and industrialization rate influencing the peak time, while the others do not affect the peak time. The higher the rate of industrial energy consumption CO
2 emission efficiency, the earlier the peak time appears. On the contrary, the higher the rate of industrialization rate, the later the peak time appears, which is similar to the study by Ge et al. [
13]. Taking ELS as an example, the peak time well ahead of 10 years when the industrial energy consumption CO
2 emission efficiency changes from low mode to high mode, while the peak time will delay four years when the industrialization rate changes from low mode to high mode. Therefore, it is an effective means to achieve the goal of earlier realization of industrial energy consumption CO
2 emissions peak by reducing industrial energy consumption CO
2 emission efficiency and the change rate of industrialization rate. In contrast, other factors only affected the peak value.
4.4. Analysis of the Reduction Mechanism of CO2 Emissions Peak Value and Time
Jilin Province responds to national targets and plans to reach its CO
2 emissions peak by 2030. However, since the level of socio-economic development in Jilin Province lags the average level in China, the CO
2 emissions peak time in Jilin Province may be delayed due to the lack of financial and technological support. In order to achieve the peak of overall CO
2 emissions in advance, it is particularly important to reach the industrial carbon emissions peak as soon as possible. Overall, ELS is the optimal scenario choice of development to Jilin Province compared to the other three scenarios, which is feasible for the future development of Jilin Province. Because it can achieve a better status of CO
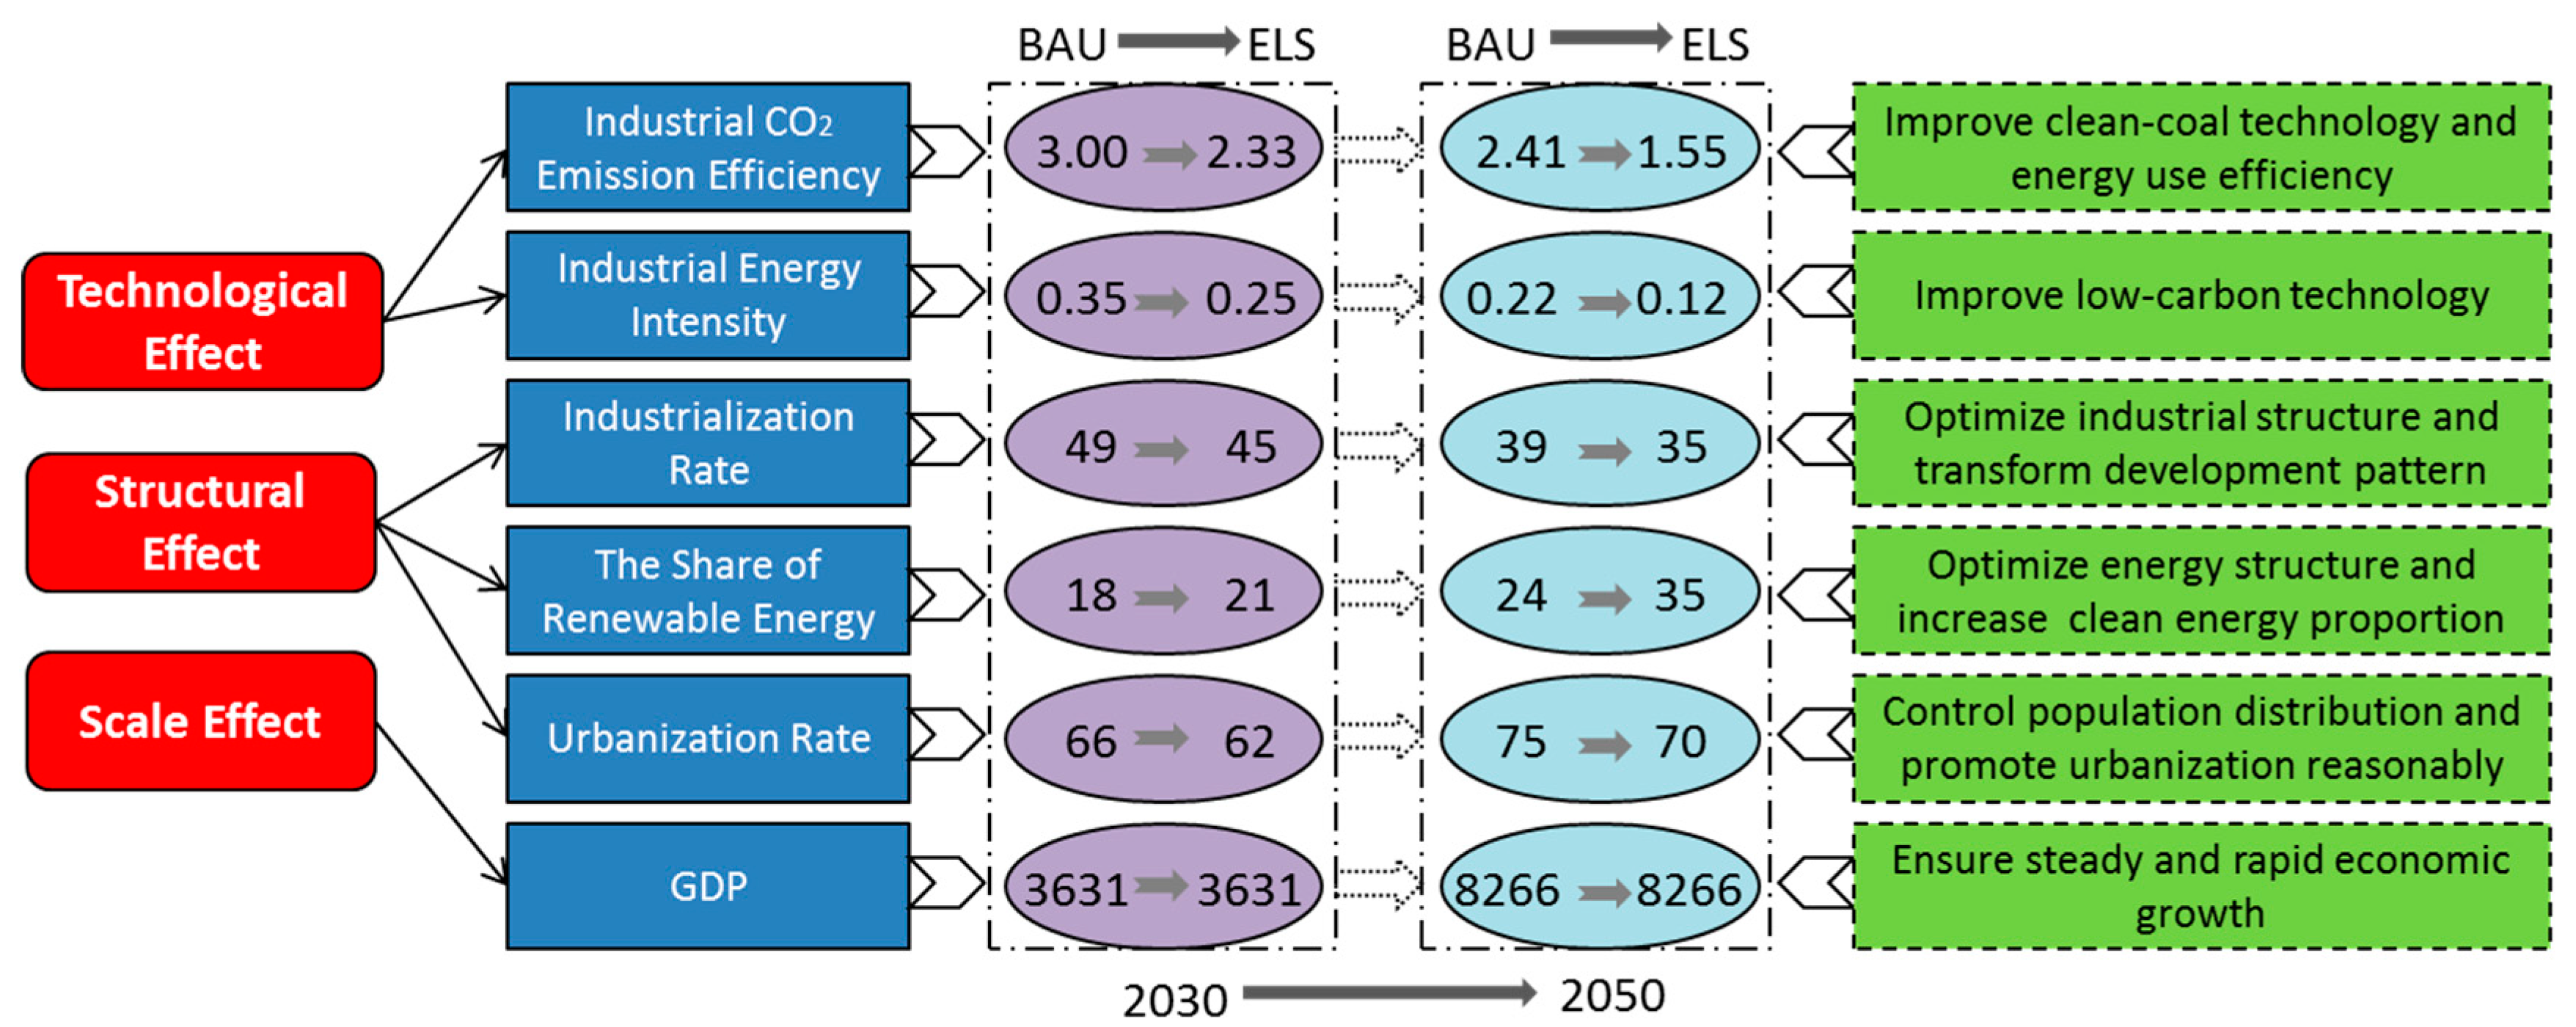
2 emissions peak under the premise of ensuring stable economic and social development. Then, how does transform the BAU with a peak time of 2043 and a corresponding peak value of 229.73 Mt into the ELS with a peak time of 2030 and a corresponding peak value of 160.94 Mt?
Figure 8 shows the relevant emission reduction mechanism from the perspectives of technological effect, structural effect and scale effect.
Specifically, by 2030 and 2050, industrial energy consumption CO
2 emissions efficiency will decrease from BAU’s 3.00 tCO
2/tce and 2.41 tCO
2/tce by 22% and 36%, respectively, to ELS’s 2.33 tCO
2/tce and 1.55 tCO
2/tce. For industrial energy intensity, it will decrease from BAU’s 0.35 tce/ 10
4 Yuan and 0.22 tce/10
4 Yuan by 29% and 45%, respectively, to 0.25 tce/ 10
4 Yuan and 0.12 tce/ 10
4 Yuan of ELS. For the industrialization rate, it will be reduced from BAU’s 49% and 39% by 10% and 11%, respectively, to 45% and 35% of ELS. For the share of renewable energy, it will increase from BAU’s 18% and 24% by 19% and 43%, respectively, to 21% and 35% of ELS. For the urbanization rate, it will decrease from 66% and 75% of BAU by 5% and 7%, respectively, to 62% and 70% of ELS. Considering the importance of economic development, GDP growth will remain basically the same, reaching 3631 billion Yuan and 8266 billion Yuan by 2030 and 2050 respectively. As shown in
Figure 8.
4.5. Policy Implications
Based on the above research results, the following policy implications are proposed:
- (1)
In order to control the CO2 emissions peak value of industrial energy consumption, it’s essential to refer to the development mode of economy, technology, and structure in ELS. The better controllable path are: Firstly, vigorously develop clean-coal and low-carbon technologies to reduce the value of CO2 emissions efficiency of industrial energy consumption; Secondly, adjust the industrial structure on the premise of stabling economic development; Thirdly, other factors such as economic development, urbanization development, industry energy intensity and the share of renewable energy, due to the small degree of impact, can take certain measures, but the effect of the first two controllable paths are relatively obvious.
- (2)
The main paths to realize the peak time of industrial energy consumption CO2 emissions earlier are: firstly, reduce the CO2 emission efficiency of industrial energy consumption, and vigorously develop clean-coal technology and extensively apply low-carbon technologies; secondly, carry out adjustment of industrial structure and control the development of industrialization rate on the premise of stabling economic growth.
5. Conclusions
From the perspective of peak value, we proposed the extended STIRPAT model to analyze the reduction path of industrial energy consumption CO
2 emissions in Jilin Province. Based on the simulation result of BAU, ESS, ELS and LCS, the peak time of industrial energy consumption CO
2 emissions in Jilin Province are 2043, 2035, 2030 and 2026 respectively, and the corresponding peak value are 229.73 Mt, 190.89 Mt, 160.94 Mt, and 147.87 Mt. Among them, ELS reached the peak in 2030, which is basically consistent with the voluntary contribution target proposed by China after the Paris Agreement. Overall, ELS is the optimal scenario to reduce industrial energy consumption CO
2 emissions. The results show that the industrial energy consumption structure, industrial energy intensity and the share of renewable energy are the reducing carbon factors while GDP, industrialization rate and urbanization rate are the increasing carbon factors, which is basically the same with the research conclusion drawn by Liu et al. [
8]. The six influencing factors all have an impact on the peak value of industrial energy consumption CO
2 emissions, but the industrial energy consumption structure and the industrialization rate have a higher influencing degree. In contrast, peak time is only affected by two factors including industrial energy consumption carbon emission efficiency and industrialization rate, and other factors do not impact peak time. The influencing degree of six factors in ELS are: Industrial energy consumption CO
2 emissions efficiency (1.33) > industrialization rate (1.09) > GDP (1.06) > urbanization rate (1.04) > industrial energy intensity (1.03) > the share of renewable energy (1.01). Therefore, the main paths to realize the lower peak value of industrial carbon emissions earlier are to adjust the structure of energy consumption and industry and properly control the growth of industrialization on the premise of stabling economic development. If northeast China expects to peak by 2030, the relevant emission reduction mechanism from the perspectives of technological effect, structural effect and scale effect need to be done, such as the industrial energy consumption CO
2 emissions efficiency need decrease from BAU’s 3.00 tCO
2/tce and 2.41 tCO
2/tce. The economic and social development needs to follow the ELS scenario.
Through scenario setting and path analysis, our study can provide references for achieving CO2 emissions peak from industrial energy consumption in typical transformation regions. However, due to the limitations of the model and the complexity of socio-economic development, the STIRPAT model may not take all influencing factors into account, coupled with the uncertainty of future development, there may be a certain degree of deviation between our prediction results and the actual situation in the future. Meanwhile, we take Jilin province as a typical case, which may lack extensive representativeness, therefore, in the following research, we will further improve the model and take other transformation regions as examples for relevant exploration.


